HyperX Savage SSD Review, Architecture, & Benchmark vs. 850 Pro, Others
Posted on April 29, 2015
Following the comparatively bombastic launch of the HyperX Predator SSD, an M.2 SSD fitted to a PCI-e adapter, Kingston this week launched its “Savage” SATA SSD. The Savage SSD assumes the modern branding efforts fronted by HyperX, which has streamlined its product lineup into a hierarchical Fury, Savage, Beast/Predator suite. These efforts eliminate long-standing names like “Genesis” and “Blu,” replacing them with – although sometimes silly – names that are more cohesive in their branding initiative.
The new Savage SSD sees integration of the Phison PS3110-S10 controller, usurping the long-standing HyperX 3K SSD and its SandForce 2nd Gen controller from Kingston's mid-range hot-seat. HyperX's Savage operates on the aging SATA III interface; this ensures claustrophobic post-overhead transfer limitations that can't be bypassed without a faster interface, largely thanks to information transfer protocols that consume substantial bandwidth. 8b/10b encoding, for example, eats into the SATA III 6Gbps spec to the point of reducing its usable throughput to just 4.8Gbps (~600MB/s). This means that, at some point, the argument of SATA SSD selection based upon speed loses merit. Other aspects – endurance and encryption, for two easy ones – should be held in higher regard when conducting the pre-purchase research process.
When we spoke to LSI's Kent Smith about SSD selection, we published content elaborating on why users should pay closer attention to the internals of their SSDs prior to purchase. An SSD is effectively its own computer – something we dissected in our in-depth SSD Architecture article – and each component can wield drastic leverage over total performance. Controllers are paramount to SSD speed and endurance, employing varying types of data transaction compression, garbage collection, wear-leveling, and overprovisioning allotment for use in their host SSD. NAND is also important, although more volatile in supply, which can cause drive changes post-launch, and can directly influence speed and endurance of the device.
All of this is to say that good SSD reviews are profoundly deeper than the speed charts listed at the end of the review. There's more to the underlying technology that may not surface in charts – we try to define a reasonable, not-overwhelming amount of this information in the written reviews. It is unfortunately impossible to conduct endurance testing while also reviewing an SSD near its launch date, but we can inform our process and speculation based on knowledge of the underlying hardware.
Let's get to it. This HyperX Savage SSD review benchmarks its speed against Samsung's 840, 850 Pro, Kingston's HyperX 3K, and OWC's Mercury SSDs; along the way, we discuss the Phison PS3110-S10 controller, the gradual shift from SandForce, and NAND type.
HyperX Savage SSD Specs & Initial Cost Analysis
| Interface | SATA I/II/III |
| Controller | Phison PS3110-S10 |
| Initial NAND | Toshiba Toggle A19 64Gbit 19nm MLC |
| Capacities | 120GB 240GB 480GB 960GB |
| Advertised Speeds | Random 4k Read/Write (480GB model) Read: 92K 4K IOPS Write: 89K 4K IOPS Incompressible Sequential R/W (480GB) Read: 520MB/s Write: 500MB/s Max Advertised Speed Read: 560MB/s compressible (ATTO) Write: 530MB/s compressible (ATTO) |
| TDP (Power Consumption) | 0.39W Idle 0.5W Avg / 1.4W (MAX) Read 4.35W (MAX) Write |
| Prices | 120GB - $77 240GB - $123 (was $148 at initial time of writing) 480GB - $250 960GB - $550-$600 |
| Availability | Presently available. |
NOTE: At time of initial writing for this review, the price for the 240GB SSD was $148 -- a poor deal -- and the 1TB SSD was listed at $598 at some retailers. Prices changed in the hours before publication, which may impact some of our opinions.
Kingston's new SSD ships in 120, 240, 480, and 960GB capacities. Value is questionable at the book-ends of the price spectrum, a fact underscored by the $598 price-point of the 960GB SSD; for perspective, Samsung's reigning king 850 Pro 1TB SSD sits at a neighboring $566 (note: at time of publication, we found that the HyperX 960GB SSD is now $550 via Newegg). At 240GB, the cost-per-GB value is more competitive with existing SATA frontrunners for gaming use cases. The HyperX Savage hovers at ~$147 for 240GB. Nearby competitors, including fan-favorite Crucial MX100 and Samsung's 850 EVO, both rest closer to $120. Looking toward faster drives, the 850 Pro runs $156 for 256GB and offers one of the most comprehensive featuresets present in a modern consumer SSD. (Note: HyperX Savage is now $122 via retailers, which makes it a significantly better value).
The phrase “in medias res” comes to mind: Kingston just dove headlong into the middle of a highly combative market, and it's tough to make noise in between flanking heavyweights like the MX100 and 850 Pro.
Phison S10 Controller Anatomy
Phison's S10 marketing language will immediately tout its quad-core equipment, but there's more to it than core count. The S10 controller offers a few key features:
- SmartECC
- SmartFlush
- Static & Dynamic Wear-Leveling
- Data Path Protection
- 256-bit AES / OPAL 2.0 compliance
The S10 controller supersedes Phison's S8, which hosted fewer cores than the quad-core successor. The PS3110-S10 allocates three cores to full-time “flush” management, which includes garbage collection and wear-level actions. Wear-leveling is lightly defined in our specifications dictionary; garbage collection has previously been discussed in a feature piece alongside write-amplification factor (WAF). Our SSD Architecture & Anatomy article also overviews these items.
To make things easier on everyone, here's a very rapid and precariously top-level overview of the terminology at play:
What is Wear-Leveling?
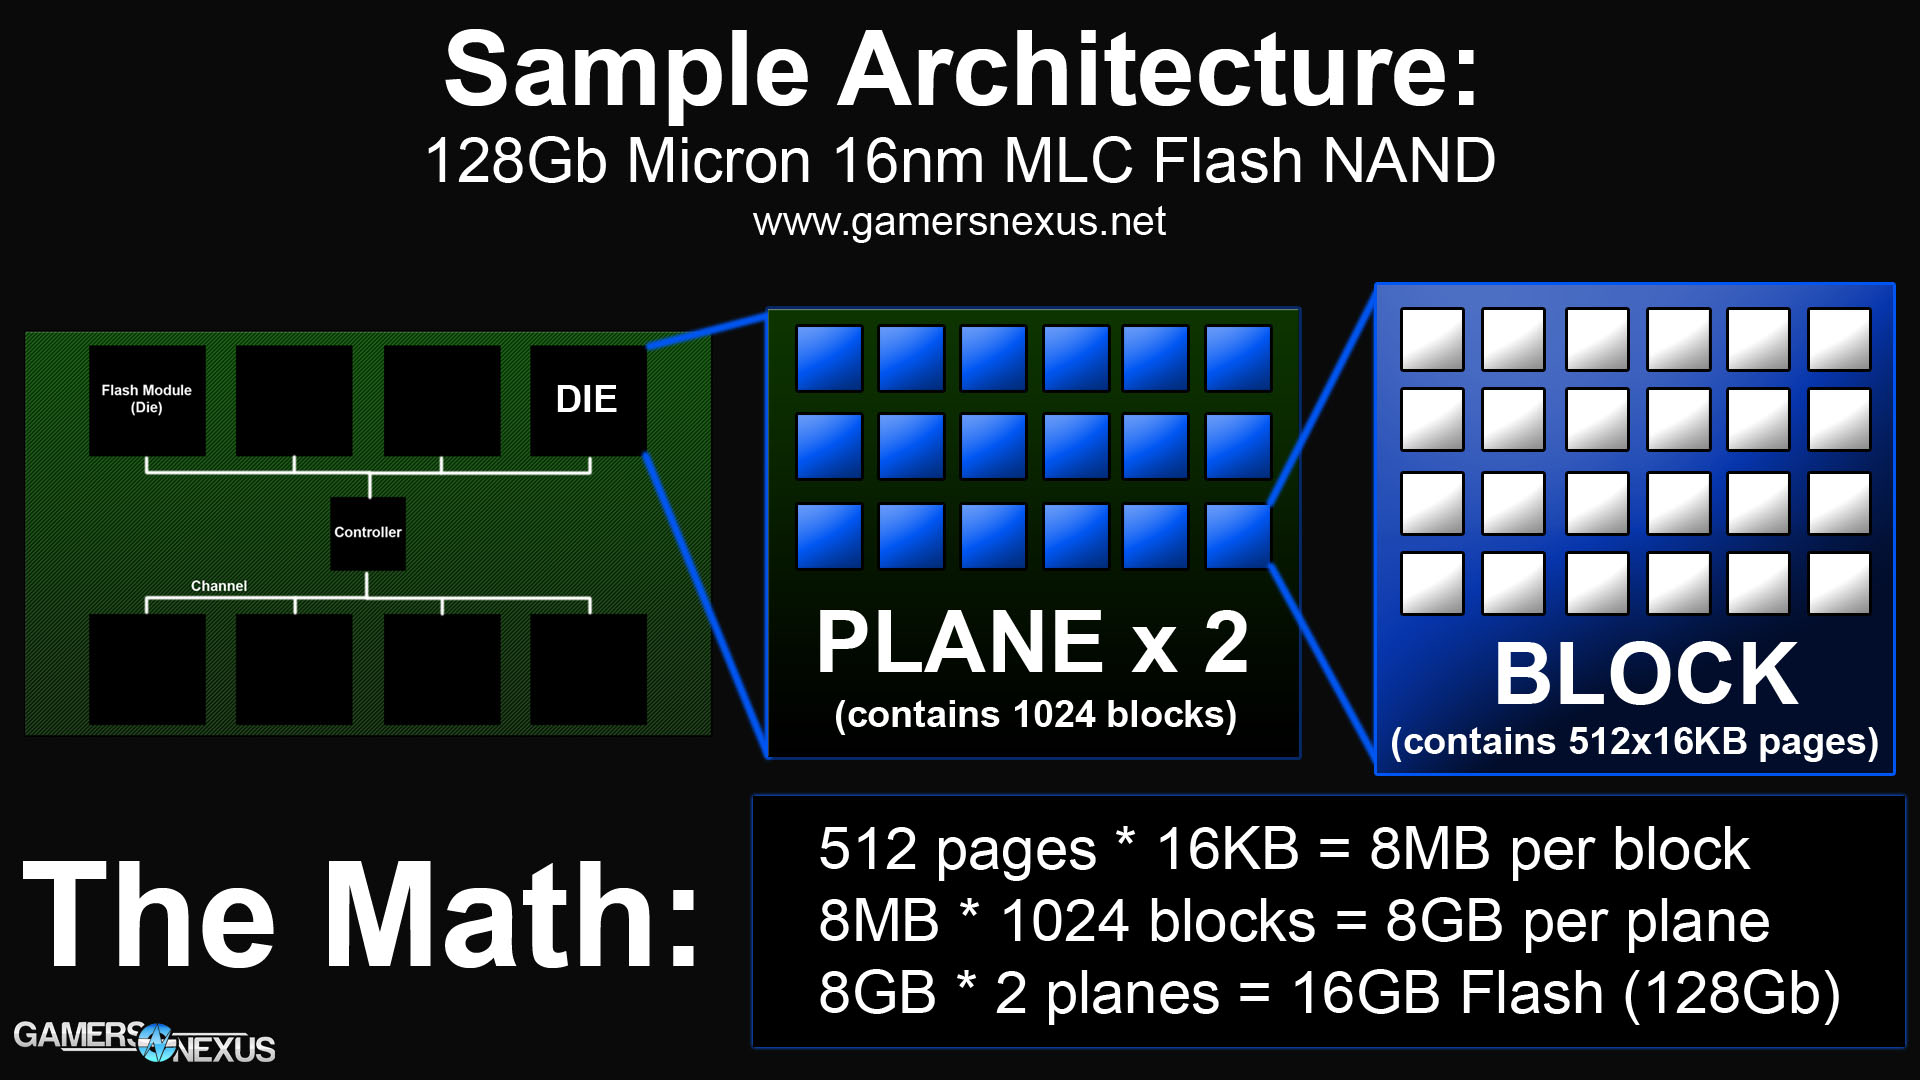
SSDs store their data on Flash NAND cells (see below image), which use voltage states to check and store data to each cell. Different NAND Types dictate how many states are present per cell (SLC, MLC, TLC, etc.). Because the data is stored and accessed electrically and does not require physical headers for transactions, data can sit anywhere on the drive and be accessed with effectively identical speed.
Because Flash ages based upon its use, clever SSDs (all modern SSDs) will actively move data around on the device to ensure equal wear of the NAND. Say that you've got a few Flash modules that offer 3,000 Program/Erase Cycles, but you're only using a few gigabytes of space on your SSD (and you're using that space very actively – lots of deleting and rewriting going on). The minute cells start depleting their P/E allotment – the amount of times they can be written to and erased – the SSD's stability is compromised and it could enter a read-only locked state. There's a lot more at play here – like overprovisioning and the induction of reserve blocks/cells – but we're keeping it simple.
Knowing all of this, wear-leveling, in conjunction with garbage collection and other “flush” tasks, is responsible for moving data around electrically on the disk. This movement ensures that each cell is worn equally, and so no single cell should deplete its P/E allotment significantly faster than any other cell, lengthening Flash lifespan greatly.
What about Garbage Collection?
An SSD's controller will reference a Flash translation layer (a map of usable locations to the OS and their accompanying Flash pages) to “finalize” details on where data will be transacted once a read or write is issued. This is important to the understanding of garbage collection and wear-leveling.
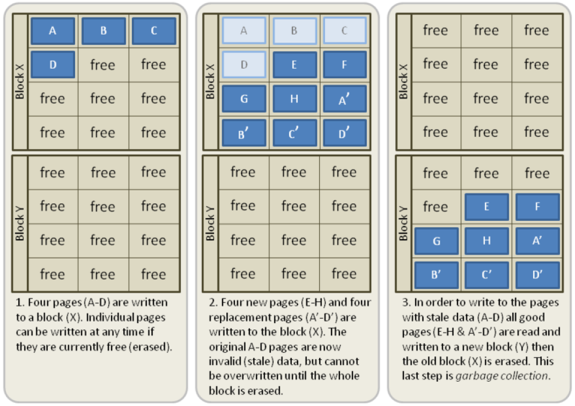
At the very top-level, garbage collection is a background process that – as described above – assists in the shifting of written data around the Flash. When data is moved, garbage collection performs the unique function of checking that location for deprecated, orphaned data, invalid and flags it for an erase once possible, freeing-up the space for use in future wear-leveling tasks. On Flash devices, an erase command – different from simply 'deleting' a file on the desktop – can only be issued to an entire block (see above architecture image) and cannot operate at the smaller page or cell levels. This means that blocks which contain both active and inactive (invalid, orphaned, or deprecated) data cannot pinpoint an invalid page and say “erase that;” instead, the “live” (active) data must be moved to a new block, effectively gentrifying the invalid data into a soon-to-be bulldozed block.
You were saying something about the S10's Cores...
Right. Back to the task at hand: The remaining of the four cores – that'd be one, as the other three are occupied with flush tasks – oversees operations conducted with the host. The S10 controller uses a standard 8-channel layout, meaning it will achieve peak efficiency with all eight channels saturated with Flash modules. We have noticed that Phison's controllers seem to more equally balance read/write I/O over other controllers, like the SandForce units.
Phison's controllers make use of DRAM for caching operations (256MB on-board, operating at 1600MHz CL11) on the SSD. The practice of using DRAM for SSD operation caching has become somewhat standard at this point.
In its present state, the Savage SSD hosts Toshiba A19 MLC TSOP NAND, but that could change as supply lines shift.
Continue to Page 2 for the benchmark charts.
Test Methodology
GamersNexus has performed extensive studies of SSD file and I/O usage in real-world use case scenarios, primarily gaming and video production environments. We have also worked closely with controller manufacturers to educate ourselves on various strengths and weakness of competing controllers, helping to build our SSD test methodology. Our test cases and methodology have been peer-reviewed by Kingston, Samsung, LSI / SandForce, and other experts in the industry.
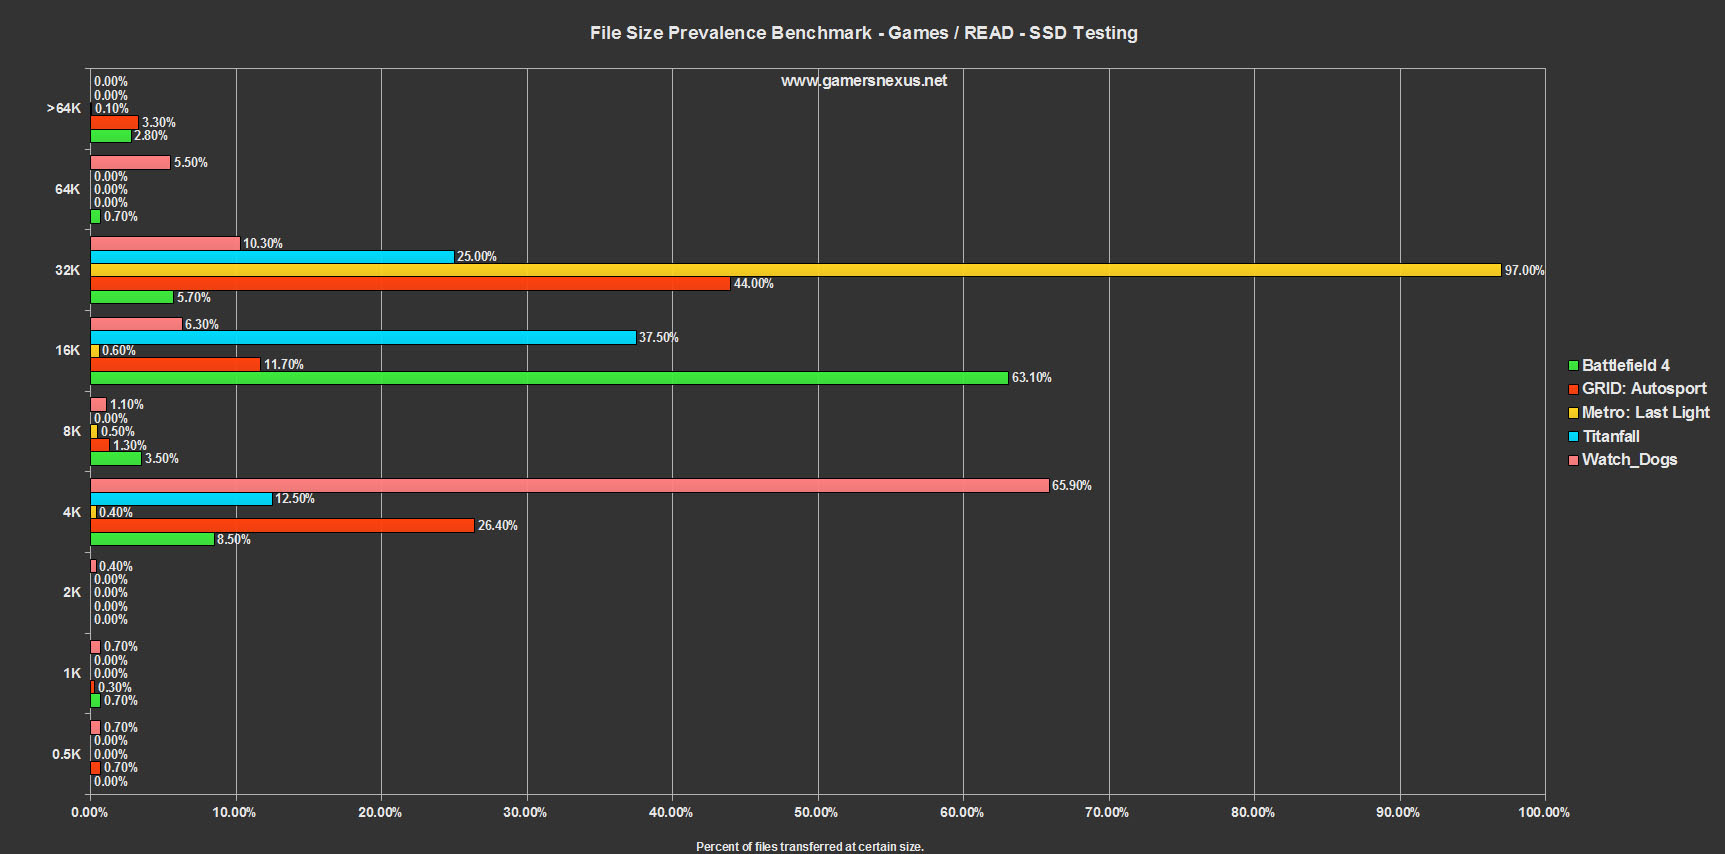
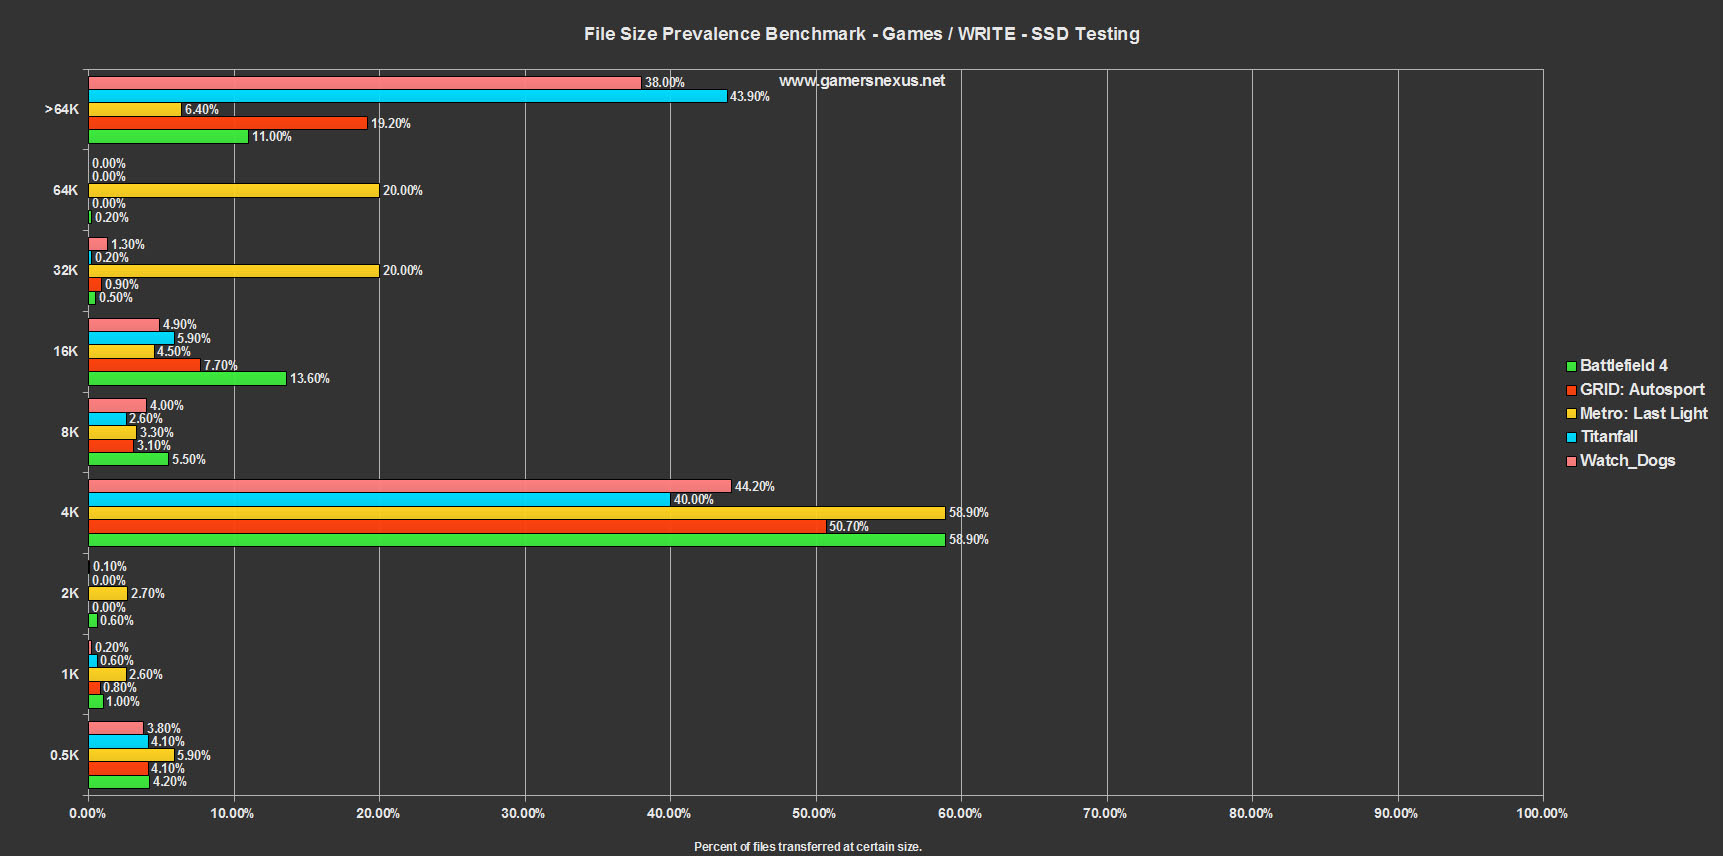
One of our published studies analyzed the number of I/O requests made when playing various games, from which we've reproduced some of the charts below:
| Statistics | 0.5K | 1K | 2K | 4K | 8K | 16K | 32K | 64K | <=64K | Total Transfer |
| BF4 Read | 0 | 0 | 0 | 12 | 5 | 89 | 8 | 1 | 137 | 3.2MB |
| BF4 Write | 26 | 6 | 4 | 357 | 34 | 84 | 3 | 1 | 543 | 67.3MB |
| GRID: Autosport Read | 2 | 1 | 0 | 81 | 4 | 36 | 135 | 0 | 296 | 7.2MB |
| GRID: Autosport Write | 56 | 11 | 0 | 685 | 42 | 104 | 11 | 0 | 1090 | 66.4MB |
| Metro: LL Read | 0 | 0 | 0 | 42 | 47 | 58 | 10003 | 1 | 10294 | 320MB |
| Metro: LL Write | 72 | 31 | 33 | 709 | 40 | 50 | 1 | 1 | 1112 | 77.8MB |
| Titanfall Read | 0 | 0 | 0 | 1 | 0 | 3 | 2 | 0 | 8 | 156KB |
| Titanfall Write | 26 | 4 | 0 | 251 | 16 | 37 | 1 | 0 | 352 | 274MB |
| Watch_Dogs Read | 5 | 5 | 3 | 478 | 8 | 46 | 75 | 40 | 725 | 9.2MB |
| Watch_Dogs Write | 34 | 2 | 1 | 395 | 36 | 44 | 12 | 0 | 555 | 156MB |
This analysis helped understand that, while 4K random performance is still significant, games have also begun making numerous 16KB read/write and 32KB read I/O requests during loading and gameplay. Further analysis revealed that many games do not exceed a queue depth of two, with most 4KB random transactions still resting at QD1. This is reflected in our ensuing tests.
We conduct tests using these software utilities:
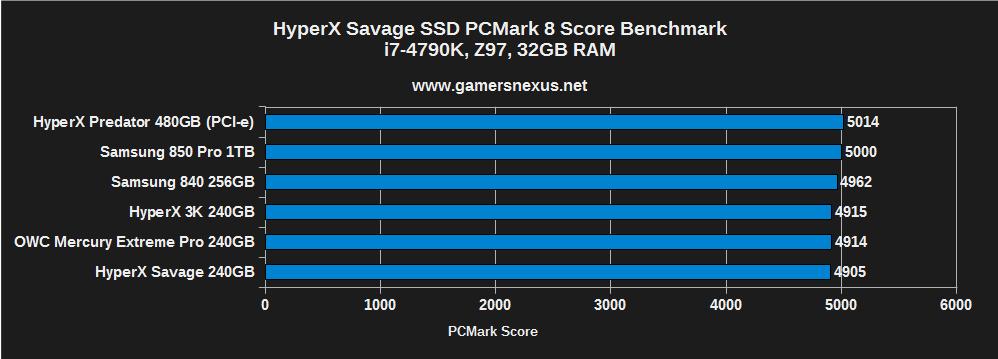
- PCMark 8 real-world trace testing of Adobe, gaming, and Office software.
- AS-SSD & AS-SSD copy simulation.
- ATTO (often left unpublished and used strictly for validation).
- Anvil's Storage Bench.
- IOmeter for preconditioning.
- HD Tune Pro for I/O analysis and drive consistency.
- CrystalDiskInfo for component validation.
All devices host a local copy of Windows 8.1. This is critical to our benchmarks, which will report lower measurements than tests which are conducted from a separate host SSD. All of our tests are conducted locally on the DUT (device under test) from an imaged, clean install of Windows 8.1 that strictly hosts the SSD test utilities and device drivers. We have observed what we deem unrealistic performance gains when testing SSDs from an independent host; installing a separate OS on each device ensures a better representation of a real use case, as we benchmark on the assumption that the majority of our users will deploy their SSD as the host drive.
All storage drivers are independently validated prior to benchmarking.
Every SSD is secure erased prior to test initialization. This ensures that the device is representative of its factory-clean state. The image is then deployed to the device, at which point we issue a custom IOmeter protocol to precondition the drive pursuant to its capacity (0.50min * capacity = precondition duration). Preconditioning metrics are noted at the start and end of each test for validation purposes, often reflecting a marginal decline in performance and eventual stabilization toward the end of the test. Preconditioning the device produces the most realistic user scenario as SSDs will overperform when fresh out-of-box, and are volatile in performance at the very beginning of life such that test results would otherwise be invalidated.
Additional steps are taken to ensure stability and validation of results. Some in-house utilities are deployed. Further test procedures are kept in-house for competitive reasons.
All tests are conducted multiple times for parity. Results are averaged. Peak speeds are discarded as outliers.
Anvil tests are modified to 67% compression for more representative benchmarking.
Some test execution is automated with batch files or in-house scripting, then logged using automated processes. This ensures data consistency and rapid test execution, permitting a higher sample of test runs for parity.
| GN Test Bench 2015 | Name | Courtesy Of | Cost |
| Video Card | NVIDIA | $1000 | |
| CPU | Intel i7-4790K CPU | CyberPower | $340 |
| Memory | 32GB 2133MHz HyperX Savage RAM | Kingston Tech. | $300 |
| Motherboard | Gigabyte Z97X Gaming G1 | GamersNexus | $285 |
| Power Supply | NZXT 1200W HALE90 V2 | NZXT | $300 |
| SSD | HyperX Savage SSD | Kingston Tech. | $122 |
| Case | Top Deck Tech Station | GamersNexus | $250 |
| CPU Cooler | Be Quiet! Dark Rock 3 | Be Quiet! | ~$60 |
PCMark 8 – Adobe Photoshop Workload Benchmarks
Using PCMark 8's trace-based benchmarking, we're able to realistically simulate real-world performance of Adobe software in a replicable fashion. The traces executed include I/Os with known start/end I/O timing, starting LBA, and length of the I/O in bytes. Idle time compression has been removed from PCMark 8, ensuring more accurate representation of the real application.
Storage traces for the below Photoshop tests were played back with the following attributes:
| Photoshop Light | up to 4096 | up to 64K | up to 128K | Total | 4K Aligned % |
| Sequential reads | 479 | 680 | 349 | 1508 | 68.83% |
| Random reads | 8215 | 9249 | 61 | 17525 | 68.25% |
| Sequential writes | 223 | 861 | 17258 | 18342 | 99.91% |
| Random writes | 214 | 246 | 1283 | 1743 | 99.20% |
| Photoshop Heavy | up to 4096 | up to 64K | up to 128K | Total | 4K Aligned % |
| Sequential reads | 706 | 3288 | 283 | 4277 | 88.05% |
| Random reads | 8980 | 9623 | 52 | 18655 | 68.94% |
| Sequential writes | 250 | 904 | 43588 | 44742 | 100% |
| Random writes | 440 | 208 | 1417 | 2065 | 98.64% |
As indicated, 4K random transactions are still among the most critical in everyday IO. Here's our benchmark after executing the above traces:
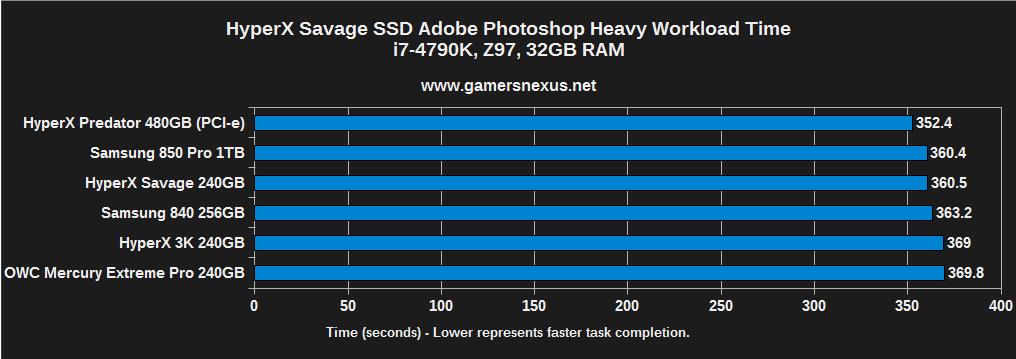
Although it doesn't look like much, the 17-second disparity on the Heavy workload chart – from top to bottom – can produce noticeable efficiency gains for professional Photoshop users. That said, things become much less noticeable at the top; the 8-second difference between even Samsung's professional-class 850 and Kingston's PCI-e SSD, for instance, would be noticeable only in cases where Photoshop is seeing near-constant use and batch processing. But we're not here to talk about the PCI-e SSD – we already did that.
The Savage SSD performs impressively well with Photoshop tasks. It's pushing nearly the same workload time as the 850 Pro, an SSD slated for prosumer use, and costs just slightly less at the low-end (though Samsung's 850 Pro is cheaper at the 1TB level).
HyperX Savage File Transfer Speeds
Depending on how you sort the data – we did it by Game Copy speed – the HyperX Savage SSD performs mid-pack for copy transactions.
AS-SSD benchmarks use incompressible data, which is data that has been compressed to such a point that it cannot further be compressed by controller technology, like SandForce's DuraWrite. Real-world, heavily-compressed data would include movies, music, and picture files. We use AS-SSD for this simulation to provide accurate results measurement while providing a comparable test to what would occur in a real-world, incompressible movie or music copy transaction.
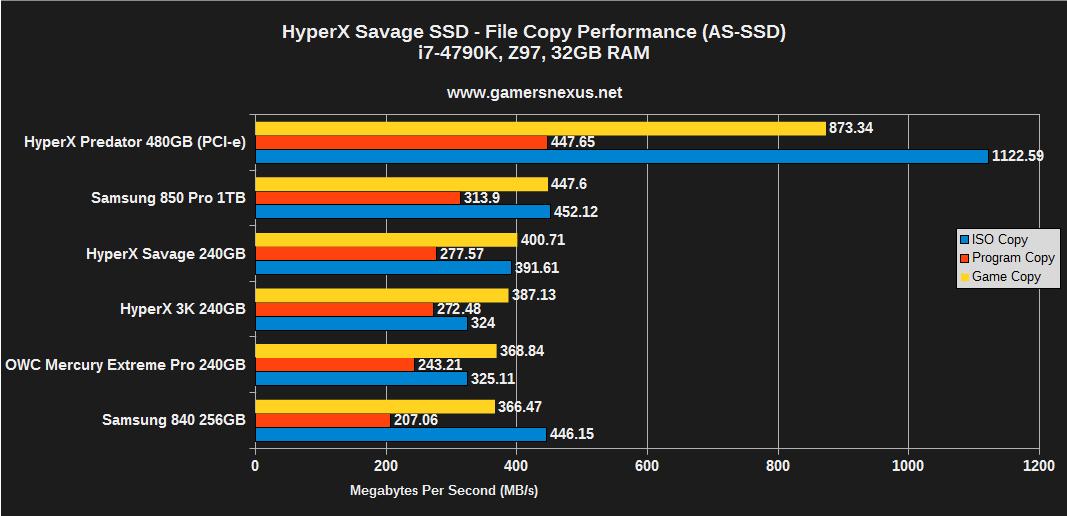
The HyperX Savage only barely outpaces its predecessor, the 3K SSD, and falls behind Samsung's 850 Pro in AS-SSD tests. The 840 SSD (non-EVO) also outranks the HyperX Savage in ISO copy, but performs slower in other copies.
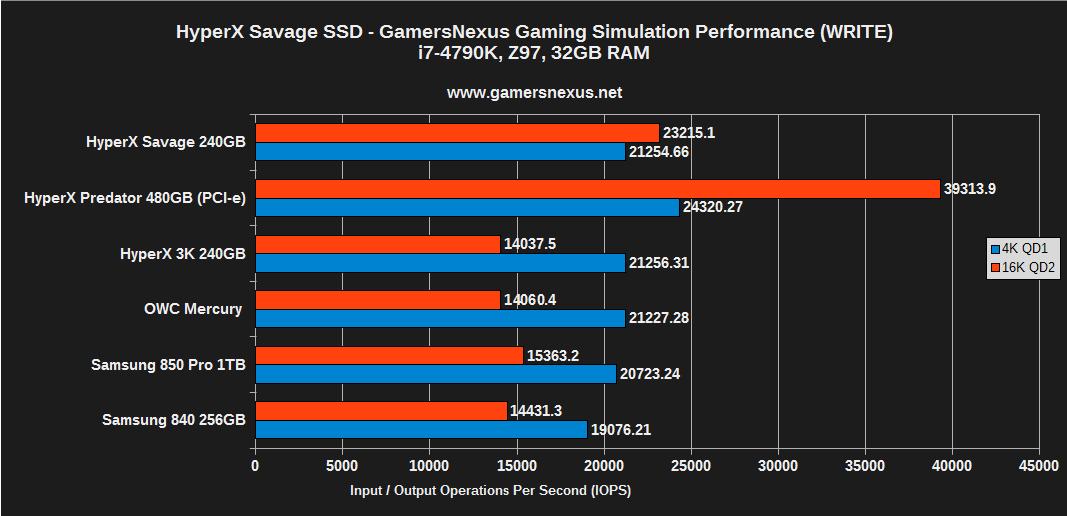
GN's Gaming Simulation
This test is conducted using custom-tuned Anvil Storage Bench settings. We change all Anvil tests to use 67% compression, then run 16KB QD2 reads alongside 32KB QD2 reads, and 4KB QD1 reads. Write testing relies upon 4K QD1 and 16KB QD2 benchmarks. The reasoning for these metrics is demonstrated in our above charts under the test methodology section. For further understanding on why these numbers are the most representative of real games, please view our research article.
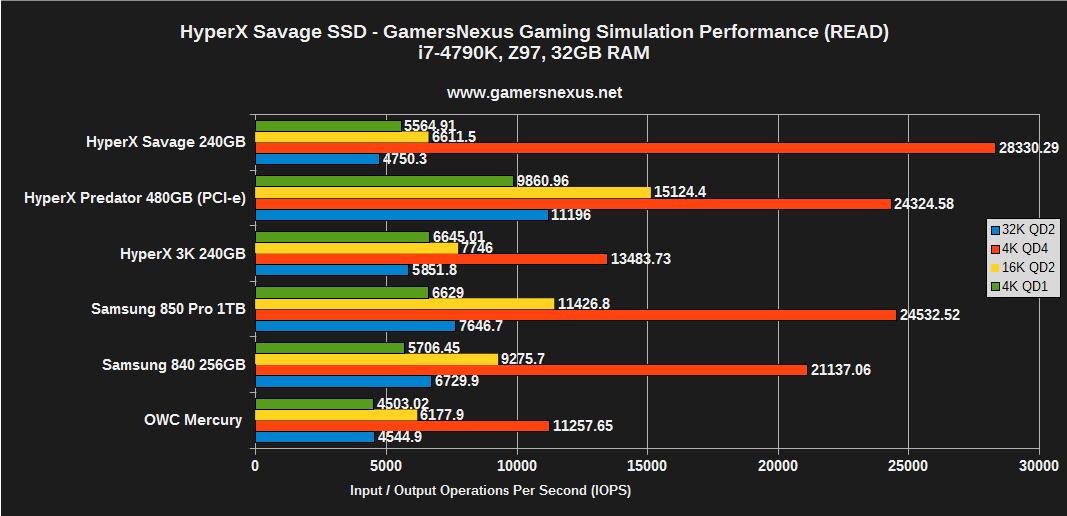
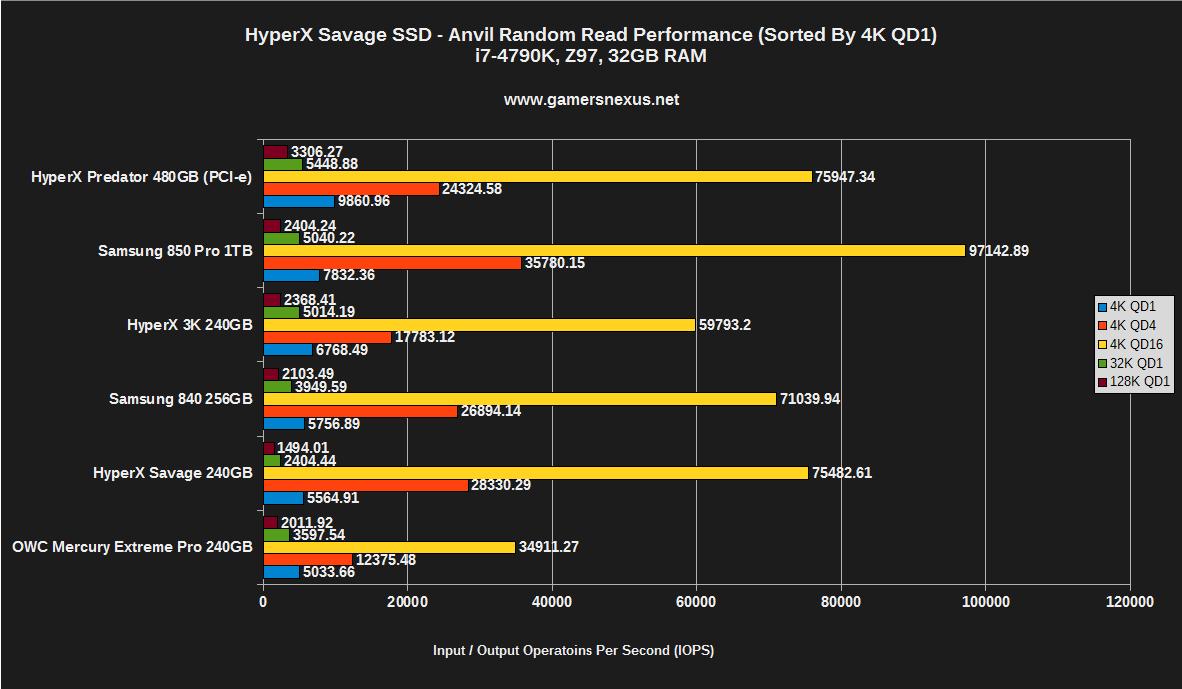
The Savage SSD is a fierce competitor when it comes to 4K QD4 IOPS, smothering the competition and propelling past the 850 Pro. The Savage loses ground in 4K QD1 and 16K QD2 transactions, both of which we've found to be relatively prevalent in gaming. We were left a bit confused as to why the 4K QD4 results were so staggeringly high compared to the 850 Pro and Predator SSD, ultimately retesting the drive beyond our usual 3-test parity check. Even with additional testing, results were found to be consistent. We chalk this up to controller performance. After all this, we can confidently say that we're impressed by the Savage's 4K QD4 speeds.
The Savage SSD again outranks its competitors in 4K QD4 read performance – bearing importance to gaming – but falls behind in other important IO lengths, like 16K QD2 read (yellow) and 4K QD1 read.
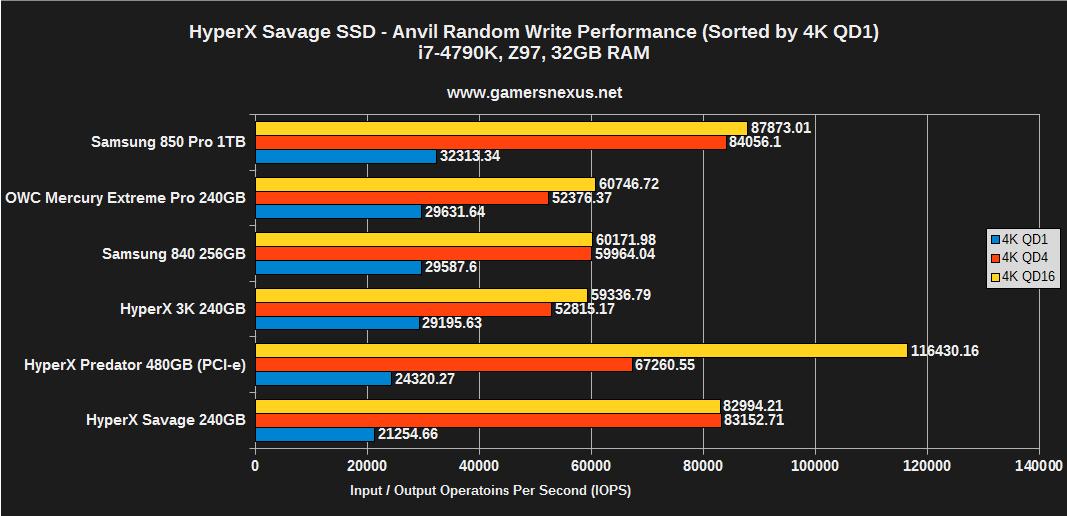
As for write performance, the Savage SSD has the most consistent 4K QD1 and 16K QD2 performance, with all other drives on the bench showing a trade-off of 16K QD2 and 4K speeds.
Additional Raw Performance Data from Anvil Storage Bench
These charts are purely for advanced users who want to know explicit IO size transfer rates:
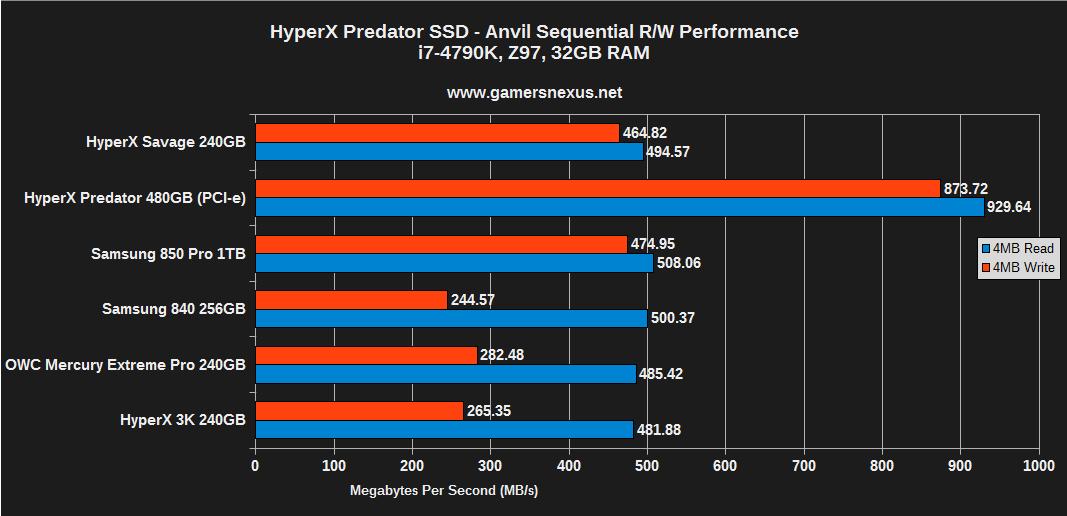
Sequential performance on the Savage SSD is highly consistent in both reads and writes, something that Kingston hasn't offered in the past. More importantly, the Savage outmatches its preceding HyperX 3K SSD and the other SandForce drive on the charts, the OWC Mercury Extreme Pro. The Savage SSD is nearly on-par with the Samsung 850 Pro and far-and-away outranks the 840 in sequential write performance.
Conclusion: Positioned Fiercely in a Competitive, Saturated Market
The HyperX Savage SSD ($122) is a tough review. The drive excels in a few critical aspects and, for the first time in Kingston's consumer SSD history, manages to offer fairly level read and write performance across most IO types. Level performance isn't inherently valuable to the average user given the prevalence of read operations, but for power users who mix IO lengths and types more regularly, it's a value-add over something like, for instance, the Samsung 840. 4K QD4 performance reaches unprecedented levels on our bench, certainly a noteworthy takeaway.
Kingston's shift to a Phison controller helps in this respect. Samsung uses its own, in-house controller; the OWC and HyperX 3K SSDs on the bench both use SandForce Gen-2 controllers (2281), which are decrepit at this point; the Predator, another new HyperX SSD, employs a Marvell controller. We're believers that Kingston's use of Phison over SandForce was the correct decision, though this doesn't rule-out a SandForce product if Gen-3 is ever shipped.
With the moderately high SATA performance and move to a more modern controller, I'd be apt to recommend the Savage SSD as a fast, seemingly reliable drive. At the time of launch, the Savage had one strong argument against its purchase: Price. The Samsung 850 Pro was just a better buy at the 1TB level, coming in $32 cheaper, and stands competitively at the 240-256GB range at $156 over the initial launch $147 for the Savage. That's a tough sell. Fortunately for Kingston, and delaying our own efforts, the Savage SSD saw a substantial price drop across major retailers between the writing and publication of this review. The 240GB SSD is now available for $122, placing it in direct competition of the Crucial MX100 and 850 EVO -- our two alternative recommendations -- and the 960GB option is now priced at $550 via Newegg. This price-drop alone makes the device cheaper than the 1TB 850 Pro, which previously -- before the price change -- stood as our sole recommendation at the 1TB range. We'd still strongly recommend the 850 Pro toward the 1TB capacity spectrum, but the Savage is now a more viable competitor.
If the high-end security and production features of the 850 Pro are deemed unnecessary for use, then the 240GB Savage can be argued for over the Samsung 850 Pro, saving a few bucks in gaming rigs. In this instance, the Savage faces different competition: Without need for such a prosumer 850 Pro feature set, consumers seeking gaming-level and mainstream performance might consider the Crucial MX100, 850 EVO, ADATA options, or similar for just $120. Perception of speed on SATA-bound SSDs is difficult at the high level we're discussing, so warranties, endurance, and controller prowess come into play. Given the retailer price reduction to $122 for 240GB, we can confidently recommend the Savage SSD as a high-performance, competitive, value-driven consumer SSD.
That said, the alternatives are still good -- and that's not going to change. There is a "quality ceiling" for perceived speed when it comes to SATA SSDs.
Were I a buyer, I'd be looking at the Savage SSD as my primary ~$120 choice, followed by the 850 Pro as an immediate upgrade path for ~$40 more.
The reality of SSDs is rather quelling, if complex. No matter what looks the fastest on these charts – even accounting for the PCI-e SSD – the fact is that very few users will “feel” the speed gains. Whether it's a 400MB/s jump to 550MB/s or a small 20MB/s gain, once the move is made from magnetic media, very few applications can noticeably present differentiation between SSDs. Grand Theft Auto V is the sole game that we've noticed a large, useful, measurable gain in performance from SSD use; the game takes more than a minute to load on one 5400RPM HDD we tested, but loads in 29 seconds with a PCI-e SSD. Outside of this use case, differences are best realized in professional applications like Photoshop, as above, but even that is relegated to detection only by professional users who perform batch filtration all day.
What I'm saying is this: As long as the controller offers strong garbage collection and wear-leveling features (which all the listed SSDs in this review do), the NAND is durable, and the SSD is reasonably fast, it's going to be acceptable for the vast majority of users and nearly all gaming-exclusive users. If you're looking at the Samsung 850 Pro, HyperX Savage, and the Crucial MX100 or MX200, there's really not a wrong choice sans professional business operations. Looking to the PCI-e SSDs, like the HyperX Predator, we see gains primarily in copy transactions (very measurable gains – users doing mass media transfers regularly will want a PCI-e SSD); outside of this, we're just being bottlenecked in too many other software stack locations to care about an SSD that pushes 10% more IOPS than a competitor.
That's not to say speed doesn't matter, it's just not the only metric.
 All this stated, the Savage is the strongest SSD offering at $120 for 240GB that we've yet tested without reaching into the prosumer market. For that, we award it with our Editor's Choice award.
- Steve “Lelldorianx” Burke.