Just Cause 3 Video Card Benchmark - Anomalous Performance, but Overall Reasonable
Posted on
Rico's back in town. This time, the vigilante who saves the people by blowing up The People's Water Tower comes in high-fidelity graphics with a focus on lighting FX and water tech. Just Cause 3 revisits a partnership with nVidia's GameWorks development kit, making use of the WaveWorks tech that was previously found in Just Cause 2 (a 2010 release). The game's graphics settings are fairly simple for anyone following our game benchmarks, but we'll recap potential points of confusion further down.
Our Just Cause 3 GPU benchmark puts nVidia & AMD graphics cards to the test at 1080, 1440, and 4K resolutions, using “Very High” and “High” settings for FPS testing. Among others, the video card benchmark includes the 980 Ti (+ SLI), 980, 970, 960, et al., and AMD's 390X, 380X (+ CrossFire), 290X, 270X, et al.
We've noticed some curiosities with Just Cause 3's implementation of water detail scaling and will cover that further down.
Just Cause 3 Max Graphics Settings (“Very High”) at 1080p, 60FPS
Just Cause 3 Settings Explained
Here's a screenshot of Just Cause 3 at max graphics settings:
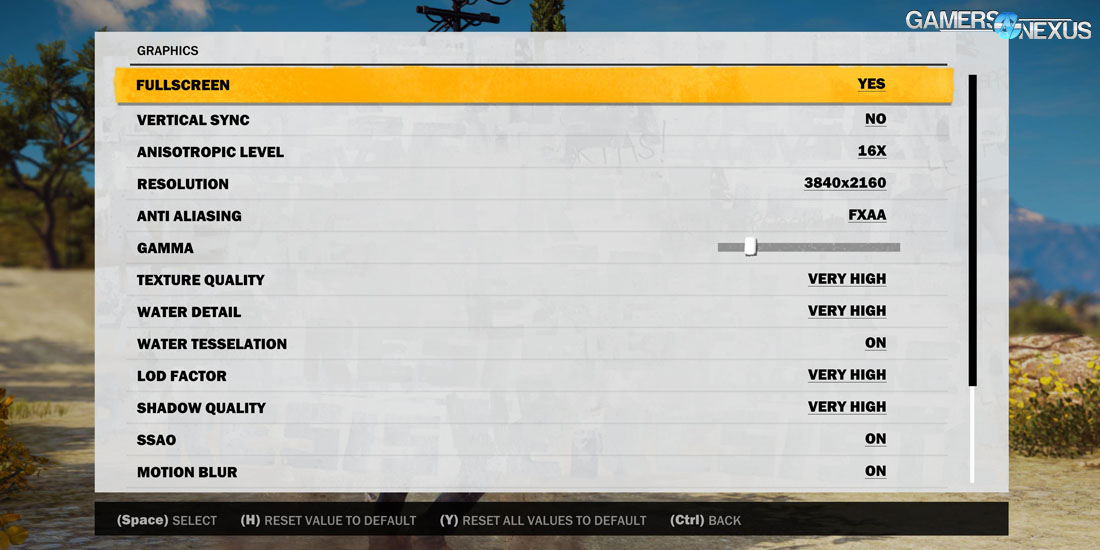
Vertical Sync: Best known as “V-Sync.” This synchronizes the framerate to the display's vertical refresh rate, capping the FPS to 60, 120, or 144, depending on the monitor. V-Sync is generally recommended off.
Anisotropic Level: Anisotropic Filtering (found in our game dictionary) is a texture filtration process that aids in texture application to surfaces at non-oblique angles. The common example is to take a road with a dotted white line down the center, extending off to a vanishing point. As the road's dotted line texture distances itself from the camera, the texture can become blurry toward the vanishing point as a result of the texture's application to the surface. Anisotropic filtering mostly eliminates this and is generally known to have near-0 performance impact.
Anti-Aliasing: Off, FXAA, SMAA, SMAA_T2X
Texture Quality: Texture resolution is governed by this setting, which scales from Low to Very High. Higher texture resolutions will increase VRAM consumption and GPU load, but produces an appearance of greater depth and grittiness on object surfaces.
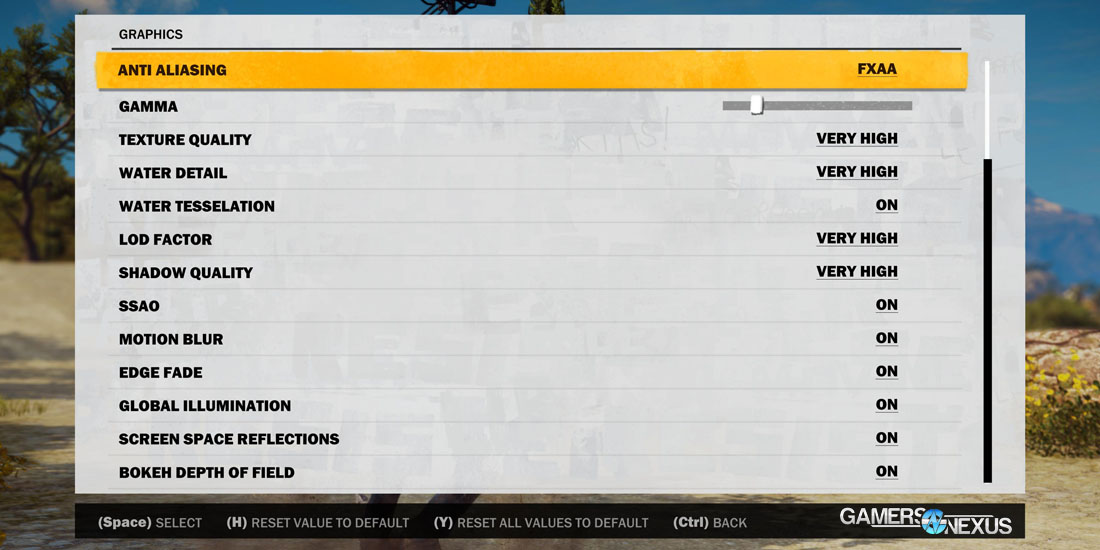
Water Detail: Just Cause uses WaveWorks, an nVidia GameWorks development tool that increases realism of physical water effects. Water Detail ties directly into this, but doesn't necessarily have profound impact on FPS during normal play (there is a constant, small hit that we've found – about 4.2% – but nothing big until you're close to or interacting with the water).
Water Tessellation: Tessellation is the division of triangles into more triangles, a graphics technique that adds “bumps” and “valleys” to textures or surfaces. Tessellation increases apparent depth by driving triangle count up, thus increasing detail of the relevant surface, and can be used to make waves or ripples seem more like a fluid.
LOD Factor: “LOD” is an initialism for Level of Detail. The LOD factor scales overall object quality and pop-in of objects as the camera distance changes. Lower LOD quality will scale-back mesh complexity, texture resolutions at greater distances, and other detail settings as a means to increase FPS. This setting is powerful in open world games like Just Cause 3, given the relatively long viewing distances within the game.
Shadow Quality: Impacts the border of shadows, smoothness of shadows, and dynamic responsiveness of shadows to movement. Shadow Quality is best seen by looking at Rico's own shadow, which will get slightly blockier and less smooth in its movement as quality decreases. Other game shadows will be minimized as settings decrease. Some games – we're not sure if this happens in Just Cause 3 yet, as it's still very new – will also remove dynamic object shadows (like those of a grenade or falling tree) as settings are scaled down.
SSAO: Soft Shadow Ambient Occlusion is a vendor-neutral implementation of AO. Ambient Occlusion is most obvious when observing plant life or other foliage. Toggling SSAO to 'off' will remove undershadow from foliage and reduce shading and apparent depth on clothes and points of contact between multiple surfaces.
Motion Blur: Toggles on or off. Adds blur to camera movement and vehicle/object movement at speeds. Recommended to disable if experiencing issues with object clarity when moving at higher speeds. Motion Blur feels exponentially more blurry at lower framerates and should be disabled with low-end cards, to help improve overall clarity and apparent fluidity of movement.
Edge Fade: Adds a photography-style vignette filter to the camera. This is purely for user preference and has no real-world impact on FPS.
Global Illumination: World lighting is governed by Global Illumination, a setting that toggles to draw light through multiple bounces or surface interactions. Toggling global illumination off will reduce or eliminate “second-hand” lighting.
Screen Space Reflections: Screen Space Reflections are ubiquitous within Just Cause 3, most commonly encountered with metallic or reflective surfaces and water. Toggling SSR will remove object, people, and dynamic event (read: explosions, falling towers) reflections from wet, metallic, and reflective surfaces.
Bokeh Depth of Field: Adds a 'bokeh' effect to the camera, as found in real-world photography. Blurs objects which are out of focus to create a crisper in-focus image.
Test Methodology
We tested using our updated 2015 Multi-GPU test bench, detailed in the table below. Our thanks to supporting hardware vendors for supplying some of the test components.
The latest AMD Catalyst drivers (15.11.1 with Radeon Software hotfix) were used for testing. We are unaware of Just Cause 3 optimization within AMD's drivers at this time. NVidia's 359.06 game-ready drivers were used for testing, which contain Just Cause 3 optimizations. Game settings were configured to "Very High" and "High," following findings that most cards played “Very High” fairly well. We used 1080p, 1440p, and 4K resolutions. 4K and 1080 included additional testing at their respective resolutions with all options set to “high” (rather than “Very High”), and with four of the screen FX options toggled:
- SSAO
- Global Illumination
- Motion Blur
- Screen Space Reflections
These settings were configured to 'off' for any tests that we call “high” settings.
Each scenario was tested for 30 seconds identically, then repeated three times for parity.
Our bench course is conducted right after all the initial, obligatory missions are completed. Once we were released to the open world without mandatory introductory missions, we took a benchmark course through a field heavily populated with grass. The course was conducted in a straight line from the front-left corner of the red, torn-down car, and up the hill. Our video above shows this course in action.
This course was chosen after an hour of exploring various corners of the area near the game's start. We tried cities, combat, explosions, and fields, and found that fields produced the most consistent, heavy FPS impact. Because it is not realistic to run benchmarks for all cards in multiple locations, we decided to run the worst-case scenario to best represent GPUs when under load. For perspective, it was our discovery that areas with numerous explosive objects were often less geometrically complex and carried a higher average FPS overall, but lost 22-30% of total average FPS performance when explosions and combat got heavy. This brought the average FPS closer to what we experienced in the field, which is far easier to reproduce and creates more reliable metrics in testing.
FPS, in general, will be higher for each of these cards than what we show here; when flying around, driving, or just exploring, FPS will only tank this low when in combat or traveling through foliage-populated fields. This is a worst case scenario to best stress the cards and show simulated combat and GPU-loaded performance.
| GN Test Bench 2015 | Name | Courtesy Of | Cost |
| Video Card | This is what we're testing! | - | - |
| CPU | Intel i7-5930K CPU | iBUYPOWER | $580 |
| Memory | Kingston 16GB DDR4 Predator | Kingston Tech. | $245 |
| Motherboard | EVGA X99 Classified | GamersNexus | $365 |
| Power Supply | NZXT 1200W HALE90 V2 | NZXT | $300 |
| SSD | HyperX Savage SSD | Kingston Tech. | $130 |
| Case | Top Deck Tech Station | GamersNexus | $250 |
| CPU Cooler | NZXT Kraken X41 CLC | NZXT | $110 |
Average FPS, 1% low, and 0.1% low times are measured. We do not measure maximum or minimum FPS results as we consider these numbers to be pure outliers. Instead, we take an average of the lowest 1% of results (1% low) to show real-world, noticeable dips; we then take an average of the lowest 0.1% of results for severe spikes.
Video Cards Tested
- MSI R9 390X Gaming 8GB ($430)
- Sapphire R9 380X 4GB ($230)
- PowerColor R9 380X 4GB for CF ($230)
- PowerColor R9 290X 4GB (Deprecated)
- XFX R9 285 2GB ($206)
- AMD R9 270X 2GB Reference (Deprecated)
- ASUS R7 250X 1GB
- NVidia GTX 980 Ti 6GB Reference (& SLI) ($660)
- MSI GTX 980 4GB Gaming ($515)
- EVGA GTX 970 SSC 4GB ($330)
- EVGA GTX 960 SSC 4GB ($225)
- ASUS GTX 960 Strix 2GB ($200)
- ASUS GTX 950 Strix 2GB ($170)
- EVGA GTX 750 Ti 2GB ($125)
Just Cause 3 Benchmark at 4K High – 980 Ti vs. 980, 390X, 380X, etc.
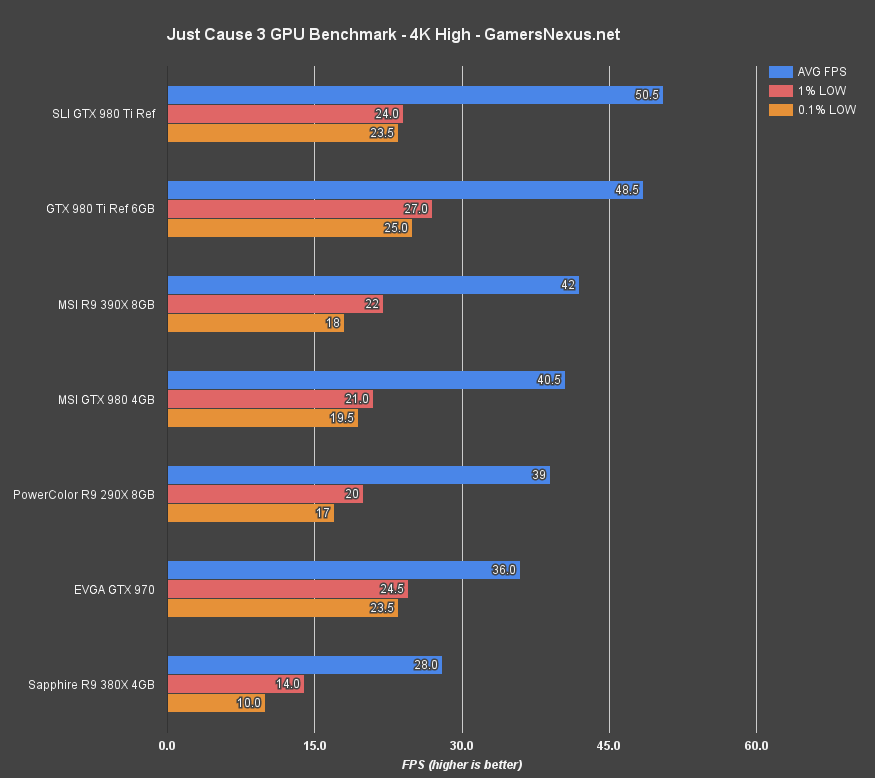
Unlike competitive shooters, Just Cause 3 doesn't demand for constantly high FPS. We found the game to be “playable” at ~50FPS, though negative impact to fluidity is introduced as FPS falls below this marker. The GTX 980 Ti runs Just Cause 3 at just under 50FPS average when at 4K/high (all high settings with SSAO, Global Illumination, Screen Space Reflections, and Motion Blur disabled). The 1% and 0.1% lows are dismal, running under 30FPS. This is unpleasant in spiky periods, but because of our worst-case benchmark design, the game is generally fairly fluid when playing in areas less demanding on the GPU – like cities or when grappling through the air.
There is effectively no SLI scaling revealed in our testing. A single GTX 980 Ti is about as good as two of them, in this case.
The GTX 980 runs at 40.5FPS average, with the 390X hitting 42FPS average. Neither of these cards produces a framerate we find comfortable for play; settings or resolution reductions are required for better playability.
Just Cause 3 Benchmark at 1440p VHigh – 980 Ti vs. 970, 390X, 380X, etc.
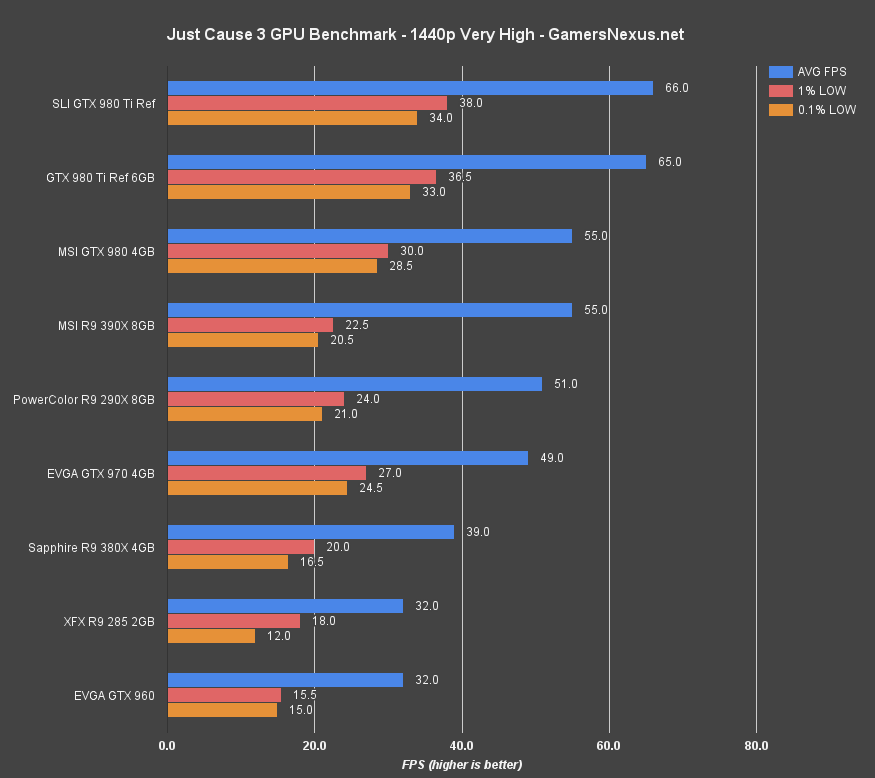
The GTX 980 Ti runs Just Cause 3 at about 65FPS average for 1440/Very High, with lows at about half of that. The 980, a full 16.7% behind, is playable at 55FPS in our worst-case scenario. The 390X also hits 55FPS, though does so with lower 1% and 0.1% framerates (22.5 vs. 30; 20.5 vs. 28).
Looking further down, the R9 290X is still playable at its 51FPS AVG output, with the GTX 970 trailing just behind. We'd recommend some settings tweaks to both of these cards – a drop to 'high' would be enough – to keep more consistent >50 framerates.
Just Cause 3 Benchmark at 1080p VHigh – 970 vs. 960, 950, 380X, 270X, etc.
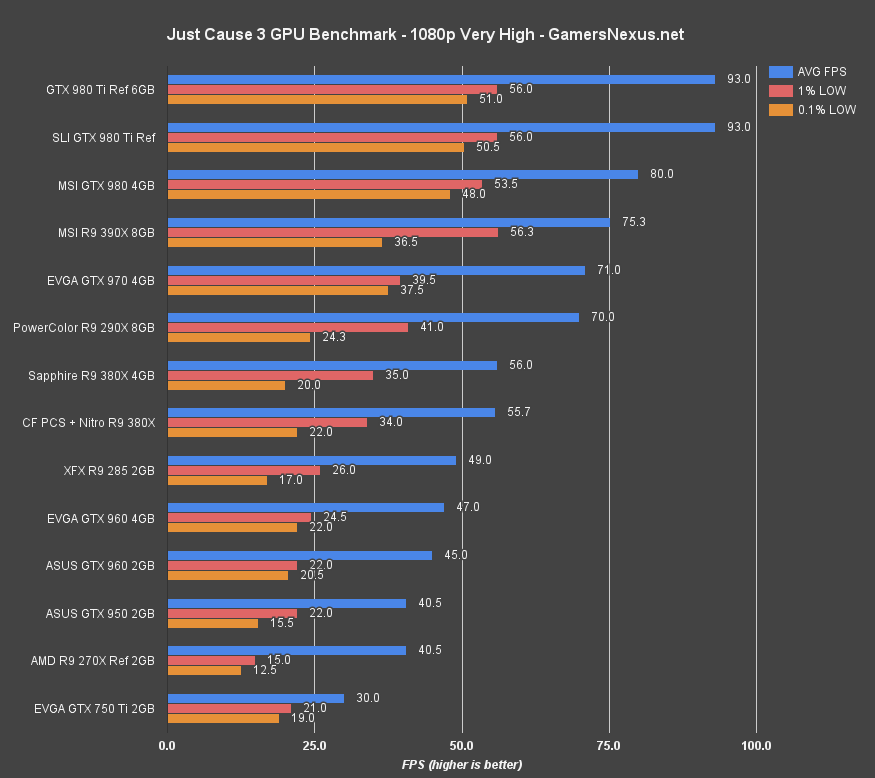
We left the CrossFire test on this chart to demonstrate a lack of CF scaling at this time. A future driver update will likely resolve this.
1080p at “Very High” is where we'd expect most users to target for settings. With this configuration, anything including and north of the R9 380 ($200) (effectively equivalent to the R9 285 in the above chart) or GTX 960 4GB ($210) would be sufficient for Just Cause 3. We would recommend settings tweaks to the lower-end cards (R9 380, 285, and GTX 960s) for better sustained framerates during intensive periods.
The GTX 960 4GB and GTX 960 2GB show a small disparity (2FPS, or 4.35%), but nothing nearly as interesting as what we saw in AC Syndicate.
Take a look at the R9 390X vs. the GTX 970. At Very High, the 390X leads the GTX 970 by a couple percent (75 vs. 71 FPS). The 390X also sustains a higher 1% low FPS. Commit that to memory for a moment.
Just Cause 3 Benchmark at 1080p High – 960 vs. 950, 750 Ti, 270X, 250X
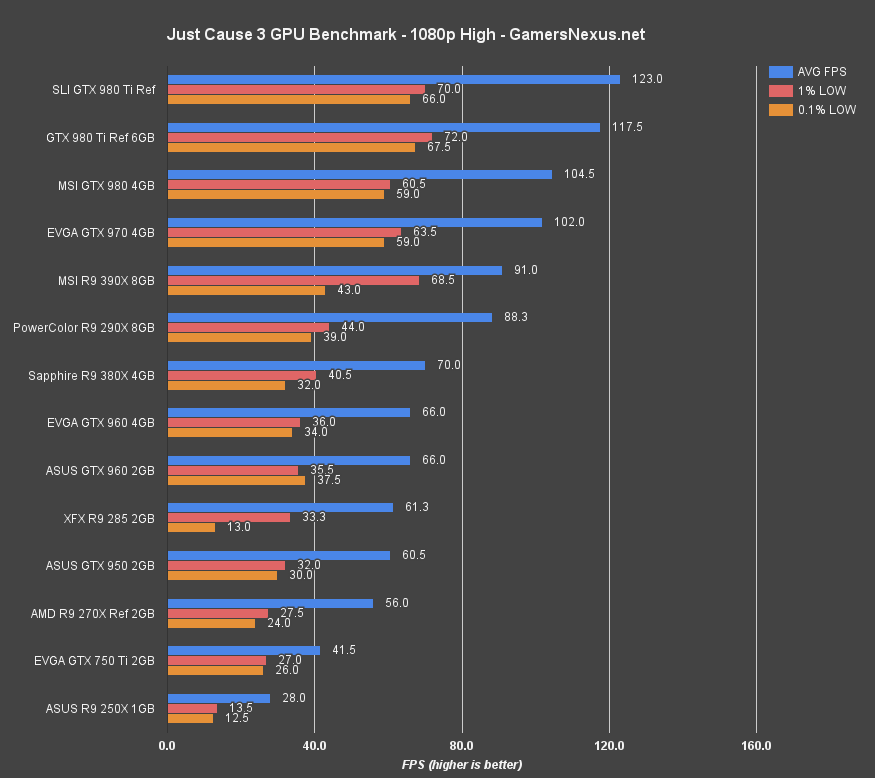
Moving down to 'high' and disabling some of the FX (SSAO, global illumination, motion blur, screen space reflections), FPS improves considerably on most GPUs. This is particularly visible at the low-end, where the aged R9 270X now enters a range of relative playability (despite poor 1% and 0.1% low frametimes). The GTX 950 is outperformed by the R9 285 (and thus, R9 380) marginally, with the R9 380X taking a lead of 5.9% over the GTX 960 cards.
The GTX 970, at 102FPS AVG, leads the R9 390X in this benchmark, something we've seen recently in other titles that make heavier use of tessellation. The 390X appears advantaged at the highest quality setting, but loses ground at lower settings. A moment ago, the 390X was in the lead, but now we're suddenly seeing a 11.2% delta at the same resolution. We haven't yet found the cause of this. Substantial research was conducted on water FX, with us spending an extra two hours on validation of benchmarks using various states of water quality, but that didn't lead to this delta. We have narrowed the difference down to either SSAO, Global Illumination, Texture Quality (perhaps a VRAM advantage – but then the 2GB & 4GB GTX 960s would theoretically front a bigger delta), and SS reflections. This will require further research to adequately dissect and will receive a separate article, should anything interesting come of it.
Conclusion: The Best Video Cards for Just Cause 3
Just Cause 3 has some optimization issues that have led to hours of exhaustive analysis. Thus far, that analysis has not led us to a conclusion as to odd performance disparities and card exchanges. We have spoken with nVidia regarding this behavior and have sought peer review amongst other lab technicians. So far, tests conducted by others appear to be matching our own – we are confident in the data collected, but confused as to why the 970 and 390X make the exchanges they do. Again, more research required.
CrossFire currently yields no performance gain. Users should expect to use a single card for now. SLI does have gains, but they're tiny – a couple percent, at very best. Both companies are addressing multi-GPU scaling in forthcoming updates.
Despite these performance oddities and hair-pulling anomalies, Just Cause 3 runs relatively well – AVG FPS-wise – on most GPUs and is less demanding of high, consistent framerates than more competitive games. Still, performance anomalies and gaps in output (390X v. 290X – they're a little close at 1080/high) indicate that some optimization still needs to be done on the driver or game side. Sudden, fierce frame drops have occurred on a few occasions during transit to the test location. These normally happened once per 'cell' (to use TES terminology) and seemed to correspond with cell transitioning.
Anyway, based on what we have now, here are the findings:
To play Just Cause 3 at 1080p and Very High, we'd recommend the GTX 970 at $330 or R9 390X at $420. The GTX 970 is presently better cost-per-frame. If 1080 / high is acceptable to you, some money can be saved by dipping to the GTX 960 ($210) or R9 380 ($210). Low frametimes are a bit worse on the R9 285, which generally mirrors the R9 380. Unfortunately, our original R9 380s were on loan and had to be returned, so the card is not present on the charts. The R9 380X ($230) outperforms the GTX 960 by ~6% and is a worthy consideration at this price-point.
For 1440p, the GTX 980 Ti is the best-performer, but the GTX 980 is something we'd consider playable with some tweaking (to resolve low frametimes – the average is mostly agreeable). The R9 390X is in the same boat, but with much worse low frametimes that make us a little more concerned.
4K is rough right now. To play 4K would require a hybrid mix of medium and high settings on the GTX 980 Ti. We would advise targeting a lower resolution instead or waiting on further optimizations.
Editorial, Lead: Steve “Lelldorianx” Burke.
Testing & Validation: Mike “Budekai” Gaglione.
Video Editing & B-roll: Keegan "HornetSting" Gallick.