Star Citizen Alpha 2.0 Graphics Card Benchmark - ArcCorp, Free Flight, & Racing
Posted on
Cloud Imperium Games' Star Citizen achieved a major milestone with the distribution of its Alpha 2.0 package, allowing multiplayer exploration in addition to existing dog-fighting and free flight. This release gives players the first glimpse of the game's open world intentions, presenting environments forged in Sci-Fi influence.
There's not much in the way of gameplay just yet, but Alpha 2.0 has been made available to all backers for initial bug- and stress-testing. We decided to conduct a test of our own, specifically looking at GPU performance and preset scaling across multiple “game modes.” Right now, because the pre-release game is comprised of several disjointed modules, there's no one “Play Star Citizen” button – it's split into parts. Racing, free flight, and dog-fighting are in one module (Arena Commander), the Hangar stands alone, and online testing with ArcCorp and Crusader were just released.
For our Star Citizen video card benchmark, we look at GPU vs. GPU performance in the race, delta performance scaling on ArcCorp and in the hangar or free flight, and talk methodology. The game isn't done and has yet to undergo performance optimizations and official driver support, so we won't be recommending the usual “best graphics cards for [game]” this time, as we usually do in our game benchmarks.
You'll be able to see what the game demands for play in its current state, but again, we are holding off on component recommendations until a more finalized state has been reached. We're advising against purchasing cards based on Alpha performance; the content's purpose is more to audit initial performance and help users determine if their existing setup is capable of playing Alpha 2.0.
Star Citizen Alpha 2.0 & PTU GPU Benchmark
Star Citizen Alpha 2.0 Max Graphics & Benchmark Courses
Test Methodology
We tested using our updated 2015 Multi-GPU test bench, detailed in the table below. Our thanks to supporting hardware vendors for supplying some of the test components.
The latest AMD Catalyst drivers (15.12 WHQL) were used for testing. NVidia's 359.06 game-ready drivers were used for testing, which contain Just Cause 3 optimizations. We are unaware of any specific Star Citizen driver optimizations from either manufacturer at this time. Game settings were configured to "Very High," "High," and “Medium,” for the main test course, with “Low” being thrown-in for delta scaling. We used 1080p, 1440p, and 4K resolutions.
Settings are not broken into individual options at this time, short of some sort of .ini tweak (which we did not do for this testing). We're strictly testing stock options, which are currently presented as just four settings presets. Star Citizen's FPS lock was disabled in all testing by using r_VSync 0 in the console.
Each scenario was tested for 30 seconds identically, then repeated three times for parity.
Our primary bench course is conducted on the Murray Cup racing simulation (single-player). We originally began primary testing on ArcCorp, but determined that the network is presently too unstable and load times too long to efficiently complete dozens of test passes on ArcCorp. The network occasionally dropped us (filled instance or uninitiated disconnect), driving us back to the racing sim for reliable and reproduceable testing. The Murray Cup test was conducted beginning after exit from the 'hangar,' which massively hits FPS due to geometric complexity and proximity of high-detail objects. We started the performance capture after exiting this tunnel, then recorded for thirty seconds while moving through the first corner in the race (at 86-87 m/s speed in the M50). All cards were tested in this course.
Delta performance scaling was conducted additionally on the ArcCorp, Hangar, and Free Flight maps. These tests were conducted solely on one card (980 Ti) for percent performance difference (delta scaling). In the Public Test Universe's ArcCorp, we observed FPS variance swinging more than 60% in some instances, seeing dips as low as 30FPS and spikes as high as 110FPS (980 Ti reference). We ultimately settled on a “common area” of sorts, the initial market courtyard, as it produced nearly perfectly consistent results and rested at a fairly prevalent, mid-to-intensive framerate. Keep in mind that depending on where you're walking, performance will drastically rise or drop and may not represent our results. Our benchmark course is in the video above; we walked from the bridge to the medical bay doors.
The hangar – we've got the asteroid hangar on our account – was fairly unintensive in all areas, but we picked the worst-case scenario for testing. This is something we commonly do (and, barring outliers like the Murray Cup tunnel and specific region accessible by EVA, did for the above). Worst-case testing shows what to expect when the GPU struggles most, produces the most reliable results (less variance from FPS swings that may be instantiated by test execution differences), and creates the FPS we present below.
Free flight has us guiding our M50 toward some satellite objects in space, including an asteroid and spherical model with reflectivity and shader effects applied. Flying in empty space will, obviously, produce a significantly higher FPS in some instances.
Tests were conducted three times for parity. The cockpit impacts FPS to some degree in flight tests; we used the M50 in all cockpit-based testing.
| GN Test Bench 2015 | Name | Courtesy Of | Cost |
| Video Card | This is what we're testing! | - | - |
| CPU | Intel i7-5930K CPU | iBUYPOWER | $580 |
| Memory | Kingston 16GB DDR4 Predator | Kingston Tech. | $245 |
| Motherboard | EVGA X99 Classified | GamersNexus | $365 |
| Power Supply | NZXT 1200W HALE90 V2 | NZXT | $300 |
| SSD | HyperX Savage SSD | Kingston Tech. | $130 |
| Case | Top Deck Tech Station | GamersNexus | $250 |
| CPU Cooler | NZXT Kraken X41 CLC | NZXT | $110 |
Average FPS, 1% low, and 0.1% low times are measured. We do not measure maximum or minimum FPS results as we consider these numbers to be pure outliers. Instead, we take an average of the lowest 1% of results (1% low) to show real-world, noticeable dips; we then take an average of the lowest 0.1% of results for severe spikes.
Video Cards Tested
- MSI R9 390X Gaming 8GB ($430)
- Sapphire R9 380X 4GB ($230)
- PowerColor R9 290X 4GB (Deprecated)
- XFX R9 285 2GB ($206)
- AMD R9 270X 2GB Reference (Deprecated)
- NVidia GTX 980 Ti 6GB Reference ($660)
- MSI GTX 980 4GB Gaming ($515)
- EVGA GTX 970 SSC 4GB ($330)
- EVGA GTX 960 SSC 4GB ($225)
- ASUS GTX 960 Strix 2GB ($200)
- ASUS GTX 950 Strix 2GB ($170)
Tests Conducted & Charts Shown
Recapping what's already describe above, but more briefly:
- Delta performance scaling (% gain/loss): ArcCorp & Free Flight.
- Absolute performance metrics on 980 Ti / 1080p with “High” settings for Hangar, Free Flight, Murray Race, & ArcCorp testing (to show scaling).
- All cards at 1080p with Very High, High, and Medium settings in Murray Race.
- High-end cards at 1440p and 4K with High/Medium and Medium (respectively) in Murray Race.
Disclaimer: This Game is in Alpha!
Star Citizen isn't done yet! These tests represent performance data in the game's currently-shipping state (Alpha 2.0 public launch build). Performance will change as the game iterates and driver manufacturers begin officially supporting Star Citizen with drivers.
Star Citizen PTU ArcCorp Preset Scaling (Delta)
This chart shows the percent performance gain from a baseline setting, specifically looking at the ArcCorp Public Test Universe map. We're only using one GPU at this point, moving to the rest later, and running strictly at 1080p. This test has established “Very High” as the baseline setting (100%), with reductions in settings offsetting performance positively from that baseline (+% increase). The percentage represents FPS scaling impact from various presets. Absolute performance metrics are yet to come.
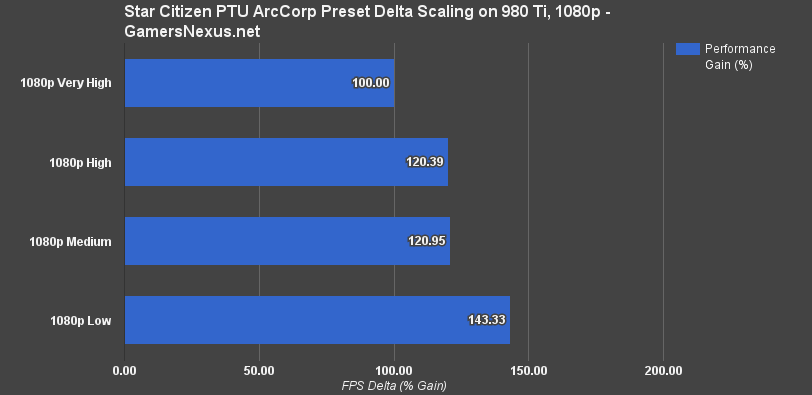
At “High,” the map instantly shows a 20.39% performance improvement over “Very High.” Medium, in the game's present state and on our test course within ArcCorp, shows effectively zero performance change from High (20.95%, a performance difference that falls within our margin of test error). We are unsure of why this setting seems to have no impact on our ArcCorp test at this time. Testing Low settings swings performance to a 143% offset from baseline (Very High), a ~22% gain over Medium.
Star Citizen Free Flight Preset Scaling (Delta)
As above, but for free flight.
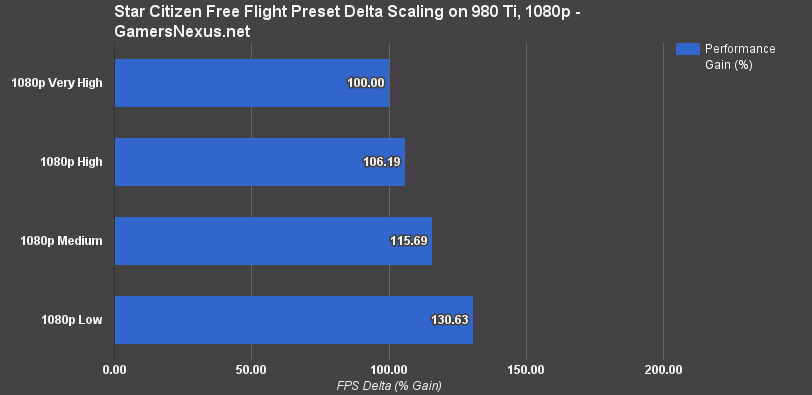
Performance scaling is more linear in this bench course. Moving to High shows a 6.19% performance gain, roughly doubled by moving to Medium (+15.69% offset from Very High). Low doubles this again.
Star Citizen Alpha 2.0 Game Mode Preset Scaling (Absolute)
This chart, still with only the one GPU (it would be unrealistic to test all game modes on all GPUs at this time, though we'll do it as the game moves forward), shows the absolute values for each map.
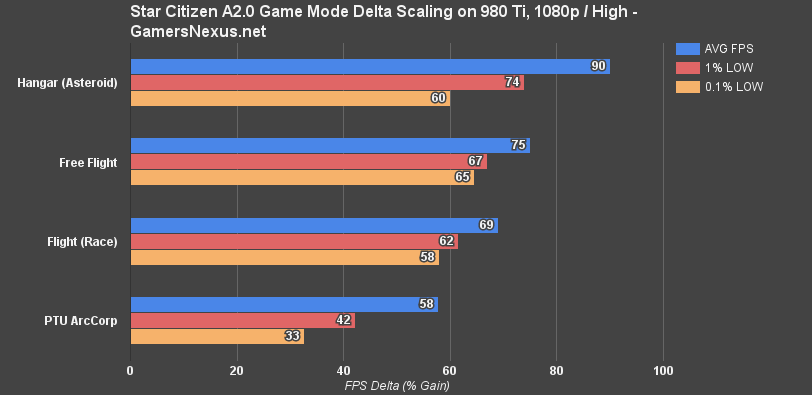
Our hangar, the asteroid hangar, was the most forgiving map in the current game. Other hangars may vary. With High settings, the hangar far-and-away exceeds 60FPS, landing at 90FPS average and with high 1% and 0.1% lows (74, 60FPS, respectively).
Free Flight on “High” pushes about 75 FPS average. 1% and 0.1% lows are tightly timed with the average – critical to apparent fluidity of gameplay – at 67 and 65FPS, respectively.
The Murray Cup Race (our primary GPU benchmark) is the next most intensive, at ~69FPS average and with still-tight timings.
ArcCorp drags us below 60FPS on the 980 Ti with High settings, and low timings get looser and more noticeably choppy. This seems to be the most intensive map in the game right now, perhaps alongside Crusader; we were unable to get into Crusader during the test period resultant of various network errors or connectivity / instancing population.
Scaling results may differ on lower-end cards, which could see more substantial performance gains from settings reductions.
Star Citizen Alpha 2.0 1080p/Very High Benchmark: 980 Ti vs. 390X, 980, More
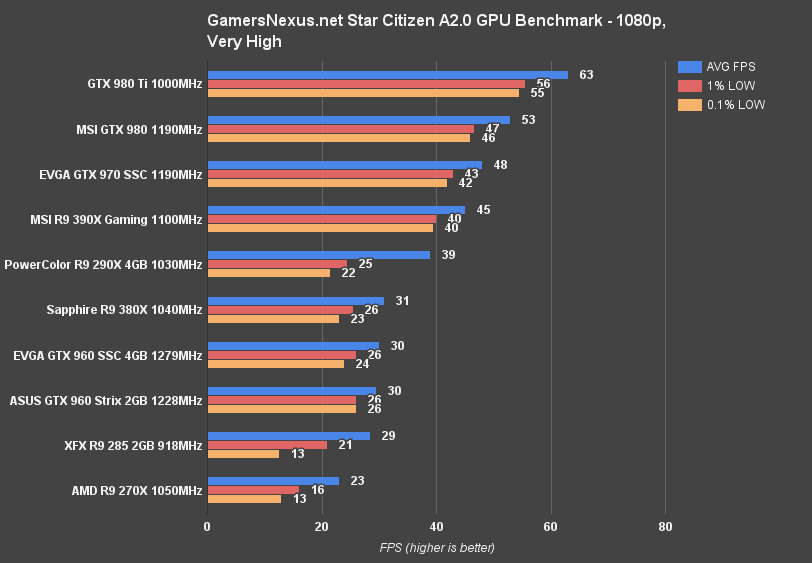
We'll start at 1080p, Very High and move up to 4K. Keep in mind that ArcCorp showed about 17% worse performance (only on the 980 Ti, granted) in our scaling tests, so adjust FPS as necessary to get an understanding of PTU ArcCorp performance.
With Very High settings, we were able to exceed 60FPS only on the 980 Ti reference card. 1% and 0.1% low framerates are extremely consistent and tightly timed with the average, something that we want to see. The GTX 980 4GB card runs 10 frames slower in the race map, planting it at around 17.2% slower than the 980 Ti. Play becomes noticeably choppier as we approach the 40FPS range, occupied by the R9 290X and slightly exceeded by the R9 390X. AMD's new 380X ($230) can't cut-it at 1080 and Very High.
Unlike in FPS games and other titles we've recently tested, Star Citizen is presently far more forgiving at sub-60 framerates. The game isn't ultra-competitive just yet and doesn't have high consequences, so for sake of exploration, the general ~40 AVG FPS range is acceptable (taking into account dips and lows).
Star Citizen Alpha 2.0 1080p/High Benchmark: 980 Ti vs. 980, 970, 390X, 290X, etc
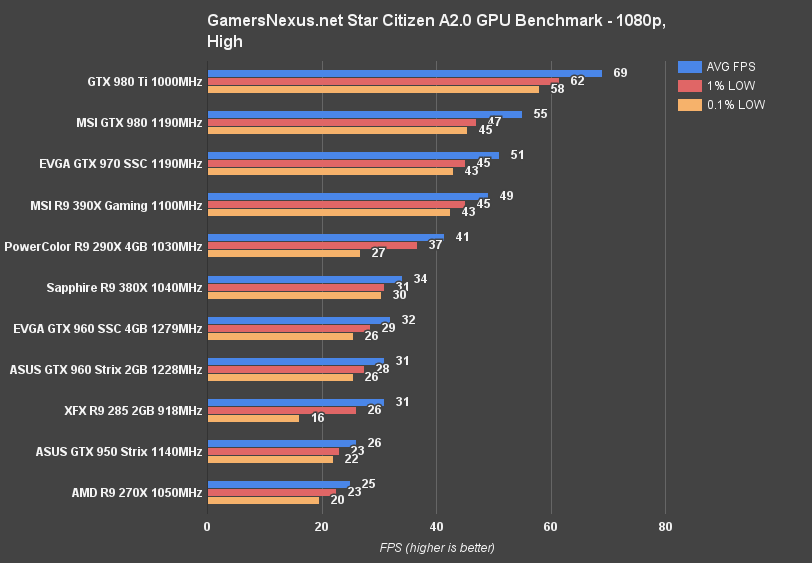
Dropping to 'high' sees mixed FPS increases, with most cards landing a gain between 3 and 7% > Very High. The 390X now approaches 50FPS, the 290X still shows its poor 1% and 0.1% low performance, and the performance across the board slots the same card hierarchy as the previous chart. The GTX 980, 970, and R9 390X are all fairly playable. We introduced the GTX 950 ($160) to this chart, falling short of any playable range with its 26 FPS average.
Star Citizen Alpha 2.0 1080p/Medium Benchmark: 970 vs. 390X, 380X, 960, etc
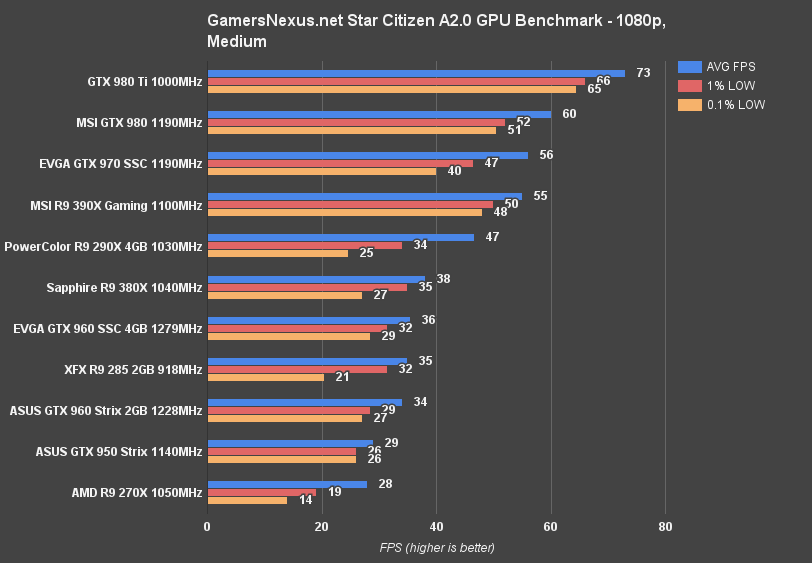
Medium is significantly more forgiving than Very High, but we again see fairly linear performance gains across the board. Dropping to 'medium' allows the 290X and 380X to enter general playability in worst case scenarios, but the 380X does struggle. The GTX 960 ($230), like the 380X, isn't particularly well-suited for play right now, but can get by until a time at which optimization improves or cards are upgraded. Just don't expect precision. We see slight performance hikes in the EVGA 960 4GB card over the ASUS 2GB card, but that is more likely attributable to the slight core clock advantage of the SSC. Some games do show substantial gains from the 4GB model, though.
In all our 1080p tests, the 970 ($350) holds a consistent lead over the R9 390X, something we've seen becoming more common lately.
Star Citizen Alpha 2.0 1440p Benchmarks
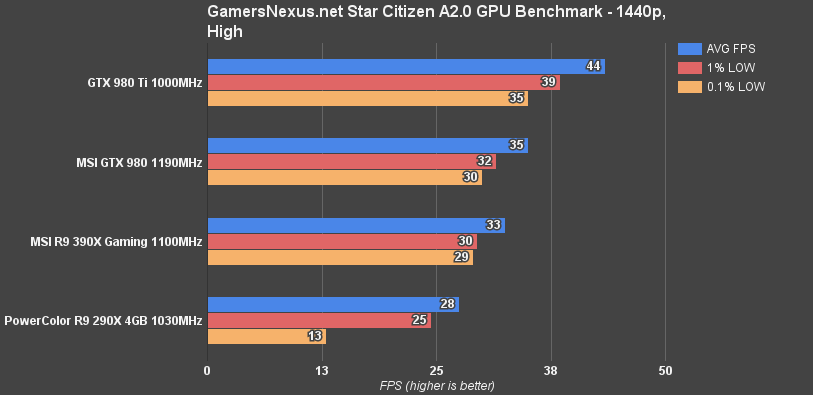
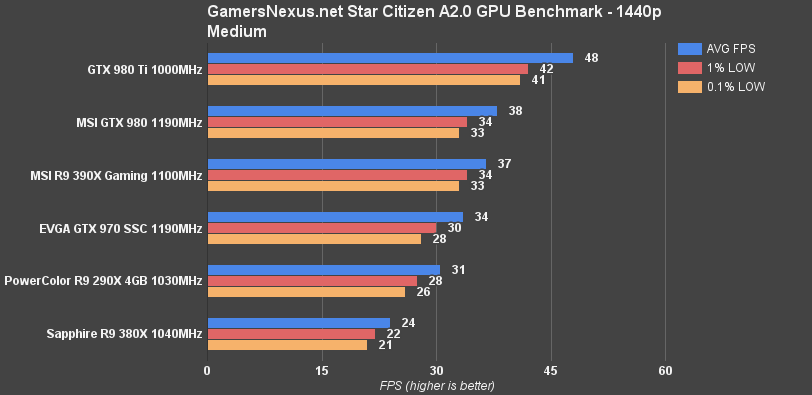
1440p is understandably abusive on the system, introducing 1.6 million more pixels than 1080p. Nothing is perfectly fluid at 1440 and High, and it's not much better at Medium. The 980 Ti gets by well enough at Medium, but the 980 and 390X are held under 40FPS and starts to exhibit choppiness in some gameplay.
Star Citizen Alpha 2.0 4K/Medium Benchmark

4K isn't playable on a single card right now. Even at Medium, the 980 Ti pushes 23FPS – not very fluid – and the 390X pushes 19, but is hammered by an 8FPS 0.1% low.
Conclusion

“Out-of-box” (read: unmodified) testing shows that Star Citizen scales fairly linearly and predictably across its presets right now, even if abusively intensive in some scenarios. Cards in the ~$300+ bracket are generally playable at 1080p with medium settings, at a minimum, but it'll depend on what map (and what part of that map) you're exploring. The GTX 970 regularly outpaces the R9 390X, being overtaken at higher resolutions (1440p) as a result of the 390X's generally superior raw pixel-count processing power. This reflects tests we've recently conducted of other games.
Star Citizen is obviously incomplete, but as it stands now, framerates are generally low and gameplay is difficult with mid-range and low-end cards. We've seen massive performance improvements over some of the earliest iterations of the game's alpha with Alpha 2.0, a promising fact that indicates additional performance gains as the game (and drivers) iterate. Pop-in is rough right now, with some objects, like fences and signs, materializing fairly close to the camera (~30m); this is likely a temporary performance assist. LOD scaled assets may not yet be complete in some maps, based upon our delta scaling test on ArcCorp, though we'll research that further in future updates.
If you like this kind of reporting, please consider supporting us on Patreon.
Editorial, Lead: Steve "Lelldorianx" Burke.
Testing & Validation: Mike "Budekai" Gaglione.
Video & Film: Keegan "HornetSting" Gallick.