Let's Settle This: Kingston V300 Asynchronous vs. Synchronous NAND Benchmark
Posted on
We've seen a lot of discussion spurred about
Upon publication of Kristian's post on Anandtech, I called our
For all future references of the V300, to reduce confusion, I will be calling them "V300A" and "V300S," or V300 Asynchronous and V300 Synchronous (NAND). The original drive (c. 2012) used synchronous NAND (V300S), the currently-shipping V300 drives use asynchronous NAND (V300A).
If you're unsure of what any of this even means, I'll define asynchronous vs. synchronous NAND briefly in just a moment. Before that, though, a definition of this article: The objective was to benchmark performance between the V300's asynchronous and synchronous NAND models, hopefully determining if there is any real-world difference. I was unsatisfied with the benchmarks performed on forums, and so built our own real-world suite to accompany a synthetic test suite. The test case was reviewed and commented on by engineers at Samsung,
A lot of the user-run benchmarks for the V300 that I've seen on forums have used AS-SSD, which slams the drive with incompressible data -- a worst-case scenario for Gen 2 SandForce controllers -- and produces a somewhat incomplete picture. We're here to complete it. Incompressible benchmarks are important, but because most user data is compressible, we have to make sure everything is tested under identical conditions.
I purchased my own V300(A) to go along with our first-wave review sample of the V300, a measure I took to ensure that the device I'm testing is what you'd be receiving from a retailer.
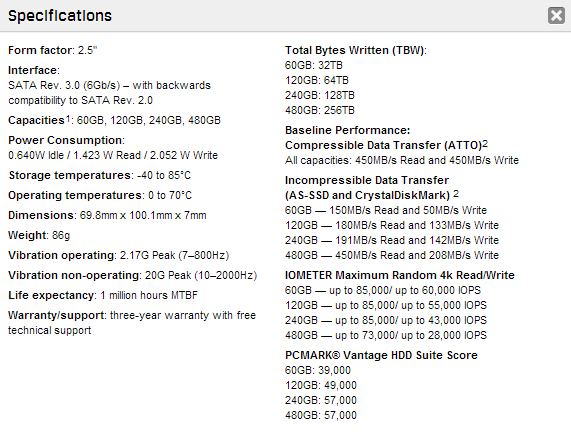
Kingston V300 Specs - The Original Listing
For now, here's what the V300's specs look like, via Newegg & Kingston:
In talking with
In discussion with the company prior to this article's publication, Kingston wanted to make very clear that they are not "abandoning synchronous NAND" and that the move was to ensure the V300 is available at (what I interpreted as) a lower price than the $95 HyperX SSD, creating a more consistent pricing structure for SSDs. "It's part of our multi-BOM strategy to deliver the best price for our customers in an entry-level SSD," they said.
Still, it comes down to the controller to determine the true differences, but MLC was one of the primary draws of the V300 in its early stages. The device became available for just under $100 at 120GB, which was an incredible deal for the time of launch. We've recently seen drops to $80 and, in some discount cases, $60 -- or $0.50 / GB -- which has been largely unheard of.
So the drive has attraction in the market and appears good on paper, but then there's all the fuss about NAND changes.
What is Synchronous NAND? Asynchronous?
As I briefly discussed in our lead-up "new experiment" post, asynchronous NAND and synchronous NAND have an on-paper difference of nearly 2x (all other items constant) favoring synchronous NAND. The underlying architecture difference comes in the form of a clock. Keep in mind that, unlike magnetic hard drives (spindle-based, mechanical), SSDs operate using electrical signaling and logic gates to perform all data transmission and storage. An HDD uses a header to write data to a physical disk which then magnetically retains it, an SSD uses voltages and gates to write it to non-volatile memory.
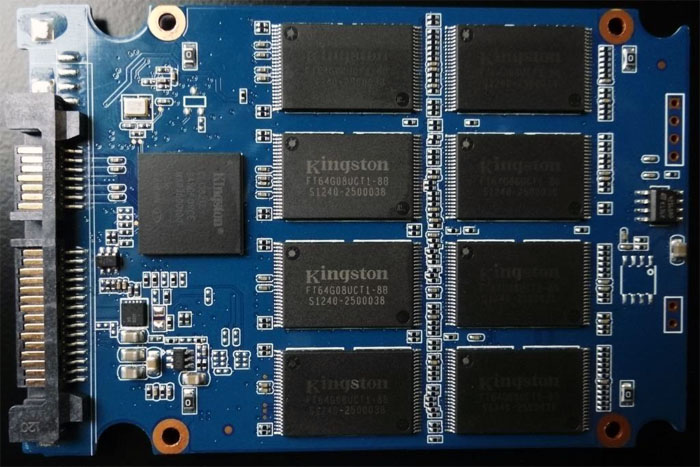 A V300 PCB shot, source: The SSD Review.
Inside your SSD casing will be found a PCB that has gone through an SMT line (surface-mount technology). It is on this automated 'assembly line' that a series of machines and conveyer belts
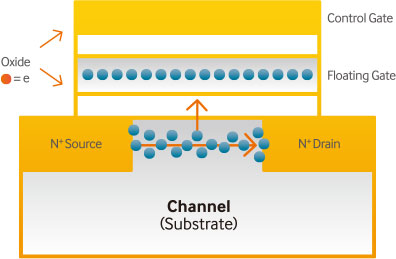
Flash modules are a form of non-volatile memory that use Negated AND (NAND) logic gates to control the movement and storage of information on the device. You can see a NAND gate above -- a standard logic gate that is not unique to SSDs. For those who remember EEPROM (Electrically Erasable Programmable Read-Only Memory), an SSD's Flash memory is based on EEPROM's foundation; an SSD's cells (there are billions of these per device) contain a number of bits of data based upon the type of Flash (SLC, MLC, TLC). These cells must be electrically programmed by the device when storing data permanently, done by sending a signal to the device, and when it's time to remove data or perform wear-leveling, they will be electrically erased. This is where P/E cycles are rooted.
An easy example would be issuing a Secure Erase on your SSD, which will blast the drive with null data, setting all cells to a relatively 'blank' state. Doing this will deplete an entire P/E cycle from the NAND's lifespan -- if you had 3,000 P/E cycles, you now have 2,999, basically.
This is getting into architecture, but it's important information to have a foundational understanding of what we're going to talk about next. Moving on to the part you all came here for: Synchronous NAND.
Synchronous NAND deploys an electrical timing circuit that prompts data movement on both the rise and fall of the signal wave that is dispatched to interact with the device. Before getting further, here's an excellent visual aid from Samsung's NAND whitepaper:
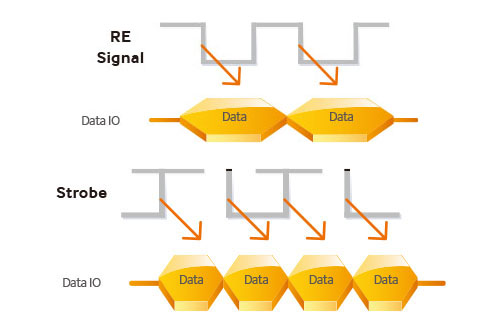
In the first image, we see there is an "RE signal" being triggered at the fall of each signal wave, used for "Read Events." Other signals sent include "WE signals" for Write Events. These signals work in part to regulate how the drive perceives and stores its data. At some point, these signals were no longer sufficient for the speeds being achieved by SSDs, and so NAND suppliers worked to introduce a new "Strobe signal." This is seen in the second image (same graphic, above). Samsung defines the Strobe signal as:
"Present in all modern DDR NAND implementations, the strobe helps the controller to handle read and write data at high speed. It starts after receiving a signal from the host indicating a read or write event – think of a stopwatch, which can start and stop on demand. Depending on its current task, the strobe plays slightly different roles. During a write event, it is directly managed by the controller, whereas it plays a more supporting role during a read event.
With ONFI 2.0, synchronous logic was introduced to the ONFI NAND specification. Synchronous devices operate a “free-running” clock, which means that, as long they are receiving power, the clock will continuously run – much like a standard wall clock. This clock is used as a reference for the strobe. Modern ONFI NAND implementations eschew the use of a clock once again in favor of using only the strobe. Every generation of Toggle NAND was asynchronous."
ONFI stands for Open NAND Flash Interface, which is a somewhat open engineering standard that is maintained by more than 100 manufacturers and suppliers. Another standard, the one that
All this now known, a synchronous device's timing circuit will -- as I said above -- move data twice per signal wave (rise and fall), as opposed to just once with the asynchronous clock. Toggle NAND will process data during each point on the strobe signal drawn above. This theoretically increases our throughput significantly, since we're now effectively acting twice per wave.
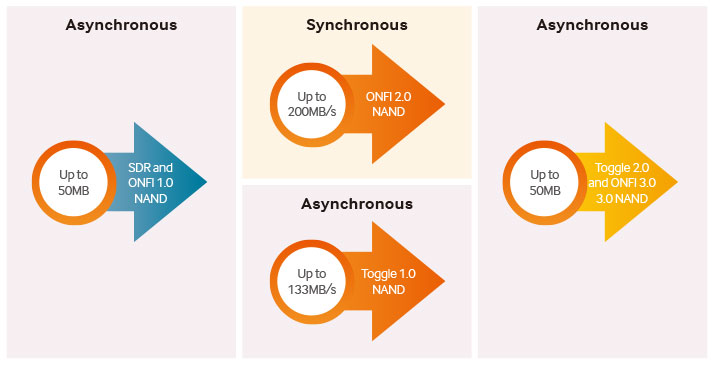
To know the actual theoretical throughput of the NAND (in MB/s), we turn to manufacturer and supplier specifications. We know that the interface bandwidth of current-gen consumer-available Toggle NAND is approximately 200MB/s (found on the V300S); we also know that the asynchronous NAND supplied by Micron has a maximum theoretical interface bandwidth of 50MB/s, but don't have precise numbers. On paper, the bandwidth difference is massive -- but that doesn't necessarily mean anything for real-world use, since the controller is responsible for so much of the drive's performance.
Enough of that. Let's put all this to rest.
Continue to page 2 for our methodology and benchmark results; we also explain incompressible vs. compressible data, preconditioning, and other SSD considerations.
Test Methodology and Platform
We have a brand new test bench that we assembled for the 2013-2014 period! Having moved away from our trusty i7-930 and GTX 580, the new bench includes the below components:
| GN Test Bench 2013 | Name | Courtesy Of | Cost |
| Video Card | XFX Ghost 7850 | GamersNexus | ~$160 |
| CPU | Intel i5-3570k CPU | GamersNexus | ~$220 |
| Memory | 16GB Kingston HyperX Genesis 10th Anniv. @ 2400MHz | Kingston Tech. | ~$117 |
| Motherboard | MSI Z77A-GD65 OC Board | GamersNexus | ~$160 |
| Power Supply | NZXT HALE90 V2 | NZXT | Pending |
| SSD | Kingston 240GB HyperX 3K SSD | Kingston Tech. | ~$205 |
| Optical Drive | ASUS Optical Drive | GamersNexus | ~$20 |
| Case | NZXT Phantom 820 | NZXT | ~$220 |
| CPU Cooler | Thermaltake Frio Advanced Cooler | Thermaltake | ~$60 |
We used a full suite of real-world trace-based tests (timed) that were designed in-house; we also used a suite of standard synthetic benchmarking applications, all designed to hit different parts of the device for a better understanding of its ideal use-case scenarios. All power saving, ACPI, and Intel speed stepping / CLK altering BIOS and Windows settings were disabled for this test. Windows 7 Professional 64-bit was used as the host OS. All devices were secure erased and preconditioned prior to initialization. The CPU was clocked at 4.4GHz with a 2.265 vCore.
I'm not going to go as heavy on the methodology as I did with our dual- vs. single-channel RAM platform test, but that's because we've got several very detailed, dense articles coming about SSD testing. It's also because I've admittedly got a flight to catch for GDC & GTC in the next few hours. Still, I do want to at least explain what each test means to you as a buyer or onlooker.
Note: All tests were run a minimum of 3 times for averaging and normalization of data; outliers, if present, were eliminated and retested.
Preconditioning is a Must
We've discussed preconditioning and overprovisioning previously with Kent Smith of LSI and it's back for this post. It is of paramount importance that a tester precondition the SSD for the incoming onslaught of tests. Benchmarking an SSD out-of-box or after a secure erase will produce numbers that are wildly optimistic and entirely unsustainable as the drive gets "worn-in." The SandForce controller in these devices will react to the type of data being written to them, so we preconditioned for random and sequential testing separately.
In order to ensure the entire device is hit during our preconditioning round, we use a very simple formula to calculate the initial IOMETER 08 pass: drive capacity * .5 minutes. For these tests, we used 120GB SSDs with identical variables aside from the NAND (in theory, unless something else was switched that I don't know about). That means preconditioning was run for 120 * .5 = 60 minutes. The 100% write random preconditioning is run with 4K files at a 32 queue depth (QD) with 4K alignment.
I want to illustrate a point here, so I'm going to show the out-of-box results for the V300 against the preconditioned results. The second screenshot is from an in-progress random preconditioning pass, the first is from an initial 5-minute test before any preconditioning took place.
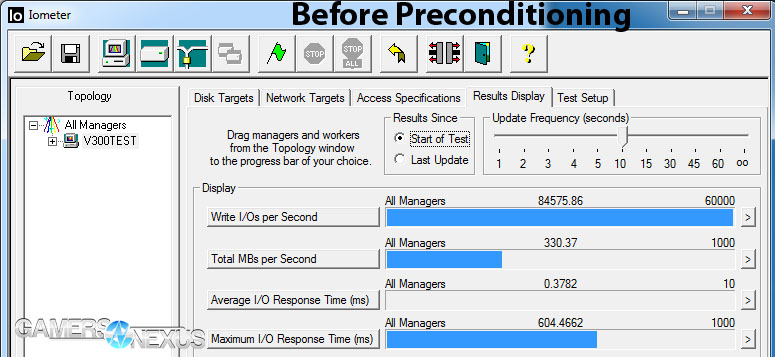
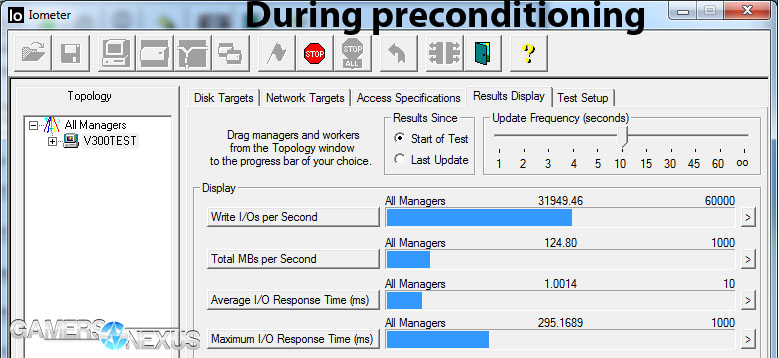
Pretty substantial differences. If I took the first pass for each drive, we'd have inconsistent results that are not reproduce-able after burn-in. In a real-world use case, you'll see your performance fall off a cliff after the initial hour-or-so of use, and this is why that happens; this applies to all SSDs in some capacity. With Kingston and Samsung -- and possibly others, though I haven't talked to them -- all their advertised IOPS and MB/s ratings are reported after preconditioning, so your mind can be put somewhat at ease.
After preconditioning, all IOMETER tests were run for 5 minutes with the settings shown in the respective charts.
What is Incompressible Data?
You'll see the term 'incompressible data' thrown around a lot as it pertains to testing using Crystal Disk Mark or AS-SSD. Let's define it.
Compression algorithms are used in almost every application a user would be faced with and are used constantly within Windows. These compression algorithms work by looking for redundancies and patterns within data. Less random data (more predictable) is more compressible, because the algorithms can identify patterns and losslessly compress the stream. The effectiveness of the compression is amplified by some controllers, like the Gen 2 and Gen 3 SandForce controllers, which reduce the Write Amplification Factor by compressing data written to the disk in such a way that it is sometimes lower than 1x. Every time you write to NAND, you're killing the device in a very small way by using program cycles. Using such heavy compression on the controller-side means that each write leaves a smaller footprint, extending the endurance of the device because we're writing less data to the disk.
More random data is difficult or impossible to compress; the nature of randomness is that it has no pattern that can be modeled and thus cannot be mapped to a probability distribution. An example of (hopefully) purely random data would be file encryption. The very definition of encryption is that it produces no identifiable pattern, and so encrypted data often cannot be compressed using compression algorithms or SSD controller technology.
This isn't where incompressible data stops, though. Data that has already been heavily-compressed is seen by the SSD as "incompressible," because its redundancies have already been eliminated in the earlier compression pass to make the file smaller. A real-world example could be textures in a video game, where the game's creators have already compressed the data to allow for the smallest possible distribution size; as far as your SSD is concerned, this is incompressible data that cannot be made any (or much) smaller than the source file. Similarly, media formats like MP3s and MP4s or AVIs are almost always incompressible given the nature of how they are written when originally created.
If you're copying, writing, and reading certain types of incompressible media files on a massive scale (MP3, MP4, AVI, especially), you should care more about incompressible metrics. If you're a media production professional, you should be hugely concerned about sequential and incompressible benchmarks. For most users, we care about random operations with roughly 46% compression (to account for media files and similar data), since most operations will be compressible.
And all of this is why we never rely upon a single synthetic benchmark for analysis. Even if you're constantly moving music and streaming videos or playing games, it is probable that the majority of your data use will be of a compressible nature. Just look at Windows alone: the constant background logging and processes generally land in the 1K-10K filesize range and are highly-compressible; almost all of your browser's cached data will be compressible -- images and locally-retained code (CSS, js) can be compressed significantly. Documents, most types of photos/images, and things like save game files are also compressible.
If you're experiencing semantic satiation of the word "compressible" or "compression," you're not the only one. Moving on.
Test Suite Composition:
As this isn't meant to be a full review and is more of a performance experiment, I used the following tools:
Synthetic:
- iometer 08.
- ATTO (results unpublished as they mirrored what we saw in the other tests).
- Anvil's Storage Utilities.
Real-World:
- Adobe Premiere encoding pass.
- Handbrake transcoding pass.
- WinRAR (compression/archival).
- WinRAR (extraction).
- TranStat (in-house; file transfer utility).
- Windows 7 boot time
Each type of test will hit the drive in a different way.
Iometer 08:
Iometer was utilized for preconditioning, 4K random testing, and a 1K random test. The tests conducted were of varying queue depths (QD), set for QD1, QD4, and QD32. In trace testing, I've found that gaming and everyday use (read: browsing, music playback, games, Steam) tends to rest in the QD1 and QD2 range; pure gaming is almost always a queue depth of 1 with a read size of 1KB. This means that the games I've traced will call for 1KB files most frequently and in a "shallow" fashion. I want to make clear that this isn't a definitive rule for all games and that we use it strictly as a guideline; a 1KB QD1 test is not an end-all test for "gaming performance."
Very few users will ever queue up more than 2-4 files to the device, and those who push more than that likely already know who they are.
Anvil's Storage Utilities:
I first discovered Anvil on the XtremeSystems forums, where he's been building and maintaining a rapidly upcoming (free) SSD benchmark utility. Anvil's Storage Utilities can perform endurance testing, threaded I/O testing, variability of compression, iometer interpretation, and has great customization for the tester. We primarily used the core SSD benchmark tool with an 8GB test size and 46% compression, which is regarded as a "real-world scenario."
Adobe Premiere Encoding Pass:
As I mentioned in the already-linked dual-channel vs. single-channel memory platform test, I maintain the site's YouTube channel and perform almost all of the video editing. Video editing and encoding are intensive on all system resources -- the CPU, RAM, the GPU in modern tools, and the disk are all hit heavily during rendering and file writing. For this test, I rendered-out a 60s clip at 28Mbps using the H.264 specification. The test was primarily to look at write performance at the end of the encoding pass.
Handbrake:
Handbrake is more heavy on RAM and the CPU than anything as it is a transcoding tool, but for sake of being a complete in testing, I threw it into this benchmark. Settings used were 28Mbps output at 60FPS constant with a 5.1 H.264 profile.
WinRAR:
This is where it starts to become relatable for a lot of users -- especially anyone doing home media server work handling regular log compression (note that the V300 is obviously not an enterprise SSD by any stretch of the imagination). We used WinRAR to compress a 10.3GB collection of music and movies into a single archive and timed its performance on each device. We later extracted the archive and timed the extraction ('uncompression') process.
TranStat (GamersNexus In-House Tool):
Several years ago we had this simple utility developed in-house for the site. All it does is execute file transfers using standard Windows functions -- no functionality is changed within Windows, it just logs the elapsed time accurately and tells us individual file transfer times. I used this to transfer 10.3GB of mostly incompressible music and movie files, which gives us some insight as to how long a file copy would take with each SSD in a real-world scenario involving media.
Boot Times:
Simple: Just a warm boot with a stop-watch.
Once and For All: Kingston 's V300S vs. V300A Benchmark Performance
That flight I mentioned is getting closer with each paragraph. Time to let the graphs do the talking:
In-House Trace-Based Real-World Tests (that's a lot of hyphens)
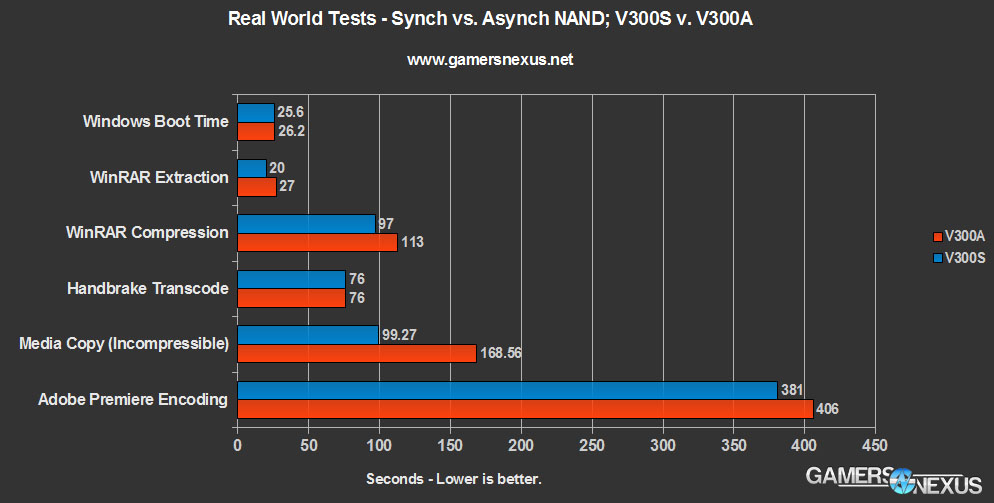
In this chart, we see the results of our Windows boot test, WinRAR compression & extraction tests, Handbrake transcoding & Premiere encoding passes, and the media copy pass. Going down the line:
Windows boot times are largely unaffected in our Win7 64-bit Pro install, which is somewhat expected, since the biggest claim against asynchronous NAND thus far has been its incompressible performance (Windows is heavily-compressed). No noteworthy difference. This is within margin of error and for all purposes can be considered "identical."
WinRAR Extraction and compression had pretty noticeable changes, depending on what you're doing that requires it. There's almost a 30% difference in extraction time (20s vs. 27s) and a ~15% difference in compression time. It might be a couple seconds in these tests, but when dealing with larger files on a more regular basis, it could be important for some users to consider. For most, I'd imagine, this is not really all that common of an occurrence unless dealing with large media downloads.
Handbrake transcoding was identical; this is because it is bound by other resources more than the disk.
The media copy saw a pretty large performance differential favoring the V300S -- the drive that is no longer available. The presently-shipping V300A, as I've called it, operates 51.7% slower than the device with synchronous NAND. Although this might not seem like a big deal when you're looking at ~100s vs. ~170s 10.3GB transfer, it'll matter a whole lot more when you're moving 100GB of data on anything remotely resembling a regular basis.
Premiere's encoding difference was much smaller, landing at around 6.3% in favor of the V300S. Keep in mind that in all the above bars, lower is better because we're dealing with seconds.
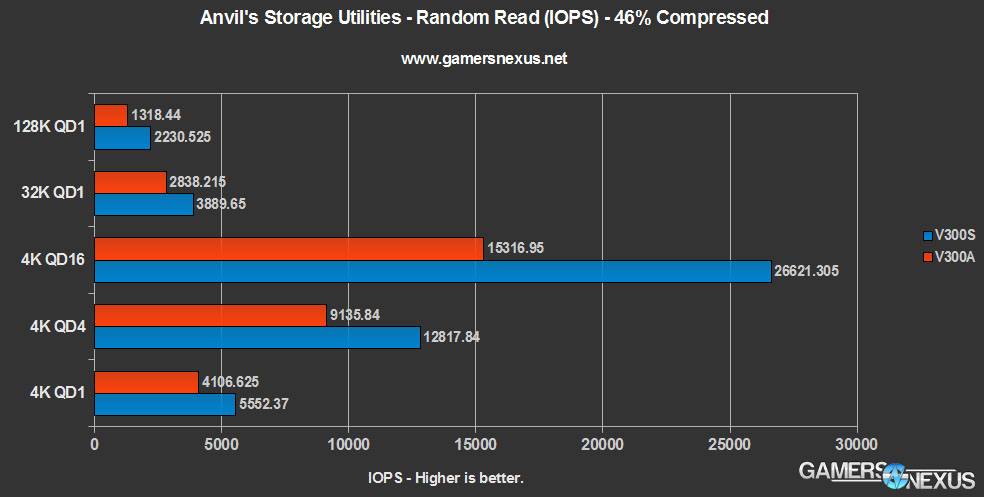
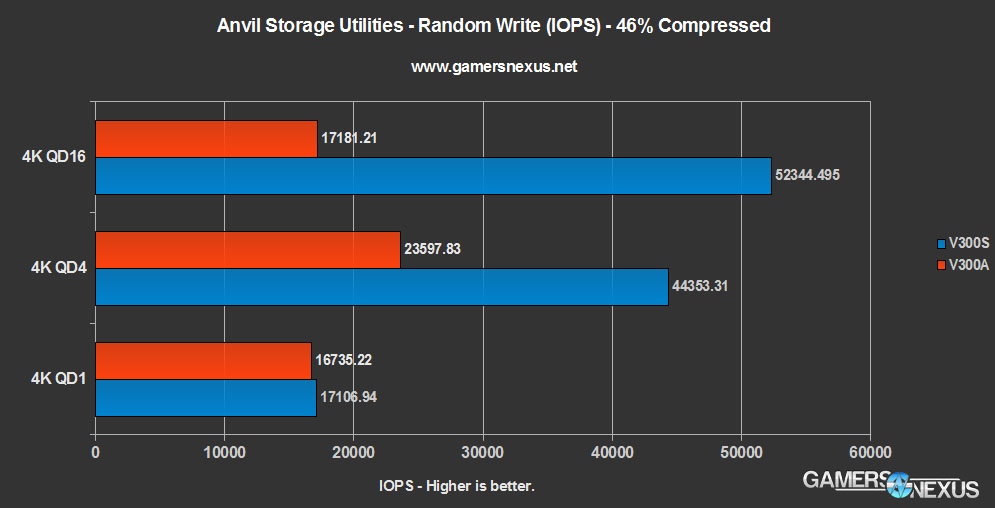
Anvil's Storage Utilities: Sequential & Random Tests - Asynchronous vs. Synchronous
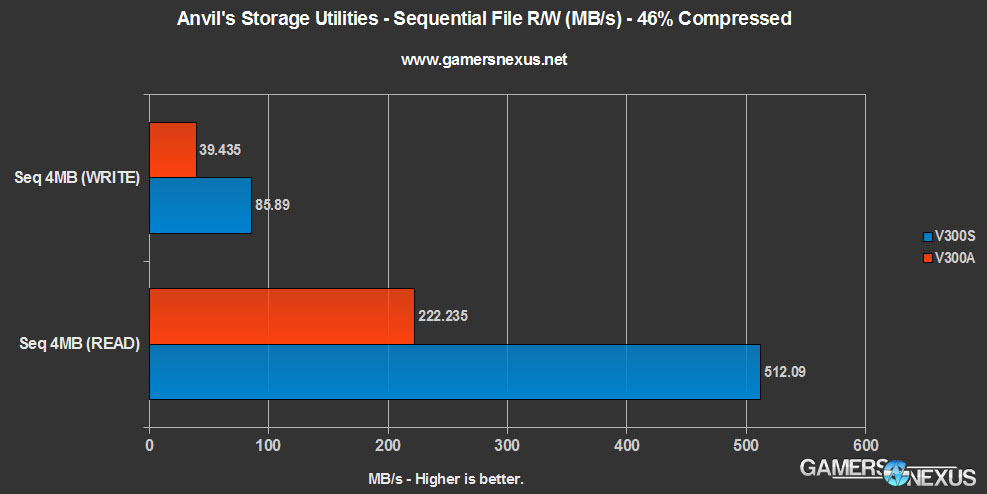
Higher is now better.
It seems that the device with asynchronous NAND suffers severely in large sequential operations and in operations of a long queue depth. Most end-users should be heavily-focused on the 4K random metrics in a QD range of 1-4. Sequential transfers include large file reads and writes, like writing to a movie file (rendering) or copying one elsewhere. These were somewhat touched on in the Premiere and copy tests.
The V300A (current version of the V300) performs just fine for low queue-depth random operations like the 4K QD1 and 32K QD1 passes. Even at QD4 for 4K files, we see reasonable performance, though the gap is more noticeable here.
Iometer reinforces these findings.
Iometer 08 - Random Read & Sequential Tests
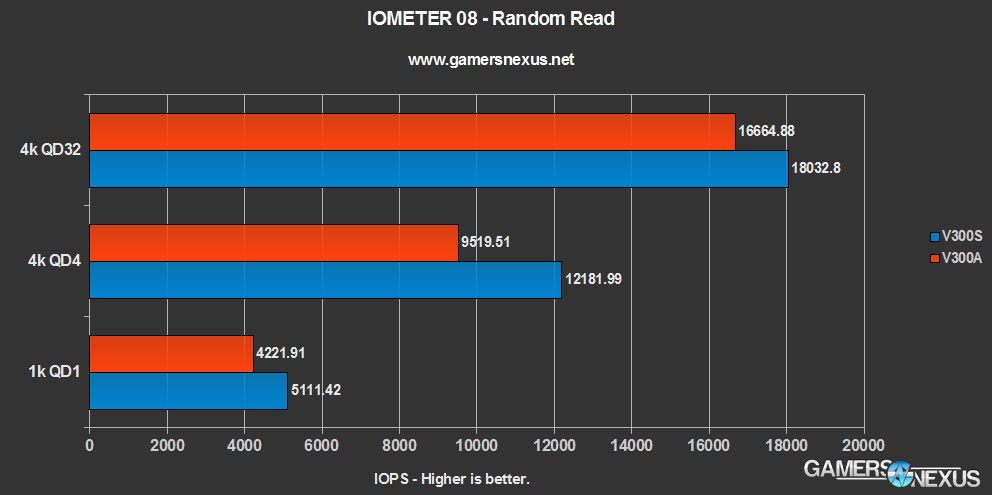
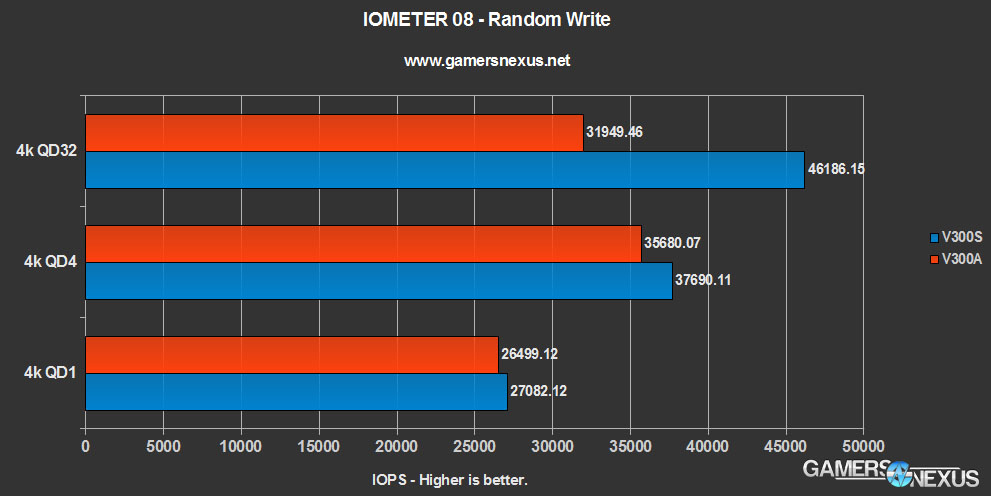
We see similar results in iometer as we did in Anvil's utility, though the numbers are different largely due to the compression (Anvil was 46% compressed) and test method. Again, we see the V300A performs acceptably in read operations of a random nature and in our 1K QD1 "gaming" simulation, but starts suffering in high-QD write operations.
Conclusion: The Impact of a NAND Switch & Lessons Learned
In talking with
All of this in the open, the question still remains as to whether the V300 in its current state is a worthwhile purchase. Here's the thing: The 120GB V300 is available for $75 via Newegg and $70 via Amazon, making it one of the lowest cost-per-GB SSDs on the market (matched against the M500 right now). Its performance was acceptable (comparatively good, even) for every-day use-case scenarios. If you're just browsing, doing office work, and playing a few games, the performance impact of the NAND switch will likely go largely unnoticed. Anyone on a budget that can't tolerate another $10 increase should still consider the V300 and those working on laptops might look into it for basic speed boosts, if not doing heavy-duty work.
That stated,
For an "every-day user," sure, I guess you can save ten bucks with the V300, and that seems to be the audience that
So then, ignoring that aspect and looking strictly at performance, it's still a good product for some users -- it's just gotten a lot of flak for the silent NAND switch that was, in some cases, perhaps undeserved. But when you see a 50% swing in performance for certain data types -- media especially -- it's understandable to see the fierce backlash. The end-all verdict is: Power users - get something better, $10 more is a big difference in performance; mainstream / every-day users - if cost is an obstacle - don't get too hung-up on this.
Please let us know in the comments below if you like this level of depth and research or if you'd prefer to see shorter analysis in the future. If you have other thoughts, would like me to add to this test suite, or have suggestions for the next research/experiment article, please post it!
- Steve "Lelldorianx" Burke.