Anyone who's already seen our exhaustive RX 480 review & benchmark is likely aware of our new noise testing and fan speed vs. time/frequency plots. The video was embedded in that review, but it's worth discussing in greater depth.
The test is a mix of subjective and objective noise analysis. The decibel testing was conducted prior to getting on camera, with a different setup than is shown, but we moved the bench for demonstration purposes (into the video set). Our noise testing methodology is detailed further below. As for the subjective testing – that's the new part.
Subjective noise analysis of cards is important, as our raw decibel output values do not tell the full story (and we don't presently have a good, data-hardened way to plot frequency spectrum analysis). Two fans that operate at 50dB may have completely different noises. One fan might be high pitch in nature – or maybe it's got a high pitched whine accompanying the normal low-frequency whirring – while another fan is low pitch. Depending on the user, the lower pitch fan (despite being equally loud in dB output) will likely be more bearable than an incessant whine.
And so we've spawned these noise tests. We're mostly looking at the new RX 480 8GB card ($240), but added the GTX 1070 FE while at it.
Subjective Testing Methods
In addition to our objective tests, the subjective tests use repeatable methodology to produce equal noise between multiple GPUs and multiple fan speed settings.
We tested with our ZOOM H6N high-end recorder mounted to a tripod. A stereo X/Y mic is mounted to the H6N and pointed toward the center of the video card cooler. Just like the dB meter, we position the mic 20” from the video card, mounted at precisely the same height and angle as for all other tests.
We max-out our X/Y mic input volume and eliminate any hardware-side algorithms that might modify the sound as it comes in (e.g. gain / auto settings / pick-up modulation). This ensures that all the noise is captured at the same levels by the recording device, that the noise is positioned the same distance from the recorder in each test, and that we're capturing the noise dispersion (stereo X/Y is good for this) throughout ambient and not just some pin-pointed output.
Because of all of this, the video rendered demonstrates the noise levels precisely as they would be represented in real-life. Obviously, the actual volume won't be recreated perfectly – that's for a few reasons: (1) Your speakers/headset are neither playing back at “real life volume” nor recreating our environment perfectly, and (2) by nature of recording a sound, we are changing its volume (and, in fact, slightly changing the sound itself). Our methods have kept things as close to the original as is reasonable, and because input levels are constant, the comparative output is usable to determine relative noise between fan RPM settings and against the GTX 1070 Founders Edition card.
Objective Testing Methods
| GN Test Bench 2015 | Name | Courtesy Of | Cost |
| Video Card | This is what we're testing! | - | - |
| CPU | Intel i7-5930K CPU | iBUYPOWER | $580 |
| Memory | Corsair Dominator 32GB 3200MHz | Corsair | $210 |
| Motherboard | EVGA X99 Classified | GamersNexus | $365 |
| Power Supply | NZXT 1200W HALE90 V2 | NZXT | $300 |
| SSD | HyperX Savage SSD | Kingston Tech. | $130 |
| Case | Top Deck Tech Station | GamersNexus | $250 |
| CPU Cooler | NZXT Kraken X41 CLC | NZXT | $110 |
Our noise testing methodology is new and still being revised, but has been kept consistent across all tests contained herein. We test noise in a real-world environment and do not presently use an anechoic chamber. The results align with what consumers will encounter in their own rooms.
We use a REED logging dB meter mounted to a tripod, whose mic is positioned 20” from the face of the GPU (mounted in an open bench). The REED meter is approximately 6” above the bench. All open bench fans are disabled. The Kraken X41 CPU cooling fan is configured to its “silent” mode, minimizing its noise output to be effectively imperceptible.
A noise floor measurement is taken prior to each test's execution to determine ambient without any systems running in the room. We then take an idle measurement (GPU & CPU at idle). Our noise floor has a fluctuation of approximately +/-0.6dB.
Noise levels are logarithmic, and are therefore not as simple to perform delta calculations as thermals or framerates. Noise percent differences are calculated using dB=20*log(V2/V1) (where V is amplitude). You cannot perform a simple percent difference calculation to determine the delta. For an example, a 10dB range (50dB vs. 40dB) is not equal to a 22% delta.
After the noise floor is determined, we log idle fan dB, 50% speed dB, and 100% speed dB (configured in Afterburner). We also measure auto fan dB at an identical stepping for every test; we do this by running Kombustor for exactly 5 minutes prior to beginning dB logging, which is useful for fans which use two push fans. Some dual-push fan cards will only trigger the second fan if the VRM is under load.
And, just in case you missed it, here's the dB chart:
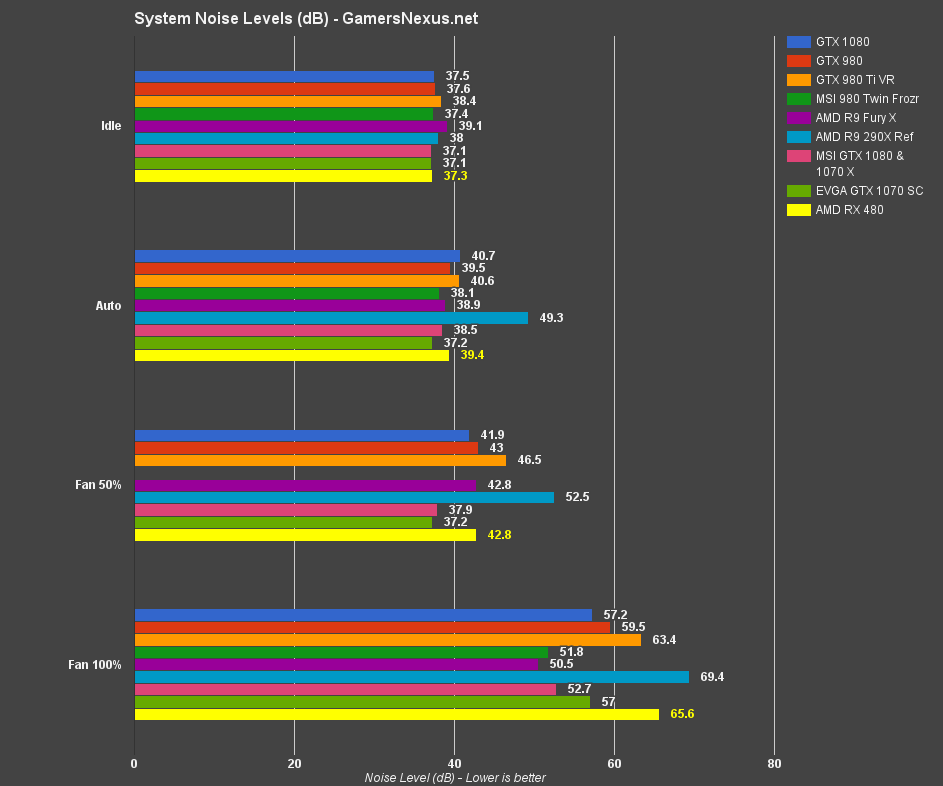
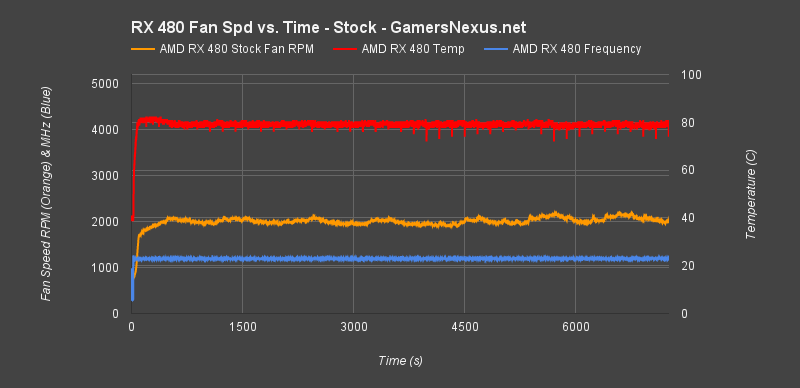
Note that the noise is for system noise levels, not just the GPU fans. And, just for some extra info, here's the RPM, temp, & frequency vs. time chart:
View page 3 of our RX 480 review for more analysis of the noise levels across cards. View the above video to form your own opinions on the various noise levels of the RX 480 and GTX 1070, or check out the review for our reporting!
Editorial: Steve “Lelldorianx” Burke
Video: Andrew “ColossalCake” Coleman