AMD's fanfare surrounding CrossFire with the RX 480s demanded a test of the configuration, and we decided to run the architecturally similar RX 470s through the same ringer. We only have two RX 470s presently in the lab, and they're not the same card – but we'll talk about how that impacts testing in a moment. The cards used are the Sapphire RX 470 Platinum Edition ($200) and the MSI RX 470 Gaming X, tested mostly in DirectX 11 and OpenGL titles, with some DirectX 12 Explicit Multi-GPU testing toward the end.
The benchmark runs a performance analysis of two CrossFire RX 470s versus a single RX 470, single RX 480, CrossFire RX 480s, and the latest GTX cards (1070, 1060). We're looking at framerate and CrossFire power draw here, with no thermal testing. Read our RX 470 review for in-depth thermal and frequency stability analysis (and overclocking).
Previous RX Series Content
AMD RX 460, RX 470, & RX 480 Specs
| AMD RX 480 | AMD RX 470 | AMD RX 460 | |
| Architecture | Polaris 10 | Polaris 10 | Polaris 11 |
| Compute Units (CUs) | 36 | 32 | 14 |
| Stream Processors | 2304 | 2048 | 864 |
| Base / Boost Clock | 1120MHz / 1266MHz | 926MHz / 1206MHz | 1090MHz / 1200MHz |
| COMPUTE Performance | >5 TFLOPS | Up to 4.9TFLOPs | Up to 2.2TFLOPs |
| Graphics Command Processor (GCP) | 1 | 1 | 1 |
| ACEs | 4 | 4 | 2 |
| HWS | 2 | 2 | 2 |
| TMUs | 144 | 128 | 56 |
| ROPs | 32 | 32 | 16 |
| Geometry Processors | 4 | 4 | 2 |
| Peak Texture Filter Rate | 182.3GT/s | 154.4GT/s | 57.6GT/s |
| Peak Pixel Filter Rate | 40.5GP/s | 38.6GP/s | 19.2GP/s |
| L2 Cache | 2MB | ? | 1MB |
| LSU | 576x32b | ? | 256x32b |
| VRAM Capacity | 4GB GDDR5 @ 7Gbps 8GB GDDR5 @ 8Gbps | 4GB GDDR5 | 2GB GDDR5 |
| Memory Interface | 256-bit | 256-bit | 128-bit |
| Memory Speed | 7Gbps (4GB model) 8Gbps (8GB model) | 6.6Gbps | 7Gbps |
| Memory Bandwidth | 224GB/s (4GB model) 256GB/s (8GB model) | 211GB/s | 112GB/s |
| TDP | 150W | 120W* | 75W |
| Power Connectors | 6-pin | 6-pin | None (Slot only) |
| Display Port | 1.3 HBR / 1.4 HDR | 1.3/1.4 HDR | 1.3/1.4 HDR |
| Release Date | June 29 | August 4 | August 8 |
Polaris 10 vs. Polaris 11 Specs & Architecture
| Polaris 10 | Polaris 11 | |
| Compute Units (CUs) | 36 | 16 |
| COMPUTE Performance | “>5 TFLOPS” | “>2 TFLOPS” |
| Memory Interface | 256-bit | 128-bit |
| Architecture | Gen 4 GCN | Gen 4 GCN |
| Playback Support | 4K encode/decode | 4K encode/decode |
| Output Standard | DP1.3/1.4 HDR | DP1.3/1.4 HDR |
Test Setup & Important Notes
This is not an “ideal” test configuration, but it works well for the way we're benchmarking. In an ideal world, you would combine two identical graphics cards for multi-GPU use; after all, the slower card will hinder the faster.
In this benchmark, we're pairing a Sapphire RX 470 4GB card at ~1206-1216MHz with an MSI RX 470 8GB card. All of our single RX 470 benchmarks are presently based only on the Sapphire card, and so we positioned that card in the top slot with CrossFire. This will ensure that, for DirectX 11 and OpenGL games, we're only tapping into the 4GB VRAM capacity and never touching the extra VRAM present on the MSI card. We also validated this methodology by measuring memory controller activity and memory saturation during all tests. This was done on both GPUs.
Our test configuration also ensures that the clock-rate of the two devices is the same as what we tested with the single RX 470, and where necessary, we checked manual controls for further validation.
With all games tested – one exception – this test methodology works as a perfect analog to RX 470 4GB cards in CrossFire, and the results can be read as a definitive conclusion (per game, anyway) of 2x RX 470 4GB performance. The one exception is Ashes of the Singularity, which runs Explicit Multi-GPU and can utilize the MSI card's higher spec, something the other titles could not do (by design). That makes Ashes a non-perfect comparison, but we tested it anyway – it's worth looking at the results regardless. The test data will still be comparable, though not identical in the way that Dx11 & OGL tests are.
We wanted to point all of this out as the test platform, ideally, would run two of the same card – but we didn't get two of the same. The test setup was planned in a way that accounts for the card difference and produces reliable, linearly comparable results across the RX 470 lineup. AoS is the only place where you'd want to take the chart with a grain of salt.
Game Test Methodology
We tested using our GPU test bench, detailed in the table below. Our thanks to supporting hardware vendors for supplying some of the test components.
The AMD 16.7.3 drivers were skipped for testing, following serious stability issues. We used 16.8.1 for the RX 470 graphics card, which were unreleased review drivers at time of writing. 16.7.2 were used for testing GTA V & DOOM (incl. Vulkan patch) on the RX 480. Drivers 16.6.2 were used for all other devices or games. NVidia's unreleased 368.64 drivers were used for game (FPS) testing on the GTX 1060. The 368.69 drivers were used for other devices. Game settings were manually controlled for the DUT. All games were run at presets defined in their respective charts. We disable brand-supported technologies in games, like The Witcher 3's HairWorks and HBAO. All other game settings are defined in respective game benchmarks, which we publish separately from GPU reviews. Our test courses, in the event manual testing is executed, are also uploaded within that content. This allows others to replicate our results by studying our bench courses. In AMD Radeon Settings, we disable all AMD "optimization" of graphics settings, e.g. filtration, tessellation, and AA techniques. This is to ensure that games are compared as "apples to apples" graphics output. We leave the application in control of its graphics, rather than the IHV. In NVIDIA's control panel, we disable G-Sync for testing (and disable FreeSync for AMD).
Windows 10-64 build 10586 was used for testing.
Each game was tested for 30 seconds in an identical scenario, then repeated three times for parity.
Average FPS, 1% low, and 0.1% low times are measured. We do not measure maximum or minimum FPS results as we consider these numbers to be pure outliers. Instead, we take an average of the lowest 1% of results (1% low) to show real-world, noticeable dips; we then take an average of the lowest 0.1% of results for severe spikes.
| GN Test Bench 2015 | Name | Courtesy Of | Cost |
| Video Card | This is what we're testing! | - | - |
| CPU | Intel i7-5930K CPU | iBUYPOWER | $580 |
| Memory | Corsair Dominator 32GB 3200MHz | Corsair | $210 |
| Motherboard | EVGA X99 Classified | GamersNexus | $365 |
| Power Supply | NZXT 1200W HALE90 V2 | NZXT | $300 |
| SSD | HyperX Savage SSD | Kingston Tech. | $130 |
| Case | Top Deck Tech Station | GamersNexus | $250 |
| CPU Cooler | NZXT Kraken X41 CLC | NZXT | $110 |
For Dx12 and Vulkan API testing, we use built-in benchmark tools and rely upon log generation for our metrics. That data is reported at the engine level.
Video Cards Tested
- Sapphire RX 470 Platinum (~$180?)
- MSI RX 480 Gaming X
- MSI GTX 1060 Gaming X ($290)
- NVIDIA GTX 1060 FE ($300)
- AMD RX 480 8GB ($240)
- NVIDIA GTX 1080 Founders Edition ($700)
- NVIDIA GTX 980 Ti Reference ($650)
- NVIDIA GTX 980 Reference ($460)
- NVIDIA GTX 980 2x SLI Reference ($920)
- AMD R9 Fury X 4GB HBM ($630)
- AMD MSI R9 390X 8GB ($460)
- And more
Power Testing Methodology
Power consumption is measured at the system level. You can read a full power consumption guide and watt requirements here. When reading power consumption charts, do not read them as a GPU-specific requirements – this is a system-level power draw.
Power draw is measured during a FireStrike Extreme - GFX2 run. We are currently rebuilding our power benchmark.
Power Draw – CrossFire RX 470s vs. RX 480, 470, SLI 1070s
This is apparent power consumption as measured at the wall. Note the use of the word “apparent” – we're testing for power consumption in volt-amps. Power consumption is measured for peak system load and idle system consumption; we are not measuring individual rails, nor are we measuring individual card power. When looking at this chart, know that you are looking at total system power consumption. The system remains the same between each test, so only the video card changes. This means that we're able to look at deltas for a comparative analysis.
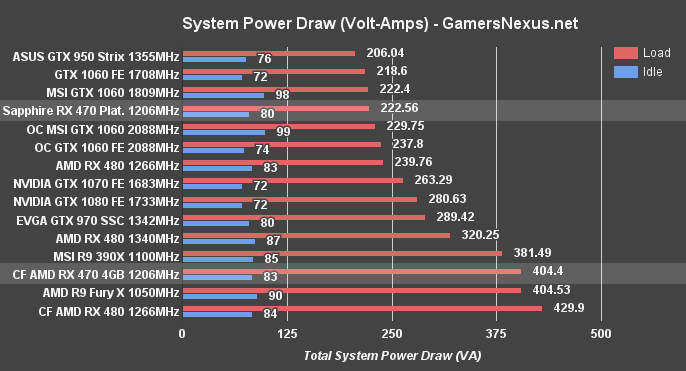
The system power draw with a single RX 470 4GB card was measured at about 222VA under full load, with idle at about 80VA. The RX 470 CF setup was consuming 404VA load, or 83VA idle. Multi-GPU setups are one of the most valid examples of when looking at power draw matters.
Metro: Last Light – 1080p & 1440p – RX 470 CrossFire vs. RX 480 CF, 470, 1070

Metro: Last Light at 1080p with “Very High” quality and “High” tessellation posts a performance output of 109FPS AVG on the CrossFire RX 470 cards, with a 70.7FPS 1% low and 64FPS 0.1% low. For comparison, the RX 470 single card performs at 70.3FPS AVG, around a 40FPS change. That puts the RX 470 CF cards at the level of performance achieved by a GTX 980 Ti and close to a 1070 and RX 480 CF. Interestingly, RX 470s in CF somewhat invalidate the argument for RX 480s in CrossFire with this particular game – but let's look further before reaching a definitive conclusion.
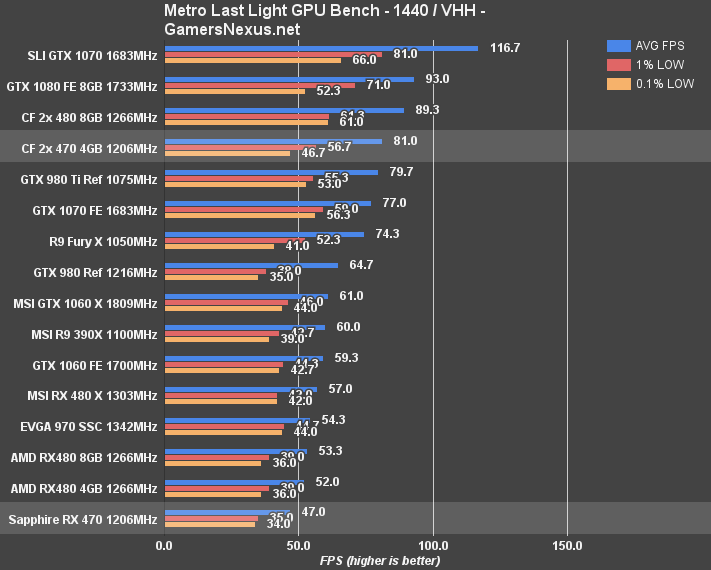
At 1440p for Metro, we're seeing an output of 81FPS AVG for the CF 470s, with a 56.7FPS 1% low and 46.7FPS 0.1% low. For comparison, the single RX 470 performs at 47FPS. The CF RX 480s are at 89FPS AVG. A single GTX 1070 is still outperforming the CF RX 470s in 0.1% lows, though the CrossFire config does gain in averages.
Mirror's Edge: Catalyst – 1080p & 1440p – RX 470 CrossFire vs. RX 480, 1060, 1070
Our previous Mirror's Edge Catalyst test showed negative scaling for the CrossFire RX 480s, and we're still seeing negative scaling with the CF RX 470s – though it's not as fierce as the original CrossFire testing showed. Still, it's better to disable CF for Mirror's Edge Catalyst.
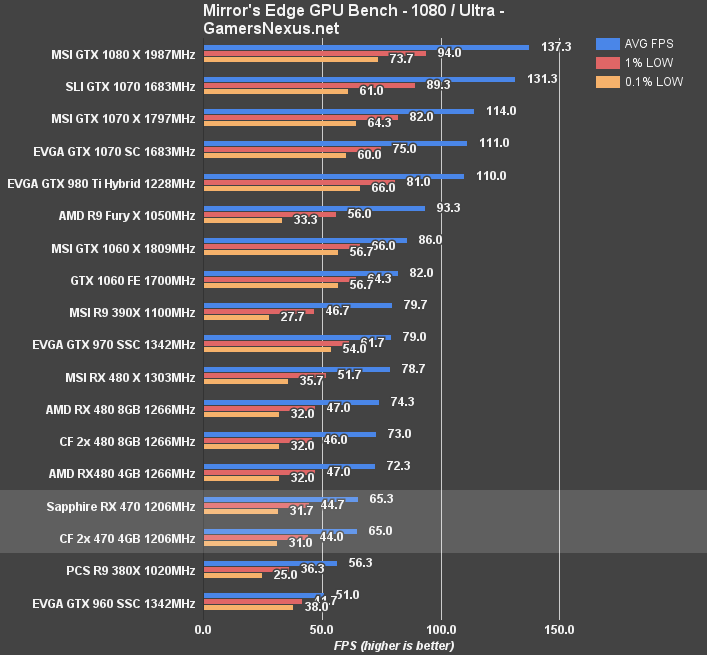
The CrossFire RX 470s are posting 65FPS AVG, with 44FPS 1% lows and 33FPS 0.1% lows. For comparison, the single RX 470 performed at 65.3FPS AVG, with 44.7FPS 1% lows and 31FPS 0.1% lows. The configurations are effectively identical. This is improved, at least, over the initial CF RX 480 test – but it's still not positive, so we'd still be disabling CrossFire for best performance.
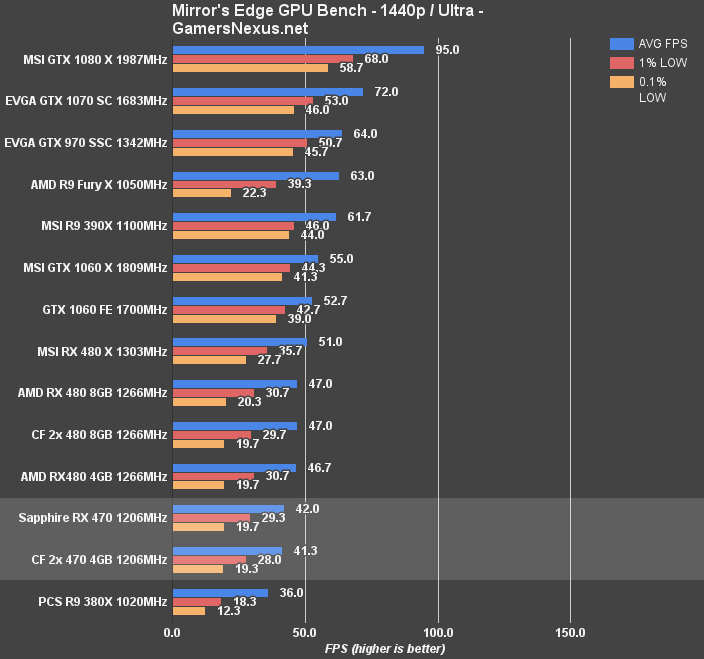
Scaling is mostly the same at 1440p, with the dual cards outputting 41FPS AVG, 28FPS 1% low, and a stuttery 19FPS 0.1% low. The single card pushes 42FPS AVG, 29FPS 1% low, and 19.7FPS 0.1% lows. Again, effectively no difference.
GTA V – 1080p – RX 470 CrossFire vs. RX 480 CF, 470, 1070
GTA V was a nightmare. With the 16.8.1 drivers, which resolved the single RX 480's stuttering issues over 16.6.2, we saw intense microstutter that nuked performance. This same issue was not present on single cards when tested, including the single RX 470; the issue is in the video, if you're curious, and obviously paints a picture of an unplayable game. This is also exactly why we test for 1% and 0.1% lows, because they'll more accurately show the swings.
| CF RX 470 | ||
| Avg FPS | 1.0% low | .1% low |
| 93 | 27 | 20 |
| 102 | 60 | 33 |
| 95 | 30 | 20 |
| Single RX 470 | ||
| Avg FPS | 1.0% low | .1% low |
| 77 | 54 | 50 |
| 77 | 54 | 47 |
| 77 | 54 | 48 |
Here's the raw data for a few test passes – just for the CF cards and the RX 470 single card. You can see the variance with the CF configuration is tremendous, and the lows are dipping hard. Just to reiterate the point: We sometimes have folks comment and challenge our use of the word “unplayable” when referring to high average framerates. For example, this output – even at 93FPS average – is utterly unplayable, but you've got to look at the low metrics to understand why. It's the stutter, as we can show in our video capture.
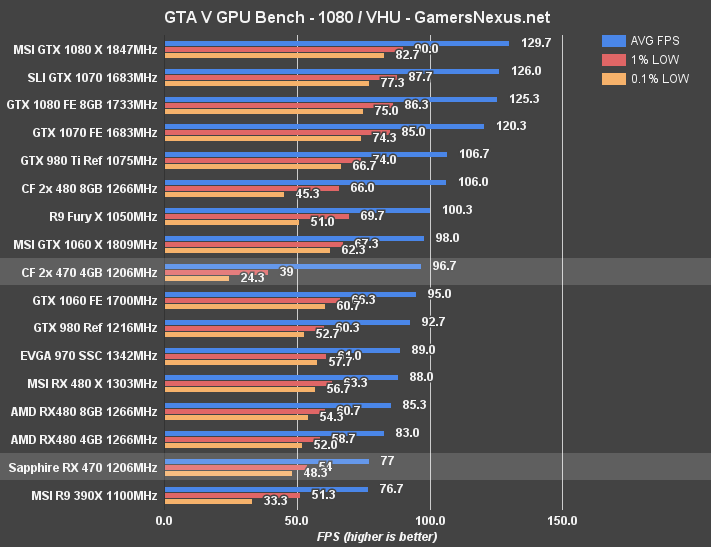
Regardless, here's the normal chart. At 1080p, GTA V operates at about 97FPS AVG, with 1% lows of 39FPS and 0.1% lows of 24FPS. The single RX 470 pushes 77FPS AVG, but has lows of 54 and 48FPS – genuinely playable.
Here's the interesting thing: With its high average, GTA V would actually show some reasonable scaling if AMD works out the drivers to properly support CrossFire. The performance is there, just the frame throughput is too stuttery.
DOOM OpenGL – 1080p & 1440p – RX 470 CrossFire Benchmark vs. 480, 1070

We were not able to get DOOM's Vulkan update running on the CrossFire cards – the screen just went black, and CF has never been well supported here, anyway. The CF cards did technically run with OpenGL. Performance is mostly identical to a single card, with slight negative scaling for the low values – though not in a substantial or generally noticeable fashion. We're at about 75 to 76FPS average for both the single and dual GPU setups.
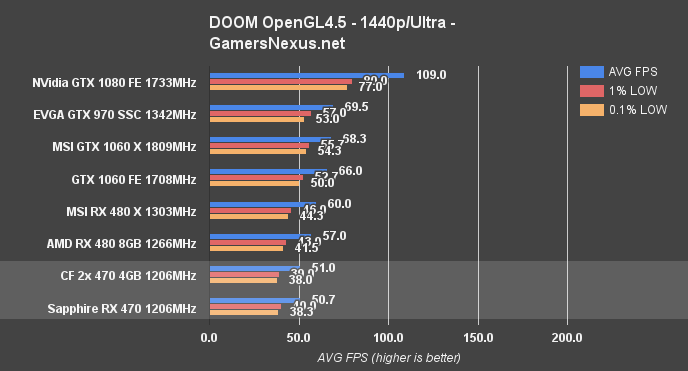
1440p also shows near-0 scaling.
The Division – 1080p & 1440p – RX 470 CrossFire FPS vs. 480, 480 CF, 1070, 1080
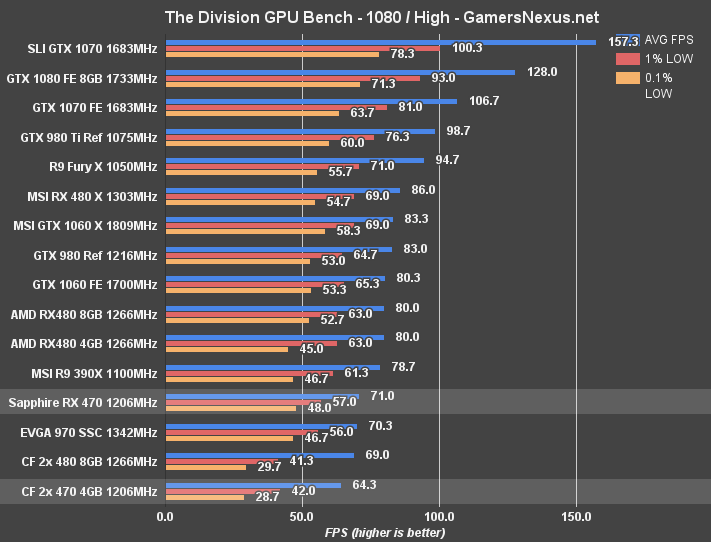
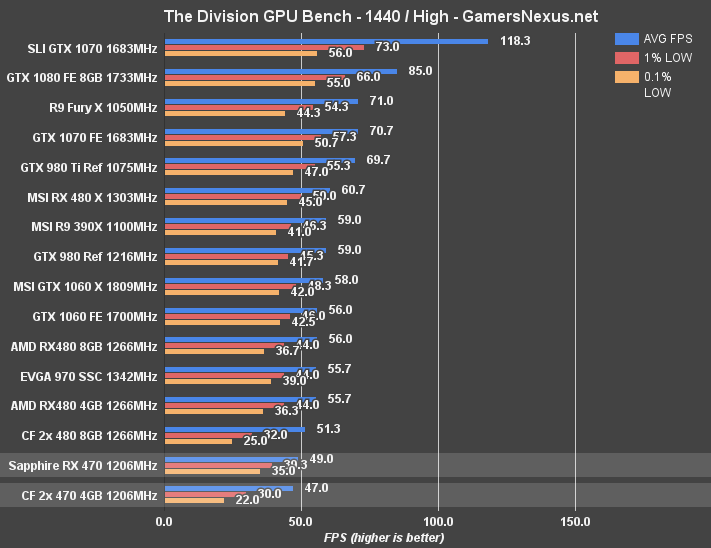
The Division also has negative scaling with CrossFire. We're looking at about 64FPS AVG for the CF RX 470s, with lows in the 30s, while the single card outputs 71FPS AVG and 48FPS 0.1% low. This is about the same as what we saw with the RX 480s in CF.
Ashes of the Singularity Dx12 & Dx11 – RX 470 CrossFire
Ashes of the Singularity has some special conditions with its Explicit Multi-GPU, namely that the second card (the MSI RX 470) will be more properly utilized in Dx12 than in the previous Dx11/OGL tests. Bear this in mind. An actual 2x Sapphire Platinum setup would perform at least marginally less, though we are not sure how heavy the impact would be without testing.
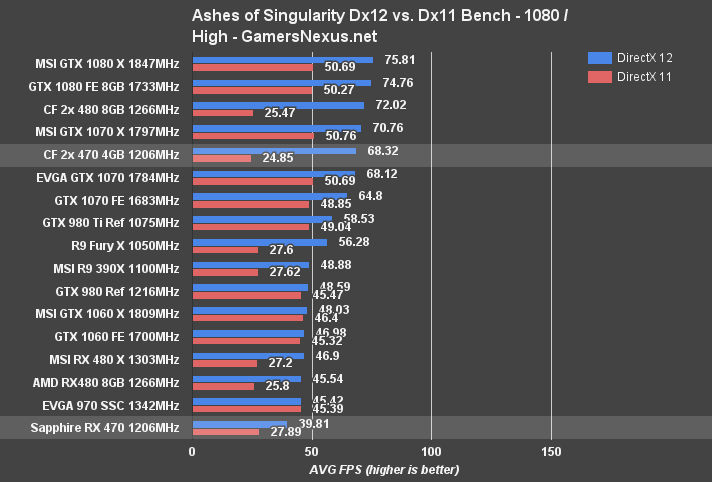
Performance of the CF RX 470s shows positive scaling with Ashes – enough to push the two cards above the GTX 1070 (marginally) when in CrossFire and DirectX 12. That stated, the RX 470s do get trounced in DirectX 11, showing negative (or, at best, zero) scaling. We analyze AoS more in our RX 470 review.

Here's the average latency chart (ms between frames, averaged) for another means of looking at data. Lower is better.
Conclusion: Is CrossFire Worth it for the RX 470?
For positive scaling, we have to look at games like Metro: Last Light, Black Ops, and GTA V – though GTA had the microstutter issue. You'd also see positive scaling with Shadow of Mordor, but we didn't retest that title here.
We reach the same conclusion as previously: Multi-GPU scaling is often mixed in its support. Developers of software and games must support multi-GPU, not just the drivers – though that's got to be there, too. We're seeing about equal negative and positive scaling with CrossFire, and the positives are sometimes small enough that the value proposition loses its argument. In instances of intense microstutter (GTA V) or negative scaling, you'd be disabling the second GPU. We have stated this recently for SLI and CrossFire setups; this is not an exclusive problem to AMD. As it stands today, we do not recommend SLI or CrossFire for most users. If there is a very specific game you're playing heavily that actually sees reasonable benefit – one which is not beaten by just buying a higher-end card, like a 1070, then maybe it's worth it. Otherwise, for a wider spectrum of games, we still recommend a single card configuration as the most reliable and cost effective option.
Production users might be able to argue that the second GPU would assist with Blender or similar OpenCL render workloads, where graphics crunching is sectioned off into independent tiles for GPU rendering. Such a user would be able to occasionally enable CF for gaming, if the game supports, though it'd really just be a bonus and should not be the core reason for a purchase. The power argument also must be looked into if working in a production/business environment, as 1.8x VA draw will impact the power bill if deploying for constant 100% render workloads.
Editorial, Test Lead: Steve “Lelldorianx” Burke
Video Producer: Andrew “ColossalCake” Coleman
Sr. Test Technician: Mike “Budekai?” Gaglione
Test Technician: Andie “Draguelian” Burke