To use any processing product for six years is a remarkable feat. GPUs struggle to hang on for that amount of time. You’d be reducing graphics settings heavily after the second or third year, and likely considering an upgrade around the same time. Intel’s CPUs are different – they don’t change much, and we almost always recommend skipping at least one generation between upgrades (for the gaming audience, anyway). The 7700K increased temperatures substantially and didn’t increase performance in-step, making it a pointless upgrade for any owners of the i7-6700K or i7-4690K.
We did remark in the review that owners of the 2500K and 2600K may want to consider finally moving up to Kaby Lake, but if we think about that for a second, it almost seems ridiculous: Sandy Bridge is an architecture from 2011. The i5-2500K came out in 1Q11, making it about six years old as of 2017. That is some serious staying power. Intel shows gains less than 10% generationally with almost absolute certainty. We see double-digits jumps in Blender performance and some production workloads, but that is still not an occurrence with every architecture launch. With gaming, based on the 6700K to 7700K jump, you’re lucky to get more than 1.5-3% extra performance. That’s counting frametime performance, too.
AMD’s architectural jumps should be a different story, in theory, but that’s mostly because Zen is planted 5 years after the launch of the FX-8350. AMD did have subsequent clock-rate increases and various rebadges or power efficiency improvements (FX-8370, FX 8320E), but those weren’t really that exciting for existing owners of 8000-series CPUs. In that regard, it’s the same story as Intel. AMD’s Ryzen will certainly post large gains over AMD’s last architecture given the sizeable temporal gap between launches, but we still have no idea how the next iteration will scale. It could well be just as slow as Intel’s scaling, depending on what architectural and process walls AMD may run into.
That’s not really the point of this article, though; today, we’re looking at whether it’s finally time to upgrade the i5-2500K CPU. Owners of the i5-2500K did well to buy one, it turns out, because the only major desire to upgrade would likely stem from a want of more I/O options (like M.2, NVMe, and USB3.1 Gen2 support). Hard performance is finally becoming a reason to upgrade, as we’ll show, but we’d still rank changes to HSIO as the biggest driver in upgrade demand. In the time since 2011, PCIe Gen3 has proliferated across all relevant platforms, USB3.x ports have increased to double-digits on some boards, M.2 and NVMe have entered the field of SSDs, and SATA III is on its way out as a storage interface.
Clock-rate, sure – that’s increased a bit. Process technology has gone through shrinks. TDP has managed to stay the same while relative performance increases. All good things, of course, but generally not the most exciting.
With the last two generations, we’re seeing reason to actually upgrade for gaming performance. That’s what we’re going through today.
In this revisit of the Intel i5-2500K, we’ll be testing the Sandy Bridge CPU’s staying power into 2017 by testing Blender rendering speed, a handful of modern games, and running some synthetic numbers. This testing is limited to just performance, with no discussion of power or thermals for the revisit. We’ll leave that to the reviews of new CPU SKUs. Temperature and power draw numbers have not changed since the launch of the i5-2500K, and so we’re not re-testing those.
We’ll most specifically be looking at the Intel i5-2500K vs. i5-7600K, i5-6600K, and i5-4690K. The 3570K is also included. We test overclocking configurations for most benchmarks.
We Are Still Adding CPUs to the Bench
Our i7-7700K review focused entirely on the i7 family of CPUs. We did not test a single i5, i3, or FX product for that review, entirely because of time (against CES) and as a judgment call that we wanted to focus on one family. We’ve now expanded to add i5 CPUs to our benchmark charts. We’ll soon be adding the i3 series from Intel and some FX series hangers-on from AMD, as we’re preparing for the inevitable Ryzen review and Intel i3 Kaby Lake reviews.
CPU Testing Methodology
Game Test Methodology
NVIDIA 376.33 drivers were used for benchmarking. Game settings were manually controlled for the DUT. All games were run at presets defined in their respective charts. All other game settings are defined in respective game benchmarks, which we publish separately from GPU and CPU reviews. Our test courses, in the event manual testing is executed, are also uploaded within that content. This allows others to replicate our results by studying our bench courses.
Windows 10-64 build 10586 was used for testing.
Each game was tested for 30 seconds in an identical scenario, then repeated three times for parity.
Some benchmarks disable EIST, Turbo, and other features -- please check each section to learn if that is the case. Otherwise, for game benchmarks, assume stock settings (Turbo enabled). We always disable C-states.
Average FPS, 1% low, and 0.1% low times are measured. We do not measure maximum or minimum FPS results as we consider these numbers to be pure outliers. Instead, we take an average of the lowest 1% of results (1% low) to show real-world, noticeable dips; we then take an average of the lowest 0.1% of results for severe spikes.
Core Components (Unchanging)
- NZXT 1200W Hale90v2
- For DDR4 platforms: Corsair Vengeance LPX 32GB 3200MHz
- For DDR3 platforms: HyperX Savage 32GB 2400MHz
- Intel 730 480GB SSD
- Open Air Test Bench
- Cooler #1 (Air): Be Quiet! Dark Rock 3
- Cooler #2 (Cheap liquid): Asetek 570LC w/ Gentle Typhoon fan (this is the one we used for this particular article)
- Cooler #3 (High-end): Kraken X62
Note: fan and pump settings are configured on a per-test basis.
Z270 Platforms:
- MSI Gaming Pro Carbon
- i7-7700K (x2) samples from motherboard vendors
- i5-7600K purchased by GN
Z170 Platform:
- MSI Gaming M7
- i7-6700K retail
- i5-6600K
Z97 Platform:
- Gigabyte Z97X G1 WIFI-BK
- i7-4790K
- i5-4690K
Z77 Platform:
- MSI GD65 Z77
- i7-2600K
- i5-2500K
- i5 3570K
Dx12 games are benchmarked using PresentMon onPresent, with further data analysis from GN-made tools.
Continue to the next page for Blender, FireStrike, and TimeSpy benchmarks.
Intel i5-2500K Blender Benchmark vs. 7600K, 6600K, 4690K, 3570K
Our Blender benchmarking is defined on Page 1 (see: CPU Testing Methodology), and has been deployed since the i7-7700K review that we recently posted. The benchmark process is to render a single frame of a 4K image that GN’s Andrew Coleman created, including several different effects and material types that impact render performance. The final image is shown below, for the curious. We’re processing fur (bottom left), motion blur (bottom middle), transparency, reflectivity and ray traces, and solid materials.
Each monkey has different effects applied, all stressing the components in different ways. During GPU rendering, for instance, the fur monkey stresses GPU memory in unique ways.

Intel i5 vs. i7 Rendering Performance
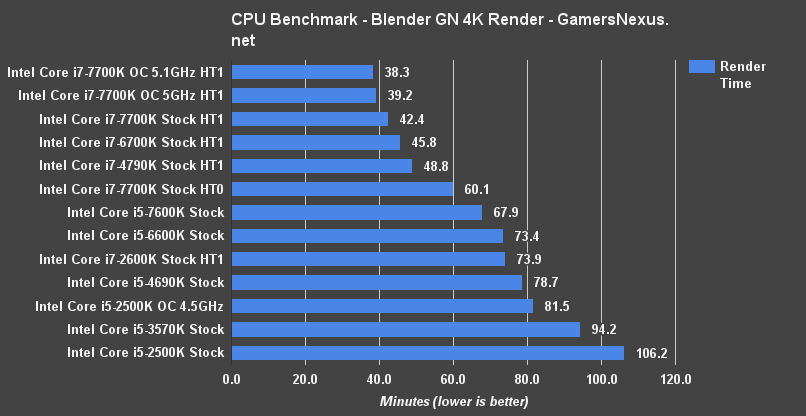
As the chart demonstrates, this is a benchmark where multithreaded CPUs really shine. The additional threads are fully utilized for each 16x16 tile that we render, so 2x the threads equates 2x the active in-flight tiles being rendered. We already talked i7 numbers in our 7700K review, so let’s focus on the Core i5 CPUs.
The Intel i5-2500K with stock frequency settings is able to render our scene in 106 minutes, making it the slowest device on the bench by a long-shot. The 3570K CPU, released in 2Q12, completes the frame in 94 minutes. A modern CPU, like last gen’s i5-6600K, is able to complete the task in 73 minutes. That’s about 30 minutes faster than the 2500K, or a reduction of about 31% time required. If you’re rendering using the CPU – as you might do if running both the GPU and CPU on a render task – then the upgrade is clearly substantial.
To provide some perspective for Sandy Bridge, the same-gen Core i7-2600K can render the scene in about the same time as the i5-6600K ($240) at 74 minutes. If you bought an i7-2600K back in the day, you’re still in decent shape in this particular benchmark. At least, compared to the i5 CPUs.
A trivial overclock to 4.5GHz on the i5-2500K moves us up to an 82-minute render time -- absolutely a worthwhile improvement, if you’re stuck on this CPU and rendering things.
Cinebench i5-2500K vs. 7600K, 6600K, 7700K Benchmarks
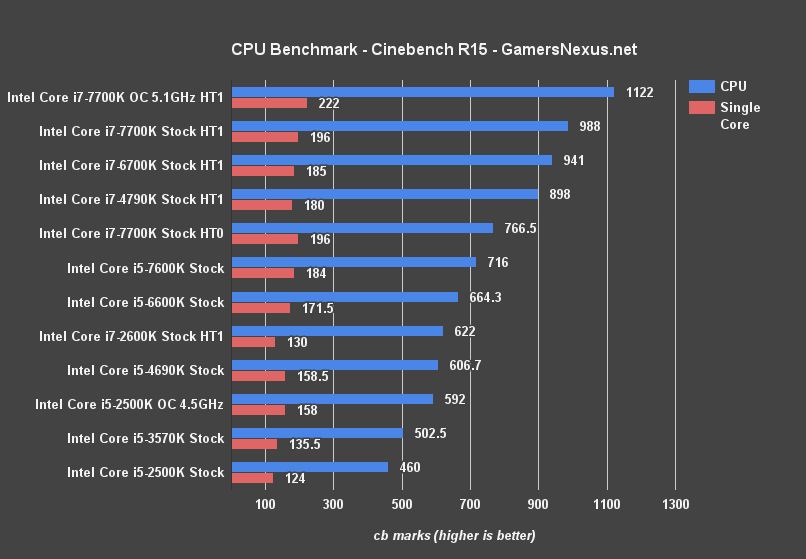
Using Cinebench for some quick synthetics, we’re seeing the i5-2500K operate expectedly at the bottom of the bench. The 2500K is pushing single-core performance at 124 cb marks, with multi-core at 460 marks. The overclocked variant at 4.5GHz performs ahead of the i5-3570K stock CPU, and just under the i5-4690K ($240) in single-core and multi-core performance.
3DMark FireStrike – i5-2500K vs. i5-7600K, 6600K, 4690K
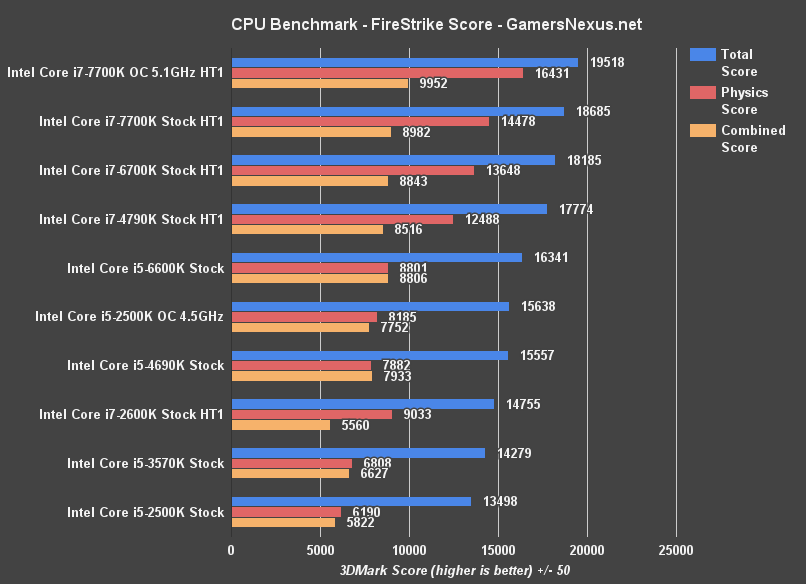
3DMark FireStrike is posting the i5-2500K at 13498 total points, or 6190 on physics. That’s the score we care most about, since it isolates the CPU. The i5-3570K saw marginal improvements to 6808, and the 2600K is pretty heavily improved in physics with its 9033 score.
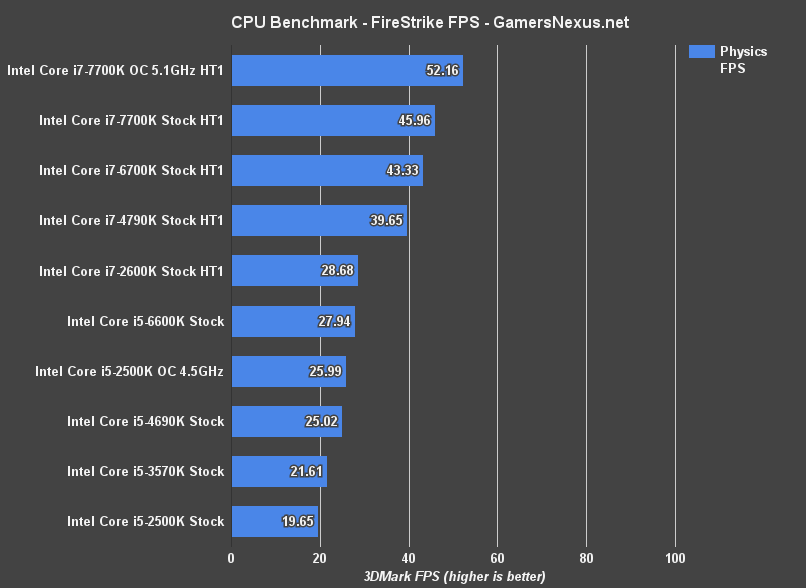
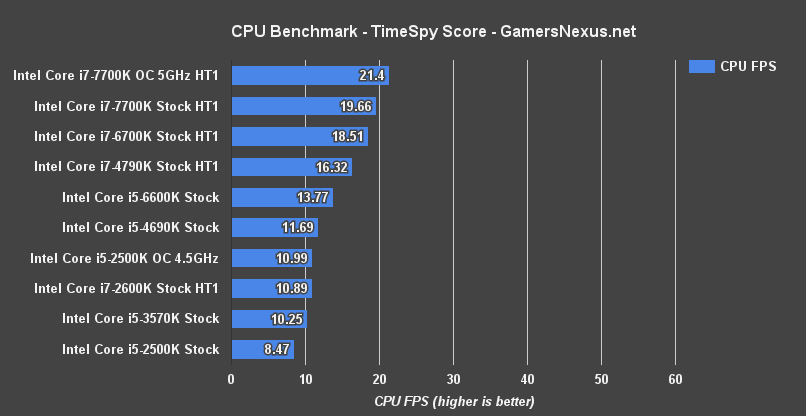
As for what this means in practice, here’s the 3DMark FPS output. We’re seeing a physics FPS of 19.7 on the i5-2500K, compared to 26FPS when overclocked. Thje i5-3570K and i5-4690K both fall between the stock and overclocked i5-2500K. There’s some variance to testing with 3DMark, but these results are reliable.
3DMark TimeSpy – i5-2500K vs. i5-7600K, 6600K, 7700K, etc.
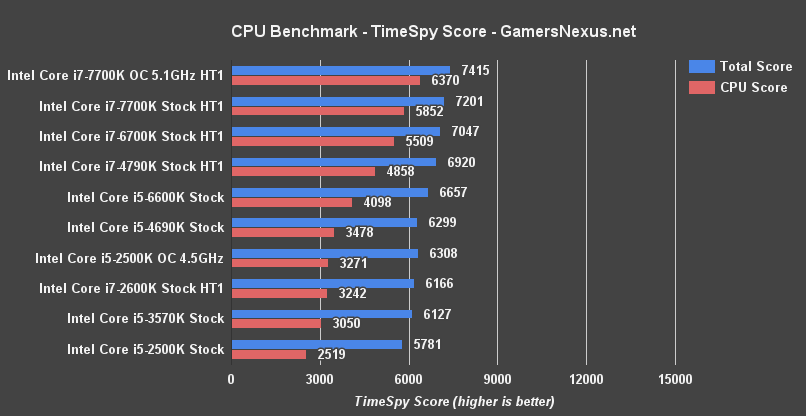
For 3DMark TimeSpy as a lower level API test, we’re seeing the i5-2500K score at 2519 points, where the 3570K sits at 3050 points and the 6600K is at 4098 points. Overclocking the i5-2500K lands us at 3271 points (versus 2519), which plants the 2500K OC above the stock 2600K and 3570K, and just below the i5-4690K. Overclocking gains a lot of ground in these particular tests.
That’s all synthetic; of course, there’s only so far we can get with synthetics. We’ve got TimeSpy benchmarks in the article linked below, if you’d like to see more synthetics, but let’s move on to FPS benchmarks for now.
Continue to Page 3 for gaming benchmarks of the i5-2500K.
CPU benchmarking can be handled a lot of different ways for game tests. We’ve got the obvious option of singling-out applications which are fully CPU dependent – like the Total War games, where GPU has less impact – or we can throw-in mixed workloads and GPU workloads. The former makes the most sense from a strict methodological standpoint, while the latter provides a look at limitations of CPU scaling when considering the more realistic user scenario of mixed workload / GPU workload games.
We test using both approaches, with CPU-heavy titles providing the most ‘stretched-out’ look at CPU limitations and mixed workload titles (Watch Dogs 2) providing a realistic look at CPU/GPU limitations. Test methodology is defined on the first page, if you’d like more information on the setup.
Watch Dogs 2 Benchmark Performance with i5-2500K vs. 7600K, 6600K, i5 vs. i7
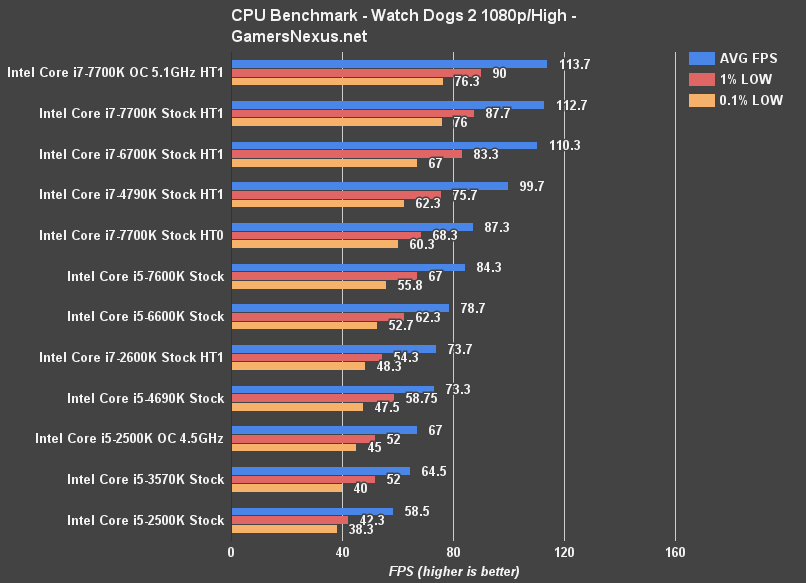
Starting with Watch Dogs 2, we can now reveal why we added this game to our CPU benchmarking workload. With the high-end i7 CPUs, we undoubtedly begin to battle with other system resources – like the GPU, even though it’s a GTX 1080 FTW ($590) – and that means the difference between the Skylake and Kaby Lake i7 CPUs is harder to detect. As we scale down, though, the CPU choke becomes clear.
The i5-2500K is limiting our GTX 1080 FTW to 59FPS AVG when at 1080p with High settings, a card which is capable of achieving nearly 2x that performance when using the latest i7 CPUs. If you’re running a stock i5-2500K, this is about the maximum performance you can expect on our particular benchmark course. Frametime performance isn’t exactly bad, it just scales linearly with the average.
The i5-3570K shows a reasonable improvement, but even that gain is outdone by an overclock on the 2500K to 4.5GHz. This isn’t hard to do and can be held at around 1.3v, though your mileage may vary, and produces higher averages and 0.1% lows than the 3570K.
More interestingly, we see the same-gen i7-2600K really stretch its legs in Watch Dogs 2, producing an additional 15 or so frames per second than the 2500K. This is where you get your value in those i7 purchases – better longevity – and is probably one of the most interesting stories here. We’ll soon see if that carries over to other games, though.
With Watch Dogs 2, we’re generally seeing that multi-core CPUs are advantaged. The i5-4690K and 4790K have a sizeable gap between them as well, something we’ll talk about in another content piece.
But as for the 2500K versus a modern CPU purchase, linear upgrades would land you on a 7600K or 6600K, both of which produce an additional 20FPS or greater average framerate throughput. Frametimes improve in step with this.
Watch Dogs is a game where you could get by at 40-45FPS if you weren’t a stickler about hitting 60, but the point is that an upgrade would better allow for higher graphics settings.
These results are genuinely pretty exciting to study, since the differences are so measurably apparent between all the devices tested. That’s not always the case. Let’s move on to another game and see if that continues.
Intel i5-2500K in Battlefield 1 FPS Benchmark vs. 7600K, 6600K, i7 CPUs
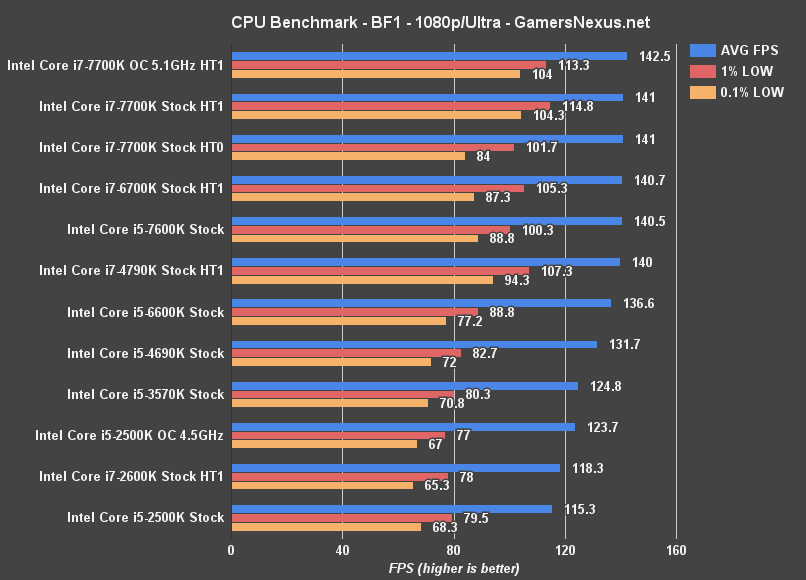
Battlefield 1 doesn’t show much change at the very high-end, where our 1080p/Ultra settings are landing the Kaby Lake, Skylake, and Devil’s Canyon i7 CPUs all roughly in the same performance range. Where we do see the change, though, is dropping down to the 2500K CPU. The 2500K still performs reasonably well in BF1, despite becoming a bottleneck to the 1080 FTW, and is operating at 115FPS AVG with the overclocked version at 124FPS AVG.
The 3570K performs about where the overclocked 2500K performs, and the 4690K starts pulling away from the 2500K in a more dramatic fashion. The CPU is certainly slower, but still keeps up pretty well in Battlefield 1. Only if you’re pushing for higher refresh gameplay or upgrading into 1070 and 1080 class hardware will a bottleneck be noticeable.
Unlike Watch Dogs 2, the difference between the i7-2600K and i5-2500K is not as substantial.
Total War: Warhammer Benchmark – i5-2500K vs. 7600K, 6600K, 4690K
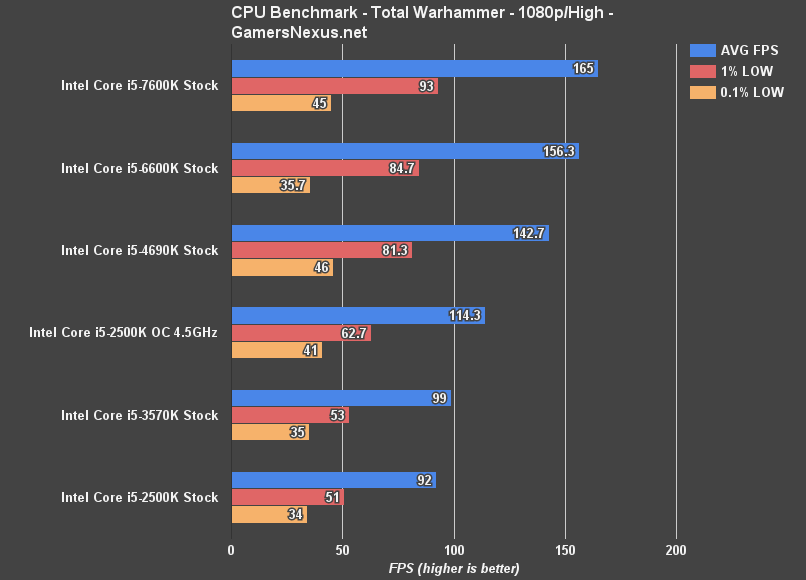
Total War is new to our CPU bench, and thus far only features the i5 series CPUs. Before diving in, note that Total War does output framerates with a good amount of variance in the worst frametimes. This means we won’t really be using the 0.1% metric as much, since it fluctuates pass-to-pass and seems inconsistent overall. We’re also only testing with DirectX 11, because the DirectX 12 beta version of the game just isn’t as performant as the Dx11 version.
We’re seeing the i5-2500K perform at about 92FPS with 1080p and High settings for this benchmark. Overclocking provides substantial gains, pushing us up to 114FPS AVG and with bolstered frametimes. The performance improvement is about 24% -- absolutely worth the overclock.
Looking to modern CPUs, the 6600K is capable of operating at 156FPS AVG, with the 7600K at 165FPS AVG. From the 2500K to the 7600K, we’re seeing a stock clock-rate difference totaling 73FPS AVG, or a percentage increase of about 80%.
GTA V Benchmark with i5-2500K, 7600K, 6600K, 6700K, 3570K
The final benchmark is GTA V. Big note for this one: We had some confusing issues with the 6600K and 7600K that didn’t seem to affect other CPUs, and even took to Twitter to ask about this. Jay reported something similar, as did a few of our readers, and we’ve been unable to fully figure it out yet.
So far, it seems like the 6600K and 7600K have worse stuttering with our GTA V deployment than other CPUs, and this seems to be less of an ordeal when dropping XMP on the memory. Still, there’s a lot of research to do.
We haven’t got it fully figured out yet, re: 6600K & 7600K. We’ve reinstalled Windows, the game, and done all manner of testing to ensure it’s not on our end. Just wanted to point that out before we get to the results. We’ve done due diligence to figure it out, but just haven’t yet. If anyone’s got thoughts, post them below! We’ve tried XMP settings, overclocking and downclocking, new memory, motherboards, PSUs. Some of our followers and colleagues in the industry reported that they’ve seen similar issues when we asked on twitter.
As for the rest of the results, we know those are all accurate as ever – it’s just the 6600K and 7600K that we’re having trouble with.
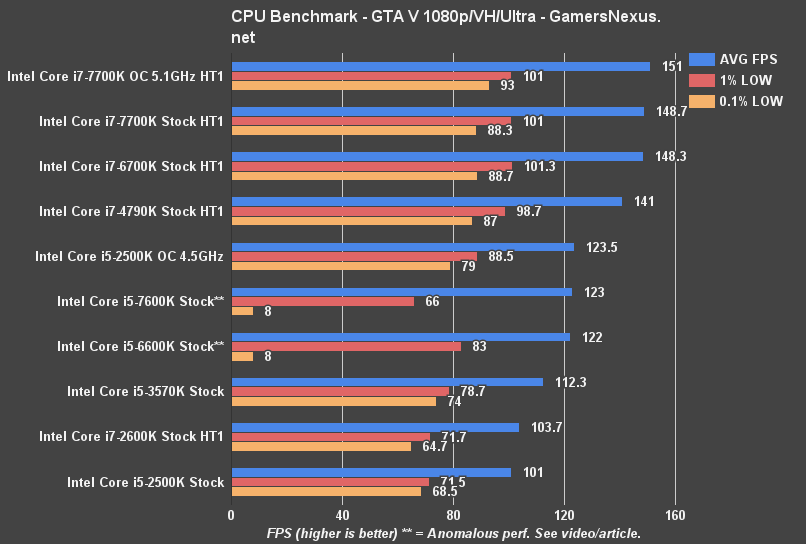
OK, so the charts. We’re looking at an average FPS of 101 with the i5-2500K, with overclocking pushing us to an impressive 124FPS AVG. Compared to the i7-2600K, there’s not a lot of advantage in GTA V from the extra threads. We’re seeing frequency seems to provide the biggest impact to performance, for the most part. The i5-3570K operates about 11FPS faster than the stock i5-2500K.
Ashes of the Singularity – i5-2500K vs. 7600K, 2600K, 3570K, 6600K, etc.
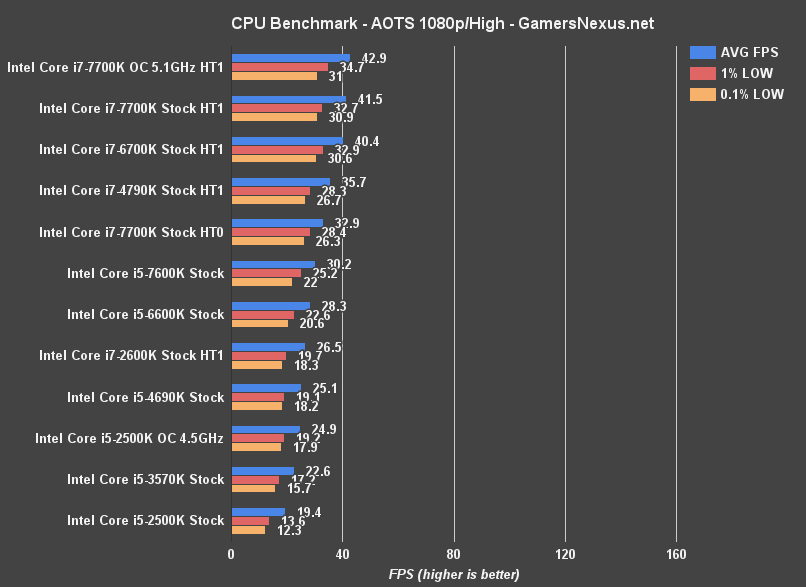
Ashes of the Singularity with Dx12 and the CPU-focused benchmark positions the CPUs as we’d expect, based on Battlefield 1, Watch Dogs 2, and synthetic tests. We’re seeing the i5-2500K outperformed about two-fold by the modern i7 CPUs (6700K, 7700K), with the i5-7600K about 10FPS over the 2500K stock (~55% difference).
Overclocking the 2500K nets us a performance boost that plants the CPU between the 3570K and 4690K stock CPUs, showing again that an OC may actually be worthwhile on SNB platforms.
AOTS clearly favors multithreading, as Watch Dogs 2 did. The i7 CPU stack-up is interrupted only by the 2600K’s lower placement, clearly a result of the aged architecture and slower clock-rate of the SNB chip.
Metro: Last Light – i5-2500K vs. 2600K, 3570K, 4690K, 7600K
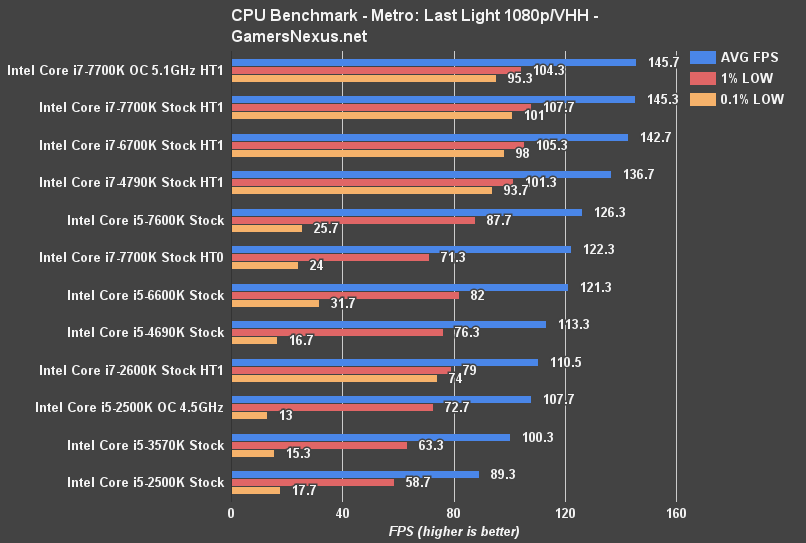
As has historically been the case for Metro: Last Light, we are seeing the i5 CPUs (and i7s with hyperthreading disabled) struggle in the frametime department, failing to achieve even half of what the i7 CPUs can output for 0.1% low FPS.
The i5-2500K stock operates an average of nearly 90FPS – really not bad, but there’s a big bottleneck here placed on the GTX 1080 FTW. The bottleneck isn’t overcome until we start hitting the high-end i7 devices, like the i7-7700K (stock or overclocked). Overclocking the i5-2500K to 4.5GHz gives us a significant FPS gain (~+20%), planting the i5-2500K ahead of the i5-3570K (though low FPS does have some trouble as we approach stability limits), and landing below the i5-4690K.
Conclusion: Is It Worth Upgrading from an i5-2500K to 7600K or Zen?
The i5-2500K has held up relatively well over the past five years, but it’s starting to show some serious age in a few specific games. Watch Dogs 2, for one, posts sizeable differences between modern CPUs and the 2500K – though multi-core seems to matter more for that particular title.
We’re also seeing big gains from overclocking in a lot of games, especially because the 2500K was so easy to overclock. If you’ve got one, it might be worth throwing it under a good cooler and pushing it to 4.5GHz for the remainder of its life.
Blender and rendering tasks are particularly abusive to the i5-2500K, which is being outpaced nearly two-fold by modern successors.
As for upgrades, if you can grab an Intel i5-6600K ($239) for a good bit cheaper than a Kaby Lake i5-7600K ($242), it might be a worthwhile upgrade. The 7600K is also worth looking into, potentially, but wait for our forthcoming review on that before making any purchases.
It’s a good time to upgrade from the 2500K, though it is still hanging in there pretty well. We don’t know what Zen’s / Ryzen’s performance will look like just yet, but we do know that it should be shipping in late February. Normally, we don’t advise waiting for upgrades since you could wait forever with hardware. Zen is very close at this point, though, and seems like it’d be good to wait on. Give it another month and we’ll revisit this topic. At that point, it’s either on to the 7600K, a used 4690K or 6600K, or some Zen equivalent.
Editorial, Test Lead: Steve “Lelldorianx” Burke
Video Production: Andrew “ColossalCake” Coleman
Test Technician: Patrick “Germ King” Lathan