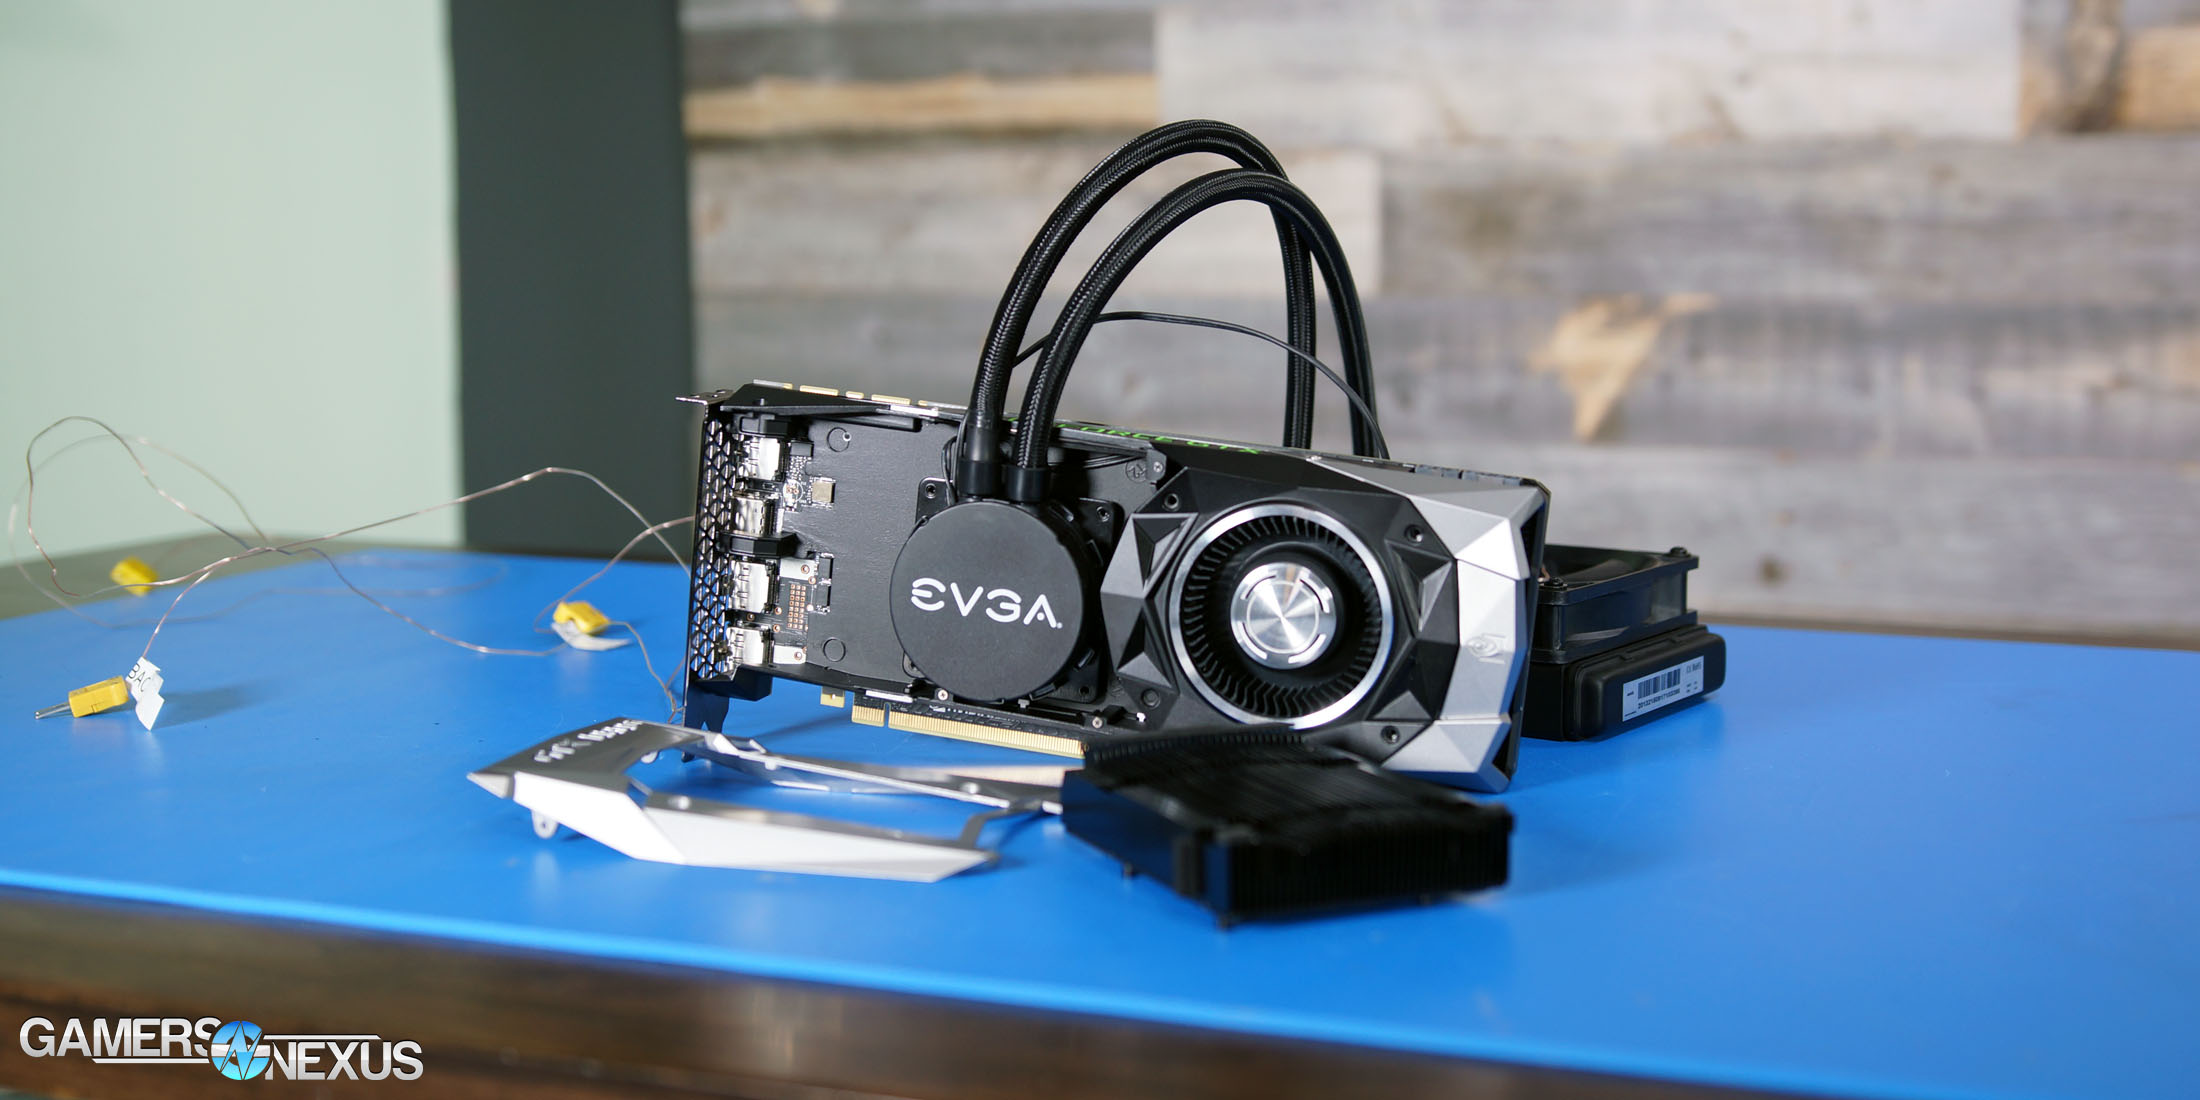
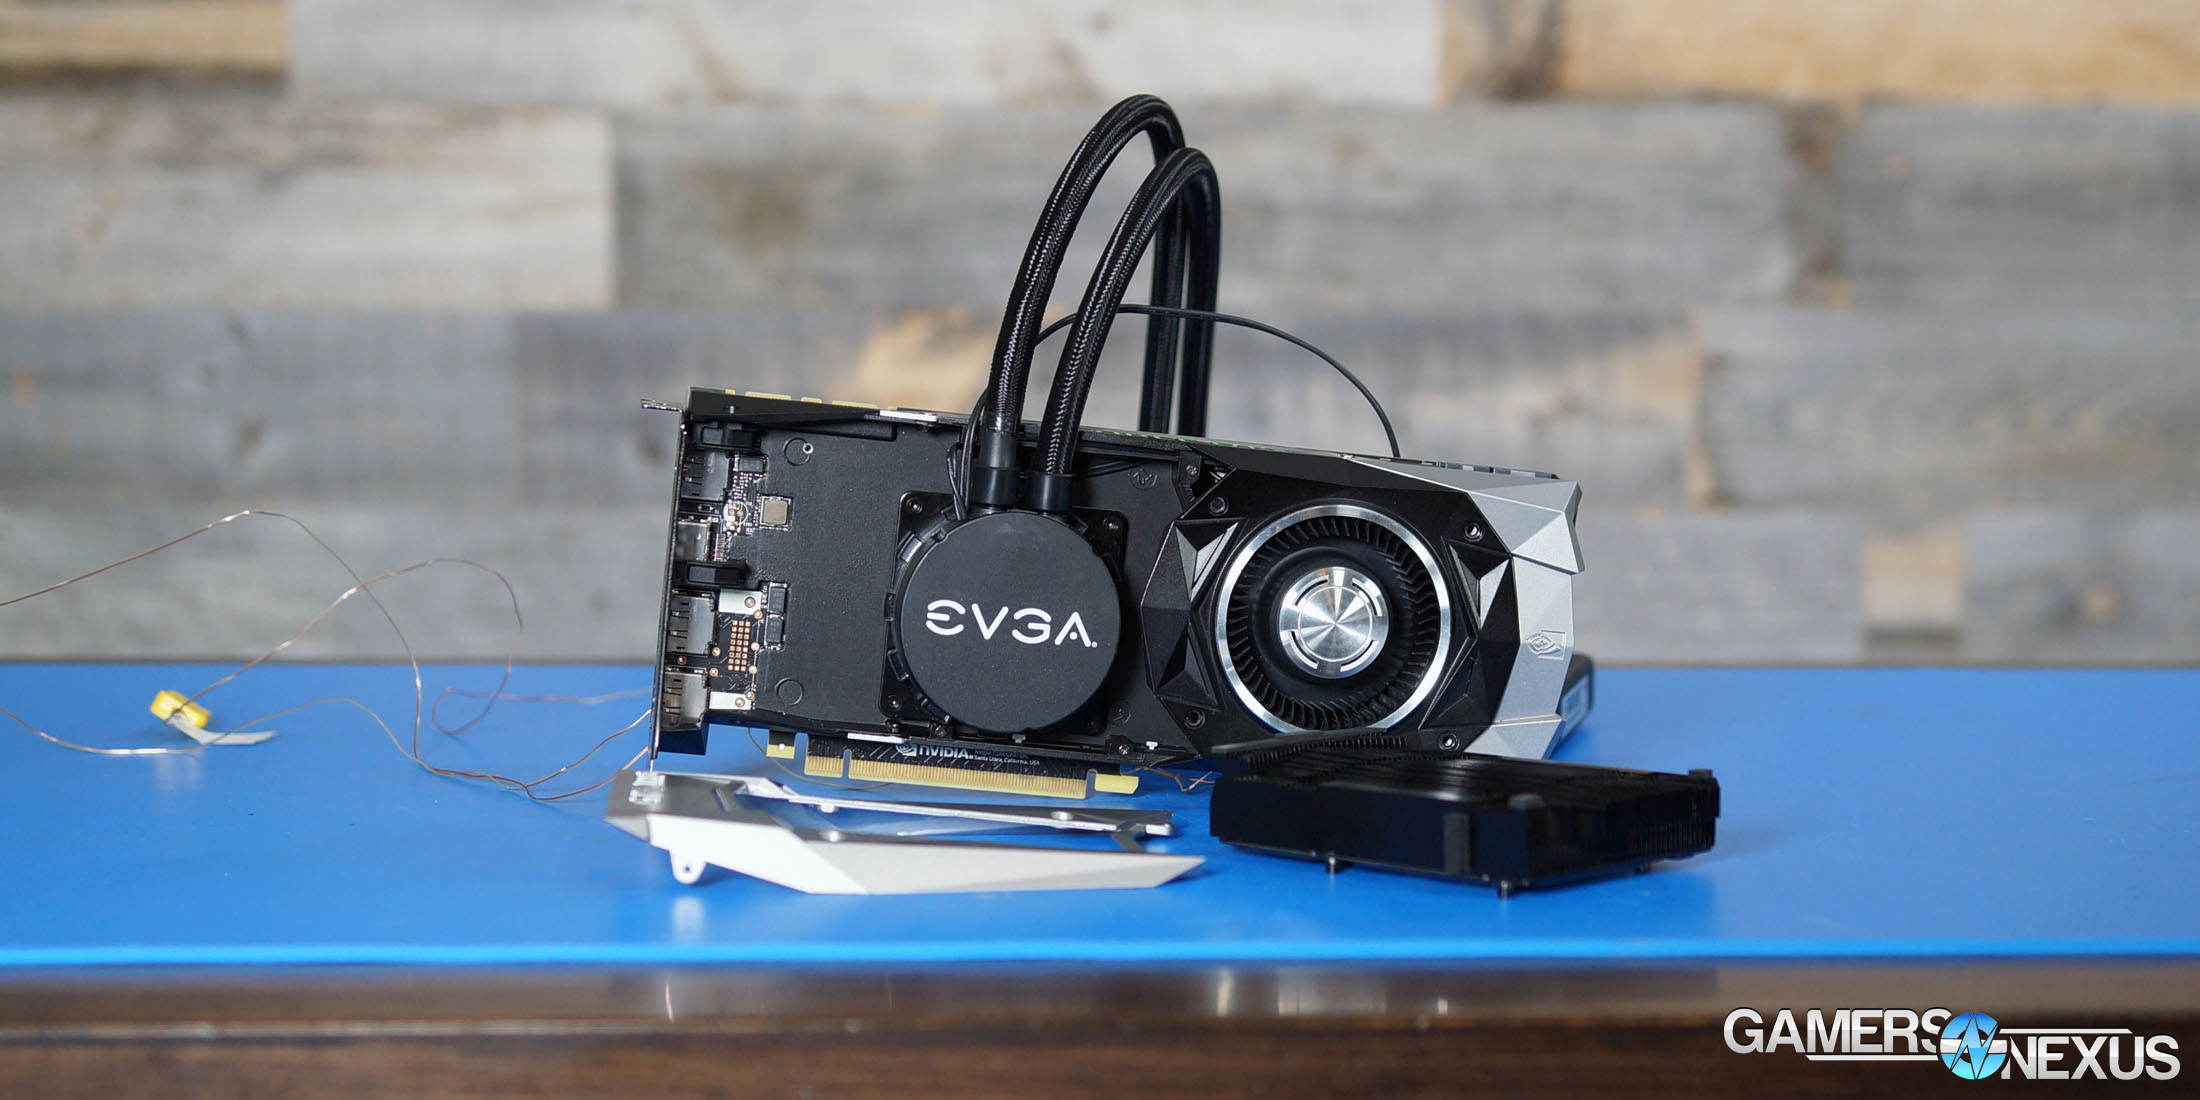
We’ve fixed the GTX 1080 Ti Founders Edition ($700) card. As stated in the initial review, the card performed reasonably close to nVidia’s “35% > 1080” metric when at 4K resolutions, but generally fell closer to 25-30% faster at 4K. That’s really not bad – but it could be better, even with the reference PCB. It’s the cooler that’s holding nVidia’s card back, as seems to be the trend given GPU Boost 3.0 + FE cooler designs. A reference card is more versatile for deployment to the SIs and wider channel, but for our audience, we can rebuild it. We have the technology.
“Technology,” here, mostly meaning “propylene glycol.”
To improve performance, as discussed on the thermal testing page of that review, increasing the fan RPM to intolerable levels would allow greater boosting potential on the GPU by removing a thermal constraint. The GTX 1080 Ti and its host GP102 GPU impose a hard limiter at 84C, employing a fan curve that favors 50% speeds (better for noise, worse for cooling) and leveraging clock limiting to keep that temperature. Here’s that page, if you missed the thermal and frequency vs. temperature & time testing.
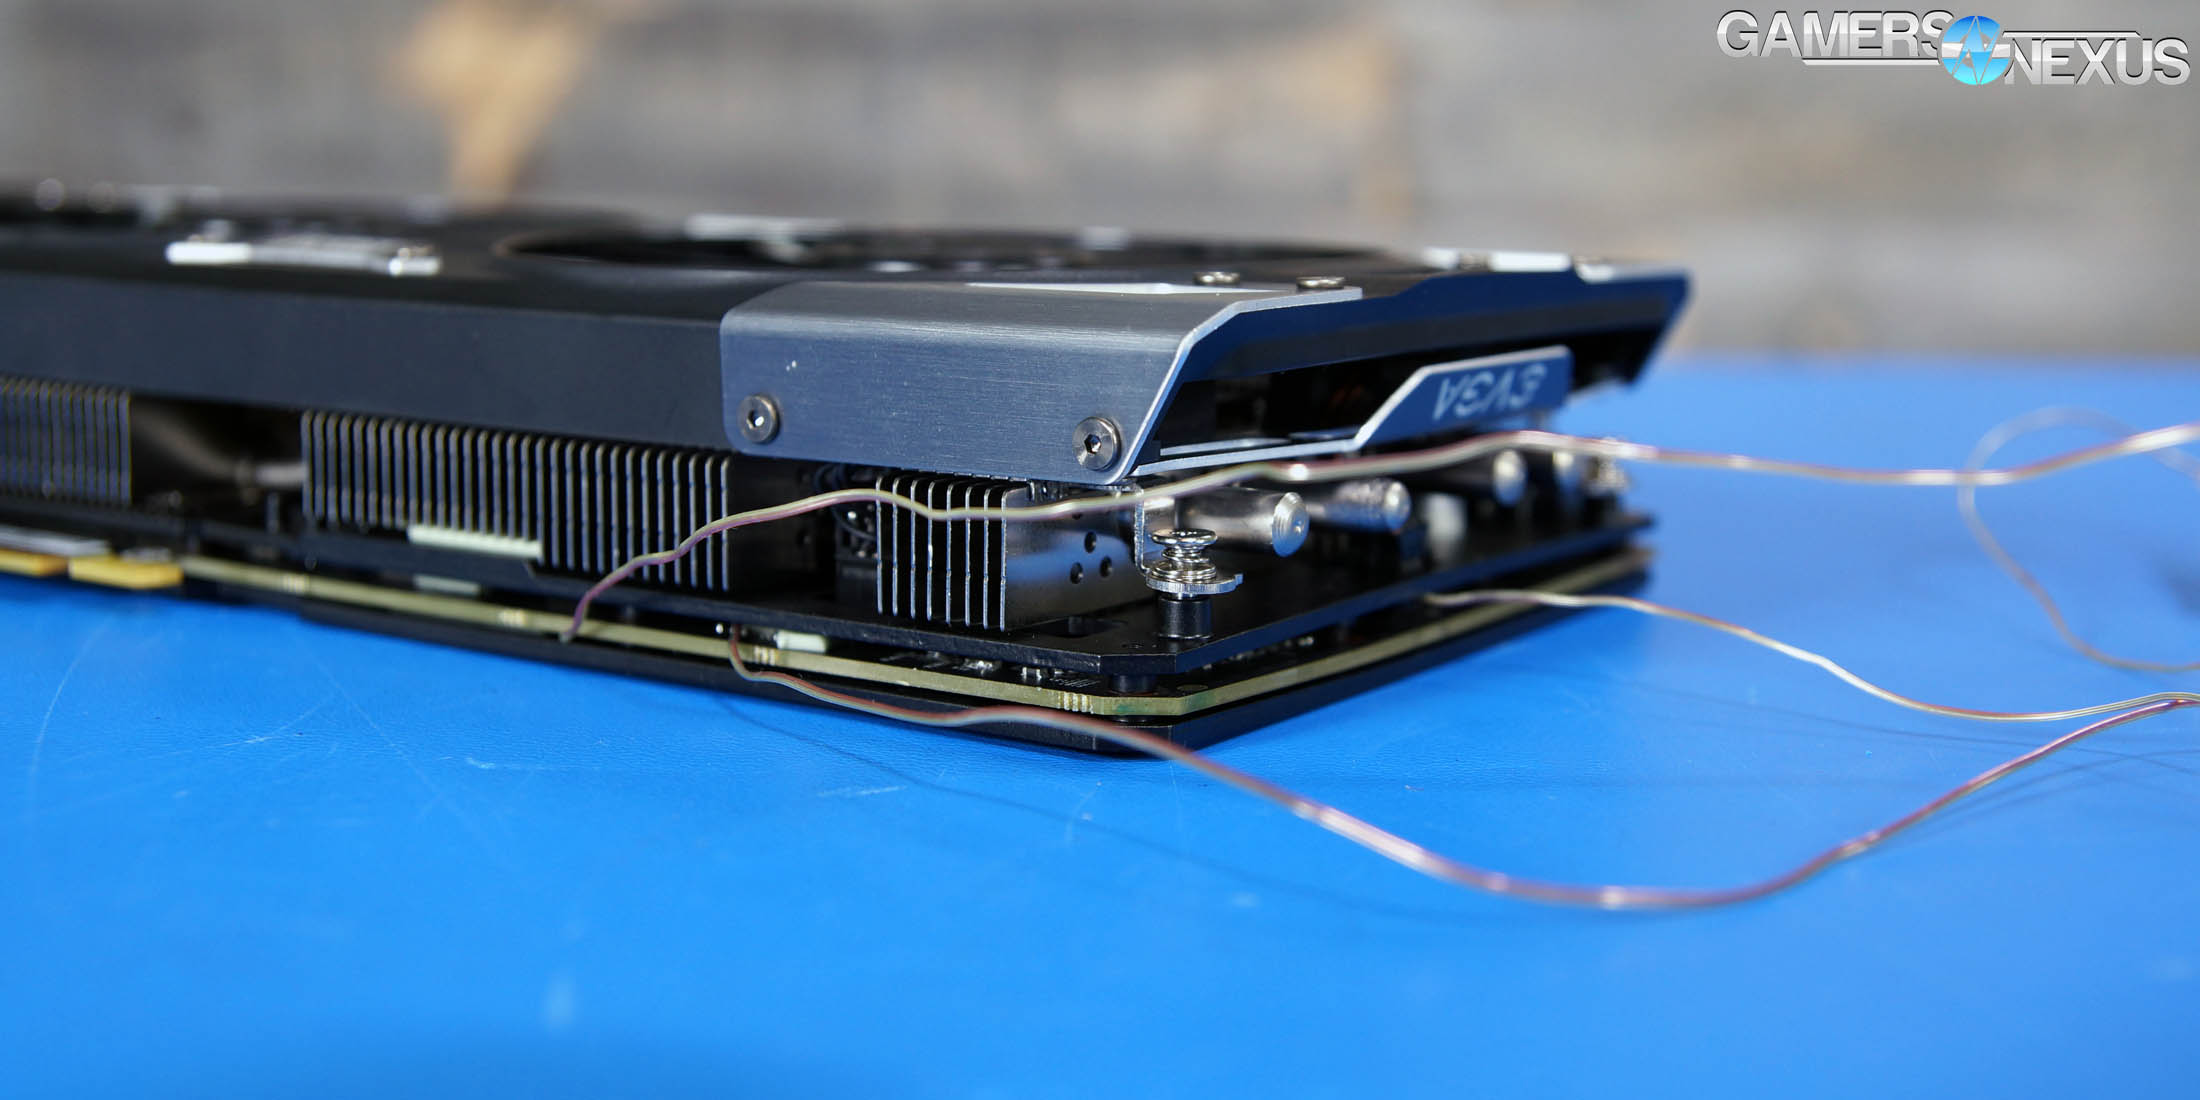
One curiosity we’ve always had with these Hybrid mods has been VRM temperature, though; we’ve long hypothesized that modifying the reference design could negatively impact VRM/FET cooling, given the imposition of a block in front of air flow and removal of the heatsink. In today’s testing, we’re deploying thermocouples to FET2 & FET7 to log temperature under each cooler deployment. We’re looking into VRAM testing in the future.
Even if you’re not planning to go through the few-step process of building your own Hybrid card (atop the foundation of a reference design), this content should still be of interest: By removing the thermal constraint, we’re able to project performance of AIB partner 1080 Ti cards with better cooling. That’s without accounting for any pre-OCs, though Boost 3.0 does a good job of basically pre-overclocking for the lazy end-user.
We’re still working on the 1080 Ti follow-up coverage, including noise (dBA) and overclock testing. For today, we’ve got a more thorough look at clock behavior, FPS under thermally unconstrained scenarios, and some light overclocking. Limitations from nVidia on voltage don’t help us hit higher clocks, but we can still run some more tests than we’ve done for today. All in time. There’s a lot going on in the industry, lately, as we’re already on the way to the next event.
Let’s look at the GTX 1080 Ti FE’s performance when put under liquid, then see how FPS and performance increase with better cooling.
GPU Testing Methodology
For our benchmarks today, we’re using a fully rebuilt GPU test bench for 2017. This is our first full set of GPUs for the year, giving us an opportunity to move to an i7-7700K platform that’s clocked higher than our old GPU test bed. For all the excitement that comes with a new GPU test bench and a clean slate to work with, we also lose some information: Our old GPU tests are completely incomparable to these results due to a new set of numbers, completely new testing methodology, new game settings, and new games being tested with. DOOM, for instance, now has a new test methodology behind it. We’ve moved to Ultra graphics settings with 0xAA and async enabled, also dropping OpenGL entirely in favor of Vulkan + more Dx12 tests.
We’ve also automated a significant portion of our testing at this point, reducing manual workload in favor of greater focus on analytics.
Driver version 378.78 (press-ready drivers for 1080 Ti, provided by nVidia) was used for all nVidia devices. Version 17.3.1 was used for AMD.
Moving forward, we’re refreshing our GPU bench with the relevant high-end contenders: The GTX 1080 Ti, GTX 1080, and GTX 1070 in Founders Edition variants, with a splash from the GTX 980 Ti. We’re also going to add in the RX 480, but note that it competes in a completely different price bracket. That’s just to give some representation for a $250ish card. We’ll add Vega once it’s ready, and will slowly add more GPUs to this bench with each content piece. We do lose the Titan XP in this process, sadly, as our original model was a loaner.
Please note that due to limited time between events, we’re not going to be getting into noise level measurement and deep overclocking today. We’ll look into those post-PAX in some special features.
A separate bench is used for game performance and for thermal performance.
Thermal Test Bench
Our test methodology for the is largely parallel to our EVGA VRM final torture test that we published late last year. We use logging software to monitor the NTCs on EVGA’s ICX card, with our own calibrated thermocouples mounted to power components for non-ICX monitoring. Our thermocouples use an adhesive pad that is 1/100th of an inch thick, and does not interfere in any meaningful way with thermal transfer. The pad is a combination of polyimide and polymethylphenylsiloxane, and the thermocouple is a K-type hooked up to a logging meter. Calibration offsets are applied as necessary, with the exact same thermocouples used in the same spots for each test.
Torture testing used Kombustor's 'Furry Donut' testing, 3DMark, and a few games (to determine auto fan speeds under 'real' usage conditions, used later for noise level testing).
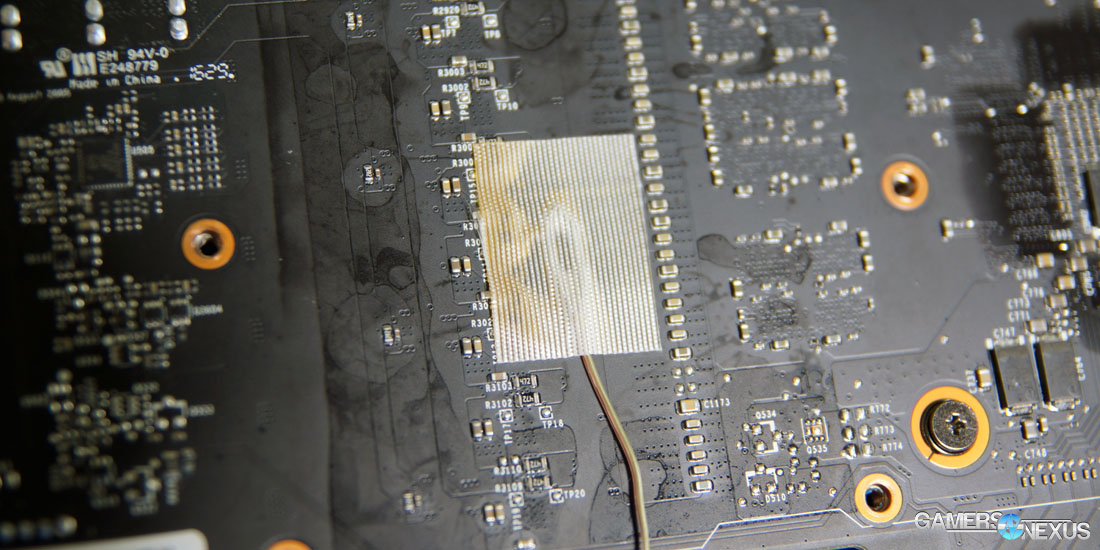
Our tests apply self-adhesive, 1/100th-inch thick (read: laser thin, does not cause "air gaps") K-type thermocouples directly to the rear-side of the PCB and to hotspot MOSFETs numbers 2 and 7 when counting from the bottom of the PCB. The thermocouples used are flat and are self-adhesive (from Omega), as recommended by thermal engineers in the industry -- including Bobby Kinstle of Corsair, whom we previously interviewed.
K-type thermocouples have a known range of approximately 2.2C. We calibrated our thermocouples by providing them an "ice bath," then providing them a boiling water bath. This provided us the information required to understand and adjust results appropriately.
Because we have concerns pertaining to thermal conductivity and impact of the thermocouple pad in its placement area, we selected the pads discussed above for uninterrupted performance of the cooler by the test equipment. Electrical conductivity is also a concern, as you don't want bare wire to cause an electrical short on the PCB. Fortunately, these thermocouples are not electrically conductive along the wire or placement pad, with the wire using a PTFE coating with a 30 AWG (~0.0100"⌀). The thermocouples are 914mm long and connect into our dual logging thermocouple readers, which then take second by second measurements of temperature. We also log ambient, and apply an ambient modifier where necessary to adjust test passes so that they are fair.
The response time of our thermocouples is 0.15s, with an accompanying resolution of 0.1C. The laminates arae fiberglass-reinforced polymer layers, with junction insulation comprised of polyimide and fiberglass. The thermocouples are rated for just under 200C, which is enough for any VRM testing (and if we go over that, something will probably blow, anyway).
To avoid EMI, we mostly guess-and-check placement of the thermocouples. EMI is caused by power plane PCBs and inductors. We were able to avoid electromagnetic interference by routing the thermocouple wiring right, toward the less populated half of the board, and then down. The cables exit the board near the PCI-e slot and avoid crossing inductors. This resulted in no observable/measurable EMI with regard to temperature readings.
We decided to deploy AIDA64 and GPU-Z to measure direct temperatures of the GPU and the CPU (becomes relevant during torture testing, when we dump the CPU radiator's heat straight into the VRM fan). In addition to this, logging of fan speeds, VID, vCore, and other aspects of power management were logged. We then use EVGA's custom Precision build to log the thermistor readings second by second, matched against and validated between our own thermocouples.
The primary test platform is detailed below:
| GN Test Bench 2015 | Name | Courtesy Of | Cost |
| Video Card | This is what we're testing | - | - |
| CPU | Intel i7-5930K CPU 3.8GHz | iBUYPOWER | $580 |
| Memory | Corsair Dominator 32GB 3200MHz | Corsair | $210 |
| Motherboard | EVGA X99 Classified | GamersNexus | $365 |
| Power Supply | NZXT 1200W HALE90 V2 | NZXT | $300 |
| SSD | OCZ ARC100 Crucial 1TB | Kingston Tech. | $130 |
| Case | Top Deck Tech Station | GamersNexus | $250 |
| CPU Cooler | Asetek 570LC | Asetek | - |
Note also that we swap test benches for the GPU thermal testing, using instead our "red" bench with three case fans -- only one is connected (directed at CPU area) -- and an elevated standoff for the 120mm fat radiator cooler from Asetek (for the CPU) with Gentle Typhoon fan at max RPM. This is elevated out of airflow pathways for the GPU, and is irrelevant to testing -- but we're detailing it for our own notes in the future.
Game Bench
| GN Test Bench 2017 | Name | Courtesy Of | Cost |
| Video Card | This is what we're testing | - | - |
| CPU | Intel i7-7700K 4.5GHz locked | GamersNexus | $330 |
| Memory | GSkill Trident Z 3200MHz C14 | Gskill | - |
| Motherboard | Gigabyte Aorus Gaming 7 Z270X | Gigabyte | $240 |
| Power Supply | NZXT 1200W HALE90 V2 | NZXT | $300 |
| SSD | Plextor M7V Crucial 1TB | GamersNexus | - |
| Case | Top Deck Tech Station | GamersNexus | $250 |
| CPU Cooler | Asetek 570LC | Asetek | - |
BIOS settings include C-states completely disabled with the CPU locked to 4.5GHz at 1.32 vCore. Memory is at XMP1.
We communicated with both AMD and nVidia about the new titles on the bench, and gave each company the opportunity to ‘vote’ for a title they’d like to see us add. We figure this will help even out some of the game biases that exist. AMD doesn’t make a big showing today, but will soon. We are testing:
- Ghost Recon: Wildlands (built-in bench, Very High; recommended by nVidia)
- Sniper Elite 4 (High, Async, Dx12; recommended by AMD)
- For Honor (Extreme, manual bench as built-in is unrealistically abusive)
- Ashes of the Singularity (GPU-focused, High, Dx12)
- DOOM (Vulkan, Ultra, 0xAA, Async)
Synthetics:
- 3DMark FireStrike
- 3DMark FireStrike Extreme
- 3DMark FireStrike Ultra
- 3DMark TimeSpy
For measurement tools, we’re using PresentMon for Dx12/Vulkan titles and FRAPS for Dx11 titles. OnPresent is the preferred output for us, which is then fed through our own script to calculate 1% low and 0.1% low metrics (defined here).
Continue to Page 2 for thermal & clock-rate analysis (and synthetics).
GTX 1080 Ti Hybrid Thermal Results – Liquid Cooling vs. Founders Edition
This first chart has a lot going on, so let’s break it down one line at a time.
The lines in the top half of the legend represent the Ti Founders Edition card, with the green line representing GPU diode temperature for the Ti FE. That line, conveniently, sits right at the GTX 1080 Ti’s thermal limit point: 84C. The card tries hard to disallow temperature to increase beyond this point, and does so by limiting the clock and increasing the fan (along a curve/lookup table). The fan speed curve seems to peak around 50% unless under duress, and so clock limiting kicks in to keep thermals under control. This means that we’ll see more sporadic frequency fluctuation when plotting the 1080 Ti FE over time, given its against-the-limits modus operandi.
Under stock conditions, the card will not allow the frequency to boost to a point of exceeding 84C. Temperature rubber bands between 84-85C, dragging frequency in tow. Looking at the GN Hybrid variant, we’re hovering around 45C. This gives us a ~40C reduction in hard temperature vs. FE, from which stems additional thermal headroom for boosting. The big question here is whether removing the vapor chamber and heatsink has negatively impacted the FET cooling in any significant way, as we haven’t previously been able to perform this testing. The card still has a thick aluminum baseplate mounted to the PCB, and we’re still using the VRM blower fan, but modifying the cooling design could impact those temperatures. Airflow is significantly changed with this mod (can’t exactly funnel air through a pump block).
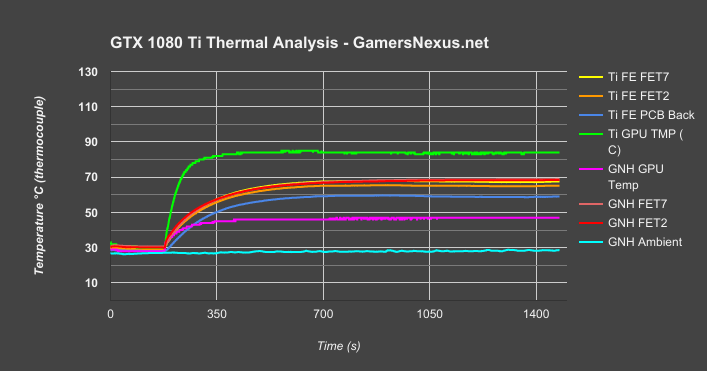
In short, the answer to “does FET temperature increase?” is “no.” The big cluster of lines in the 65-70C range represents the FET2 and FET7 temperatures for both revisions of the Ti card. There is no significant difference. For the FETs we monitored, it is fair and accurate to say that the temperature is effectively equal to the Founders Edition card. The fact that they’re illegibly clustered in one spot mostly establishes this fact. Even if there were an increase, it’d have to be substantial to cause any concern. VRM components can take a serious beating (125-150C in most cases) and, although we want to avoid derating and efficiency loss, adding a few degrees won’t hurt anything. This doesn’t even do that, really; the VRM fan (at 22%) and baseplate appear to be enough to handle the FETs. We’ve reduced fan speed overall (~30% for the blower) and removed the vapor chamber cooler, but have added a CLC. This allows GPU diode temperature to plummet, doesn’t significantly impact FET temperature, and reduces blower fan noise. Granted, we do gain noise in the form of a 120mm radiator fan.
GTX 1080 Ti Hybrid Clock vs. Temperature & Time
Here’s the 1080 Ti FE clock vs. temperature & time chart, as a refresher:
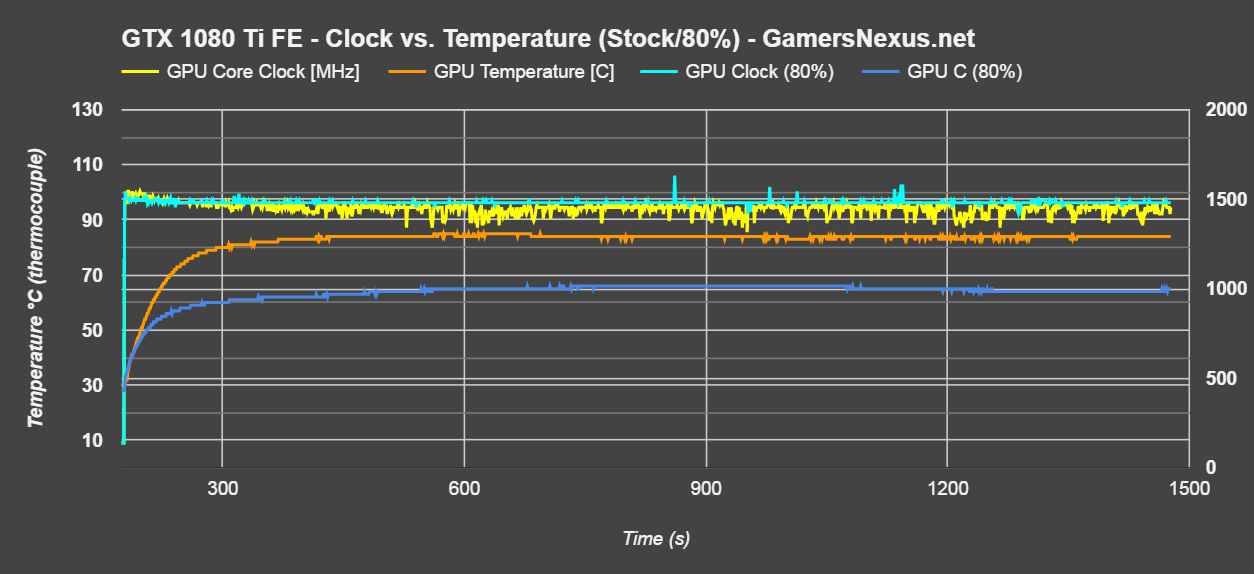
As for the impact on thermals versus clock, the above data allowed us to hypothesize that the clock-rate should be flatter and less sporadic in its fluctuations when under liquid. This conclusion can be formed just by looking at the frequency resultant of our 80% fan speed, where greater performance was siphoned at the cost of increased noise.
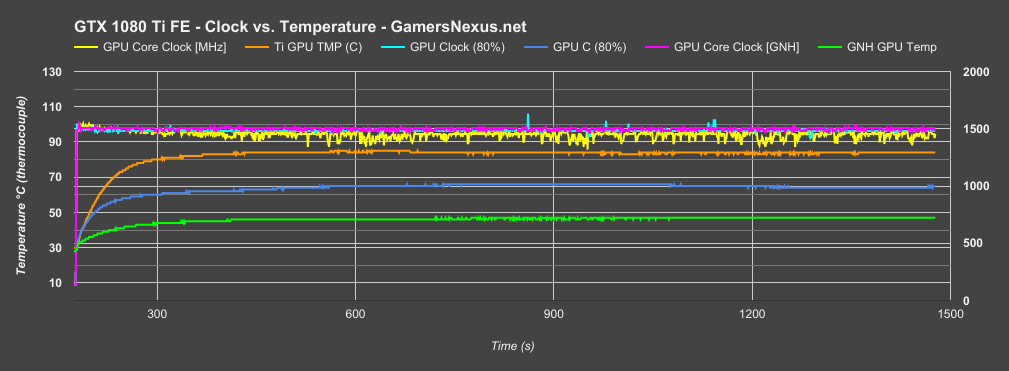
Looking at the new frequency vs. time and temperature chart, we see the pink line representing the GN Hybrid 1080 Ti, which sustains a higher clock overall and a flatter line. There’s a lot less fluctuation here. Keep in mind that, as stated previously, this is with a power virus test – we’re mostly burning the FETs here, and so the cores don’t boost as high as in video games. Everything is burned in (and often hotter than a game would do) even though the clock speed is lower.
For thermals, we see the GN Hybrid operating below 50C, generally in the 45C range, with the FE version of the same GPU and PCB at around 65C when at 80% fan speed, or 84C when at auto speeds. Clock fluctuation is no more than 30MHz in the worst cases on the Hybrid card.
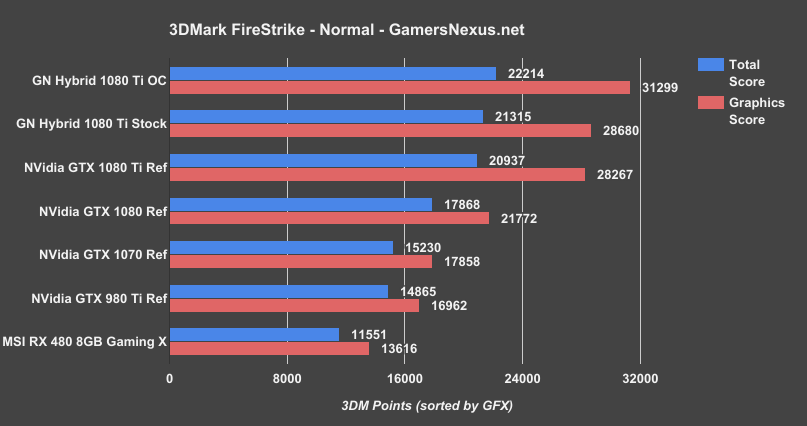
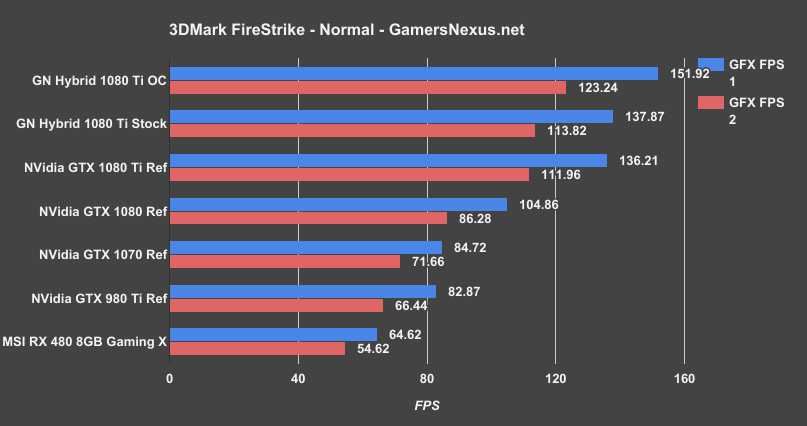
3DMark FireStrike Tests
We’re just dumping these charts here, and will follow-up with game benchmarks and analysis of those results:
3DMark FireStrike - Normal
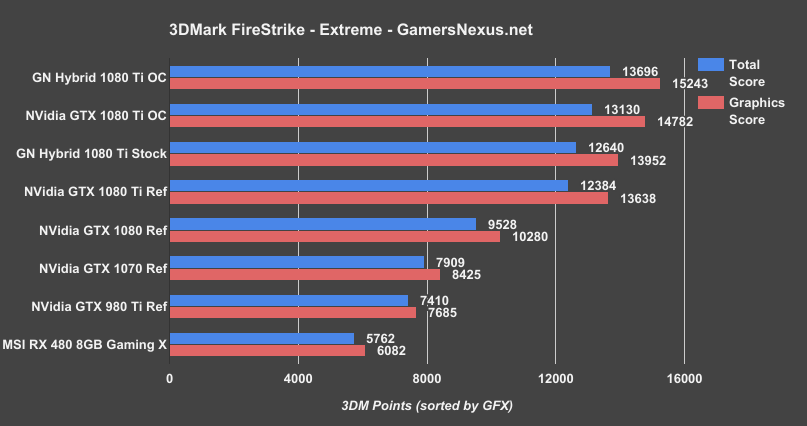
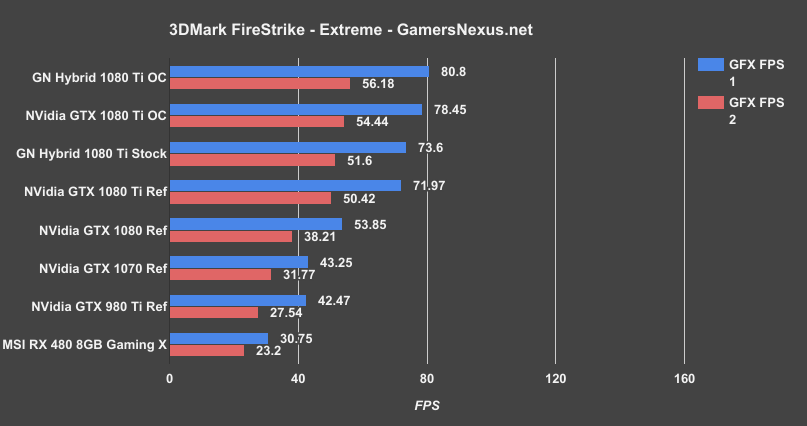
3DMark FireStrike - Extreme
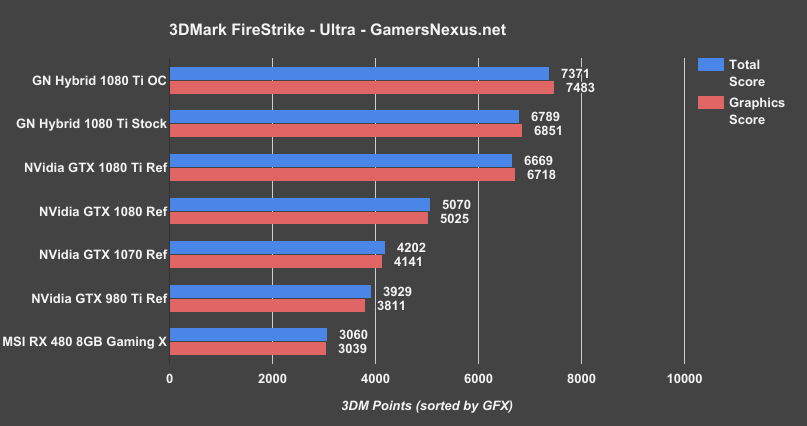
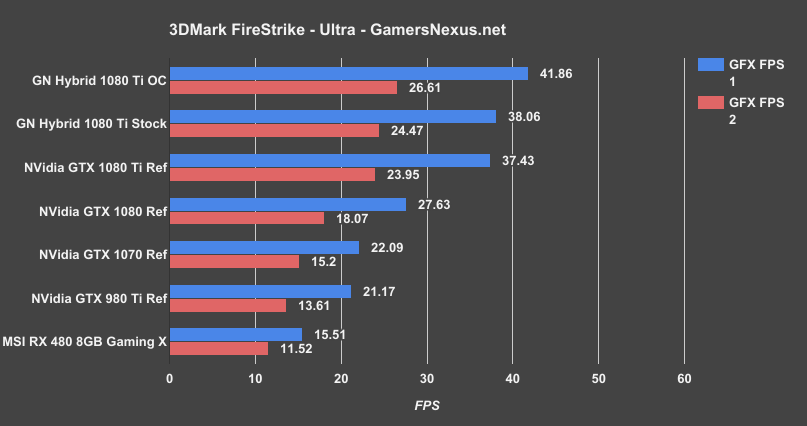
3DMark FireStrike - Ultra
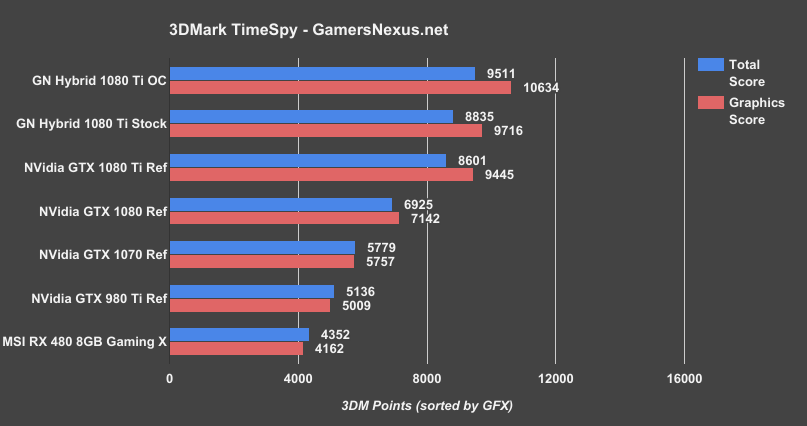
3DMark TimeSpy
Continue to Page 3 for game benchmarks and the conclusion.
Ghost Recon: Wildlands GPU Benchmark – Liquid Cooled GTX 1080 Ti vs. Reference
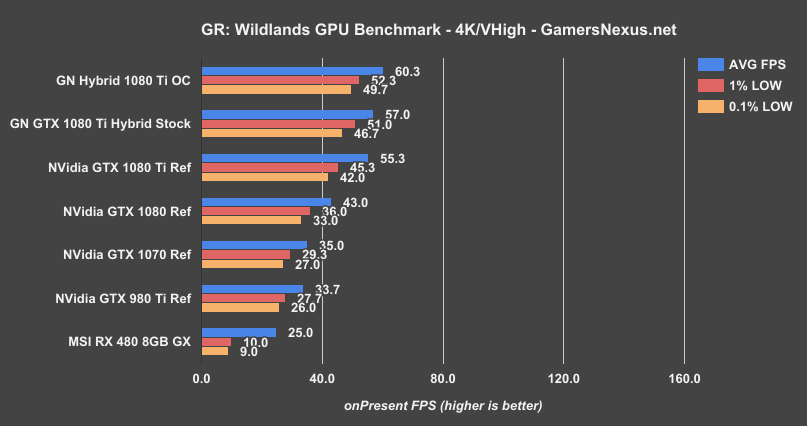
Starting our FPS performance testing with Ghost Recon: Wildlands at 4K and Very High settings, we see the GTX 1080 Ti FE ($700) is outperformed by our stock 1080 Ti Hybrid mod when neither has overclocks applied. Removing the thermal limit has allowed the GPU to boost to higher clocks than the FE cooler would allow, thus increasing framerate. Our FPS difference ends up being 55FPS AVG versus 57FPS AVG when only the cooler is exchanged, dragging lows up marginally as well: We move from 45 and 42 to 51 and 47. Overclocking the GN Hybrid with a 150MHz offset lands our frequency range in the 1950 to 2050MHz area, depending on workload and voltage or power limitations. We are still limited by voltage, which is a fault of nVidia’s design – overvolting is simply not possible in any relevant fashion on Pascal. This lands performance at 60FPS AVG, an increase of approximately 9% over the stock FE card, or an increase of about 5.8% over the GN Hybrid stock.
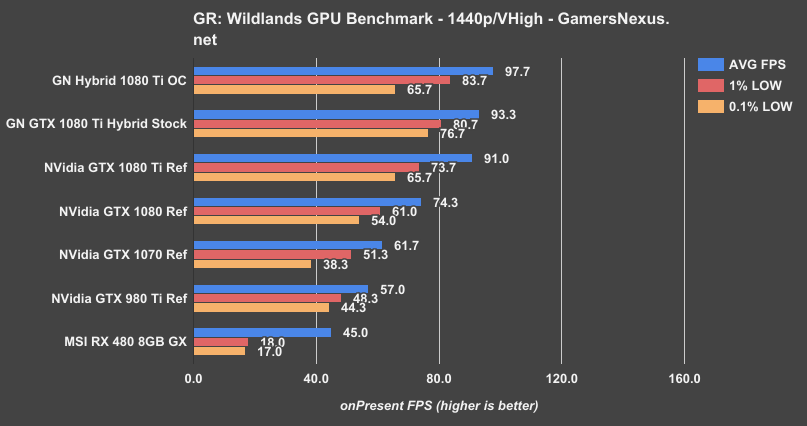
Moving on to 1440p, we see the GN Hybrid model again outperform the stock Ti by just a couple FPS – and no, this is not within margin of error; the difference is repeatable – with lows improving to 81FPS and 77FPS from 74 and 66FPS. Overclocking the 1080 Ti Hybrid puts us up to 98FPS AVG, though the 0.1% low values reveal that our clock is bordering instability. Backing down on the 150MHz core and 450MHz memory offsets would improve this metric at the cost of AVG FPS.
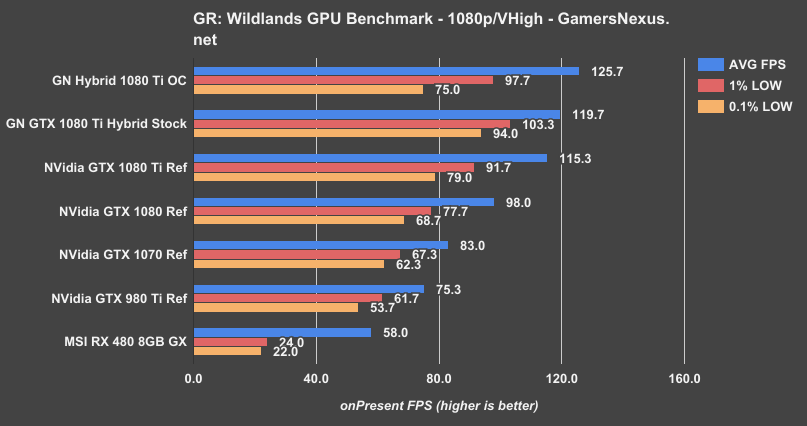
Finally, 1080p shows that the 1080 Ti is genuinely capable of hitting 120FPS AVG for users of high-refresh displays, but only under the right conditions. In this case, the GN Hybrid pushes to 120FPS AVG from the stock card’s 115FPS AVG, with lows also improved markedly. Overclocking our Hybrid pushes us to nearly 126FPS AVG. That’s an improvement of about 9% over the stock 1080 Ti FE card, or about 5% over the GN Hybrid with no OC.
For Honor GPU Benchmark – 1080 Ti Hybrid
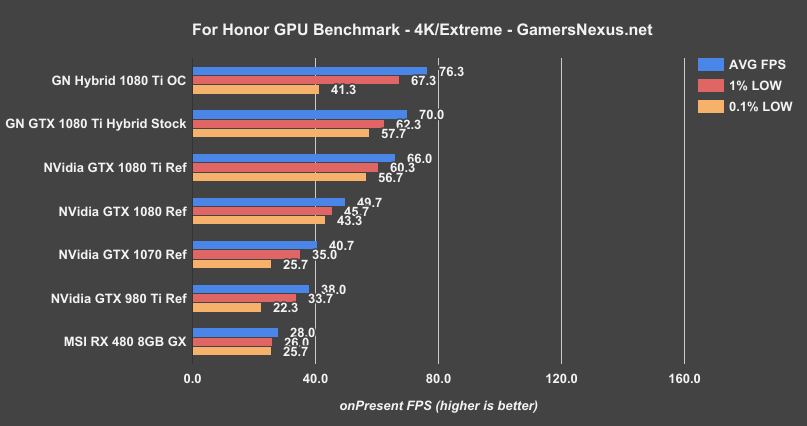
Looking at For Honor with Extreme settings next, 4K positions the GTX 1080 Ti FE at 66FPS AVG, superseded by the GN Hybrid at 70 FPS average. That’s an increase of about 6% just by changing the coolers, and is indicative of the kind of performance gains you should expect from AIB partner cards. Overclocking our Hybrid, we land at 76FPS AVG, or about 15.6% faster than the FE stock card and 9% faster than the GN Hybrid stock card. Lows exhibit the same behavior as previously noted. Low behavior is worse in situations where we're encountering power and voltage limitations that are causing steep clock fluctuations in a short period. A greater power/voltage budget would resolve this.
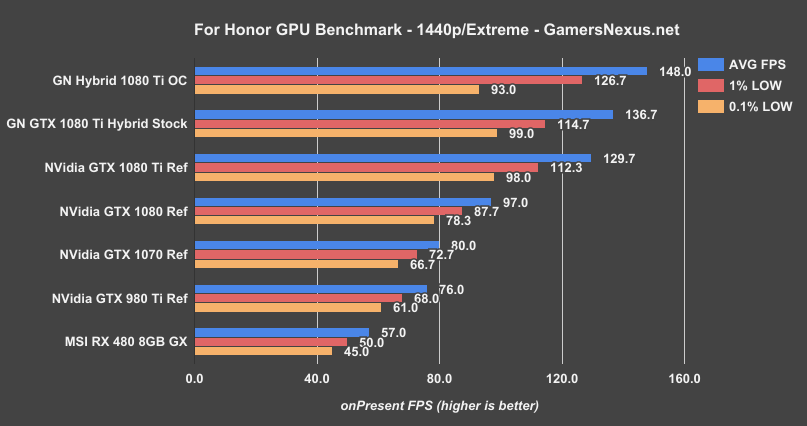
At 1440p, the Hybrid mod with an overclock propels our 1080 Ti up to 144Hz range, now achieving 148FPS AVG versus the 130FPS AVG of the stock FE card, or 137FPS AVG of the Hybrid stock card. Lows scale mostly linearly, except for the 0.1% metrics again. This change nets us a 14% increase in performance over the completely stock FE card, though the non-overclocked Hybrid is about 5% better than the non-overclocked FE card.
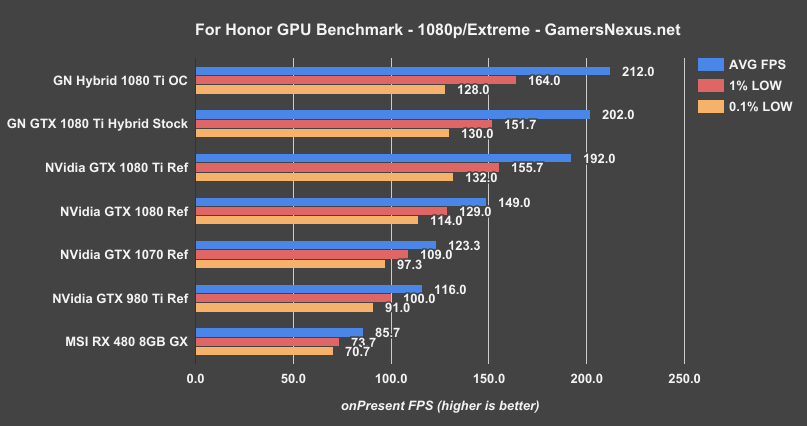
1080p is sort of comical, but we’re still testing it for a baseline for the vast majority of folks still on 1080p displays. At 1080p, the non-overclocked GN Hybrid posts a performance gain of about 5.2% over the stock FE card, with no improvement in lows. The overclocked variant posts a gain of about 20FPS, or around 10% over the stock FE card, and about 5% over the Hybrid stock card.
DOOM GPU Benchmark with Vulkan – GTX 1080 Ti Hybrid
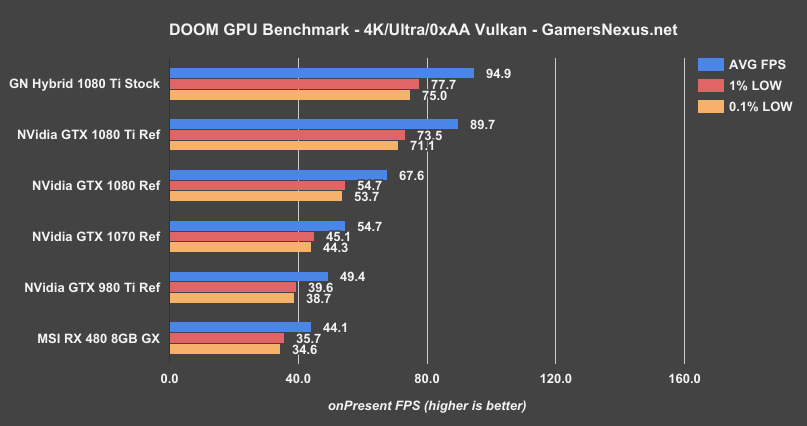
Looking at DOOM with Vulkan and 4K, the GTX 1080 Ti reference card runs at 90FPS AVG, outperformed by the 1080 Ti GN Hybrid by about 5.8%. Our lows also increase marginally. This is fairly consistent in terms of percentage gains when looking at previous tests, and shows that there’s around 5-6% more headroom when better coolers come into play. That’s our baseline for where AIB partner cards should perform, given no pre-overclock.
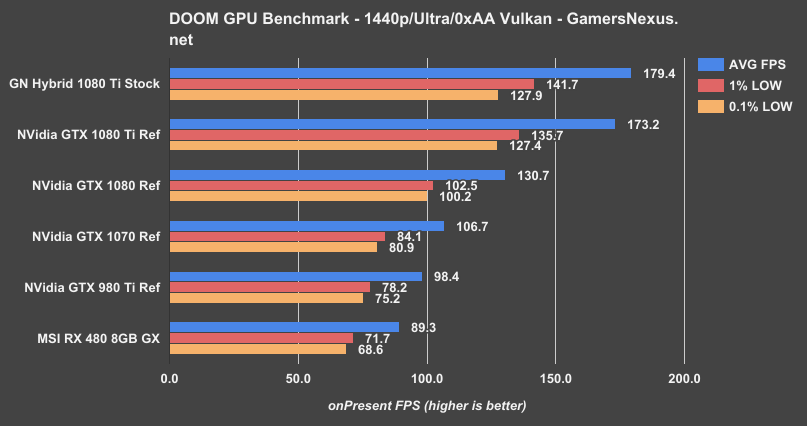
1440p results in a similar hierarchy, with the Hybrid mod (no OC) at 179FPS AVG, followed by the FE version at 173FPS AVG. Keep in mind that DOOM is encountering an engine constraint, or “bottleneck.” The DOOM engine is not capable of delivering greater than 200 frames per second due to physics bugs, and that means any duration of >200FPS potential is represented instead as a maximum value of 200. This brings down the ceiling, and makes cards start looking identical when they might not be in unconstrained scenarios (see all the other tested games for more on that).
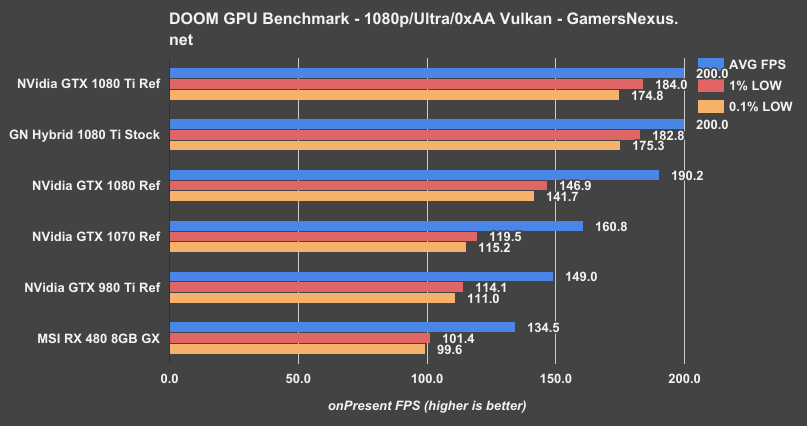
Same thing above: We’re hitting an engine constraint, and so this test isn’t really a valid GPU benchmark for comparison of performance potential. That said, it serves as an excellent representation of why we eliminate constraints when testing, and so we’ve left the chart in. People tend to forget that the engine can impose limitations as well.
Sniper Elite GPU Benchmark – GTX 1080 Ti at 4K
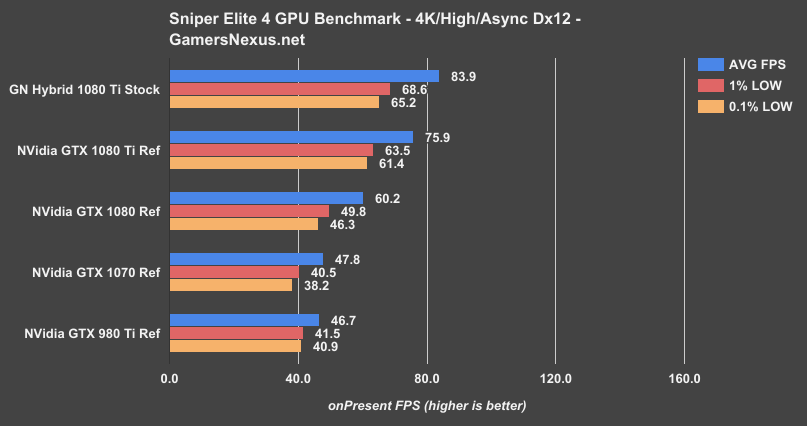
At 4K with High settings, Dx12, and Async enabled, the 1080 Ti GN Hybrid pushes 84FPS, with lows at 67 and 65FPS. Comparatively, the 1080 Ti FE card runs 76FPS AVG, 64FPS 1% lows, and 61FPS 0.1% lows. The difference in averages is about 10.5%, for one of the more substantial gains we’ve measured.
Ashes of the Singularity – GTX 1080 Ti 4K GPU-Focused
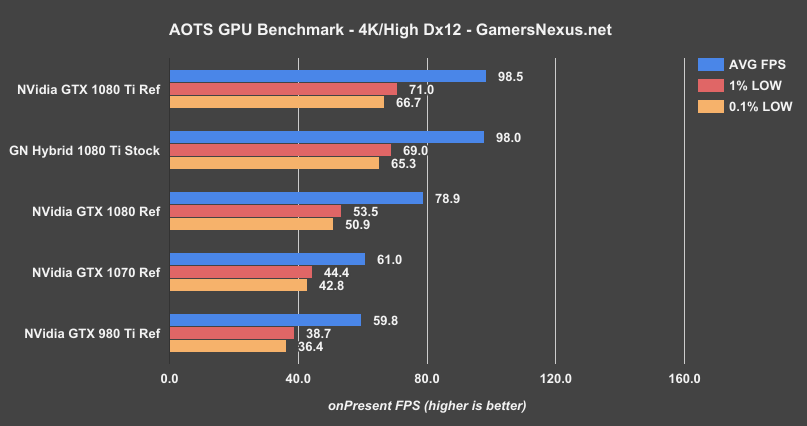
With 4K/High and GPU-focused, AOTS shows a scenario where we’d need a significantly more powerful solution for any meaningful gain – this game doesn’t response as intensely to the (relatively minor) clock-rate changes of our mod as the previous titles. Just adding liquid doesn’t always work, evidently, but we’re not at any significant loss. Performance is effectively identical between devices.
Conclusion: Is Liquid Cooling the 1080 Ti Worth It?
As stated in the intro, there’s more to come in due time. We’re working on further overclocking endeavors, with the thermal limit now removed (but voltage limit still present), and will shortly be studying noise output of the new card. That said, it should basically be the same as what we found on the GTX 1080 FE.
We’ve been doing these GPU mods for about a year now, and they’re always fun projects – that alone is potentially worthwhile for the folks who enjoy a Saturday build (can grab a kit for ~$100-$120). Performance gains are generally in the 5-6% territory for a non-overclocked Hybrid vs. non-overclocked FE card, standing as an indicator of AIB partner performance with Strix/ACX/Windforce or other coolers. You don’t have to do a liquid mod to get the performance gain we’re seeing, it’s just the easiest way to do it today. If the gains sound promising but the effort is undesirable, all we’re showing is that AIB partner models will be faster. No big surprise. The main takeaway here is that the FE cooler is limiting the clock with its cooling ability, and that further reinforces our stance to avoid reference cards unless purchasing them for use with water blocks or other aftermarket solutions. They’re just not good coolers compared to partner models, and that makes them bad value.
“Fixing” the card improved performance in ways that illustrates all of this, and shows that the GTX 1080 Ti will be an impressive performer once the aftermarket coolers get out the gate. It’s not an insignificant amount of performance overhead added by these solutions. We’ll be following those closely through launch.
Editorial: Steve Burke
Video: Andrew Coleman