The playful Nintendo noises emitted from our Switch came as somewhat of a surprise following an extensive tear-down and re-assembly process. Alas, the console does still work, and we left behind breadcrumbs of our dissection within the body of the Switch: a pair of thermocouples mounted to the top-center of the SOC package and one memory package. We can’t get software-level diode readings of the SOC’s internal sensors, particularly given the locked-down nature of a console like Nintendo’s, and so thermal probes allow us the best insight as to the console’s temperature performance. As a general rule, thermal performance is hard to keep in perspective without a comparative metric, so we need something else. That’ll be noise, for this one; we’re testing dBA output of the fan versus an effective tCase on the SOC to determine how the fan ramps.
There’s no good way to measure the Switch’s GPU frequency without hooking up equipment we don’t have, so we won’t be able to plot a frequency versus temperature/time chart. Instead, we’re looking at temperature versus noise, then using ad-hoc testing to observationally determine framerate response to various logged temperatures. Until a point at which we’ve developed tools for monitoring console FPS externally, this is the best combination of procedures we can muster.
The Previous Tear-Down
If you’re not up to speed on our Switch coverage, we previously tore-down the console here (or below):
With a follow-up Joy-Con & dock tear-down. Results from the thermal testing are embedded below, or skip the video and keep reading.
Nintendo Switch Thermal Analysis
Testing the Switch
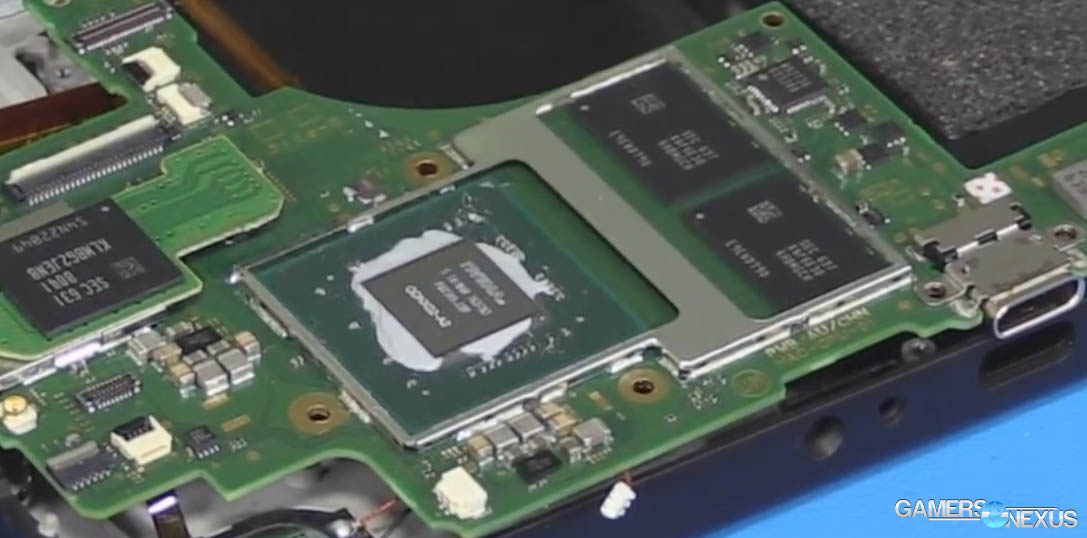
The Nintendo Switch uses a modified nVidia Tegra X1 SOC, labeled “ODNX02” on the die. We have not received specific information on what sets the NX X1 apart from the “normal” X1, though die size is the same. The memory packages used are installed in a 2x2GB configuration, for a total of 4GB of shared system memory. Both memory packages and the SOC die are housed under a metal cover, with a layer of thermal compound between the SOC and a copper foil in the cover. Another layer of thermal compound rests between the foil and the heatpipe, and then a final layer of compound is between the heatpipe and the metal body. That’s a big sandwich of interfaces, leading us down the road of doing this testing.
These thermocouples only give us an effective case temperature, so we don’t have a junction temperature as of now. We do know that the Tegra X1 will operate at higher clock speeds when under a Junction temperature of 70C, that it drops frequency by about 6% when between 70C and 90C, and that it reaches TjMax around 105C. We’re not sure how comparable the Switch SOC is to this, but it’s probably not too different. Still, we’re working with what is effectively a tCase measurement, not a tJunction measurement. This is an imperfect approach, but one which we feel establishes a strong foundation for analysis when compared against monitored fan RPM (via dBA) and observed framerate.
All testing was done with the Switch docked and exporting to a monitor via HDMI, with the charging cable connected to the dock. We tested using Breath of the Wild (specifically, the Great Plateau). Monitoring was done from system boot to gameplay, including time spent in menus (low load), wandering (medium load), and in combat or near large groups of enemies (heavy load). We were able to stress the Switch most heavily by engaging in combat with multiple actors simultaneously, particularly in geometrically complex areas (like near the towers or skull caves).
If you’re curious about the thermocouples, here’s some info:
Our tests apply self-adhesive, 1/100th-inch thick (read: laser thin, does not cause "air gaps") K-type thermocouples directly to the components under test. The thermocouples used are flat and are self-adhesive (from Omega), as recommended by thermal engineers in the industry.
K-type thermocouples have a known range of approximately 2.2C. We calibrated our thermocouples by providing them an "ice bath," then providing them a boiling water bath. This provided us the information required to understand and adjust results appropriately.
Because we have concerns pertaining to thermal conductivity and impact of the thermocouple pad in its placement area, we selected the pads discussed above for uninterrupted performance of the cooler by the test equipment. Electrical conductivity is also a concern, as you don't want bare wire to cause an electrical short on the PCB. Fortunately, these thermocouples are not electrically conductive along the wire or placement pad, with the wire using a PTFE coating with a 30 AWG (~0.0100"⌀). The thermocouples are 914mm long and connect into our dual logging thermocouple readers, which then take second by second measurements of temperature. We also log ambient, and apply an ambient modifier where necessary to adjust test passes so that they are fair.
The response time of our thermocouples is 0.15s, with an accompanying resolution of 0.1C. The laminates are fiberglass-reinforced polymer layers, with junction insulation comprised of polyimide and fiberglass. The thermocouples are rated for just under 200C, which is enough for any VRM testing (and if we go over that, something will probably blow, anyway).
To avoid EMI, we mostly guess-and-check placement of the thermocouples. EMI is caused by power plane PCBs and inductors.
Noise was collected using our Reed dB meter and is measured in dBA. Noise measurements are taken from 20” away at level footing with the Switch, the dB meter mounted on a tripod. The noise floor of the test room is approximately 25dBA. It’s not a perfect environment (certainly no anechoic box), but it’s good enough for this work.
We’re also toying around with frequency spectrum plotting, which in this case was done by taking our Zoom H6N with X/Y attachment and positioning it ~10” from the Switch. We then feed that audio file (cut to exclude any non-Switch sounds) into Audacity. Frequency spectrum plotting is not our area of expertise, and this is somewhat new territory for us. If you have suggestions for improving this aspect of presentation or testing, specifically for frequency spectrum plots, please let us know. That info can be applied to our PC component reviews going forward.
Nintendo Switch Temperatures
Let’s start with just temperatures, then look at noise, then plot one against the other.
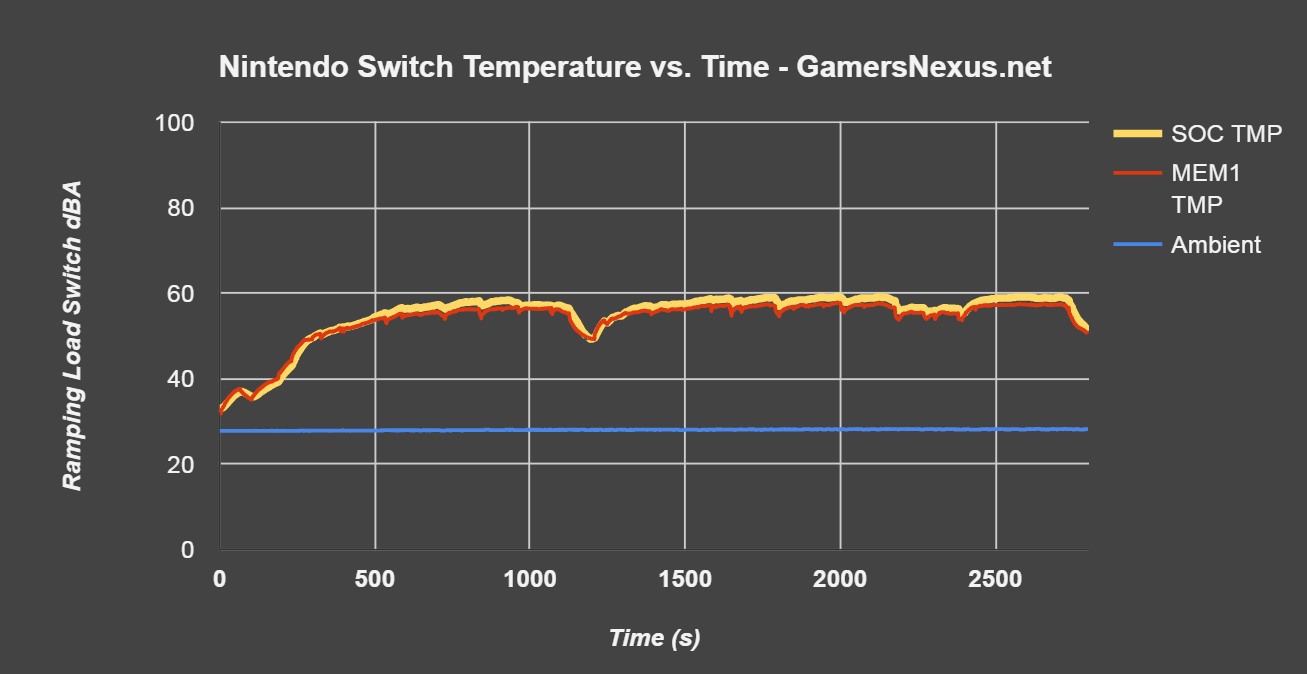
This chart shows the Switch from initial boot through a gameplay session in Breath of the Wild. The big dip around the 1200 second mark is when we were forced into the inventory menu by a prompt, which immediately drives temperature down approximately 7-9C, in some cases. The menu and tutorial interrupts help the Switch recover its temperature to some extent, and this can be seen when observing fan noise versus on-screen action.
For the temperature chart, red represents the memory temperature and orange represents the SOC temperature. There are two memory packages on the Switch, but we measured only the one closest to the USB-C slot.
At boot, temperatures are expectedly close to our ambient temperature of roughly 28C. As we launch and load the game, temperature rises until it hits about 57C, then drops with each menu or prompt. It’s not until around the 1600 second mark that the Switch starts hovering around where we assume its maximum temperature spec is, which is triggered by engaging in combat with multiple enemies concurrently. The SOC drives up to around 59C for the external temperature, and each time we hit 59 to 60C on our probe, we can see a framerate reduction or stutter in combat gameplay. It seems that the Switch oscillates its clock between maximum boost and some lower value when attempting to impose thermal constraints, though we do not know precisely how this works and have no access to official white papers.
Given that this is just a package reading, 59C is actually pretty high. Junction temperature would be higher than this, certainly, but we are not sure the extent when considering the lack of access.
Nintendo Switch Noise (High-Pitched Whining)
Let’s look at the dBA output standalone now, plotted over a shorter period of time.
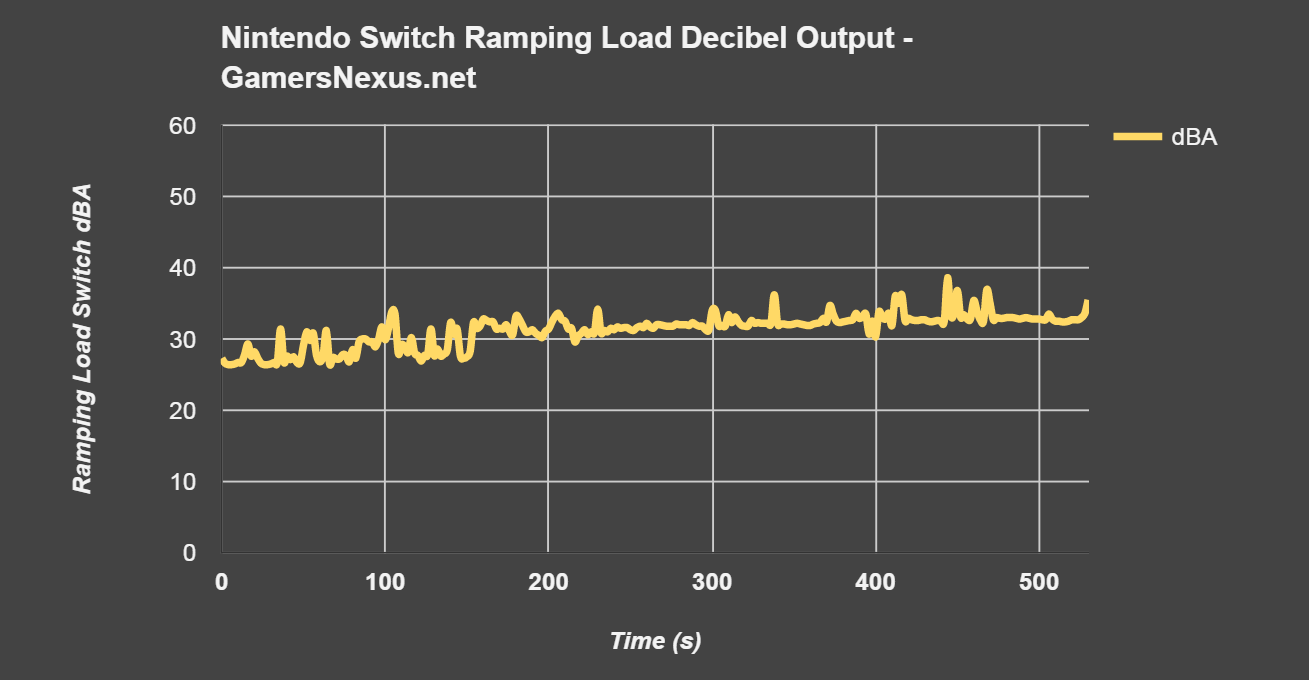
Here, we’re seeing decibel output increase as load ramps, with dips corresponding again with loading screens or menu pop-ups. Toward seconds 400 to 500, we’re near multiple other actors who are driving the fan RPM upwards as temperature rises. dBA output peaks at around 33 to 35~36 dBA when under heavier workloads, which is about the noise output of our case bench PC within the Fractal Define C that we’re currently testing. In terms of raw dBA output, that’s not bad, especially since setting the console up at a TV means that you’re probably 5-10 feet away, and you’ve likely got game audio playing. These things will completely obfuscate the noise. In handheld mode, the noise becomes a bit more noticeable – but it’s not because of the decibel levels, it’s because of the frequency.
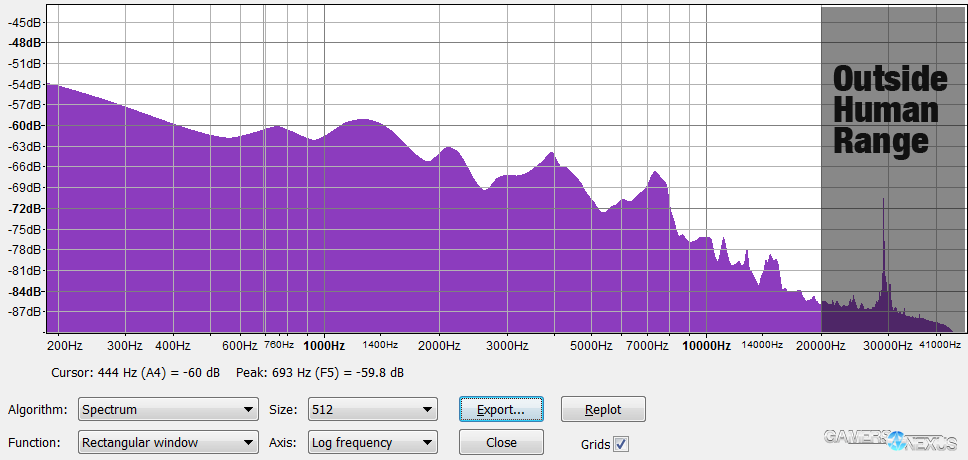
The type of noise produced by the Switch is of a high frequency nature, generally producing an annoying whine that’s particularly heavy in the 400hz and 1400hz ranges. This isn’t a perfect test environment – we’re not using an anechoic chamber, here – but we are still able to log the tone output by the Switch fan with relative accuracy. A sample of the Switch fan noise can be had in our video that’s embedded above.
Let’s move on to a decibel vs. temperature chart.
Nintendo Switch Temperature vs. Noise
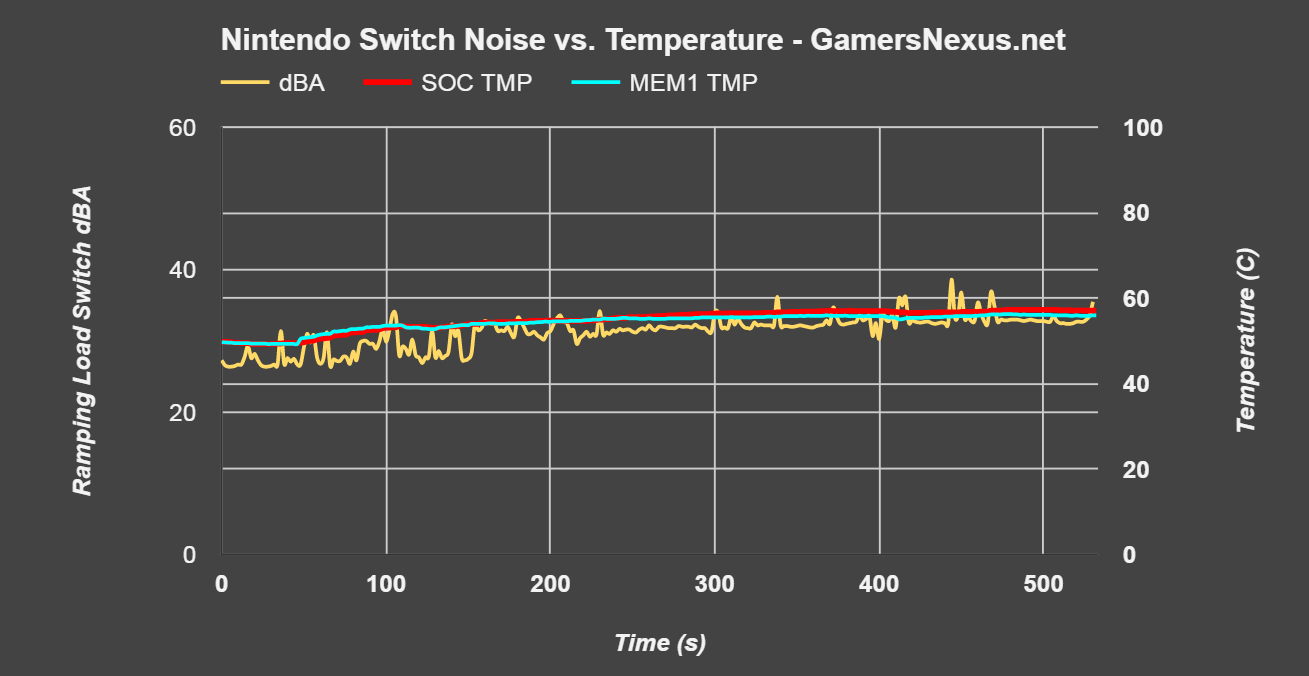
This final chart shows how temperature and noise ramp-up alongside one another. Fan noise, and therefore fan RPM, climbs steadily as SOC and memory temperature increase (though PWM almost certainly corresponds to only the SOC). This chart is cropped-in to an earlier part of the test, so we’re only maxing out at around 57C instead of the supposed 59C max of the Switch in the heavier conditions we tested.
Conclusion
What this mostly shows us is that there seems to be some sort of clock management based on thermals, judging by observed FPS. We don’t have tools to monitor FPS out of consoles yet, but for today, we can clearly observe framerate dips alongside the biggest thermal peaks. That seems to most frequently occur during prolonged combat or more complex battles with multiple opponents. Noise levels are completely tolerable when in console mode, though users more sensitive to high frequencies may notice the fan’s whine when it’s in handheld mode.
We’re investigating options for FPS capture on consoles, but don’t have that capability today. That means we can’t yet plot temperature versus objective performance, but might one day be able to.
As always, if you like this content, consider supporting us on Patreon or simply following us on social media (YouTube, Twitter, Facebook).
Editorial: Steve Burke
Video: Andrew Coleman