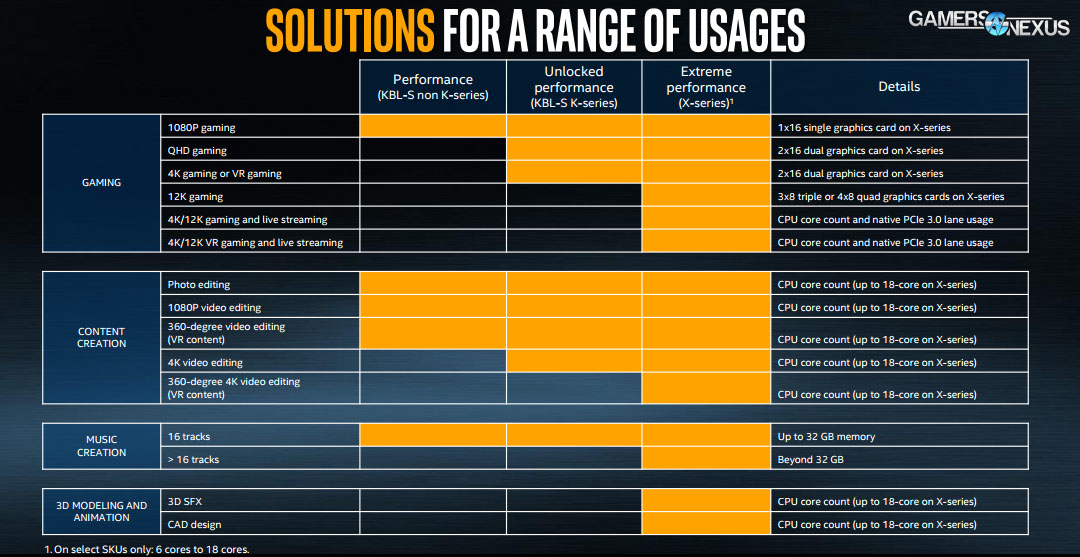
Keeping marketing checked by reality is part of the reason that technical media should exist: Part of the job is to filter out the adjectives and subjective language for consumers and get to the objective truth. Intel’s initial marketing deck contained a slide that suggested their new X-series CPUs could run 3-way or 4-way GPUs for 12K Gaming. Those are their exact words: "12K Gaming," supported by orange demarcation for the X-series, whereas it is implicitly not supported (in the slide) on the K-SKU desktop CPUs. Not to speak of how uncommon that resolution is, this also isn’t a real resolution. Regardless, we’re using this discussion of Intel’s "12K" claims as an opportunity to benchmark two x8 GPUs on a 7700K with two x16 GPUs on a 7900X, with some tests disabling cores and boosting clock. We have also received a statement from Intel to GamersNexus regarding the marketing language.
First of all, we need to define a few things: Intel’s version of 12K is not what you’d normally expect – in fact, it’s actually fewer pixels than 8K, so the naming is strongly misleading. Let’s break this down.
The Slide in Question
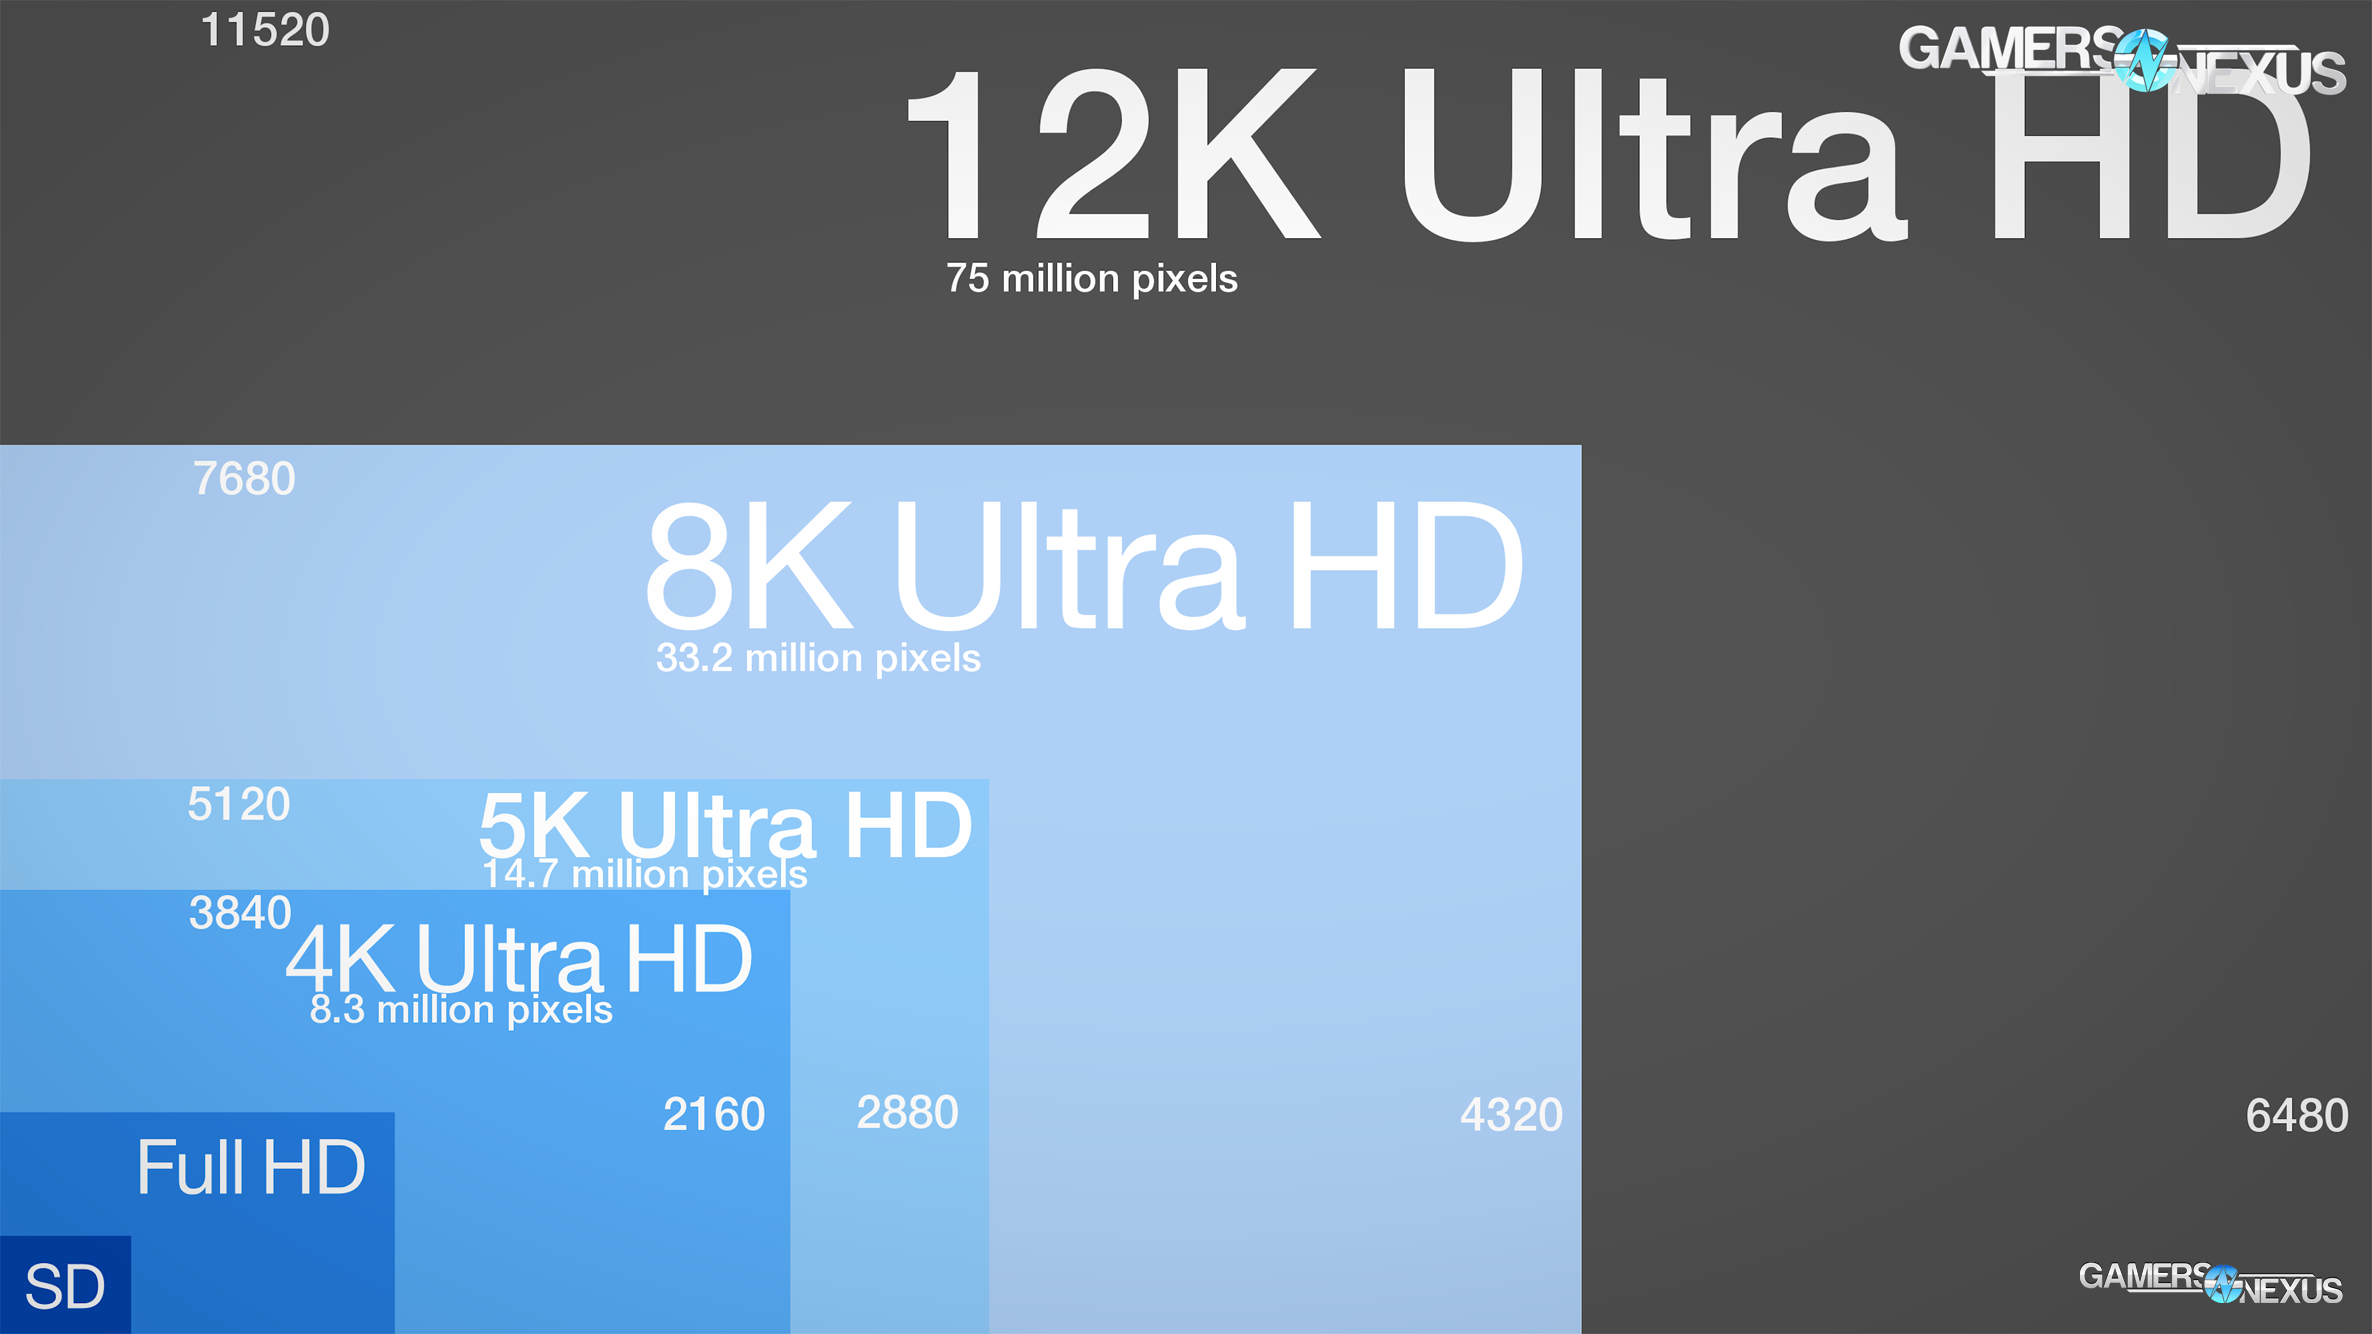
"12K" is Smaller than 8K
Most commonly, "4K" means 3840 x 2160, which equals 8.3 million pixels. Then there’s "5K," which is 5120x2880 resolution and 14.7 million pixels, or 14.7 MP. We next go to 8K resolution at 7680*4320, or 33.2 million pixels, 33 megapixels.
Based on this, we would expect roughly 11520x6480, using 16:9 scaling, which would put us at 75 million pixels, or 75MP. That’s more than 2x the pixel count of 8K, and 12K technically isn’t even officially defined.
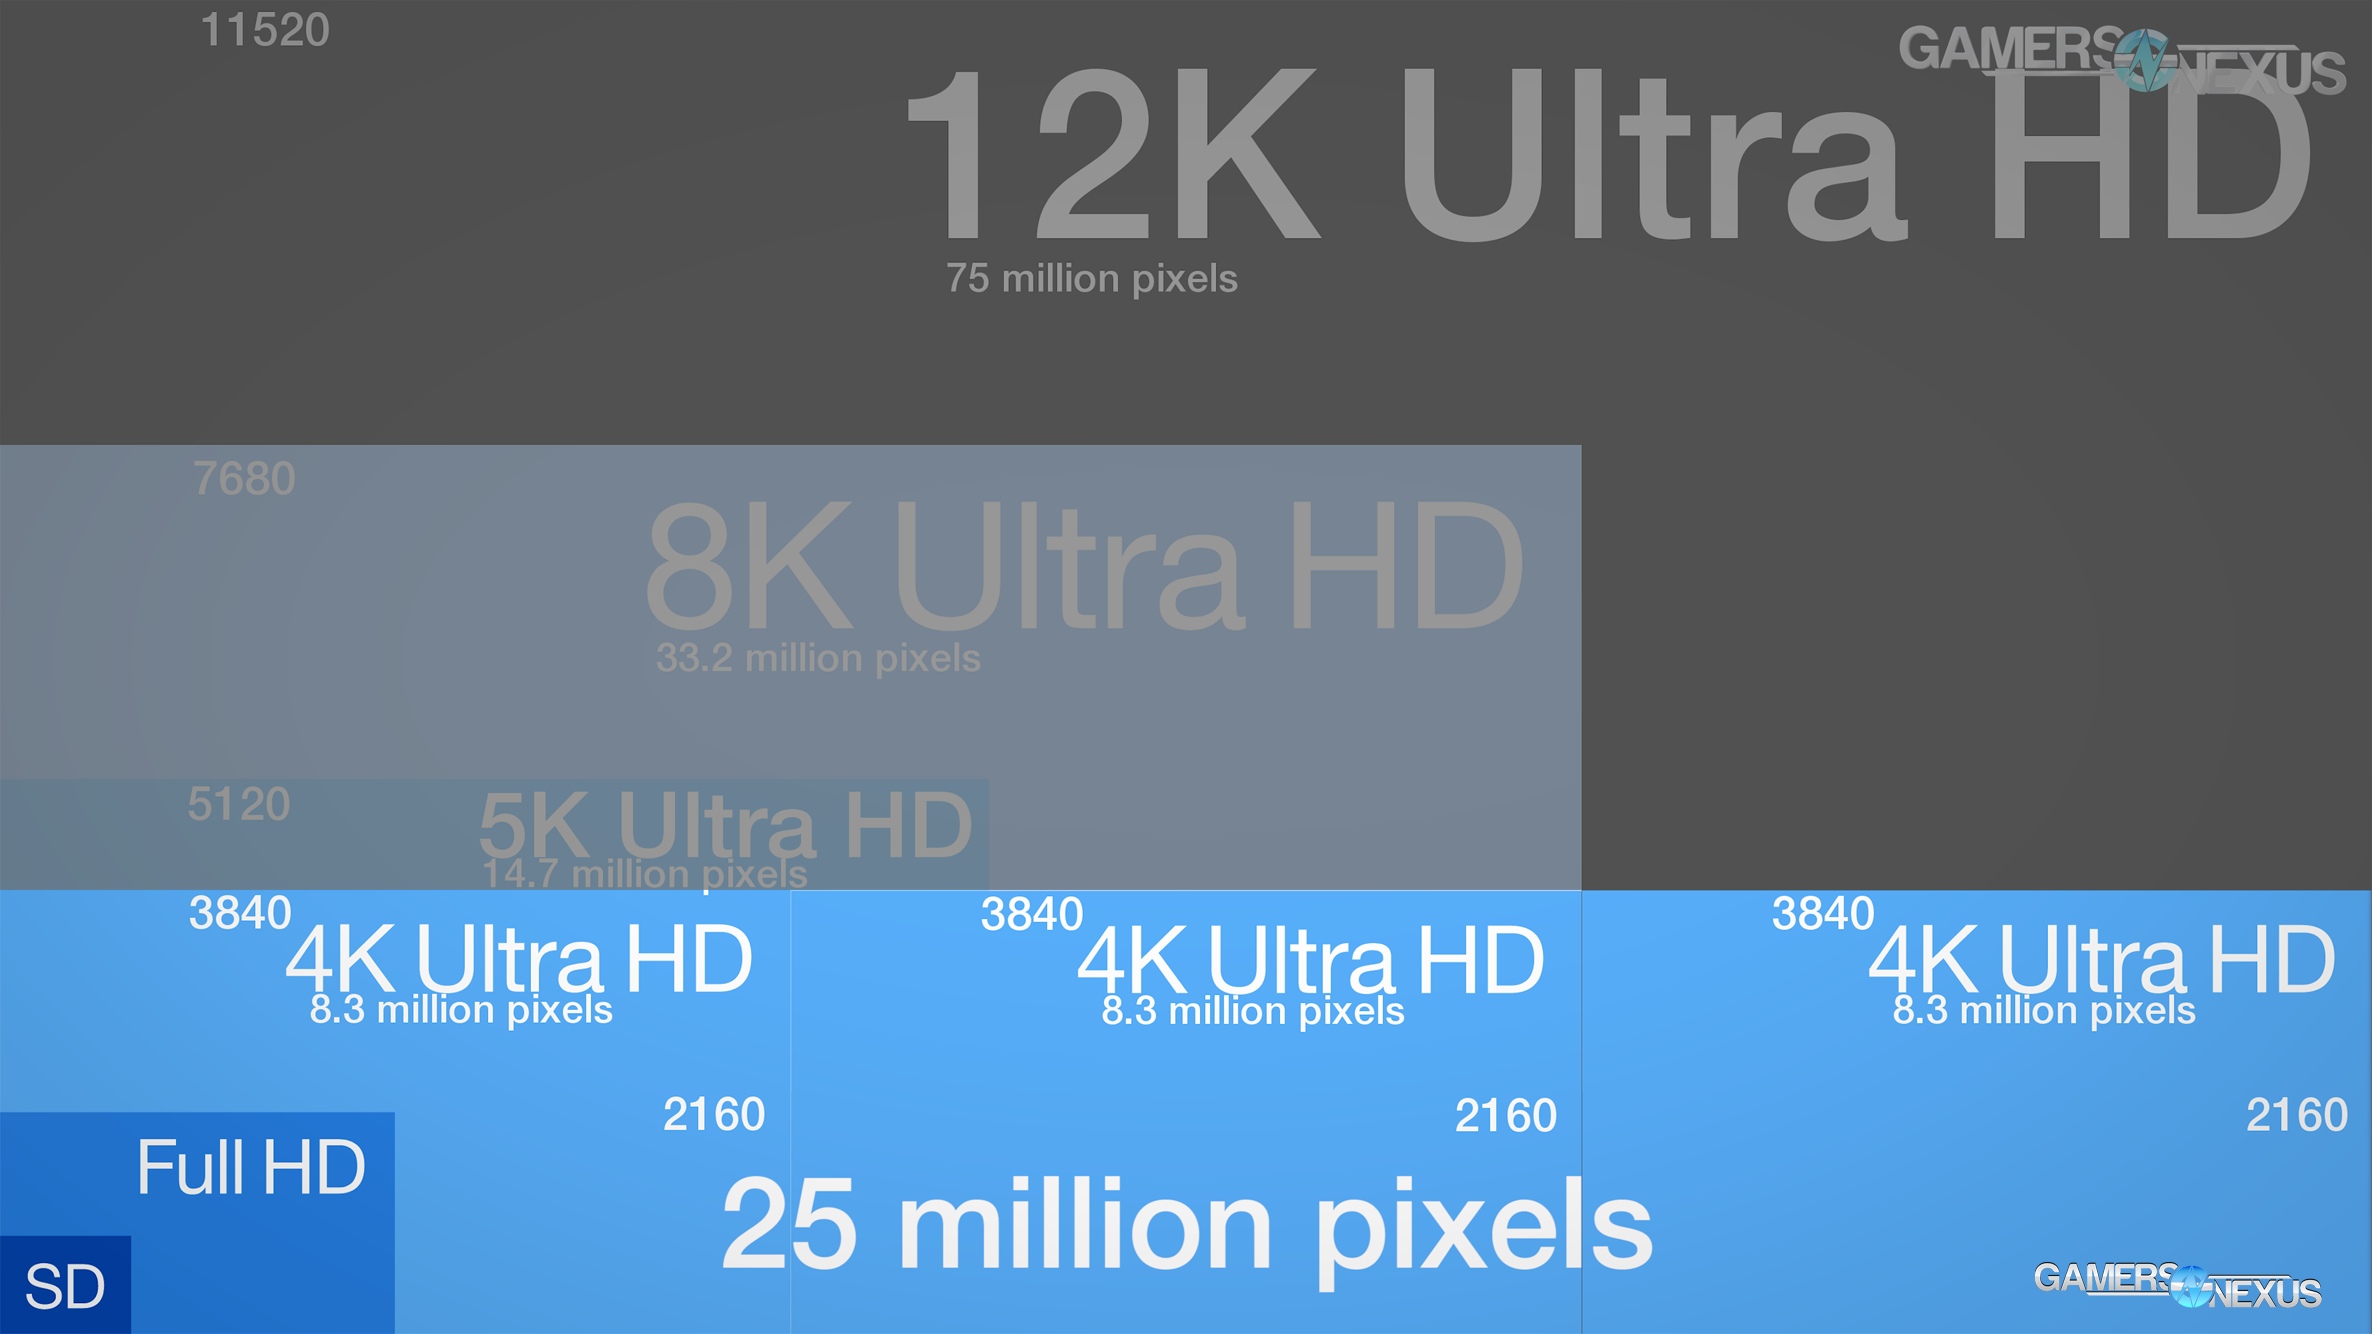
But Intel doesn’t mean 75MP, Intel means 25MP at a resolution of 11520*2160, or 3x 4K displays next to each other. You’d call that "triple-4K," normally, rather than multiply one parameter by 3 and call it "12K." We emailed the company to confirm the actual intended resolution, to which Intel clarified that it did intend 12K to mean 3x 4K displays.
- 8.3MP: 4K (3840*2160)
- 14.7MP: 5K (5120*2880)
- 33.2MP: 8K (7680*4320)
- 25MP: "12K" (3x 3840*2160, or 11520*2160)
- 75MP: Actual 12K (11520*6480)
What we think is 12K:
What Intel means by "12K":
That’s a 3x difference in what the consumer expectation of 12K is and what the actual meaning behind Intel’s marketing is, but even then, that’s not the part that matters. Regardless of some of Intel’s embarrassing marketing for this launch, the part that matters is that they’re claiming a higher resolution performs better on the X-series CPUs. Even with PCIE lane scaling, this is still largely a marketing stunt.
Here’s why: This is a GPU benchmark. Just like when AMD claimed great 4K performance on Ryzen, despite the fact that the GPU actually did the work and that it’s an irrelevant bragging point, Intel is now claiming great triple-4K performance because of the X-series. In reality, the only reason this would ever matter is because of the lane count. So, then, this is basically becoming a PCIE scalability test across multi-GPU configurations.
Intel’s slide indicated that the X series supports 3-way and 4-way SLI more readily for gaming. Intel is correct in that there are more lanes available on the 7900X, but there’s a major flaw here: NVIDIA doesn’t support 3-way or 4-way SLI for gaming. It is physically impossible to play games with 3 or 4 Pascal GPUs. You could argue that you could run 3 Maxwell GPUs, but even 3x 980 Tis would not equate the power of 2x 1080 Tis, and you’re not going to get 4x RX 580s to routinely outperform 2x GTX 1080 Tis. Maybe in Sniper Elite, but that’s a special kind of game for hardware optimization.
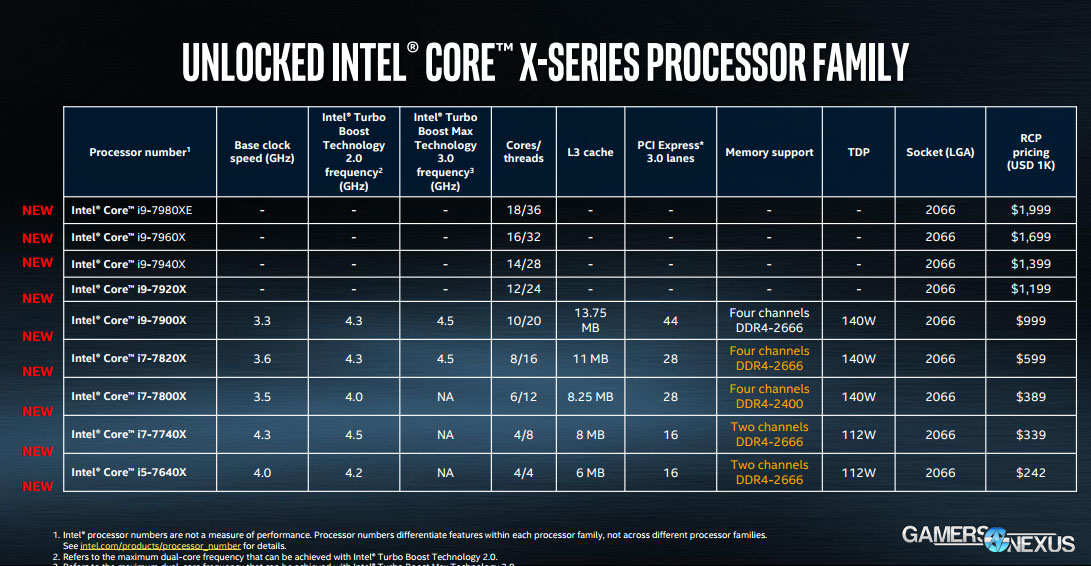
Oh, and, also of import, this slide indicates that the affected SKUs are 6- to 18C parts, despite the fact that the 6C and 8C parts actually have 28 lanes. Sure, that’s still better than the 16 on the 7700K, but that still doesn’t get you to two x16 graphics cards.
We emailed Intel about the fact that 3-way and 4-way SLI on Pascal is not possible for gaming, then asked if the company would like to respond. Intel’s official statement to GamersNexus is the following:
"The 12K gaming mention in the table from our product briefing info for press included an error referring to an older PC gaming GPU configuration. The X-Series platform enables true PCIe 16x + 16x configurations. Whether or not it performs better is dependent on the software and graphics vendor."
That’s cleared-up, then: It was an error. So, having gone through the marketing screw-up and gotten a correction from Intel, what we’re left with is actually a cool testing opportunity to look at PCIE scaling on a platform that’s created something of a lane controversy. This is a scenario where, realistically, 2-way SLI is the only candidate. We can couple 2x GTX 1080 Ti FTWs with the 7900X and pull 32 lanes from the CPU, resulting in 2 x16 lane assignments. On the 7700K, which Intel’s slide implied could not support the same resolution, you’re looking at a 2 x8 configuration.
Testing Procedures
Anyway, let’s get to the testing. Remember: The scope is that Intel is saying an i7-700K isn’t rated for triple-4K, erroneously called "12K," and is saying that the X-series is better for this task. The implication is of better PCIE lane performance, seeing as the threads really won’t matter.
Last time we did an SLI PCIE scaling test, we saw less than 1% difference. This time, we’re being a lot more judicious: We have a minimum (final) run count of 5 test passes per test, with standard deviation to help check for error, and have spoken with nVidia and system integrators about test scenarios that would most likely show a PCIE scaling difference. We also reran the tests three times, mostly because some of the numbers demanded retest to be certain, with both Creator’s Update (game mode off) and without Creator’s Update. Once we’d seen enough consistency in numbers, we ran with the final set from the Creator’s Update version of Windows. It turns out, even in the best possible light, none of it really matters. Well, there’s one exception – we’ll get to that.
We don’t have 3x 4K monitors to test and, frankly, wouldn’t have the space for it. Instead, we’re testing a rarely used resolution – it’s 6651x3741, and if we do the math, that happens to be 24,881,391 pixels. Triple-4K would conveniently be 24,883,200 pixels. The difference is 1809 pixels – that’s insignificant. This allows us to still test with an equal pixel count, effectively, as that’s all that really matters, and do so at a more supported aspect ratio. Getting away from the multi-monitor setup will widen game support as well, which is already a problem when we’re limited to games that only show a difference in SLI to begin with. We’re also using DSR to achieve these resolutions, as we have some tests that go up to 8K – even higher than Intel’s "12K" – and in testing, we’ve seen that DSR scaling is nearly perfect. There’s about a 1-3% performance hit with DSR versus a native output, and that performance hit is applied equally to all tests. In other words, it effectively cancels itself out and is uninfluencing to the numbers we’re taking for PCIe scaling.
Here’s the next important part: Even if we start to see scaling between the two CPUs, it doesn’t immediately indicate a lane advantage creating that scaling. The fact is that the 7900X has 20 threads, so it may juggle very specific games better than the 7700K and its 12 fewer threads can. The speeds are also different. For this reason, we ran a second battery of tests with 12 of the threads disabled, bringing it down to a 4C/8T CPU, and with the clock overclocked to 4.5GHz. We then validated this with Cinebench and synthetic passes, finding that the 7900X 8T variant was performing nearly identically to the 7700K. There was a difference in single-core performance of about 6 points in Cinebench. It’s not perfect, but gets us close enough. In the past, we’ve done these SLI scaling tests by using the same CPU and changing the PCIe version of the slot occupied by the GPUs. Some boards allow this. Today, because we are ultimately verifying Intel’s marketing statements, we’ve got those extra variables to juggle – but we’re keeping the real-world scenario of a 10C/20T CPU at its native speed vs. the 7700K. This will help us understand if Intel’s "12K" marketing language has any ground on which to stand.
Also of importance, very few games actually scale with multi-GPU anymore, and even fewer scale well enough to potentially stress the PCIe interface. Synthetic benchmarks, however, do stress that bus heavily – so we’re starting with FireStrike, TimeSpy, Superposition. We’ll then move on to Ashes of the Singularity, Crysis 3 – which is surprisingly good for SLI scaling and PCIE testing, and Sniper Elite 4, which has nearly 2x scaling in multi-GPU. Total War is also present. The goal is to really drag down the GPUs as far as possible to evoke a PCIE lane difference. This isn’t the most comprehensive collection of games in the world, but the nature of the test means that it doesn’t have to be: We’re intentionally choosing games which have known good scaling on multi-GPU – a rarity – and which may have shown scaling in past PCIe testing (Crysis, FireStrike). Once we’ve determined if those can produce a difference, we can worry about if more tests need to be added.
For ease, we’re referring to 6651x3741 as a 25MP resolution.
Test systems are using:
- 2x GTX 1080 Ti FTWs ($780 x2) from EVGA
- MSI High-Bandwidth SLI Bridge
- 32GB of G.Skill Trident Z memory at 3200MHz & CL14 (both platforms)
- NZXT Kraken X62 CLC at max RPM
- NZXT Hale92 v2 1200W PSU
- Windows 10 with Creator's Update, but with Game Mode disabled
Platforms & CPUs:
FireStrike Ultra at 25MP: PCIe x8/x8 vs. x16/x16 SLI Benchmark
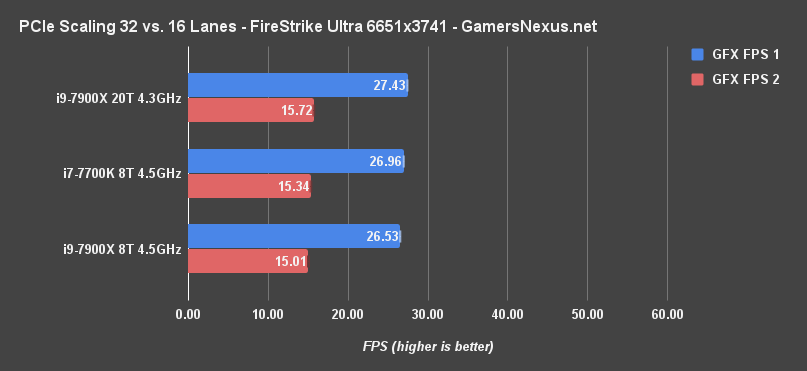
We’re starting with FireStrike configured to its Ultra settings and a 25MP resolution, the ~same pixel throughput as triple-4K. We’re seeing the i9-7900X CPU and dual 1080 Ti FTWs operate with GFX scores of 27.4 and 15.7, compared to the 7700K’s scores of 26.96 and 15.34. This data was collected over five test passes (with three complete retests, remember), producing a margin of variance of +/-0.1FPS. We’re looking at a performance difference in the range of 1-2%, max. We could somewhat confidently state that the extra 8 lanes account for this, but the additional CPU variable throws a wrench in things. Configuring it to 8T & 4.5GHz, the 7900X runs a framerate closer to the 7700K. This averages out to 26.53FPS for GFX1 and 15.01FPS for GFX2. Once we’ve controlled for threads and speeds, even that 1-2% window mostly goes away.
The graphics score difference comes down to 4597 versus 4497, a 100-point difference, which is again accounted for by less than 1FPS for GFX1, and less than 0.5FPS for GFX2.
FireStrike Ultra at 4K: PCIe x8/x8 vs. x16/x16 SLI Benchmark
Let’s go down to FireStrike Ultra at 4K, just because. This makes the test easier and gives some more perspective.
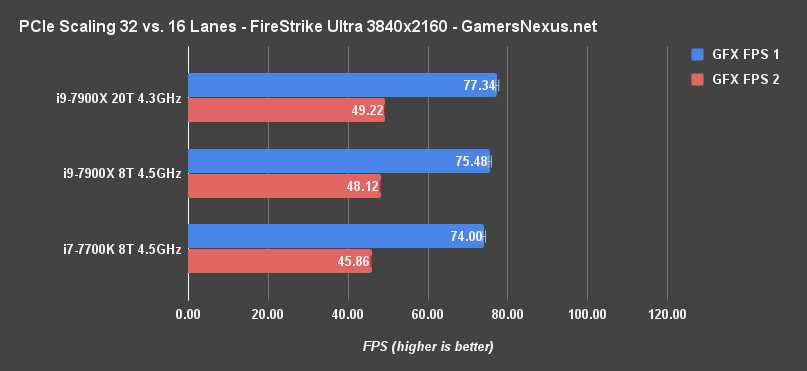
Now, by eliminating enough load from the GPU to allow the CPUs to start showing difference, we see scaling of a couple frames. The difference is about 3FPS on GFX1, with the 7900X in the lead, and about 3-4FPS on GFX2. But again, at this point, we can no longer confidently state the difference: The CPUs are non-equal. Disabling threads and normalizing for speed helps with that confidence: The 8T 7900X is running a 75.48FPS GFX1 score and 48.1FPS GFX2 score. That brings us to about a 2% difference in GFX1. At this point, it looks like that could be an advantage of the extra lanes. We’re not fully confident, but the data does seem to point us in this direction of a ~1-2% performance uplift from the extra lanes.
TimeSpy at 4K: PCIe x8/x8 vs. x16/x16 SLI Benchmark
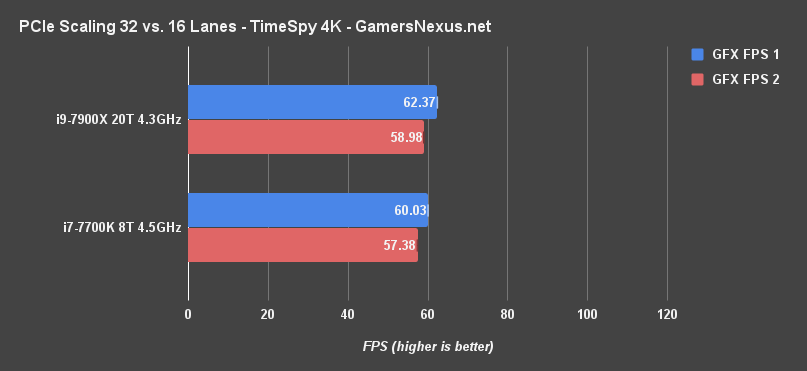
TimeSpy doesn’t have our 25MP configuration, so we also ran it at 4K. This one posts an FPS difference of about 2.3FPS for GFX1, the 7900X leading, and about 1.6FPS for GFX2. Respectively, the percent scaling yields an increase in performance of 3.9% and 2.8% for the 7900X. This difference, again, starts to hinge more on the CPUs at 4K than on the lanes. Again, given the CPU differences and the motherboard differences, these swings are mostly insignificant.
Let’s increase resolution and load on the GPUs again, just to really stress the PCIE interface.
Superposition at 8K: PCIe x8/x8 vs. x16/x16 SLI Benchmark
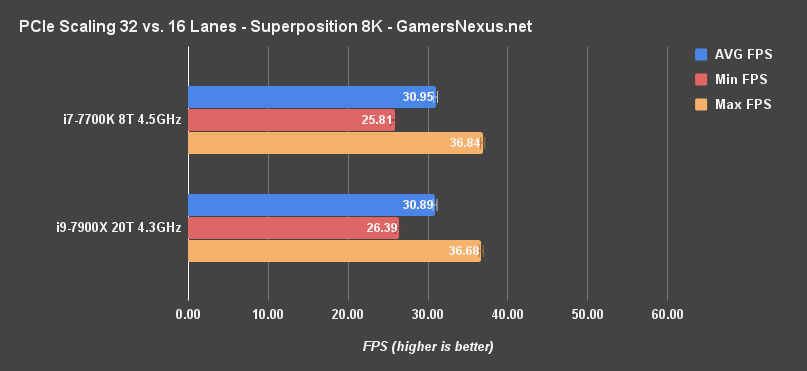
With Unigine Superposition on its 8K optimized settings, which is a higher pixel count of 33MP versus 25MP of triple-4K, we’re seeing an AVG FPS across 5 runs of 30.89 versus 30.95. This difference is within our test variance, with our margin of error calculating out to +/- 0.25FPS. Again, they’re basically equal. Even the minimums output by the software are close, with the maximums also nearly equal. The score, if you’re curious, comes out to 4129.5 on the 7900X versus 4138 on the 7700K. We’re within variance. They are the same. That PCIE lane advantage isn’t helping here, and the X-series in our testing isn’t better at this nigh-unattainable 8K resolution.
Crysis 3 at 25MP: PCIe Lane Scaling with 1080 Tis in SLI
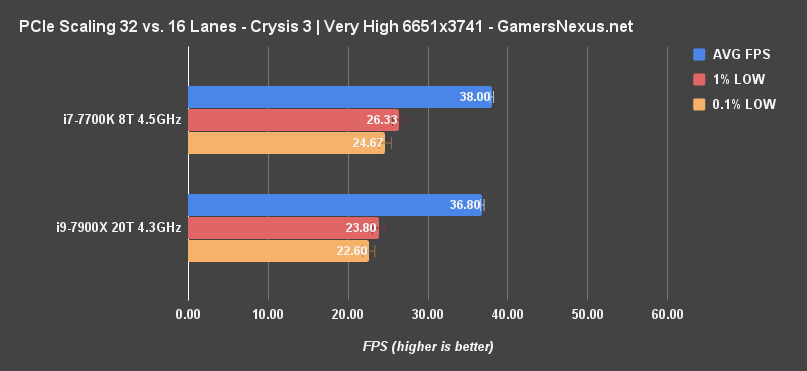
Let’s get back to the 25MP number by using games. With Crysis 3 – which is old, but still one of the best graphics benchmarking tools available for PCIE lane scalability – we’re seeing a difference of about 1FPS AVG. Our test variance here is 0.76FPS, which means that our CPUs are again effectively equal. We cannot confidently declare that one is better than the other. And, of course, because everyone just looks at the charts to claim a victor, people are still going to say the 7700K is faster. That might be true after a dozen or more additional test passes, but we must abide by the confines of reality and our numbers: Our numbers say the two CPUs are equal in their respective configurations, and are within test-to-test variance of one another (+/- 0.76FPS).
Ashes of the Singularity: PCIe x8/x8 vs. x16/x16
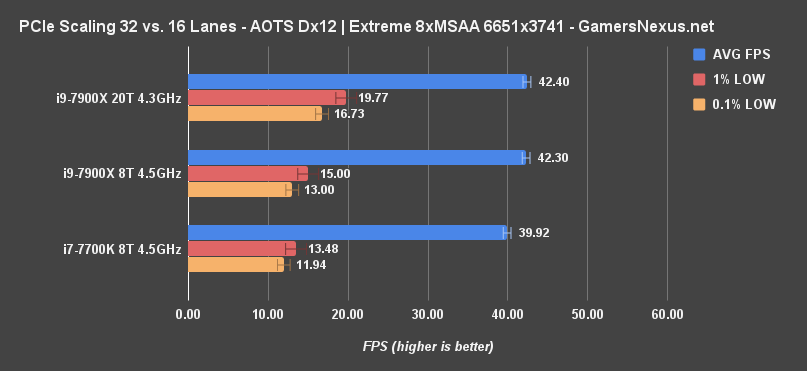
Ashes of the Singularity at 25MP and Extreme settings, using 8xMSAA and Dx12, stresses the GPUs to a point of running at around 40FPS.
But with regard to scaling performance, it’s not a huge difference – though we are seeing more of one than in the other titles. This is a Dx12 bench, so that could account for some of the difference. The 7700K runs at 39.9FPS AVG, 13.5FPS 1% LOWs, and 11.9FPS 0.1% LOWs. Compared to the 4C/8T 7900X variant, which starts at 42FPS AVG, we’re looking at a performance increase with the extra lanes of about 5-6%. Our confidence in this number is high, and we can point to a potential impact from PCIe lanes. The 7900X without its overclock does better in frametime variance, consistent with our upcoming Sniper Elite results. This is also consistent with a lot of our overclock data, regarding low-end frametime performance.
Sniper Elite 4: PCIe x8/x8 vs. x16/x16 SLI
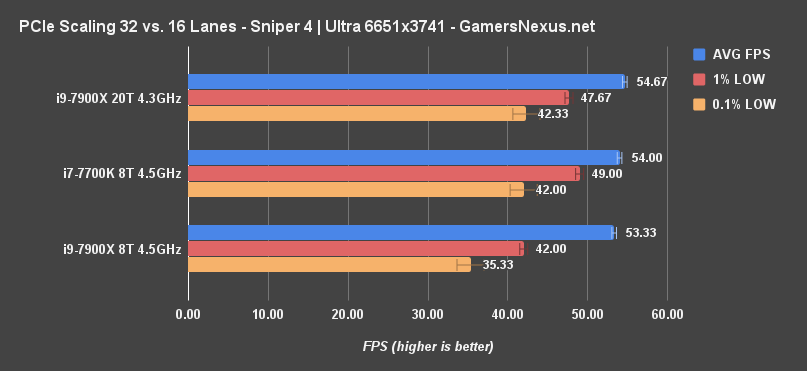
Sniper Elite 4 is a special kind of game. In our most recent multi-GPU benchmark, we showed about 100% scaling with CrossFire RX 580s in Sniper Elite only. Very few modern games manage this feat. With this game, we’re seeing scaling of about 100% even with Dx11, which was used because nVidia’s cards seemed to put more load on the PCIe bus.
Even with all of this going for it, with all that utilization of both GPUs, we’re seeing Sniper Elite 4 roughly tied between tests. The 7700K runs at about 54FPS AVG, with 49 and 42FPS lows. The average was 54FPS every single pass, so that’s consistent, and the lows have a +/- error of 1.7FPS. The 7900X 8T CPU ran about 53-54FPS AVG, with a range of 0.3FPS, with lows at 42 and 35, with a +/- range of 0.5 and 1.7FPS. Some of this difference in lows can be chalked-up to our increased voltage and the overclock, which sometimes show frametime variance. The non-overclocked 7900X was more stable, at 55FPS, 48FPS, and 42FPS.
Total War: Warhammer PCIe Lane Scaling
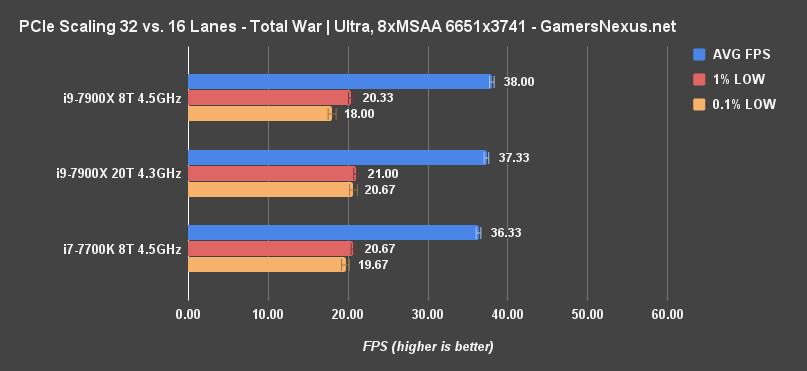
Finally, Total War: Warhammer helps us get a wider spread of game variety. The 7700K runs an average FPS of around 36 here, with lows at 21 and 20. The 7900X manages 37FPS AVG, but has too many other variables at play. Increasing the clock speed and disabling 12 threads makes for a better test, putting us at 38FPS AVG. The clock speed matters more than the cores in this game, but it’s clear that the CPU is still at play here. We cannot confidently state an advantage from PCIe lanes alone. If there is one, it’s in the range of 3-5.5% and would vanish the moment you decrease load on the GPUs and increase load on the CPUs.
Conclusion
Now, again, we typically try to use the same CPU and then just change the PCIe slots or change the PCIe version; today's test isn’t the most comprehensive way possible to look at lane scaling, but that’s also not the standalone point. The point was to verify Intel’s marketing statements, which we’ve done, and see if there’s a meaningful experience difference. Ultimately, there’s not one. In our testing, the 7700K is just as capable – or incapable, if you look at it that way – of playing at "12K" and 8K as the 7900X.
Also, keep in mind that we’re actively trying to create a scenario where GPU load hits a point of stressing the PCIe interface, which means hand-selecting benchmark software and games. That means picking titles which have known-good multi-GPU scaling – those hardly exist anymore. It also means that we’re running these games with ultra settings, 8-tap MSAA, and a 25-megapixel resolution. No one would ever realistically do that with the current devices on the market, seeing as you could actually play triple-4K (barely) by adjusting settings closer to medium. The result of this realization is that anyone actually playing would see a lower load level on the GPUs than what we see here – that means lower strain on the PCIe bus, and that means that even the occasional couple-percent difference in scaling becomes a wash. It’d go away as other limits enter the field, like the CPU clock or thread count. Those would matter far before the PCIe limits when actually trying to play at these triple-4K resolutions.
We’re glad that Intel has clarified the error in the slide deck, but we still fundamentally disagree with the sentiment of there being a meaningful difference at this task between the 7700K and X-series CPUs.
Editorial: Steve Burke
Video Producer: Andrew Coleman