AMD Radeon R9 Fury X Review, Benchmark, & Architecture Drill-Down vs. GTX 980 Ti
Posted on
The Fury X has been a challenging video card to review. This is AMD's best attempt at competition and, as it so happens, the card includes two items of critical importance: A new GPU architecture and the world's first implementation of high-bandwidth memory.
Some system builders may recall AMD's HD 4870, a video card that was once a quickly-recommended solution for mid-to-high range builds. The 4870 was the world's first graphics card to incorporate the high-speed GDDR5 memory solution, reinforcing AMD's position of technological jaunts in the memory field. Prior to the AMD acquisition, graphics manufacturer ATI designed the GDDR3 memory that ended up being used all the way through to GDDR5 (GDDR4 had a lifecycle of less than a year, more or less, but was also first instituted on ATI devices).
The Fury X is AMD's flag-bearer for a new form of high-speed memory that, regardless of how the Fury X performs, will inevitably become the future of graphics memory for both major manufacturers. In this respect, the card has been difficult to review as it has required a substantial investment in the research process to fully understand the implications of HBM. The architecture is somewhat analogous to the Tonga GPU found in the R9 285 solution, but is more comparable in the vertical to where Hawaii – found on the R9 290X – once rested.
This Fury X review will explain the architecture and HBM, then dig into CrossFire performance, frametimes, the thermal envelope and CLC, and overclocking potential. Direct comparisons pitting the AMD Radeon R9 Fury X vs. the GTX 980 Ti will be made, including coverage of EVGA's GTX 980 Ti Hybrid, a liquid-cooled competitor at the high-end.
AMD R9 Fury X Specs
| AMD R9 Fury X | |
| Fab Process | 28nm |
| Stream Processors | 4096 |
| Base Clock (GPU) | 1050MHz |
| COMPUTE | 8.6 TFLOPs |
| TMUs | 256 |
| Texture Fill-Rate | 268.8GT/s |
| ROPs | 64 |
| Pixel Fill-Rate | 67.2GP/s |
| Z/Stencil | 256 |
| Memory Config | 4GB HBM |
| Memory Interface | 4096-bit |
| Memory Speed | 500MHz / 1Gbps |
| Power | 2x8-pin 275W TDP |
| Others | PCI-e 3.0 Dx12, Vulkan, Mantle support |
| Price | $650 |
Up to Speed: Recapping 300 Series, Pump Whine, & Drivers
AMD has made major efforts in the past few weeks. The company hasn't released a new round of GPUs in around two years – excluding the R9 285, which launched late last year – and AMD has remedied this with back-to-back graphics card launches. The first was the Radeon 300 series, of which we reviewed the R9 390 and R9 380.
To bring everyone up to speed, the 300 series cards are all refreshes – not quite a hard “rebadge” – of their 200 series counterparts. The R9 285 introduced “Tonga” with a few years' worth of architectural tuning, but did everything short of implementing a fresh architecture. These improvements were distributed across the board on the 300 series. Other upgrades to the 300 series cards include a tuned power envelope that marginally lowered TDP, a ~50MHz clockrate boost, and introduction of a few software-side features. Our general conclusion was that owners of 200 series cards would see zero compulsion to “side-grade” to the 300 series, furthering that some 200 series prices (like a $270 R9 290X, now expired) made the previous line more desirable than the 300 series. These prices haven't remained as favorable as we've distanced from launch, but that was the first impression.
The 300 series was largely uninspiring in this regard.
Then came Fury – finally. Some of our initial analysis found high-frequency pump whine that was emitted on both of our retail cards, a fact that was supported by numerous other outlets reporting on the same issue. Our conclusion was that the whine was a non-issue for users building in an enclosure, though open air use was discouraged given the irritating whine. More on this later.
The question of drivers lasted only for a brief period. Online discussion was spurred by the disparity between AMD's initial benchmarks – showing huge gains over the 980 Ti – and reviews, which often showed the 980 Ti winning. A few users pointed toward drivers, thinking that the B8 and B9 press drivers were underperformers against the official 15.15.1004 launch drivers. We tested all three, finding zero difference.
AMD's New Fiji Architecture
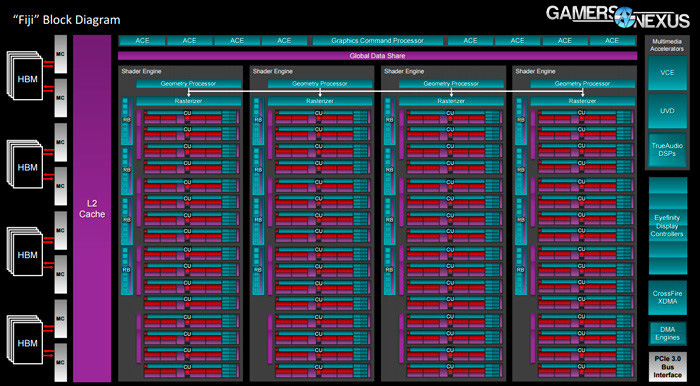
AMD's Fiji architecture is potentially the last AMD candidate on 28nm process. AMD has been producing 28nm chips since 2011 – nVidia is in a similar boat – and TSMC's process is almost fully mature at this point. The Fiji die has met the reticle limit imposed by lithographic lenses in stepper / scanner systems; it is not possible to go “bigger” on the die size without moving to a new fabrication process.
This “Big GPU” approach is one that both AMD and nVidia have taken for their high-end chips, with the GM200 sizing up similarly: the Fury X's Fiji GPU is 596mm^2, only slightly smaller than the massive GM200's 601mm^2. Building a larger package allows the manufacturing process to cram more transistors into the space and, as a bonus, helps spread heat over a larger surface area.
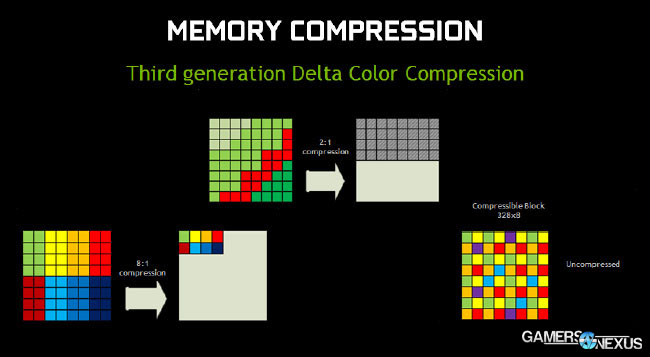
Fiji hosts an updated version of AMD's Graphics Core Next (GCN) architecture. The Fiji version of GCN (1.2) adds a new level of delta color compression that offers a 40% bandwidth efficiency increase – not dissimilar from Maxwell's own strides with delta color compression – and can compress tiles at a ratio of 8:1. Delta color compression is something we've described in the past. The below graphics are from an nVidia deck, but describe the technology well and apply to AMD as much as they do to nVidia:
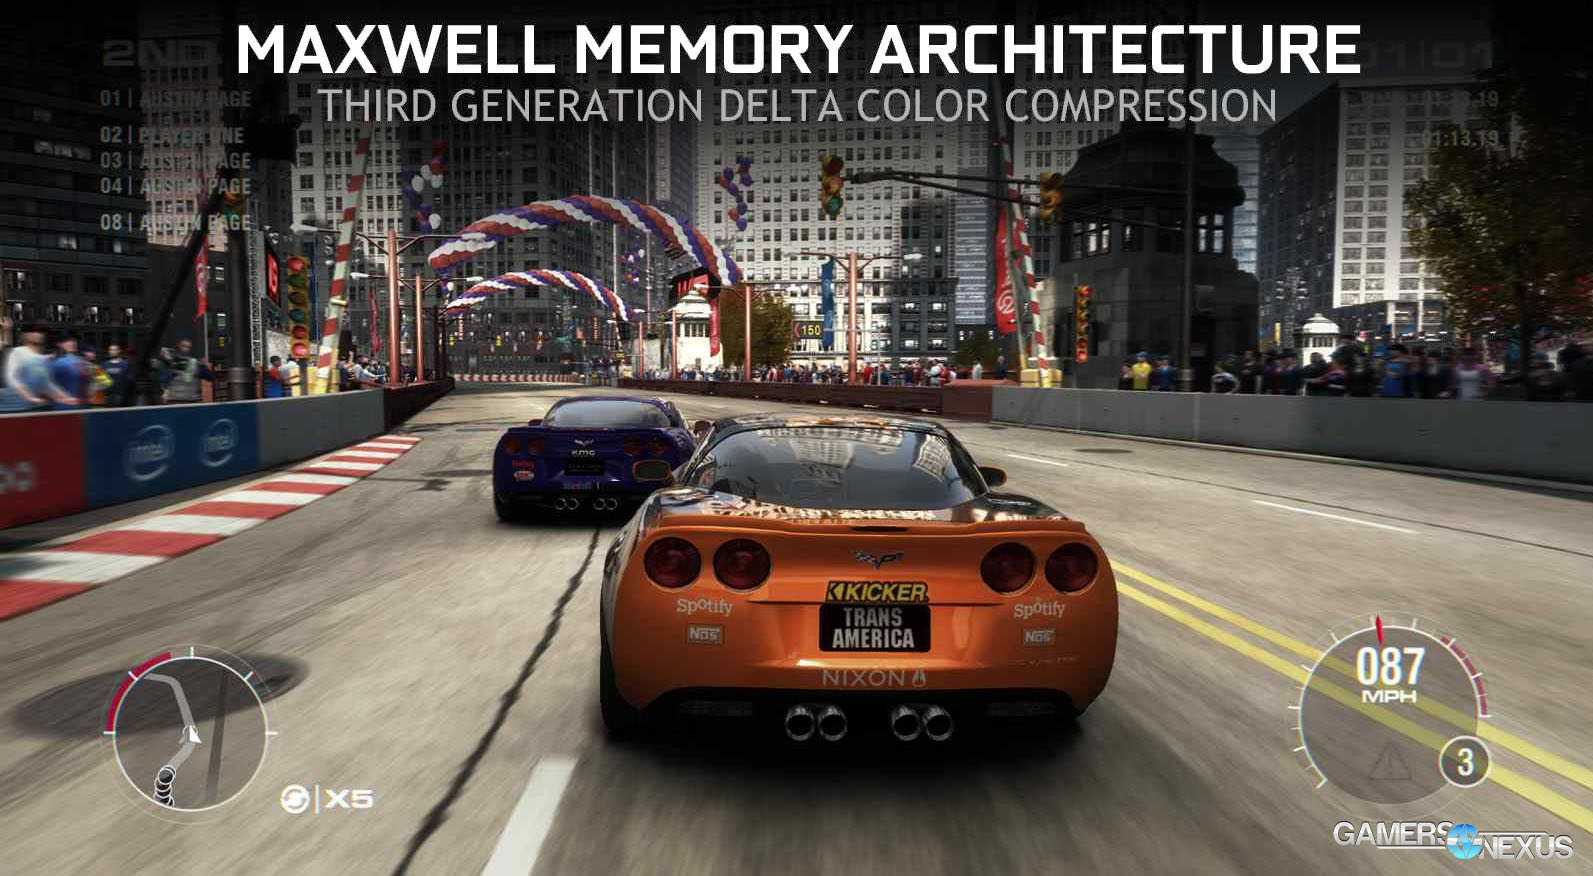
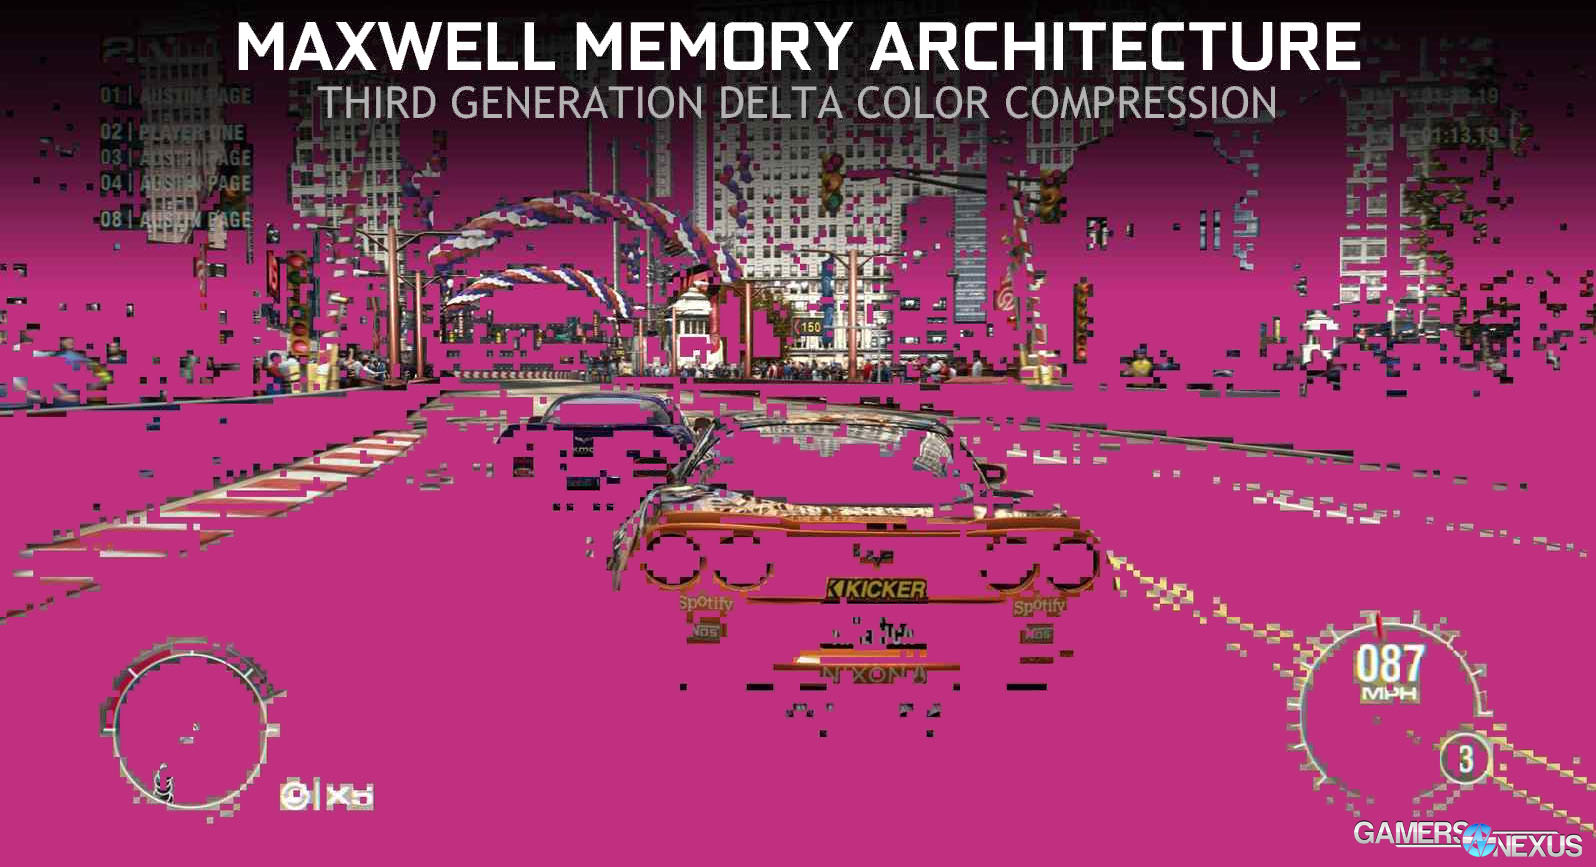
For those who didn't see this in our GTX 980 review, the top-level is fairly simple. Delta color compression analyzes pixel color temporally, frame-to-frame, and calculates a delta value output when drawing the pixel's new color. To this end, the GPU modifies color values only when there is a change, and even then, it further reduces workload by functioning on delta values rather than absolute values.
In the above samples, the first frame (n) has been drawn by the GPU and rendered. Frame n+1 – that is, the next frame – doesn't need to redraw all of these absolute color values for every pixel on the screen. Instead, frame n+1 draws only the delta values (the pink highlight helps show color change temporally). This reduces bandwidth saturation.
Other GCN updates further what was already done on the 300 series, primarily including improved power efficiency. This is done in several ways on the Fury X, not the least of which is its implementation of a CLC – but more on that in a moment. Reducing the power envelope was made possible by gating power provided to internal components of the GPU. The most noteworthy is the shader array, which throttles when not in demand: If the GPU detects that shader units are unloaded, it will modulate power assignment to those shader units (effectively cutting off the power) to reduce maximum power consumption. The shift to HBM inherently grants further power efficiency gains. Fiji also saw the introduction of APU frequency scaling algorithms, which throttle-down the clockrate when high speeds are unnecessary. This is similar to nVidia and Intel throttling chips and “boosting” when under load. AMD's dynamic voltage tech on APUs was also migrated to Fiji, modulating voltage levels dependent upon load. Both of these assist in power reduction.
The Fury X's next major improvement is its tessellation throughput, which uses small instance caching to improve draw call performance – somewhat of a specialty for AMD – by caching repeat geometry local to the GPU. As with any caching system, utilizing GPU cache eliminates the need of traversing the memory interface to access the on-card VRAM, resulting in a significant speed improvement for cached assets. Vertex data is also cached in a more extensive fashion than on Hawaii and Tonga's iterations of GCN.
AMD has historically suffered from poor tessellation and processing of complex geometric objects, but has long offered a strength in draw call performance that has been restricted by APIs. Fiji's architecture helps improve tessellation performance substantially with lower taps (x8, x16) over Hawaii and Tonga.
Fiji's SIMD uses a 64 asset-wide wavefront, providing a huge amount of lane potential for pixel and vertex shaders, depending on width of each. This grants GCN some versatility and theoretical advantages for multi-purpose use over Maxwell's gaming-targeted 32-wide warp (nVidia's name for “collection of threads”). This is part of why we see COMPUTE-bound users on nVidia often favoring Kepler architecture to Maxwell. For AMD, algorithm-level tuning of SIMD lane sharing will grant advantages in OpenCL for data structures, but doesn't do much for gamers. This contributes to the root-cause of the AMD-nVidia performance disparity in COMPUTE and gaming applications.
We'll talk about whether Fiji is more ROPs- or triangle-bound at higher resolutions once we get to the benchmarks.
High-Bandwidth Memory is the big “thing” for AMD's Fury X. The first implementation is limited to 4GB capacity, but exhibits unbelievably high throughput on an unprecedented 4096-bit wide memory interface. We'll talk more about how HBM works in an in-depth article soon.
Testing Methodology
We tested using our updated 2015 Multi-GPU test bench, detailed in the table below. Our thanks to supporting hardware vendors for supplying some of the test components.
The latest AMD Catalyst drivers (15.7) were used for testing. NVidia's 353.3 drivers were used for testing. Game settings were manually controlled for the DUT. All games were run at 'ultra' presets, with the exception of The Witcher 3, where we disabled HairWorks completely, disabled AA, and left SSAO on. GRID: Autosport saw custom settings with all lighting enabled. GTA V used two types of settings: Those with Advanced Graphics ("AG") on and those with them off, acting as a VRAM stress test.
Each game was tested for 30 seconds in an identical scenario, then repeated three times for parity.
| GN Test Bench 2015 | Name | Courtesy Of | Cost |
| Video Card | GamersNexus Reader [Loaner] | $650 | |
| CPU | Intel i7-5930K CPU | iBUYPOWER | $580 |
| Memory | Kingston 16GB DDR4 Predator | Kingston Tech. | $245 |
| Motherboard | EVGA X99 Classified | GamersNexus | $365 |
| Power Supply | NZXT 1200W HALE90 V2 | NZXT | $300 |
| SSD | HyperX Savage SSD | Kingston Tech. | $130 |
| Case | Top Deck Tech Station | GamersNexus | $250 |
| CPU Cooler | Asetek 550LC Liquid | Asetek | - |
Average FPS, 1% low, and 0.1% low times are measured. We do not measure maximum or minimum FPS results as we consider these numbers to be pure outliers. Instead, we take an average of the lowest 1% of results (1% low) to show real-world, noticeable dips; we then take an average of the lowest 0.1% of results for severe spikes. Anti-Aliasing was disabled in all tests except GRID: Autosport, which looks significantly better with its default 4xMSAA. HairWorks was disabled where prevalent. Manufacturer-specific technologies were used when present (CHS, PCSS).
Overclocking was performed incrementally using MSI Afterburner and AMD's OverDrive. Parity of overclocks was checked using GPU-Z. Overclocks were applied and tested for five minutes at a time and, if the test passed, would be incremented to the next step. Once a failure was provoked or instability found -- either through flickering / artifacts or through a driver failure -- we stepped-down the OC and ran a 30-minute endurance test using 3DMark's FireStrike Extreme on loop (GFX test 2).
Thermals and power draw were both measured using our secondary test bench, which we reserve for this purpose. The bench uses the below components. Thermals are measured using AIDA64. We execute an in-house automated script to ensure identical start and end times for the test. 3DMark FireStrike Extreme is executed on loop for 25 minutes and logged. Parity is checked with GPU-Z.
| GN Test Bench 2015 | Name | Courtesy Of | Cost |
| Video Card | This is what we're testing! | Various | - |
| CPU | Intel i7-4790K CPU | CyberPower | $340 |
| Memory | 32GB 2133MHz HyperX Savage RAM | Kingston Tech. | $300 |
| Motherboard | Gigabyte Z97X Gaming G1 | GamersNexus | $285 |
| Power Supply | NZXT 1200W HALE90 V2 | NZXT | $300 |
| SSD | HyperX Predator PCI-e SSD | Kingston Tech. | TBD |
| Case | Top Deck Tech Station | GamersNexus | $250 |
| CPU Cooler | Be Quiet! Dark Rock 3 | Be Quiet! | ~$60 |
Acoustics Testing
Acoustics testing requires stricter environment controls than any other tests we perform. All ambient sources of noise must be removed from the environment. For purposes of this testing, we powered-down all devices not under test in the room, turned off AC, and disconnected bench fans that were not mission-critical. The only fans left enabled were for the radiators and video cards (where applicable). Solid-state drives are used exclusively on our bench to eliminate hard drive vibration and spindle noise.
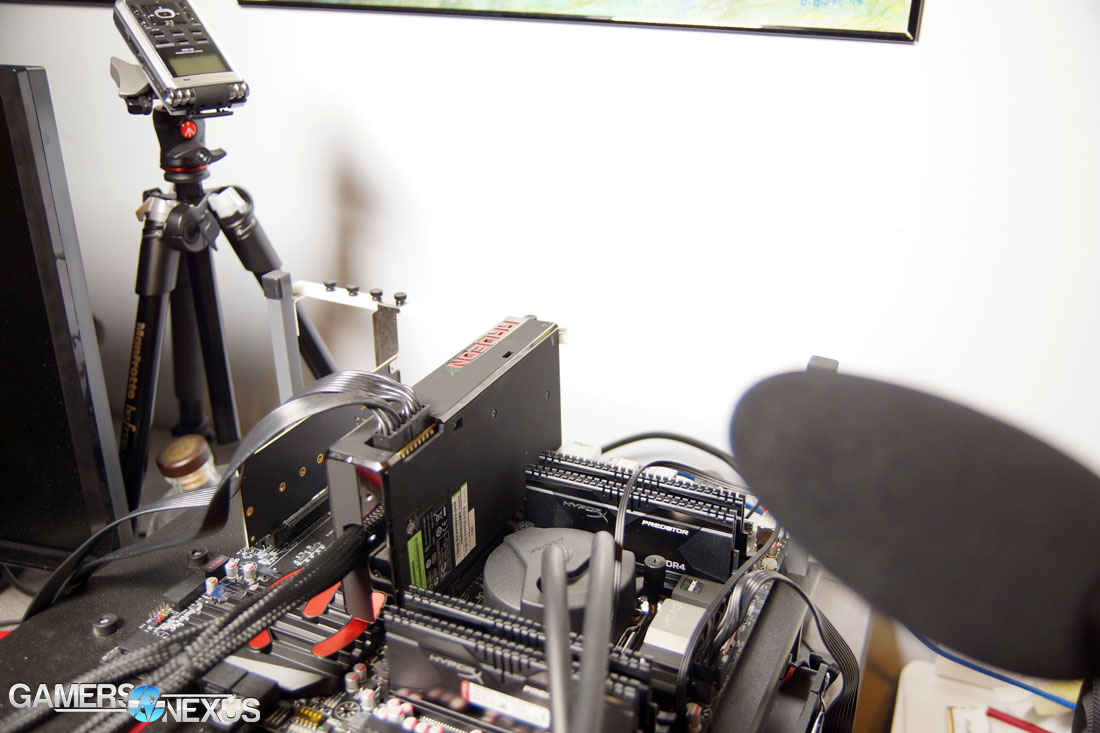
A reporter-class Roland R-05 recorder was mounted atop a tripod positioned precisely 11.5” away from the system. The recorder was positioned at a 45-degree angle above the video cards, with the recorder pointed down toward the center of the card – where the pump resides. The R-05 was left in this position, untouched, throughout the entirety of the test process, including during video card swap-outs.
A rough one-foot distance from the DUT (device under test) is necessary for user representative acoustics data. We also tested with a sensitive microphone mounted atop the memory for a 1.75” distance from the AIB, but the results of such a close measurement are in no way representative of what an end user would encounter, even on an open bench. This would be the equivalent of placing your ear against the backplate of the video card (do not do this). The additional layer of audio logging was used as a means to validate our own testing and offer redundancy. The proximity allowed us to hear the actual liquid exchange within the chamber of the 980 Ti Hybrid, which is more of a curiosity than an actionable dataset. This will be played-back in our next YouTube video.
A third microphone (Sennheiser MKE600 shotgun) was mounted to our Canon XA20 at 11.5" from the rear of the video card. Note that these additional two microphones were used during analysis to determine if the noise was worse from any particular direction; they were also used in the event that one microphone struggled to pick-up the audio. Ultimately, all charts below were generated using data from the R-05.
We tested the following cards:
- AMD R9 Fury X #1 (retail)
- AMD R9 Fury X #2 (retail)
- NVidia GTX 980 Ti (reference)
- NVidia EVGA GTX 980 Ti Hybrid
Acoustics logs were dumped into Audacity and validated in Adobe Soundbooth. We then used a frequency spectrum analysis tool to map the dB levels against the frequency range. Note that the R-05 uses various hi- and low-gain hardware and software switches to improve pick-up.
Note that AMD's Fury X manual demands installation of the radiator with the tubes oriented at the bottom of the radiator (vertically installed). For our testing, we installed the radiator as suggested, orienting the tubes toward at the bottom of the additional liquid chamber.
3DMark Extreme was run on loop to provoke the whine.
Cooling Solutions
The EVGA 980 Ti Hybrid is the key differentiator for this benchmark. Both the Fury X and 980 Ti Hybrid utilize CLCs for thermal dissipation, but execute their cooling solutions in a markedly different fashion.
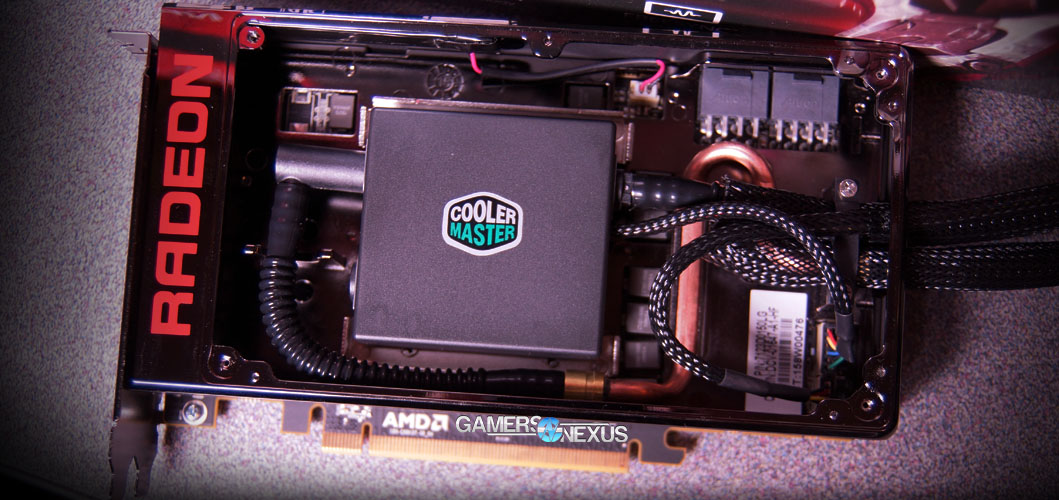
In the case of the R9 Fury X, AMD liquid cools its GPU, high-bandwidth memory (VRAM), and VRM with a Cooler Master CLC, defined here. The EVGA GTX 980 Ti Hybrid uses an Asetek-sourced CLC to cool the GPU, but combines (see: “hybrid”) a blower fan and alloy heatsink for VRM and VRAM cooling.
Cooler Master's CLC uses FEP tubes – more rigid and plastic in design, but capable of insulating liquid for lower thermals – while Asetek's solution deploys rubber tubing. FEP tubes are less pliable than the rubber alternative and the internal teflon coating can crack when kinked or bent with a great enough force. Unlike the EVGA / Asetek solution, this is not coupled with a more traditional on-card air cooler. The EVGA unit is still considerably quieter and cooler than a 980 Ti reference cooler and, given its reliance on liquid, deserves to be checked for whine in a similar fashion to AMD's Fury X.
AMD R9 Fury X Cooling Design and Impact on Power
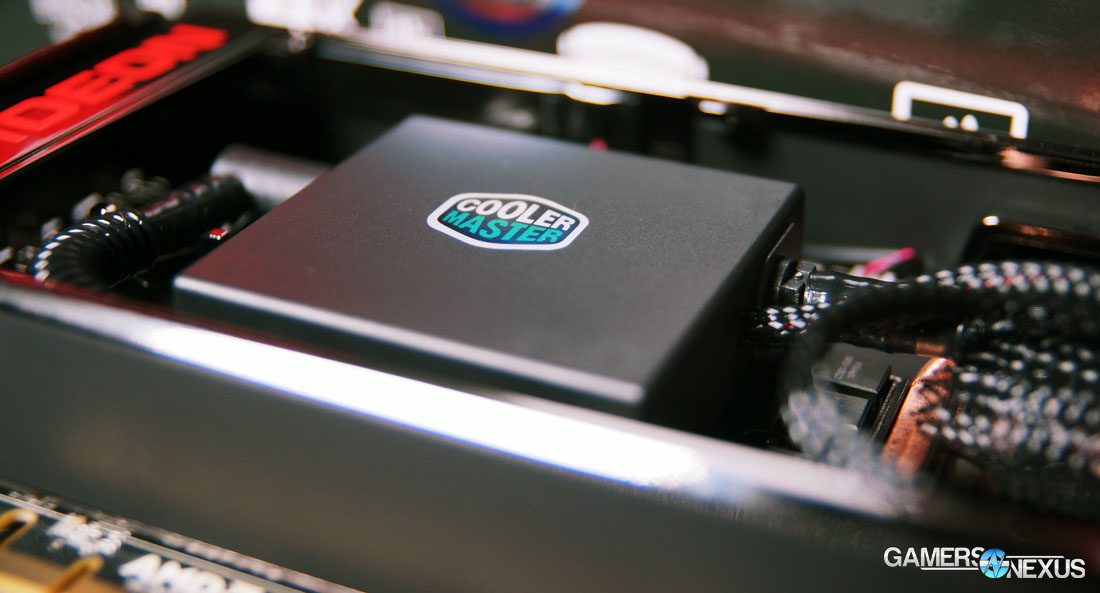
AMD's R9 Fury X utilizes a Cooler Master CLC for its GPU cooling. No board partner modifications are permitted with the Fury X – they're all entirely regulated by AMD.
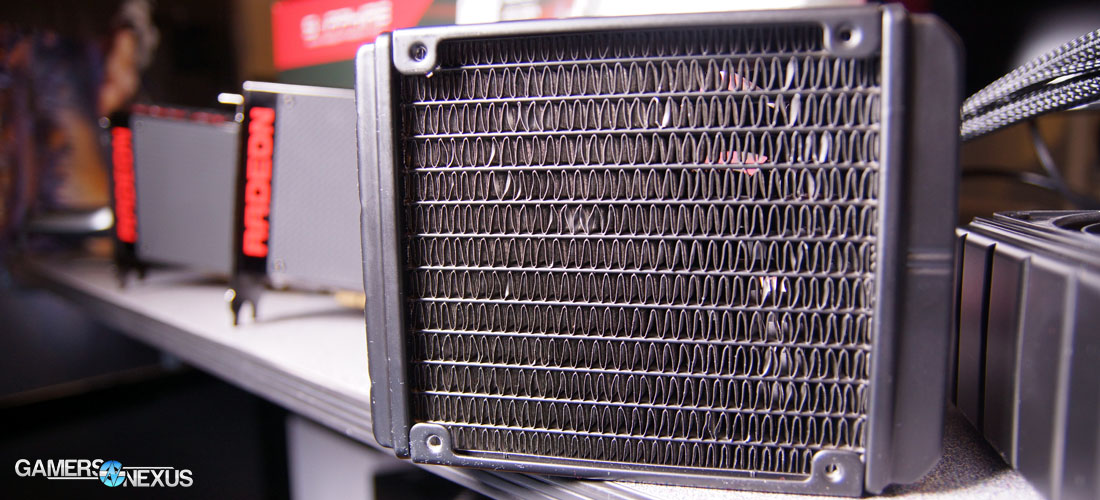
The video card itself is roughly 7.5” in length, though the somewhat stiff FEP tubing restricts tube bending to a point of adding an effective 1” to card length. Underneath a user-serviceable shroud rests the Cooler Master pump, situated atop a copper coldplate using standard liquid cooling methodology. A copper coldplate extends into the pump block, where microfins are cooled by liquid pumped through a lower channel.
FEP tubing employs a plastic inner lining that reduces loss of liquid through interface permeation and evaporation, but – as with all technologies – comes with a few downsides. Bending the tubes beyond their minimum bend radius can cause the plastic to crack, meaning liquid loss over time that will contribute to overheating and early death of the GPU. Installing the radiator must be done with great care to ensure that the tubes aren't tweaked in any particular direction. For comparative purposes, many of the most popular CLCs on the market are made by Asetek (including Corsair's, NZXT's, the EVGA Hybrid, and others), who use a thick rubber wall that offers more flexibility and an easier install. It's our understanding that the cost of Asetek hardware is greater than what's made by Cooler Master, likely an indication of AMD's choice to opt for the FEP solution.
The radiator uses a bulked-up liquid chamber to ensure longevity of the cooling solution with a back-up supply of liquid. This combined with AMD's installation requirements, make for a somewhat irritating install process in some enclosures. It is strongly advised by AMD to install the radiator with the tubes at the lower side of the radiator, a difficult task at times given the inflexibility of the FEP tubing.
Unlike EVGA's Hybrid, AMD's R9 Fury X completely ditches on-card fans. The Fury X uses only the CLC and radiator + fan setup, using liquid to cool the VRM and VRAM; competing CLC-cooled solutions still utilize a VRM/VRAM fan with the GPU coldplate.
Using a CLC helps keep temperatures down, obviously, but has some more important value-adds that aren't necessarily as obvious. Keeping the transistors at lower operating temperatures will ensure less power leakage and ensure longer lifespan of internal components. The liquid-cooled transistors' reduced power leakage goes hand-in-hand with AMD's attempt at a smaller power envelope overall, keeping the R9 Fury X under 300W.
If it weren't for radiator install restrictions – like in situations where a user might already have a CPU CLC – I'd say that liquid-cooled high-end video cards were assuredly the way of the future. For the most part, our team does feel this is true for the current “Big GPU” architecture, but it's also not entirely necessary if enclosure cooling is efficient enough. Reducing the thermal footprint is good for the entire system, it's just that not every case allows a second radiator.
Radeon R9 Fury X Thermals at Equilibrium
Note: We use a Z97 platform for thermal testing, but an X99 platform for game testing.
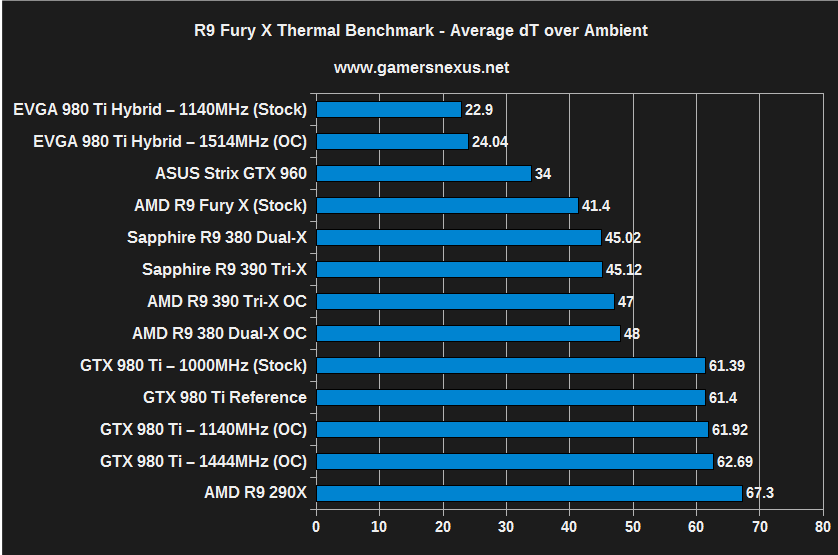
This thermal chart shows the temperatures (dT over ambient of 21C) at equilibrium. This is the highest average we collected during thermal benchmarking. See page 1 for test methodology in greater depth.
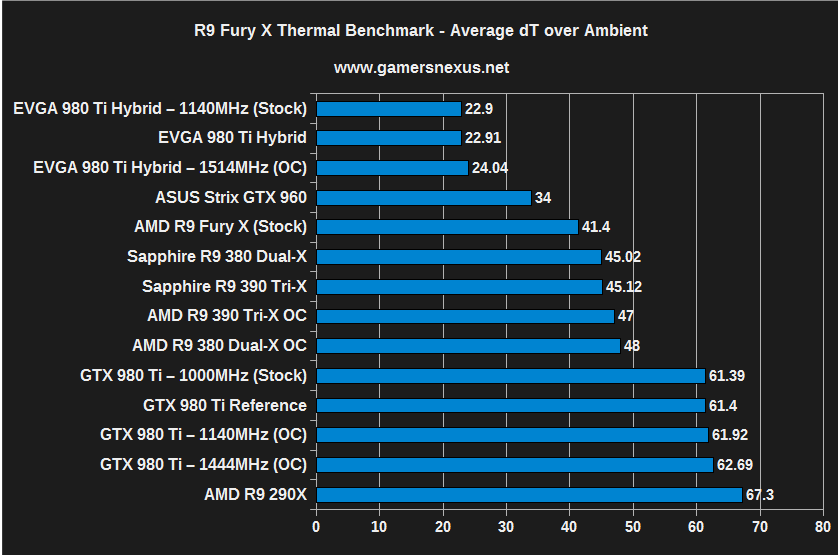
The R9 Fury X is substantially cooler than its air-cooled AMD counterparts – a marked improvement over AMD's 90C+ recent past. NVidia's combination of lower TDP and Asetek CLC make for a substantially cooler load temperature.
It is worth noting that AMD's increased thermals are likely tied to the company's decision to cool its HBM and VRM with liquid, which will feed more heat into the closed system.
Radeon R9 Fury X Thermals over Time vs. 980 Ti over Time
Again, we're using dT over A for these charts. The thermals shown are over time, providing greater insight to the burn-in time and time required to meet equilibrium for each solution. We only recently started producing these charts, so everything featured is from the Hybrid review. The reference 980 Ti is also shown at clock-for-clock (C4C) ratings against the Hybrid.
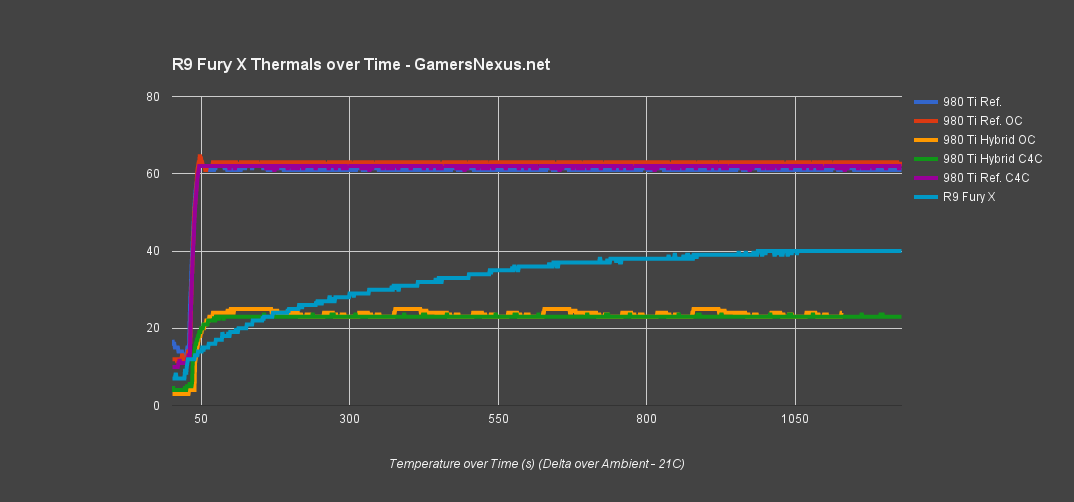
AMD's R9 Fury X takes a little longer to warm-up, meaning it's cooling less aggressively during the first few minutes, but continues gaining temperatures throughout the test. Part of this is probably tied to warming of the memory and VRM. Thermals equalize toward the 16-minute mark (1000s). This isn't inherently bad – it just means the cooler doesn't attack thermals as powerfully as the nVidia solution, which should help with noise control.
R9 Fury X Pump Frequency & Noise Levels
This was discussed more heavily in our separate frequency spectrum analysis article, and we'll leave the in-depth test methodology and analysis over there. The short of this topic is as follows:
- AMD has acknowledged a high-pitched whine output from the pump of its R9 Fury X CLCs.
- AMD has done everything short of a recall, promising an immediate resolution for the next batches of retail cards. Our retail cards did not have the fix.
- We do not think the high-frequency output is a viable reason to withhold purchase, though other elements (discussed later) could be. The frequency is irritating, but mostly inaudible in a case.
The below charts show our findings:
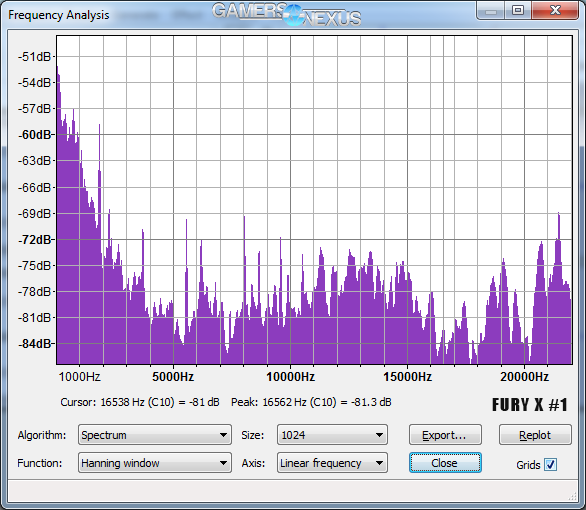
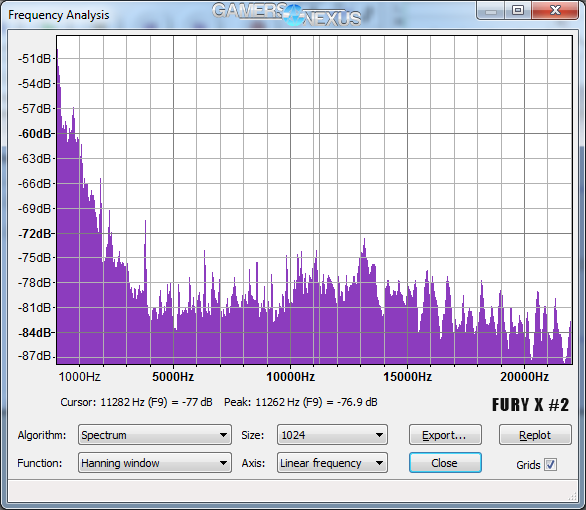
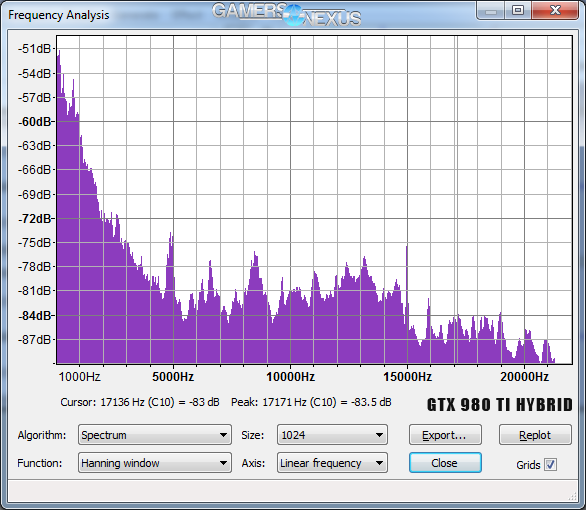
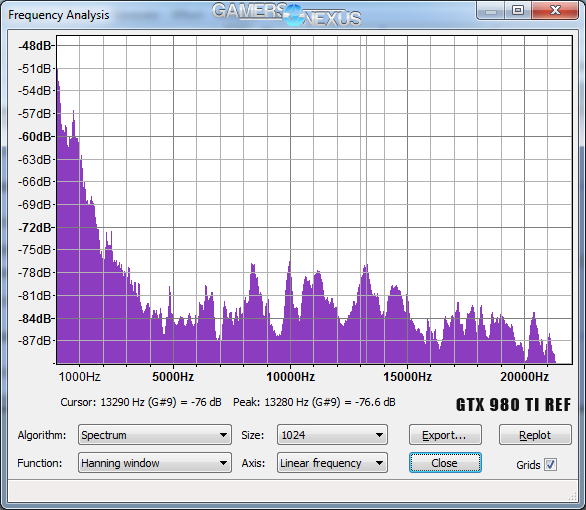
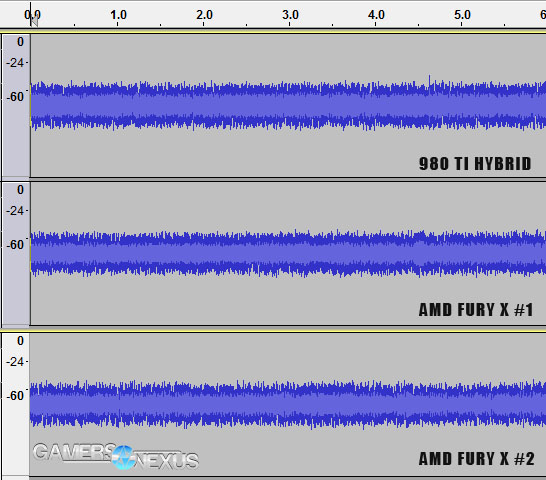
As seen here, the EVGA Hybrid CLC emits a similarly audible whine, but is of a deeper nature. AMD's whine pierces the 20KHz range, which becomes separately audible over other PC noise emissions. Both have a similar dB level, and AMD actually has a slight dB advantage, but the less spiky nVidia frequencies are less noticeable given the more “camouflaged” spectrum.
AMD R9 Fury X Power Draw
Note: We use a Z97 platform for power draw and thermal testing, but an X99 platform for game FPS testing.
Our power draw analysis is defined in the methodology section. The below chart shows peak system power draw (averaged at equilibrium to eliminate outliers) when under a gaming load.
The Fury X still runs hotter than its direct competition – 379W for the Fury X vs. 353.5W for the 980 Ti (peak system load) – but is measurably better than previous AMD attempts. CrossFire Fury X cards requires a massive 663W when loaded with real-world applications, making for the hottest configuration on our chart. The SLI 980 Ti cards require a still-immense ~589W, though stand low enough to require a slightly smaller PSU.
AMD R9 Fury X & CrossFire vs. GTX 980 Ti Gaming Performance Benchmark
The Fury X had curious performance, and for this reason, we urge you to pay close attention to the disparity between the 980 Ti and Fury X as resolution gets lower. This disparity is rooted in a limitation on the Fury X that we will explain as it is revealed.
The below benchmarks show AMD's Radeon R9 Fury X vs. the GTX 980 Ti. Further testing pits the Fury X in 2-way CrossFire against the 980 Ti in SLI. We performed overclocking tests further down.
Note that we presently have two reference GTX 980 Ti cards and one aftermarket GTX 980 Ti Hybrid, which has a bolstered core clock that is more representative of what most board partner cards offer. In our review of the GTX 980 Ti Hybrid, we noted that the card often outperforms the Titan X due to its higher raw frequency (both 'stock'), since 12GB of VRAM is never utilized in current games. For this reason, we've shown both the reference 980 Ti and EVGA's version on the charts.
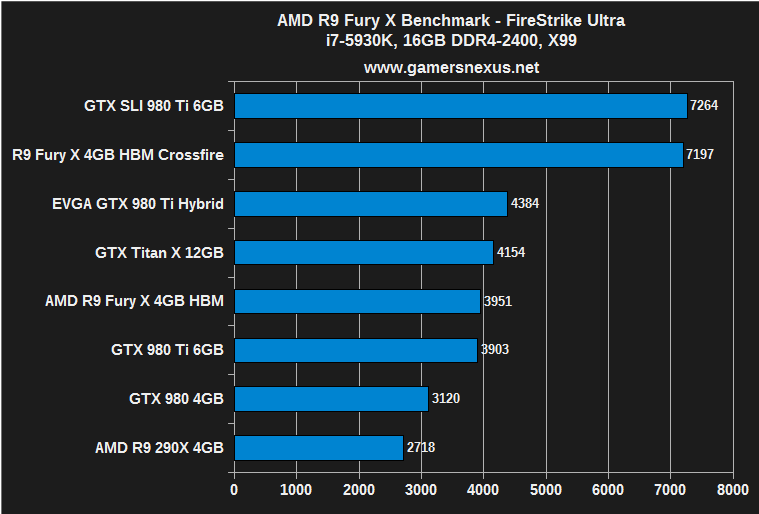
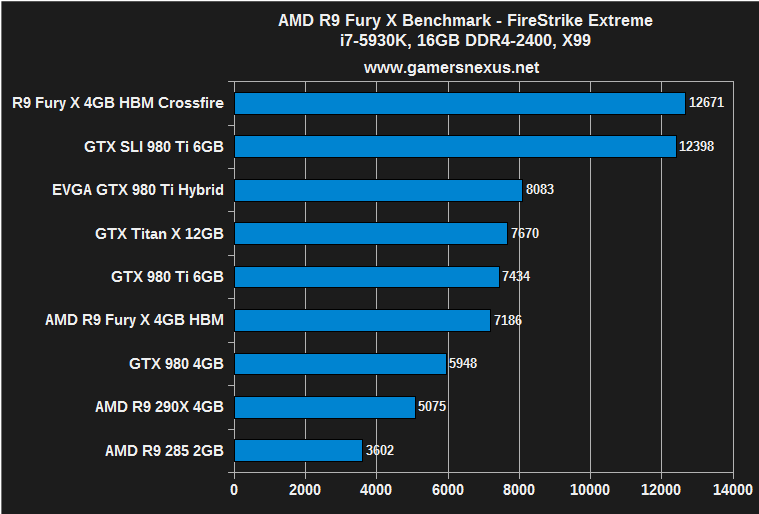
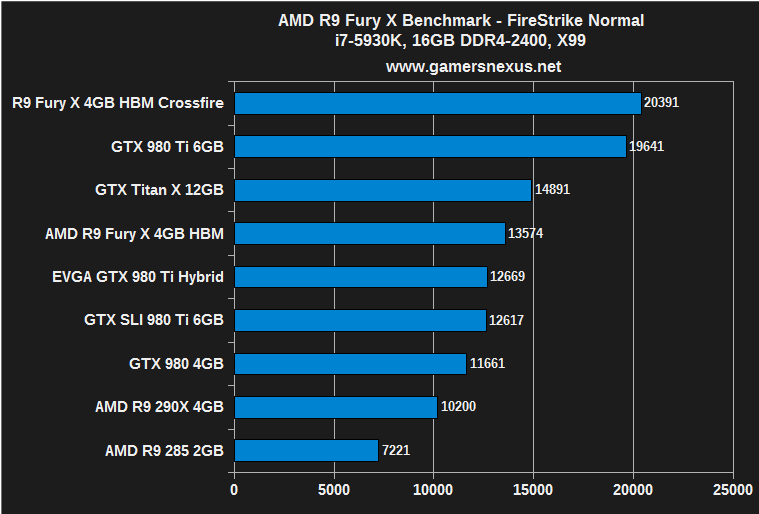
3DMark FireStrike – GTX 980 Ti Hybrid, 980 Ti, Fury X, & More
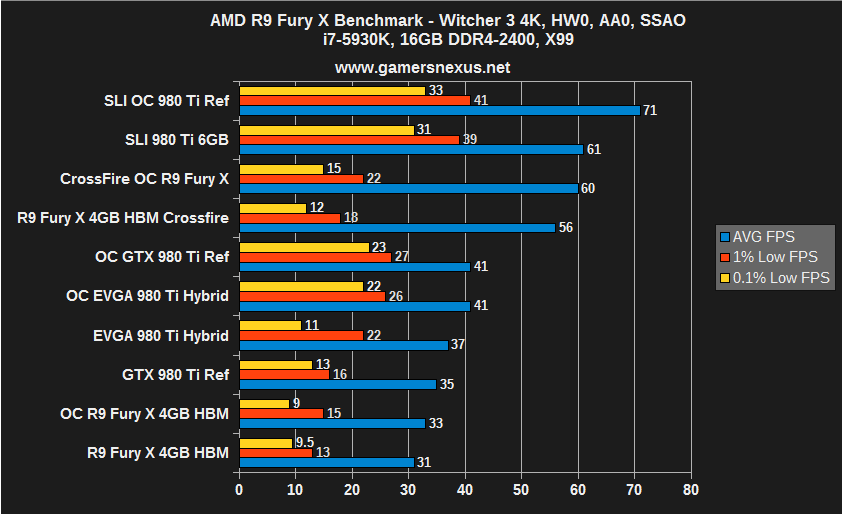
R9 Fury X Benchmark: The Witcher 3's Widening Disparity
The Witcher 3 best illustrates the Fury X's initially confusing results. At 4K resolutions, the Fury X closely competes with the GTX 980 Ti with a ~12% gap. To be fair, neither card makes Witcher 3 playable at 4K / Ultra, but we're just stress-testing here. As resolution is lowered, the gap widens considerably, even doubling to a 24% disparity at 1080p. This is shown even better with SLI and CrossFire, where we see an 8% disparity at 4K widen to a 26% disparity.
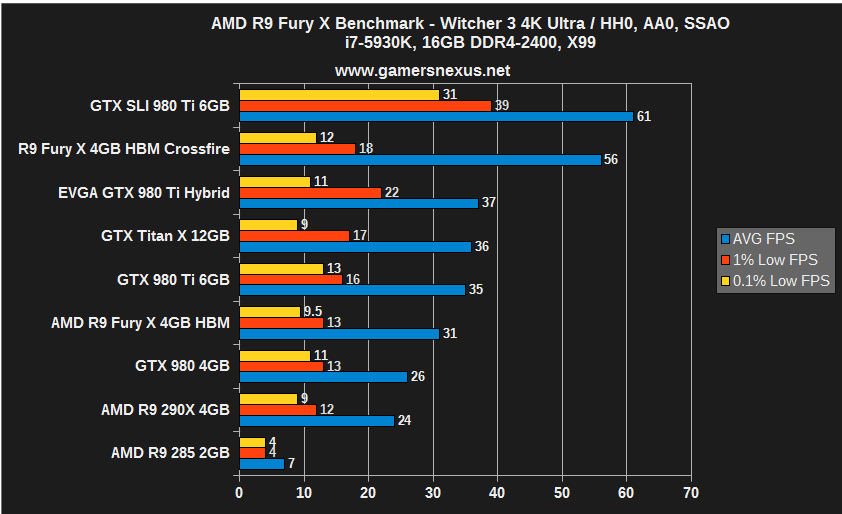
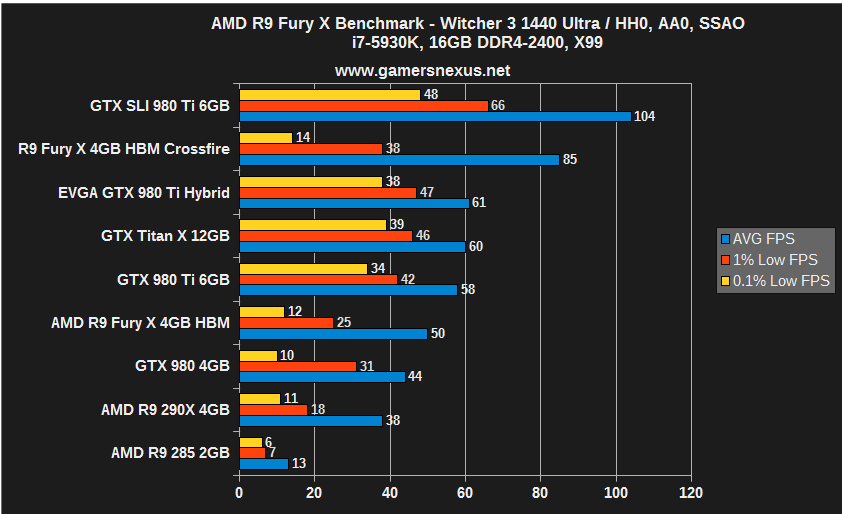
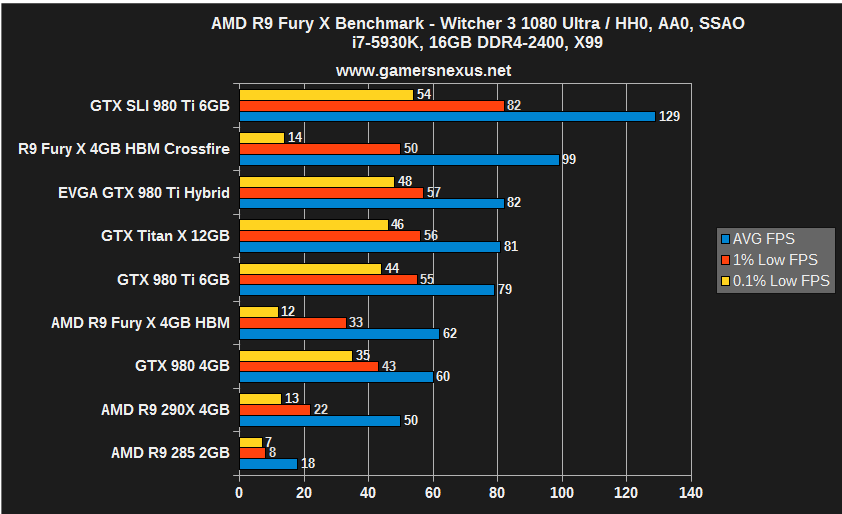
After some analysis, we believe that the Fury X loses ground not because of ROPs – which would be difference-making at higher resolutions – but because of geometry. AMD's architecture loses favor with geometric complexity and tessellated game elements, and as the games reduce raster operation load (as is done at lower resolutions – fewer pixels shoved into ROPs), the Fury X loses ground rapidly.
Note: We experienced dramatic black flickering in The Witcher 3 when running CrossFire. It is deemed “unplayable” for these purposes, as we would resort to a single-card solution rather than suffer the visual detriment.
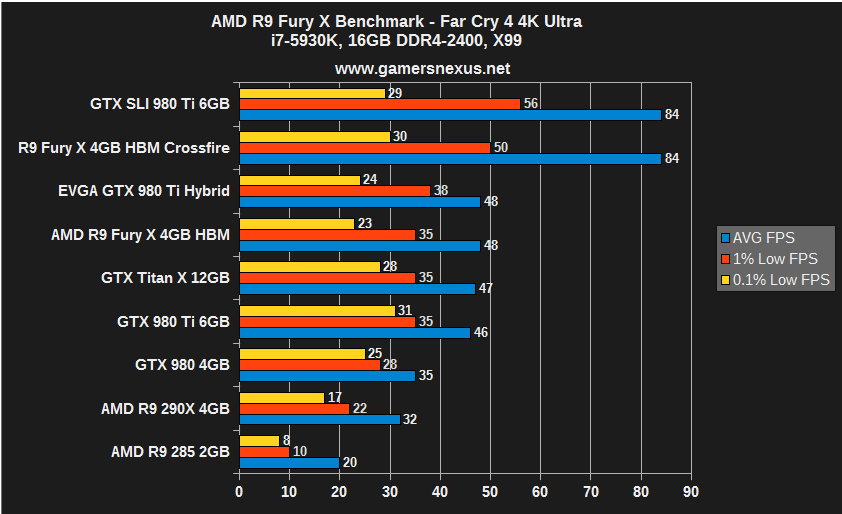
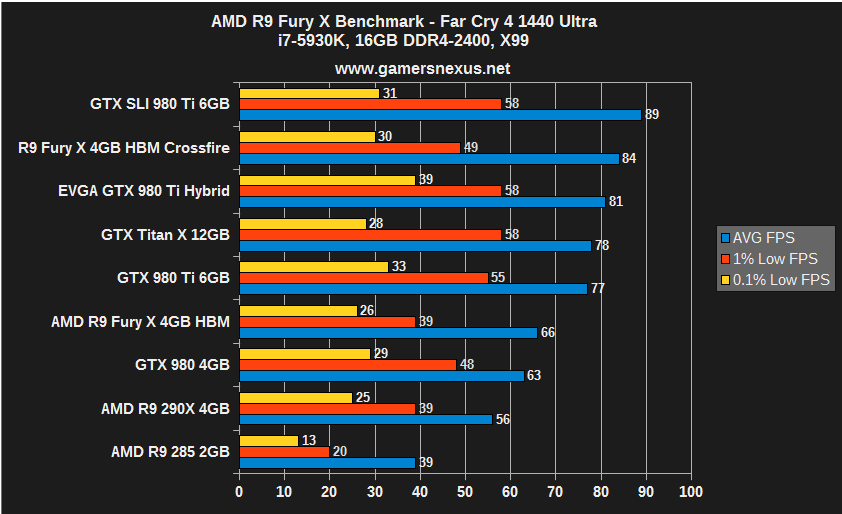
R9 Fury X Benchmark: Far Cry 4
Far Cry 4 exhibits similar behavior. The 980 Ti (reference) performs behind the Fury X marginally at 4K, with the SLI and CrossFire configurations tying in average. The 980 Ti SLI wins-out barely in 1% low performance, but is otherwise nearly tied with Fury X cards in CrossFire.
After dropping to 1440p, the GTX 980 Ti reference card jumps ahead by 15%, further illustrating the limitations of the Fury X.
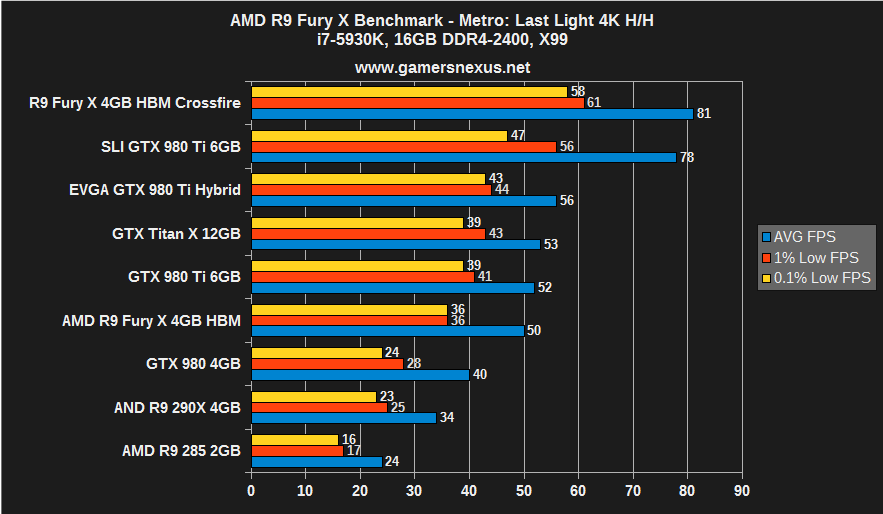
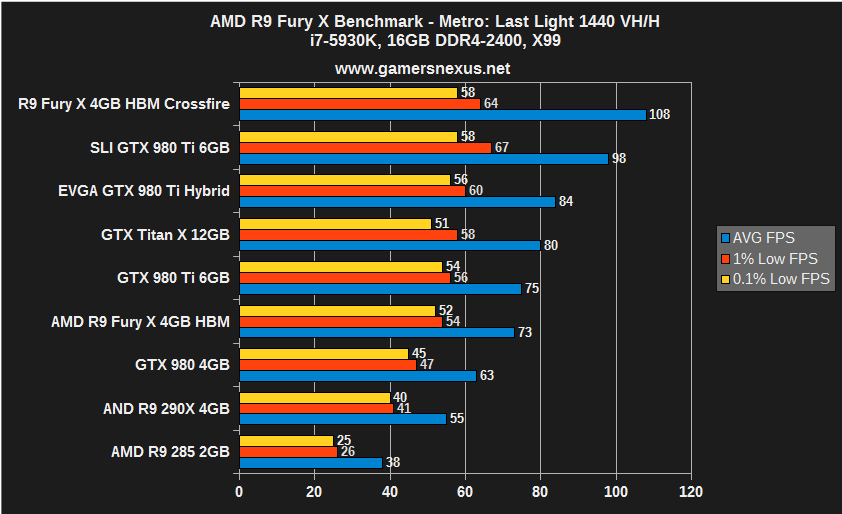
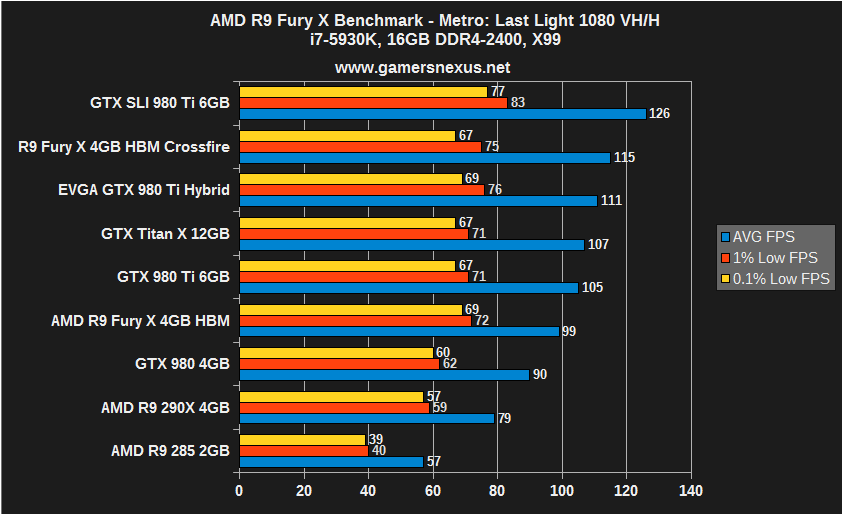
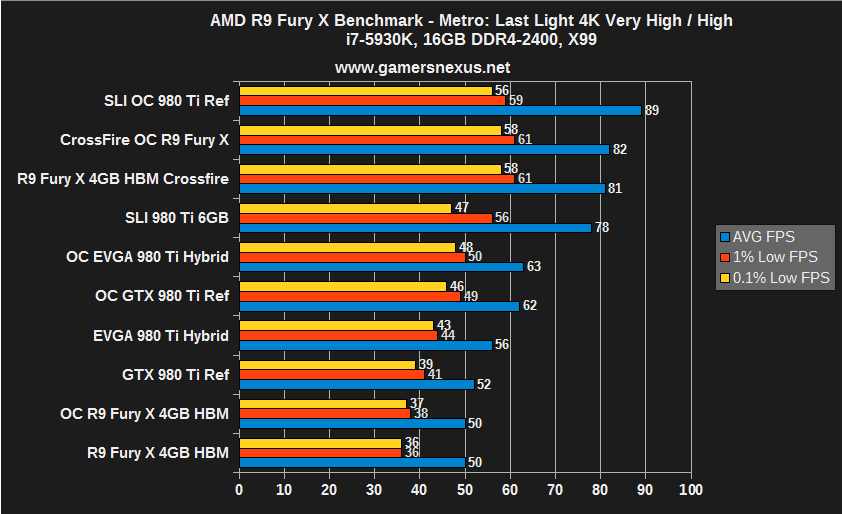
R9 Fury X Benchmark: Metro Last Light
Metro: Last Light is the first game in the list to exhibit the Fury X's odd framerate capping. This is something we encounter with GRID: Autosport in the next charts.
Notice that, up until 1080p is tested, the CrossFire Fury X cards lead the SLI GTX 980 Ti reference cards. At 1080p, we see the two-way GTX 980 Ti cards pull ahead measurably. To prove a point that the Fury X was somehow performance-capped where the 980 Ti was not, we tested Metro: Last Light at 1680x1050 and found a similar 115FPS average. Our next thoughts were that the Fury X may be throttling the clockrate to reduce power consumption, but logging validated that the clock pushed its full 1050MHz with both 1680x1050 and 4K resolutions.
The single Fury X runs behind the GTX 980 Ti reference at all levels, but only marginally so at 4K and 1440p.
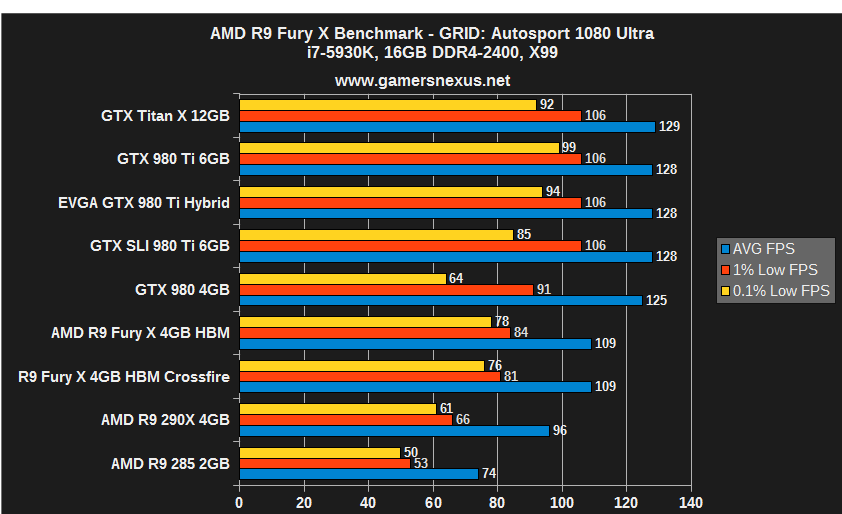
R9 Fury X Benchmark: GRID Autosport
GRID: Autosport exhibits a CPU or other hardware limitation when operating at 1080p, evidenced by equalized performance for all of nVidia's top-end cards. The Fury X and Fury X in CrossFire both sit capped at 109FPS average for 1080p. At 4K, the CrossFire Fury X pulls ahead immensely, but is immediately trounced at 1440 for the same cap as experienced at 1080p.
The single Fury X card (without CrossFire) is defeated somewhat easily by the GTX 980 Ti reference, which holds a 15% advantage. The GTX 980 Ti Hybrid – effectively an overclocked 980 Ti, just with an Asetek CLC – holds a 23.5% advantage. This stock OC is easily achieved on every GTX 980 Ti we've worked with and is representative of non-reference performance.
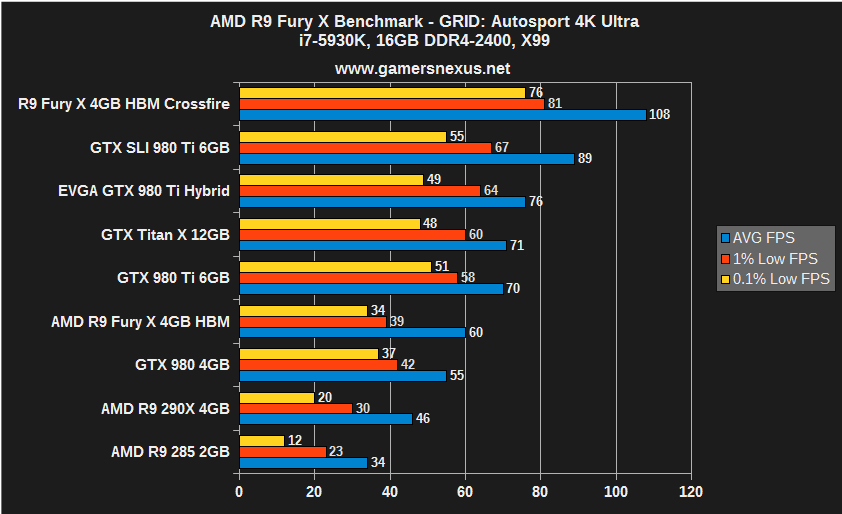
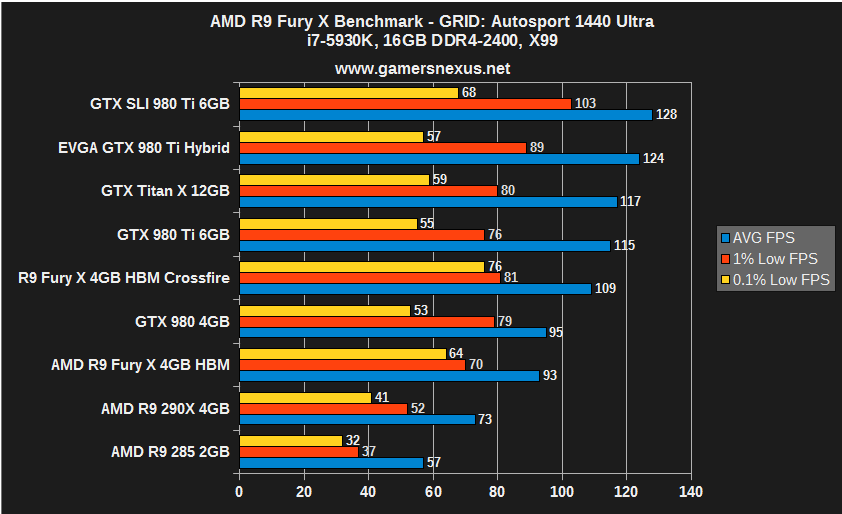
We're unsure of why there'd be such a massive performance disparity for CrossFire vs. SLI compared to single card combat. This is also almost exclusively present with GRID, which has proven to favor some configurations more heavily than other games in the past (accentuated by relatively high performance of the game at 4K).
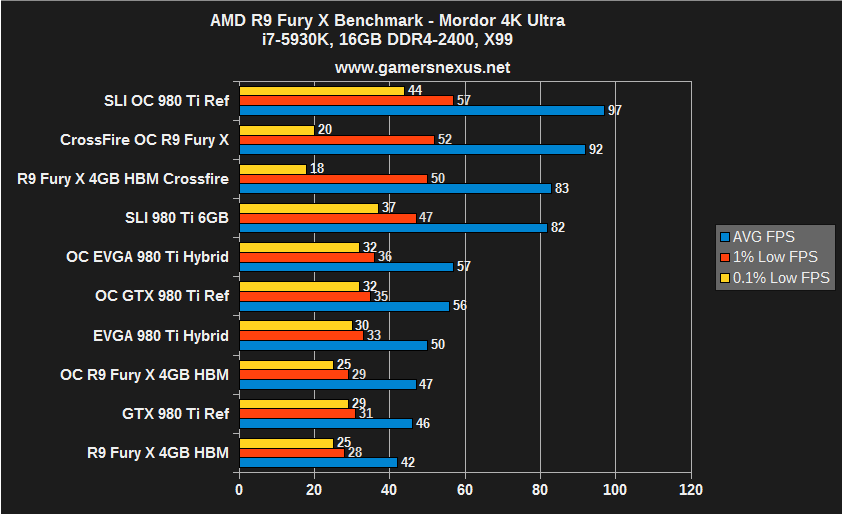
R9 Fury X Benchmark: Shadow of Mordor
The GTX 980 Ti holds higher performance metrics across the board for Shadow of Mordor, sans raw FPS against the CrossFire config. Unfortunately for AMD, though, the 0.1% lows are abysmal at 4K and suffer slightly at 1440p. This produces more choppiness and noticeable 'gaps' in fluid gameplay on the Fury X, something we don't see much of on the GTX 980 Ti. The Fury struggles particularly hard at 4K, dropping to 18FPS 0.1% lows.
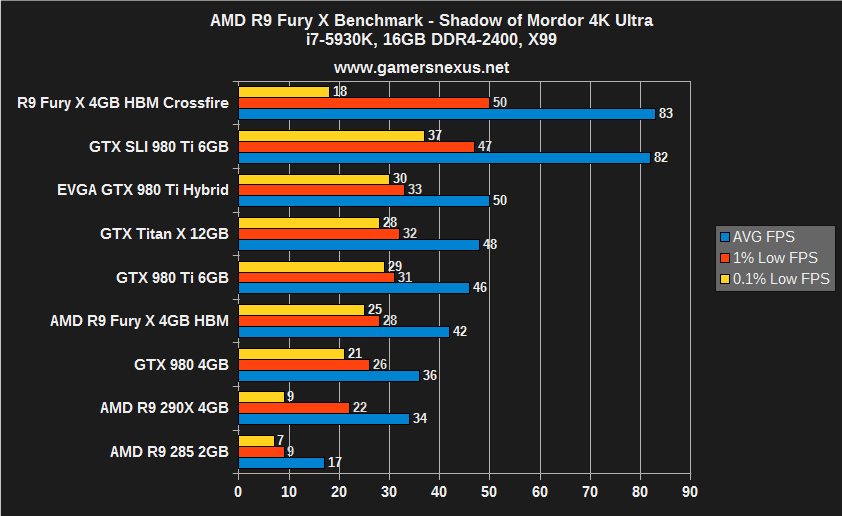
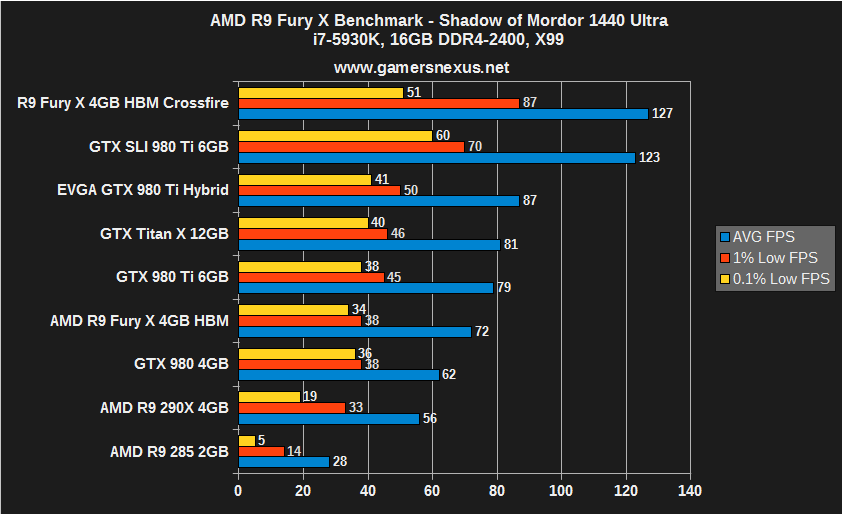
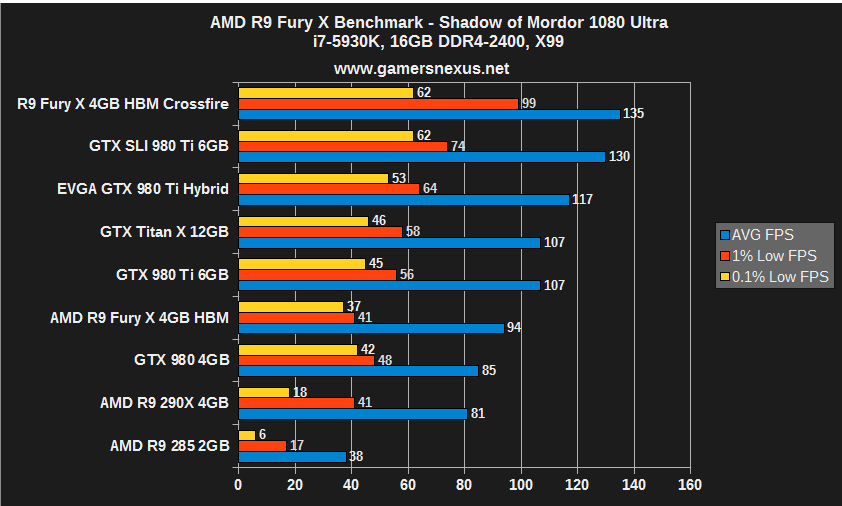
Despite its 1FPS performance gain in averages, the Fury X is the worse card of the two primary contenders for Mordor. Its lows are spiky enough to hinder fluidity of gameplay in a fashion that is noticeable to gamers.
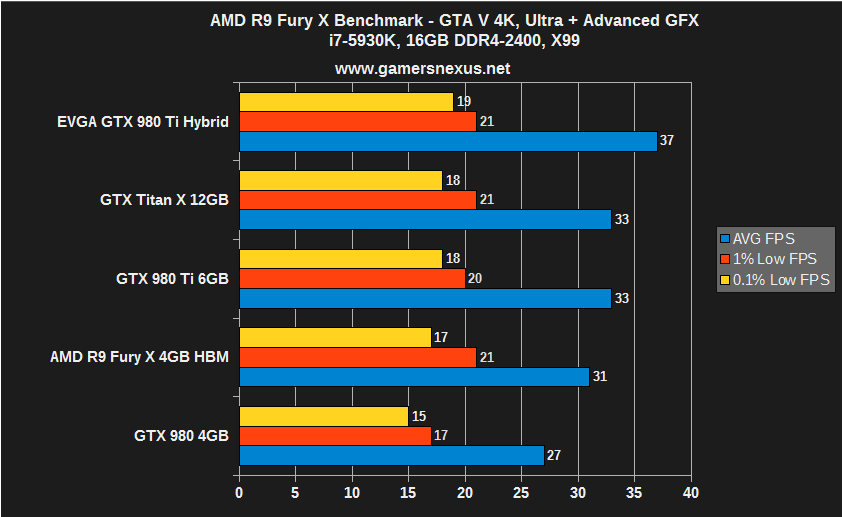
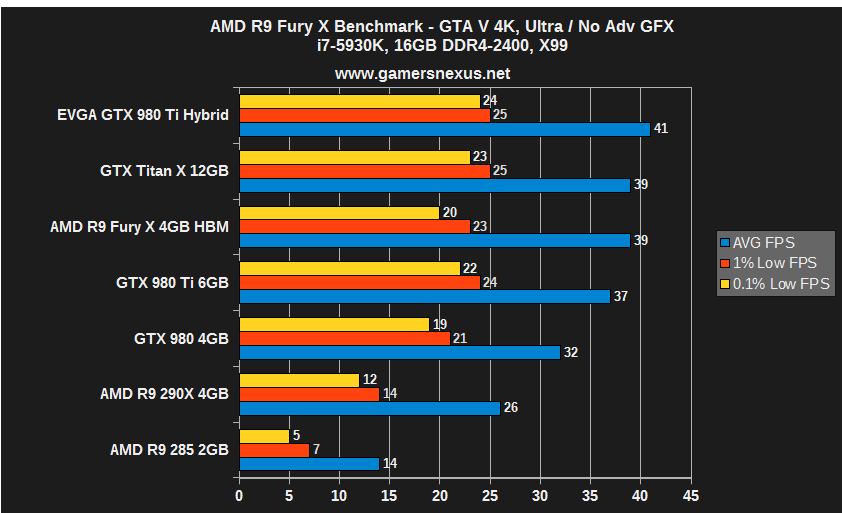
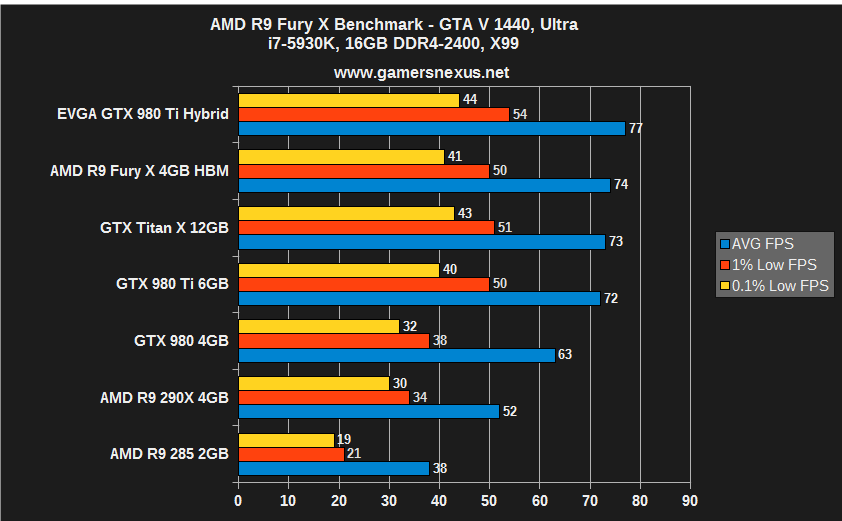
R9 Fury X Benchmark: GTA V
GTA V at Ultra with all “Advanced Graphics” settings enabled (4K) maximally demands 8.3GB of VRAM. This is where we'd potentially see throttling on the Fury X if the HBM isn't fast enough to compensate for lower capacity.
With or without Advanced Graphics enabled, none of these GPUs are particularly capable of playing GTA V at 4K. Stress testing, though, we see that the Fury X has more difficulty keeping up as memory demand is increased. With 4K Ultra and no Advanced Graphics, the Fury X remains more competitive with the GTX 980 Ti.
Overclocking the R9 Fury X vs. 980 Ti & Hybrid – Results Table
Overclocking the Fury X is limited right now. AMD's official tools do not presently allow unlocked memory overclocking, but MSI Afterburner can cheat the OC. Using Afterburner's advanced settings, we can exceed manufacturer limitations to force a memory overclock that is reflected in GPU-Z and Afterburner logging.
Overclocks were stepped incrementally to determine the maximum operating frequency of the core clock and VRAM. We configure the power percent target to its maximum value before adjusting voltage to its own max setting. The 980 Ti allows 110% of base power to be supplied to the GPU for overclocking and seems to hover around 1.224V after overvolting; the R9 Fury X allows 150% of base power, but presently offers no overvolting or official memory OC. We then slowly increment clockrate, observing for visual artifacting or catastrophic failures throughout the process. Each increment is left only for a few minutes before moving to the next step. We're eventually confronted with a driver failure, at which point the clockrate is backed-down and then endurance tested for 25-minutes using 3DMark Firestrike Extreme on loop.
| CLK Offset | Max Clock | Mem Offset | Mem CLK | Power % | Initial Test | Endurance? |
| +50MHz | 1100MHz | +75MHz | 575MHz | 50% | fail | N/A |
| +40MHz | 1090MHz | +75MHz | 575MHz | 50% | fail | N/A |
| +0MHz | 1050MHz | +75MHz | 575MHz | 50% | fail | N/A |
| +0MHz | 1050MHz | +60MHz | 560MHz | 50% | Pass | N/A |
| +40MHz | 1090MHz | +60MHz | 560MHz | 50% | Pass | Pass |
| +70MHz | 1120MHz | +60MHz | 560MHz | 50% | Pass | Fail |
| +60MHz | 1110MHz | +60MHz | 560MHz | 50% | Pass | Pass |
| +65MHz | 1115MHz | +65MHz | 565MHz | 50% | Fail | N/A |
The above shows our AMD overclock stepping. We got stuck at 1110MHz (+60MHz OC) core and 560MHz memory. We tried trading between the two a few times, but were never able to reliably exceed these numbers. The max core overclock was a 5.5% gain.
Below shows our overclocking results for the GTX 980 Ti and GTX 980 Ti Hybrid. 30% gains are seen in reference overclocking (1075 vs. 1450MHz boost); the Hybrid sees a jump to 1514MHz.
GTX 980 Ti Hybrid Overclocking Table
| CLK Offset | Max Clock | Mem Offset | Mem CLK | Voltage | Initial Test | Endurance? |
| +100MHz | 1453MHz | +500MHz | 4001MHz | 1.224V | Pass | N/A |
| +120MHz | 1474MHz | +500MHz | 4001MHz | 1.224V | Pass | N/A |
| +130MHz | 1483MHz | +500MHz | 4001MHz | 1.224V | Pass | N/A |
| +140MHz | 1494MHz | +500MHz | 4001MHz | 1.224V | Pass | N/A |
| +160MHz | 1514MHz | +500MHz | 4001MHz | 1.224V | Pass | N/A |
| +175MHz | 1529MHz | +500MHz | 4001MHz | 1.224V | Pass | Unstable |
| +180MHz | 1533MHz | +500MHz | 4001MHz | 1.224V | Pass | Fail |
| +170MHz | 1524MHz | +500MHz | 4001MHz | 1.224V | Pass | Fail |
| +160MHz | 1514MHz | +500MHz | 4001MHz | 1.224V | Pass | Pass |
GTX 980 Ti Reference Overclocking Table
| CLK Offset | Max Clock | Mem Offset | Mem CLK | Voltage | Initial Test | Endurance? |
| +68MHz | 1245MHz | +500MHz | 4001MHz | 1.187V | Pass | N/A |
| +100MHz | 1289MHz | +500MHz | 4001MHz | 1.187V | Pass | N/A |
| +150MHz | 1339MHz | +500MHz | 4001MHz | 1.187V | Pass | N/A |
| +175MHz | 1364MHz | +500MHz | 4001MHz | 1.187V | Pass | N/A |
| +200MHz | 1389MHz | +500MHz | 4001MHz | 1.187V | Pass | N/A |
| +225MHz | 1414MHz | +500MHz | 4001MHz | 1.187V | Pass | N/A |
| +250MHz | 1439MHz | +500MHz | 4001MHz | 1.187V | Pass | N/A |
| +275MHz | 1464MHz | +500MHz | 4001MHz | 1.212V | Fail | Fail |
| +250MHz | 1427MHz | +500MHz | 4001MHz | 1.212V | Pass | Pass |
| +255MHz | 1444MHz | +500MHz | 4001MHz | 1.212V | Pass | Pass |
| +260MHz | 1450MHz | +500MHz | 4001MHz | 1.212V | Pass | Fail |
R9 Fury X Overclock vs. 980 Ti, 980 Benchmarks
And now for the benchmarks:
As seen, there's generally no worthwhile gain from overclocking the Fury X. The 980 Ti shows large, game-impacting gains from its overclocks (52 to 62FPS average, for instance, in Metro with bolstered 99 and 99.9 percentile performance).
As we did with the 300 series, we've decided that it simply isn't worthwhile to overclock the Fury X. AMD has pushed it as far as it can tolerate as is.
AMD R9 Fury X Conclusion
AMD's R9 Fury X ($650) makes architectural strides to plant AMD firmly into striking range of nVidia's own Titan X killer – the GTX 980 Ti, now priced at $650. The neighboring GTX 980 is outmatched by both devices, but offers a competitive $500 price point. AMD just launched a Fury (non-X) card today for $560, but we haven't had a chance to look at it just yet. HBM represents the immediate future of GPU memory and will likely make an appearance on nVidia devices in the future; AMD has represented ATI's legacy well by being the first to institute HBM but, unfortunately for AMD, it just doesn't offer a relevant performance gain in today's gaming market.
The 4GB limit proves to be minimally intrusive with exception of GTA V at maxed-out settings, a concoction that presents barely playable framerates to begin with. HBM and the new Fiji architecture have allowed AMD to nearly trade blows with the 980 Ti in many instances at only a slight wattage increase (+26W). For this, we applaud AMD's progress in mitigating its historically high TDP. The company's opt-in to a CLC supports its TDP-lowering endeavors by reducing transistor power leakage and overall thermals; HBM similarly improves TDP over GDDR5.
AMD has made significant strides in performance overall – especially against its tragically disappointing 300-series launch – but is still lacking in comparison to its same-priced competition. The Fury X falls short in its 99th and 99.9 percentile performance metrics (1% and 0.1% lows in our charts). These are most noticeable in games like Mordor, where the Fury X boasts a slight AVG FPS gain over the 980 Ti, but suffers from immersion-breaking dips in fluidity. This, to us, seems like a matter of driver optimization and not an inherent hardware defect. Unfortunately, AMD's driver record has been unimpressive over the past year. Just days ago we saw the first official, WHQL-certified drivers from AMD since December, with only a few major betas in between (GTA, Witcher 3). AMD's slowing of driver pushes is a cautionable item at best when it comes to a purchase.
Gaming performance is generally a step behind the reference GTX 980 Ti when played at 4K. As resolution decreases, the Fury X's weak point – polygon and triangle limitations – is revealed as a bottleneck. The disparity widens measurably, nearly 2x in some instances, as AMD competes at 1440p and 1080p resolutions. The ROPs throttle appears to be less of an issue for AMD's Fury X than its poly and triangle limitations, though that does not mean the Fury X is free of raster operation difficulties.
For those wondering why AMD's pre-release benchmarks fronted such profound performance leads over the GTX 980 Ti, it's because – and we don't fault them for this – AMD tuned the game settings to run best on their hardware. The Fury X does well with massive amounts of shader effects and stencil shading depth, given the shader array's power, but struggles with filtration (anti-aliasing, for instance), tessellation, and geometry. The ROPs appear to suffocate as filtration effects are crammed into them; more taps will push more pixels into the ROPs for processing, and in all of AMD's pre-launch numbers, filtration and anti-aliasing effects have been entirely disabled.
The CLC makes significant gains for AMD's performance and greatly reduces thermal output, though the Cooler Master unit still runs nearly 2x warmer than Asetek's EVGA Hybrid cooler. That said, the Hybrid is priced at $750 – another price step above the R9 Fury X – and is perhaps not perfectly comparable in this regard. Part of the disparity can be indicated as AMD's shared liquid cooling of VRAM, the VRM, and the GPU. Same-priced air coolers from nVidia don't compete directly with the Fury X's liquid solution, though we certainly think the CLC could be improved by moving away from FEP tubing.
AMD has made tremendous steps in the right direction, but they're not good enough. The Fury X trails the GTX 980 Ti in raw AVG FPS most of the time – but not always, especially in CrossFire – and almost always trails in frametime performance. The 0.1% and 1% lows cause hits to fluidity that are noticeable to the user. Heat and power consumption can finally be shelved as concerns for most users, the new limitation being the radiator – though for most gaming cases, this is largely a non-issue. AMD has closed the gap for power consumption considerably (+26W over 980 Ti) and has reduced its thermal footprint. There's room to improve, definitely, but we're happy with the progress. Thermals could use fine-tuning, as could the pump.
The company falls maddeningly short with its driver support. AMD's raw hardware on the Fury X is capable of achieving parity with the 980 Ti at times; it just won't do it without driver-level support. The main addressable item here is 1% and 0.1% performance, but other issues need fixing after that – like CrossFire flickering in The Witcher. Other issues are architecture-bound and may not ever be resolved, like geometric, tessellation, and filtration limitations. AMD excels at shader throughput where nVidia excels at polygon and triangle processing – they both have strengths – but the Maxwell GPU is more fine-tuned for gaming where AMD offers some versatility. As it stands right now, AMD needs to find a way to institute its own fine-tuning without investing in a complete architectural overhaul, and that's going to be with drivers.
Until there's a greater price or performance disparity (though the former seems more likely), the GTX 980 Ti is an extremely threatening competitor to the Fury X for most gamers.
- Steve “Lelldorianx” Burke.