We’ve praised the R7 1700 ($330) for its mixed workload performance and overclocking capabilities at $330, and we’ve criticized the 1800X for its insignificant performance improvements (over the 1700) at $500. That leaves the R7 1700X ($400), positioned precariously between the two with a base clock of 3.4GHz, but the full 95W TDP of its 1800X sibling.
The 1700X performs as expected, given its flanks, landing between the R7 1700 and R7 1800X. All three are 8C/16T chips with the same CCX layout; refer back to our 1800X review for a more thorough description of the R7 CPU & Ryzen architecture. A quick comparison of basic stats reveals that the major advantage of the 1700X is a moderate increase in frequency, with additional XFR headroom as demarcated by the ‘X’ suffix. That said, our R7 1700 easily overclocked to a higher frequency than the native 1700X frequency, with no manual adjustment to voltage or EFI beyond the multiplier. The 1700X has a base clock of 3.4GHz and a boost clock of 3.8GHz, which theoretically means it could come close to the performance of our 3.9GHz 1700 straight out of the box while retaining the benefits of XFR (circumvented by overclocking).
AMD Ryzen R7 1800X vs. 1700, 1700X Specs
| Ryzen R7 1700 | Ryzen R7 1700X | Ryzen R7 1800X | Ryzen R5 1600X | Ryzen R5 1500X | |
| Socket Type | AM4 | AM4 | AM4 | AM4 | AM4 |
| Cores/Threads | 8C/16T | 8C/16T | 8C/16T | 6C/12T | 4C/8T |
| Base / Boost | 3.0GHz / 3.7GHz | 3.4GHz / 3.8GHz | 3.6GHz / 4.0GHz | 3.6GHz / 4.0GHz | 3.5GHz / 3.7GHz |
| TDP | 65W | 95W | 95W | 95W | 65W |
| Stock Cooler | Wraith Stealth (65W) ~28dBA | Wraith Spire (95W) ~32dBA | Wraith MAX (125W) ~38dBA | None | Wraith Spire |
| Memory Support | 2ch/2rank: 1866-2133 2ch/1rank: 2133-2400 1ch/2rank: 2400-2667 1ch/1rank: 2667 | 2ch/2rank: 1866-2133 2ch/1rank: 2133-2400 1ch/2rank: 2400-2667 1ch/1rank: 2667 | 2ch/2rank: 1866-2133 2ch/1rank: 2133-2400 1ch/2rank: 2400-2667 1ch/1rank: 2667 | 2ch/2rank: 1866-2133 2ch/1rank: 2133-2400 1ch/2rank: 2400-2667 1ch/1rank: 2667 | 2ch/2rank: 1866-2133 2ch/1rank: 2133-2400 1ch/2rank: 2400-2667 1ch/1rank: 2667 |
| Release Date | March 2 | 3/2/17 | 3/2/17 | 4/11/17 | 4/11/17 |
| Price | $330 | $400 | $500 | $250 | $190 |
At around $400, the R7 1700X lands ~$70 more than the R7 1700 counterpart, and ~$100 less than the flagship R7 1800X CPU. In terms of market positioning, this makes the 1700X interesting for would-be R7 1700 buyers who are hamstrung by corporate policy, e.g. “no overclocking allowed,” but potentially overpriced for users more willing to invest the OC time on a 1700 SKU.
In our tests, though, the stock 1700X was consistently and expectedly outperformed by the overclocked 1700. The point of interest, though, is the thermal performance of the 1700 and 1700X. The heat discussion has always been complicated with thanks to AMD’s temperature scale, as we discussed on Page 4 of the 1800X review and in a follow-up, but the 1700X does seem to run hotter even when considering tCTL offsets. We mostly determine this by looking at throttle performance, as the clock-rate will visibly dip when bumping against the maximum Junction temperature. We’re still a bit confused as to exactly what’s going on thermally, but are continuing to work on furthering an understanding of Ryzen’s temperature readings.
Before getting into testing, note the following: A new Windows 10 update has allegedly improved performance for some Ryzen benchmarks. We have not yet migrated our test platform to this update; we wanted to get the 1700X tested and reviewed under the same conditions as the 1700 + 1800X (testing was done prior to the Windows update). We’ll revisit these CPUs in more depth after a few more major updates get pushed for motherboards, Windows, and software. Right now, the environment is changing literally daily (we are receiving beta EFI versions nearly every day). To keep a stable test platform, we’re holding updates until a major content refresh for all of the chips. This may mean waiting until the R5 reviews for that bench platform refresh.
Test Methodology
CPU Test Methodology
Our usual testing methodology is defined further below, per typical copy/paste of methods between reviews, but we have a few explicit items to address with Ryzen.
During testing, GamersNexus discovered that Windows would occasionally engage core parking or other power saving features that could impact framerate in some games, specifically with Ryzen. This was not always detectable, but some games reacted more than others (our biggest observable difference was ~4-5%). As such, all tests were conducted in performance mode. We further discovered that SMT toggling improves performance in nearly all gaming use cases, and so tested with SMT both enabled and disabled. When asked about this, AMD supplied that it is likely on the ISV optimization side. Learn more about that here.
We’ve been using the newest (and correct) version of AMD’s chipset drivers since we began testing, and we’ve been on ASUS’ version 5704 (latest available when testing began) BIOS for the Crosshair Hero VI. ASUS was good to provide us this update immediately when we reached out, though AMD officially distributed an older EFI version to reviewers; this older version is detrimental performance in some ways, as it was not the production-ready EFI. We have performed some EFI difference benchmarking, and will update once the next stable EFI version ships.
Fortunately, we had already retrieved the correct EFI from ASUS directly, and so did not have to test multiple EFI versions – though we did have to retest the platform and CPU multiple times for other validation. EFI version matters a lot in these very early days of Ryzen. This is an entirely new architecture – not some updated on a long-known design, like KBL was – and vendors were not prepared. Early EFI distributions were based on older uCode. Results will vary between test environments in greater ways than usual.
A clean image is used for all testing. We have Windows images on multiple SSDs, each labeled for the appropriate CPU architecture. We pull an SSD with the correct label from the shelf (e.g. Skylake, Broadwell-E, Ryzen) and use that for testing. Note also that Windows HPET can affect performance.
Because of how Ryzen’s boosting reacts to temperatures, we put the R7 1700X under the same liquid cooling we’ve used for all our major CPU reviews: the Kraken X62. This eliminates unpredictable thermal throttles during test.
Game Test Methodology
NVIDIA 376.33 drivers were used for all benchmarking. Game settings were manually controlled for the DUT. All games were run at presets defined in their respective charts. All other game settings are defined in respective game benchmarks, which we publish separately from GPU and CPU reviews. Our test courses, in the event manual testing is executed, are also uploaded within that content. This allows others to replicate our results by studying our bench courses.
Windows 10-64 was used for testing.
Each game was tested for 30 seconds in an identical scenario, then repeated three times for parity.
Average FPS, 1% low, and 0.1% low times are measured. We do not measure maximum or minimum FPS results as we consider these numbers to be pure outliers. Instead, we take an average of the lowest 1% of results (1% low) to show real-world, noticeable dips; we then take an average of the lowest 0.1% of results for severe spikes.
Hardware Used
Core Components (Unchanging)
- NZXT 1200W Hale90v2
- For DDR4 platforms: Corsair Vengeance LPX 32GB 3200MHz*
- For Ryzen DDR4: Corsair Vengeance LPX 3000MHz clocked to 2933MHz (See Page 2)
- Premiere & Blender tests do not exceed 8GB DRAM. Capacity is a non-issue for our testing, so long as it is >16GB
- For DDR3 platforms: HyperX Savage 32GB 2400MHz
- Intel 730 480GB SSD
- Open Air Test Bench
- Cooler #1 (Air): Be Quiet! Dark Rock 3
- Cooler #2 (Cheap liquid): Asetek 570LC w/ Gentle Typhoon fan
- Cooler #3 (High-end): Kraken X62
Note: fan and pump settings are configured on a per-test basis.
AM4 Platform:
Used for R7 1800X, R7 1700X, R7 1700.
Z270 Platforms:
- Gigabyte Aorus Gaming 7 (primary)
- MSI Gaming Pro Carbon (secondary - for thermal validation)
- i7-7700K (x2) samples from motherboard vendors
Both used for the 7700K.
Z170 Platform:
- MSI Gaming M7
- i7-6700K retail
Z97 Platform:
- Gigabyte Z97X G1 WIFI-BK
- i7-4790K
Z77 Platform:
- MSI GD65 Z77
- i7-2600K
Dx12 games are benchmarked using PresentMon onPresent, with further data analysis from GN-made tools.
Note: We'd like to add the i5, i3, and FX CPUs, but this was enough for now. We'll add those as we expand into coverage of Zen or i5 Kaby Lake products.
Thermal Test Methodology
Thermal measurement on Ryzen is not necessarily trivial, as most software is incorrect or inaccurate in these early days. See this page from our 1800X review for further information, or AMD’s own statement.
Power testing is simply done at the wall. We do not presently tap into the rails, and openly identify this as our weakest point in current test methodology. This is something we will eventually work toward revamping. For now, we use wall meters to determine a power delta in A/B tests.
Continue to Page 2 for thermal & power testing.
Power & Temperature Testing
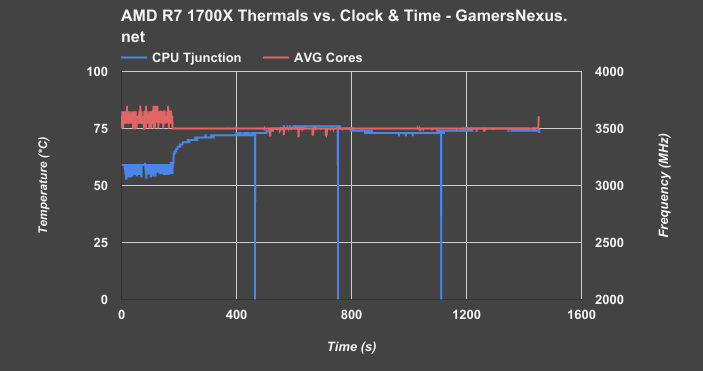
We again used the NZXT Kraken X62 at maximum fan speed to cool the CPU as much as possible--the 1700X has a TDP of 95W, higher than the 1700’s 65W but identical to the 1800X. The stock 1700X reached a peak of 76C under load, causing mild throttling from the usual 3.5GHz as the 75C limit was exceeded. We can see this in clock fluctuations at the higher temperatures (~76C), where the 1700X occasionally dips to control thermals. The OC 1700, meanwhile, never exceeded 71C and held steady at 3.9GHz--an odd result, but there’s a reason for this. AMD’s recent statement (and our original research) shows that the company intentionally offsets temperatures with a “tCTL” value, just like the FX series before. What’s new in the statement, and what wasn’t told to GN during our original detailings of tCTL’s continued existence, is the value with which AMD offsets temperature. The 1700 accurately reports temperatures, while the 1700X and 1800X report temperatures that are 20C higher in order to “maintain a consistent fan profile” for all three chips. The end result is this: we managed to stress the 1700X to the point of throttling, but not the 1700 when running at the same frequency.
HW Monitor’s TMPIN0 value (on the ASUS board) appears to be the proper Junction temperature, as it aligns with ASUS’ AI Suite. AI Suite, as a recap, takes the TSI temperature bus value and combines it with a thermistor on the CH6, then crunches the two through an algorithm to achieve a more realistic temperature. We are still not positive which numbers are actually Junction temperature and which are tCTL Junction temperatures, though. Given a TjMax of 75C, we are assuming that HW Monitor and AI Suite are presenting the true Junction temperature, given the throttle performance (thermal trip-point) at >75C in these tools.
Regardless, we are clear that our 1700 chip is running cooler than the 1700X when the 1700 is overclocked. The 1700 ($300) is also not throttling under the same conditions as the 1700X when tested, and generally seems to be advantaged thermally by way of its lower possible vCore (but same performance). This keeps the R7 1700 in its championing position for the R7 lineup.
Update: We have some more news on thermals, thanks to follow-ups from AMD and some testing. We'll follow-up with a piece dedicated strictly to temperatures on Ryzen.
1700X Power & Voltage
| Stock + balanced | Blender (multi-thread) | Cinebench (single-thread) | POV-Ray (single-thread) | Idle |
| Watts | 168 | 89 | 91 | 61 |
| Core Frequency MHz | 3499.18 | 3900 | 3900 | |
| Core Voltage | 1.155 | 1.373-1.41 | 1.417 |
AMD R7 1700 Auto Voltage Behavior
| 1700 Auto vCore 2666MHz DRAM | Blender (nT) | Cinebench (1T) | POV-Ray (1T) | Idle |
| Total System Draw (Watts) | 133 | 80 | 81 | 58 |
| Core Frequency (GHz) | 3.2 | 3.2-3.75 | 3.75 | |
| Core Voltage (v) | 1.068 | 1.286-1.308 | 1.286 |
AMD R7 1800X Power + Voltage
| 1800X Auto vCore, 2933MHz RAM | Blender (nT) | Cinebench (1T) | POV-Ray (1T) | Idle |
| Total System Draw (Watts) | 185 | 92 | 94 | 60 |
| Core Frequency (GHz) | 3.7 | 3.7 - 4.1 | 4.1 | |
| Core Voltage (v) | 1.221 - 1.243 | 1.395 - 1.461 | 1.417 |
As stated in the methodology section, our power testing is currently a weak link in our test course, but it still permits relative comparisons between same-arch products. The system under load, using identical hardware and settings except for the CPU, drew 133W with the R7 1700, 168W with the R7 1700X, and 185W with the R7 1800X. All three consumed about 60W at idle.
Energy dissipated as heat correlates directly with power consumption, which is of particular interest with the R7 CPUs, given that the 1700 runs so much “cooler” than the X-branded chips. Under full load (during the thermal tests), our stock 1700 reported 1.1v vcore and 46C tJunction, 1700X 1.2v and 75C, 1800X 1.2v and 75C, and our maximum 4.0GHz overclock on the 1700 reported 1.4v and 71C. These reported temperatures, although they should be accurate, seem to align with the offset tCTL temperatures that AMD has described. Moreover, the CPUs appear to be throttling based on this number. We’re reaching out to AMD for further clarification over how R7 chips decide to throttle and we are considering furthering our own testing with some in-house tools.
Our review of the Wraith Stealth cooler is coming soon. Until then, it’s best to assume that a stock cooler won’t be sufficient for overclocking, and that a 3.9 - 4.0GHz R7 1700 will need something beefier. If the Wraith Spire is actually up to the job of cooling the stock 1700X (early review samples shipped without stock coolers), that could increase its value by a few dollars and make up for some of the $70 gap between itself and the 1700, but it needs to be pretty impressive.
Continue to Page 3 for the Premiere, Blender, & synthetic tests.
We won’t spend as much time discussing individual results for the unmodified 1700X here, because in every one of our tests, scores and average framerates for the stock version predictably fell between the stock 1700 and the stock 1800X. We’ve reviewed both in depth already: 1700 review, 1800X review. both of which we’ve already reviewed in depth. To be clear: the 1700X is, as advertised, better than the 1700 and worse than the 1800X out of the box, but overclocking performance is more unpredictable and does not necessarily follow the same pattern.
AMD Ryzen R7 1700X Cinebench Score vs. OC 1700, 1800X
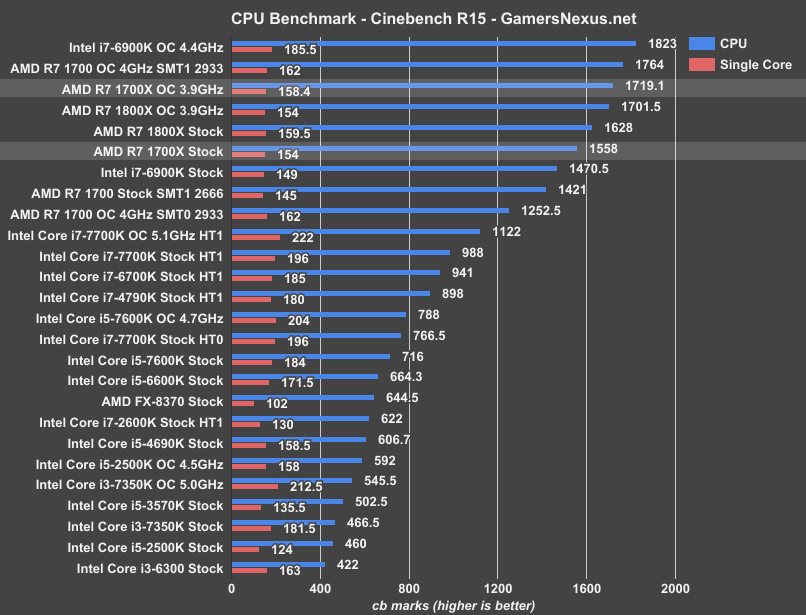
The R7s have performed magnificently in Cinebench multi-threaded tests, and the 1700X was no exception. It scored a respectable 1558 cb marks on average, which increased about 10.33% to 1719 cb with a 3.9GHz OC, placing it just above our 3.9GHz 1800X and just below our 4.0GHz 1700. The silicon lottery is at work here: as mentioned in the previous review, our R7 1700 just happened to be (sort of) capable of a higher overclock than our other two chips. Outperforming the 1800X at exactly the same frequency is explainable as clock stability variance, with the gap only a little over 1%.
1T performance remained relatively low; Ryzen CPUs rely more on quantity of threads than pure speed. 154 stock and 158.4 OC single-threaded scores put the 1700X ahead of the overclocked 1800X (154) and behind the overclocked 1700 (162), an oddly inverse arrangement that speaks to one part usual variance within cinebench and one part OC stability. Cinebench tends to have a 1T variance of a few points (~3-6, at times), as we discussed in this article. This translates to nT variance, though the software is more consistent than other options overall. Other advantages could be partially attributed to some updates that were pushed, though we have not loaded the 'big' Windows update just yet.
AMD R7 1700X vs. 1700, 1800X in POV-Ray
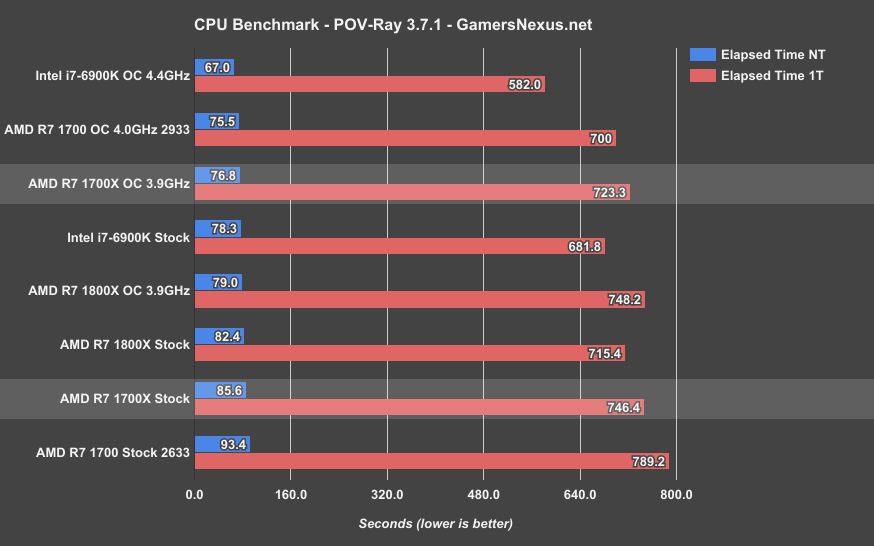
(POV-Ray is still new to our bench, so every CPU has not yet been through it.)
POV-Ray testing had similar results: running at 3.9GHz bumped the multithreaded render time down from 85.6 to 76.8 seconds, edging out the OC 1800X by 2.8%, but the higher overclock on the 1700 again placed it first. It’s becoming increasingly clear that all the R7 series CPUs are capable of running at roughly the same frequencies, and that the 1700 is the de facto best value given the OC performance. Granted, we’re not 100% sure if chips will continue to bin like this going forward.
AMD R7 1700X Blender Render Benchmark vs. 1700, 1800X, 7700K
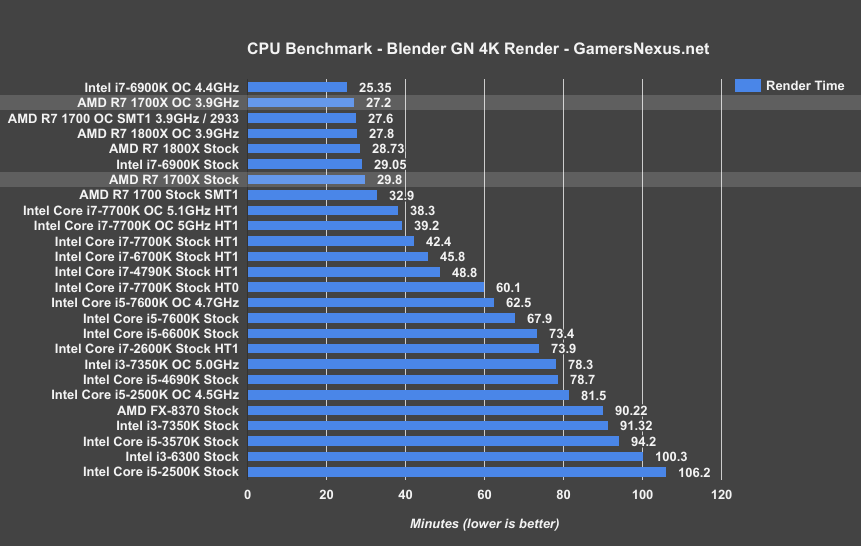
Our Blender benchmarks use an in-house designed scene (by GN Andrew Coleman) with 400 samples per pixel, 16x16 tile sizes, and RC-ready quality. Blender is one of our longest and most intensive CPU performance benchmarks, of the sort likely to induce throttling, especially given our thermal results earlier in this article with the stock 1700X.
In Blender, overclocking improvement wasn’t quite as high, but still worthwhile: we’re down 8.72% from 29.8 to 27.2 minutes. We see the stock 1700X running at ~29.8 minutes for the full 4K render, where the 1700 stock completes the operation in around 32.9 minutes. The 1800X (stock) finishes in 28.7 minutes, or about 1 minute faster (~3.7% reduction) than the 1700X stock. Similarly priced Intel CPUs are left notably behind at the price, further solidifying Ryzen’s performance advantage in CPU-intensive render tasks. Granted, GPU rendering outpaces all the CPUs in this chart, but the R7 CPUs outmatch Intel when looking at CPU-only rendering.
AMD R7 1700X Adobe Premiere Render Benchmark vs. 1700, 1800X
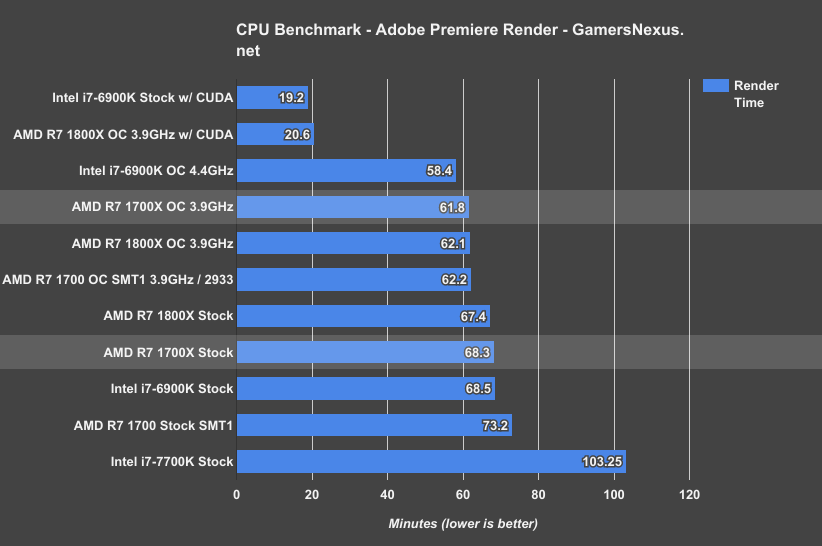
Premiere had a more favorable 9.5% reduction in render time from stock 1700X to OC 1700X, but we’re still in striking range (read: effectively equal performance) compared to the 1700 overclocked CPU. The stock 1800X underperforms when compared to all overclocking variants, though does perform markedly better than the stock 1700 (but not really much better than the stock 1700X). If you’re not planning to overclock, the 1700X is better value than the 1800X given the limited gains in this particular test.
3DMark FireStrike - R7 1700X
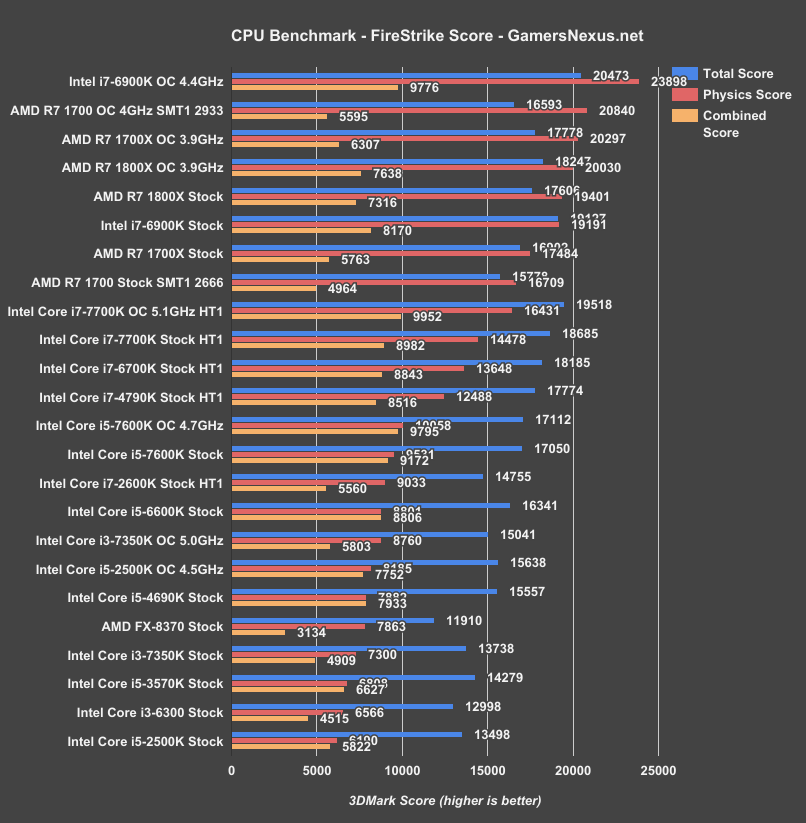
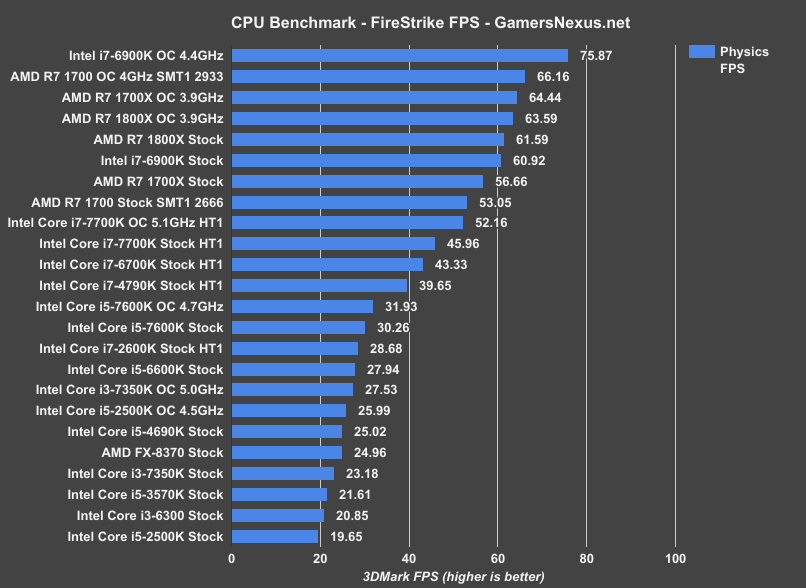
Physics is the CPU-bound aspect of the FireStrike benchmark, and the 1700X places right where it should: between the stock 1700 and 1800X.
3DMark TimeSpy - R7 1700X
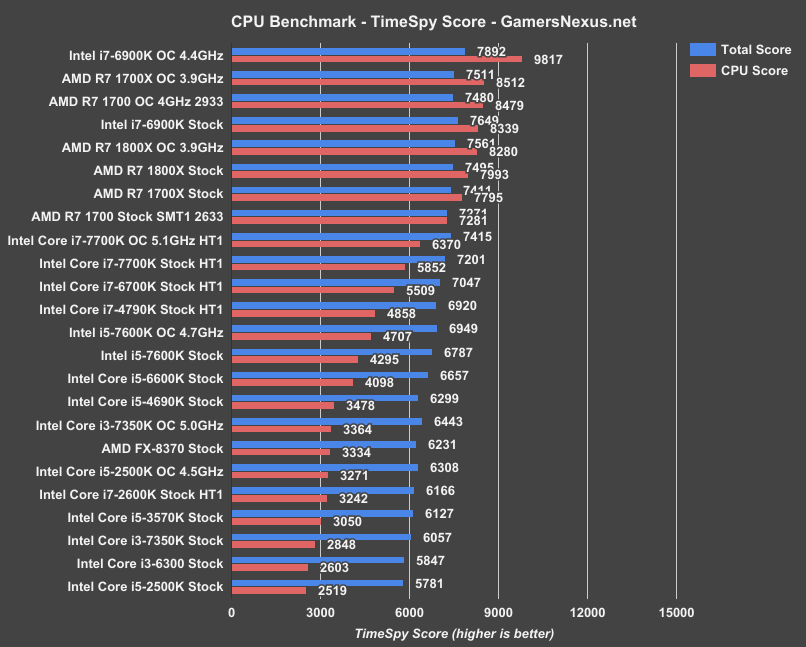
TimeSpy showed nearly the same trend as FireStrike: the stock CPU placed between the stock 1700 and 1800X, but the overclock pushed its FPS above everything except the overclocked Intel 6900K. The difference is only about 0.1 FPS, and well within reasonable variance pass-to-pass with 3DMark tools. These are not perfect benchmarks with each execution.
All R7 CPUs, including the 1700X, compete strongly with much more expensive Intel production CPUs in synthetic tests. If this were the only metric used, AMD would be a clear winner in price/performance; however, as we’ve said in the past, our reviews hinge on real-world gaming performance (being GamersNexus). Let’s move to those charts next.
Continue to Page 4 for R7 1700X gaming benchmarks.
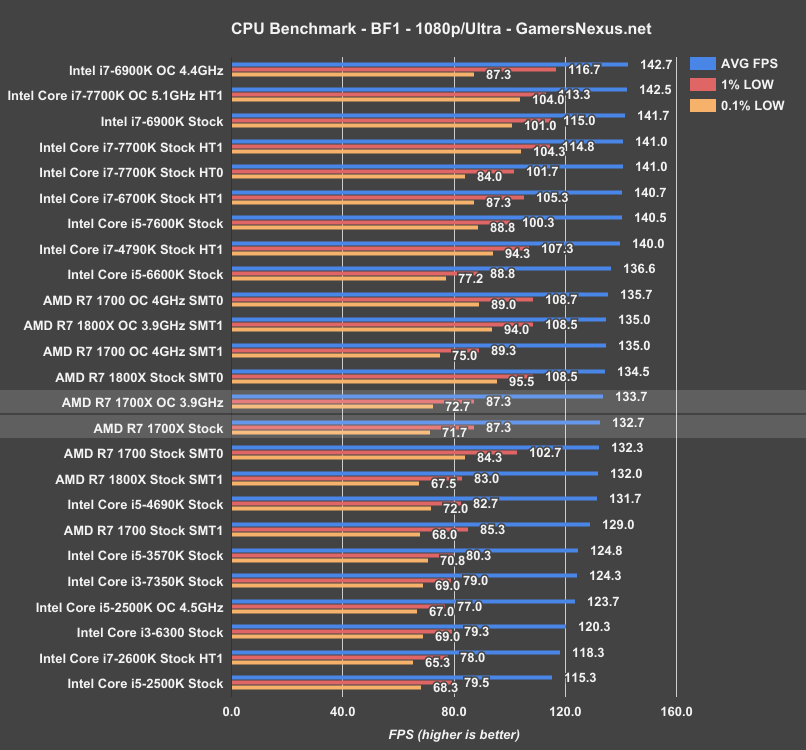
Battlefield 1 CPU Benchmark - Ryzen R7 1700X vs. 1700, 7700K, 7600K
No matter what changes have been made to frequency, SMT, or other factors, every Ryzen CPU we’ve tested has fallen in a narrow 129-135 FPS range in Battlefield 1. Overclocking the 1700X garnered a tiny 1 FPS improvement, just short of the 1800X with SMT disabled. The 1700X overclocked does lead the stock 1800X, as expected, and the stock 1700, though the 1700 with SMT0 does approach the 1700X (and the overclocked 1700 exceeds the 1700X stock).
We are using Dx11 with 1080p/ultra settings in BF1. Dx12 proved undesirable for frametime performance in previous testing, and feels worse insofar as input latency, so we stick with Dx11 on this particular title. Chart below:
Total War: Warhammer CPU Benchmark - R7 1700X
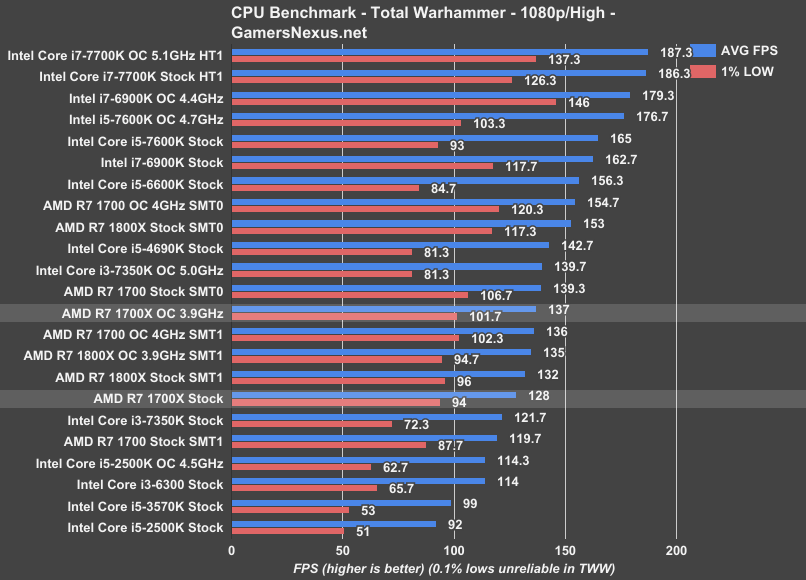
Total Warhammer had the most impressive overclocking improvement, bumping the 1700X’s performance about 7%. Without the benefits of disabling SMT, a strategy that is beneficial to Total Warhammer but impractical overall, the 1700X approaches the framerate of an overclocked i3-7350K though with better low values (imperceptible as the 80-100 gap may be).
Watch Dogs 2 CPU Benchmark - R7 1700X
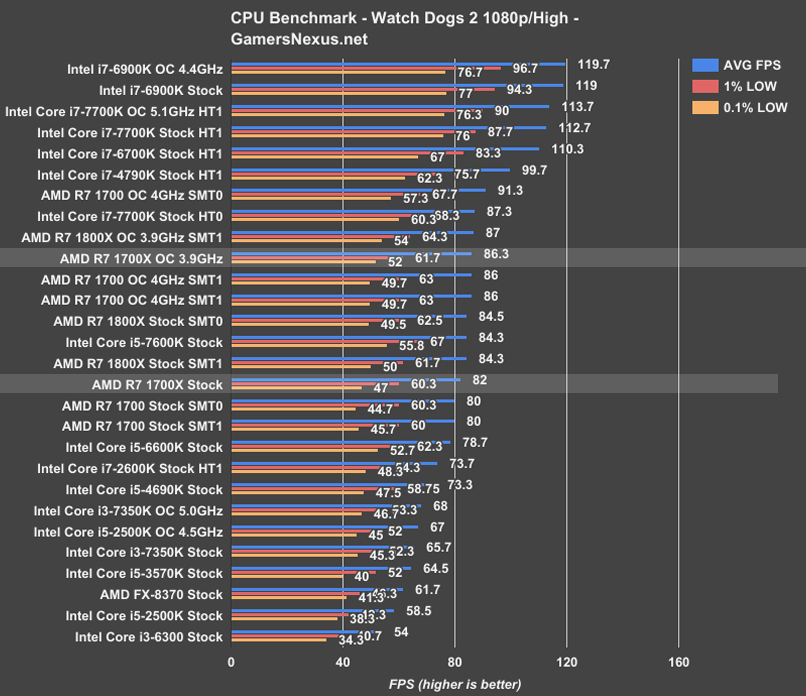
Overclocking the 1700X gave Watch_Dogs 2 a respectable 5.2% boost, but didn’t bring it near the stock i7-4790K. Relative to other overclocked R7s, the 1700X performs effectively equally to the 1800X OC and 1700 OC, with all three CPUs performing in the ~86FPS range. For some perspective, the stock R7s all fall in a range of 80-84.3 average FPS, with a price range of $330-$500.
Ashes of the Singularity CPU Benchmark - R7 1700X
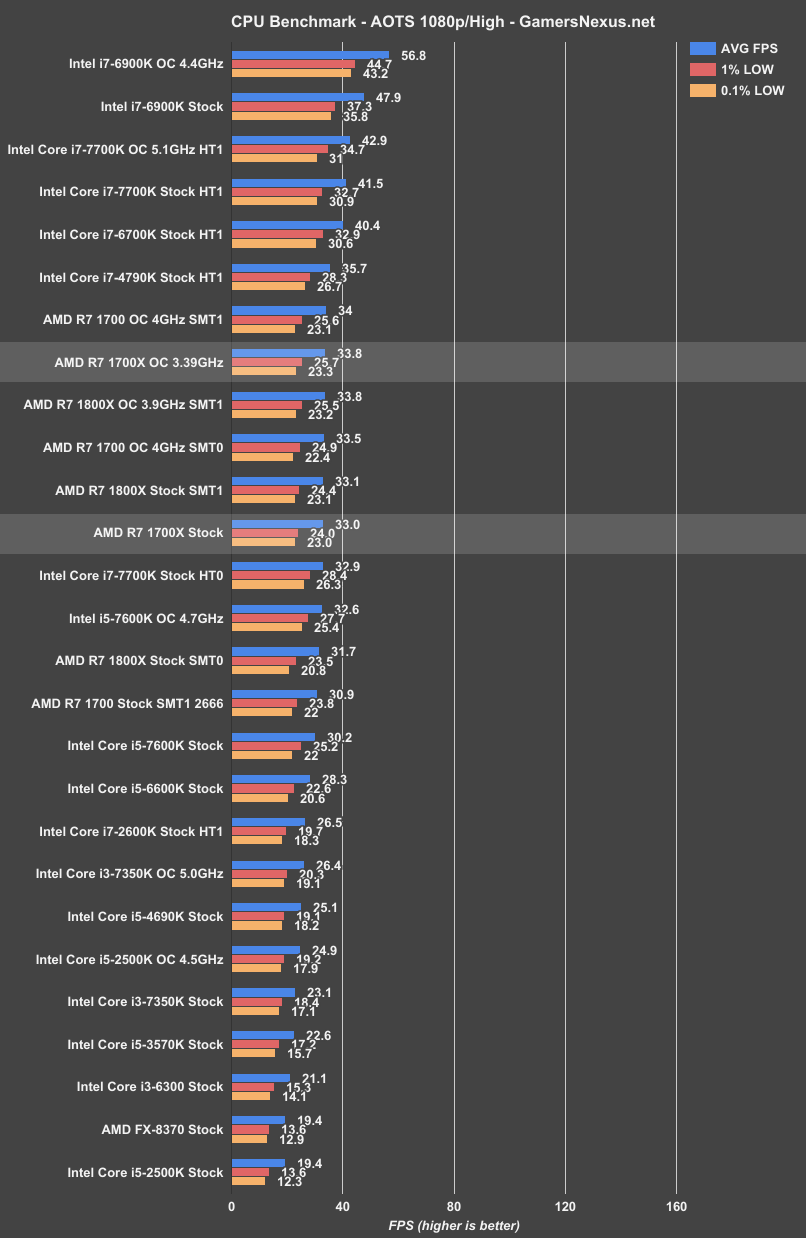
Average FPS in the Ashes of the Singularity DX12 (1080/high) test rarely rises above 40, and differences between CPUs are accordingly small: the 1700X OC averaged out exactly the same as the 1800X OC (albeit with lower 1% and 0.1% lows) and very slightly under the 1700 OC. Again, with differences this slight, price becomes the major deciding factor. That said, we do learn that AOTS, unlike Total Warhammer, is exceptionally reliable in its framerate output with this particular test configuration.
Metro: Last Light CPU Benchmark - R7 1700X
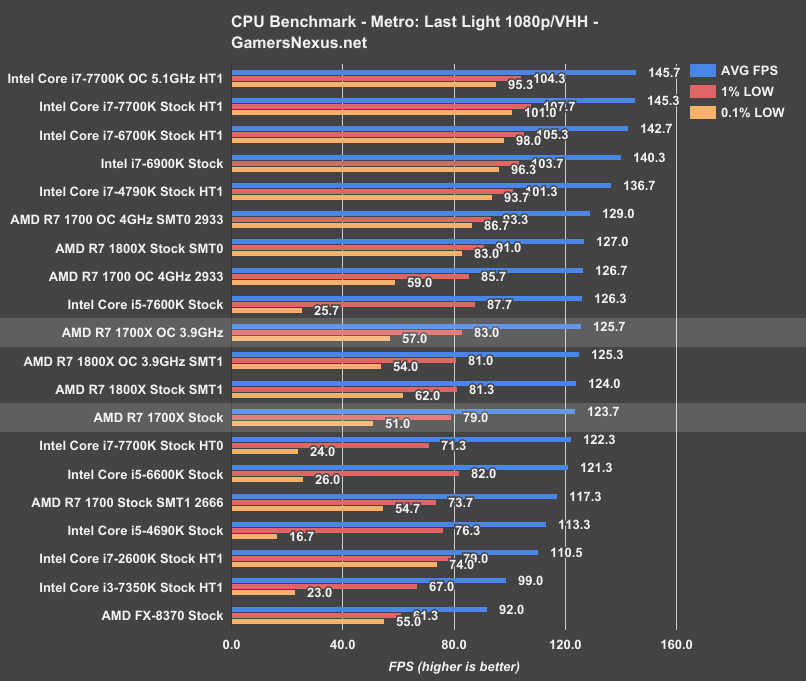
The stock 1700X lands at around 124FPS AVG, just below the 1800X (SMT1, stock) in the stock, and predictably ahead of the R7 1700 stock. Intel’s i5 CPUs perform poorly at the low-end in this particular benchmark, making the 7600K’s lead in averages largely mute. That said, the few-gen-old 4790K outperforms all the R7 chips in this game. The 7700K leads the stock CPUs on this chart.
Looking strictly at the R7 CPUs, the overclocked 1700X performs about the same as the 3.9GHz overclocked 1800X (expectedly) and 4.0GHz 1700.
GTA V CPU Benchmark - R7 1700X
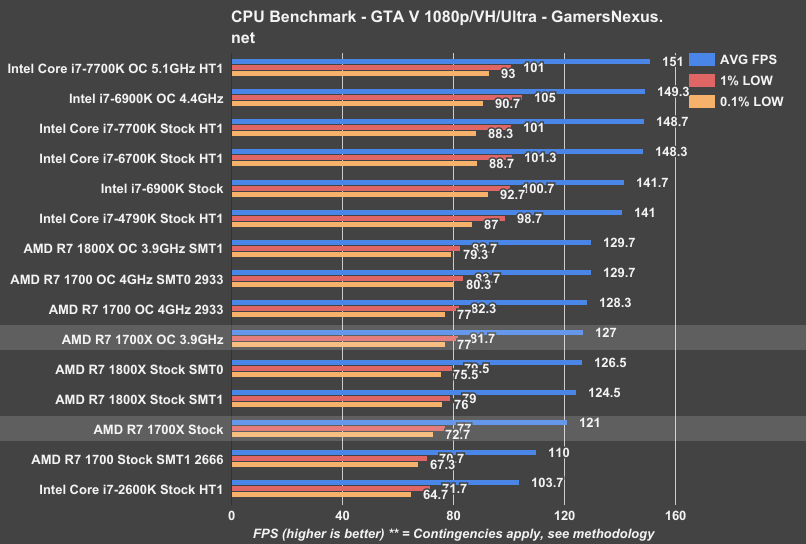
There is at least a definite 5% FPS increase from overclocking the 1700X in GTA, but the stock i7-4790K remains just above the R7s, and overclocking the R7s serves as a great equalizer. We’re continuing to leave i5s out of the GTA results as they begin to stutter severely past 187 FPS due to engine constraints, but the only i7 outperformed here is the stock i7-2600K (beaten by the 1700 Stock, SMT1, 2666MHz memory).
If you're interested in 1440p benchmarks, check our 1700 & 1800X reviews.
Conclusion: The Odd Position of the 1700X
Compared to the 1800X ($500), the 1700X predictably had mostly identical performance when overclocked, but the 1700X ($400) didn’t offer any additional overclocking headroom over the 1700. And, for that matter, the 1800X doesn’t offer any more headroom than the 1700X. Or the 1700 (so far, we’ll see if binning changes). AMD has created a fairly unusual product lineup: usually, the high end of three options is too expensive and the low end is just undesirable, ultimately driving people toward the middle option. The 1700X, though, appears to be a small base upgrade to the 1700 that could be performed by users themselves for free. Even without the heavier 3.9-4.0GHz overclock, it’s not hard for a 1700 to match the 1700X in performance for gaming. You’d have to get more serious about overclocking (read: go beyond multiplier + vcore changes) to get value out of the 1800X, but even those benefits seem questionable at the price.
The 1700X is guaranteed to run at the frequencies that it lists in the specs, sure. It’s also got a higher XFR and boost clock out-of-box, which is valuable in use cases where overclocking is either impermissible (IT doesn’t allow it, for instance) or uncomfortable. That said, we firmly believe the R7 CPUs should be overclocked -- it’s easily done and the performance gains are meaningful in many cases, making the few minutes worthwhile. Based on these results, we would say that overclocking is worth the effort, but that the 1700X is marketed towards customers who are unwilling to do so. AMD’s strongest competition is itself, here: getting our 1700 to run at 3.9GHz or 4.0GHz (thereby equalling or exceeding the 1700X’s performance) only required typing in one or two numbers, and that makes it a better value in our book. Buying the 1700X becomes a better deal if the stock cooler is used, but buying a 1700 and an aftermarket cooler is still potentially cheaper.
For the gaming audience, we’re still advising that, of the three R7 CPUs out, the 1700 makes the most sense. The 1700X and 1800X are poor value considering the i7 competition, but the 1700 is priced similarly to the 7700K and makes up for losses in production potential. If you’re doing mixed workloads, like CPU-accelerated content creation (streaming, encoding, non-GPU rendering) with some gaming, then the R7 1700 remains the clear winner -- and that includes Intel’s price-competing lineup. If you’re just gaming and not planning to touch content creation software, stick with an i7 for same-price competition. The i5s remain good competitors at their price, though do fall short in a few games on our bench (like the frametimes in Metro, or overall performance in Watch Dogs). For this category, it’s R7 1700 or i7-7700K for new systems, depending on workload. If you already own an i7 CPU and are trying to figure out of the 7700K is worth the upgrade, the answer is likely “no,” but it depends on the generation. Check our 7700K review for that help.
As for the 1700X, it’s just weirdly positioned. Unless you can’t overclock or are adamant in remaining stock, it doesn’t make much sense given AMD’s own competition.
Editorial, Testing: Patrick Lathan
Test Lead, Supporting Editing: Steve Burke