Following our in-depth Ryzen VR benchmark (R7 1700 vs. i7-7700K with the Rift + Vive), we immediately began compiling results for the concurrent R5 test efforts by GN Sr. Editor Patrick Lathan. Working together, we were able to knock-out the VR benchmarks (check those out here – some cool data), Ryzen Revisit piece, and today’s R5 reviews.
Both the R5 1600X ($250) and R5 1500X ($190) CPUs are in for review today, primarily matched against the Intel i5-7500 and i5-7600K. For comparison reasons, we have still included other CPUs on the bench – notably the i7-7700K and R7 1700, just to give an understanding of what the extra ~$70-$130 gets.
For anyone who hasn’t checked in on our content since the initial Ryzen reviews, we’d strongly encourage checking the Ryzen Revisit piece for a better understanding of how the scene has changed since launch. That revisit looks at Windows updates (and debunks some myths), EFI updates, and memory overclocking impact on Ryzen performance.
Although we have rerun the R7 gaming benchmarks with higher memory frequency (thanks to GSkill and Geil for providing B-die kits), we have not yet rerun them in synthetic tests. The 2933MHz frequency, as a reminder, was a hard limitation on our test platforms in the initial round of R7 reviews.
We will be including that data (albeit truncated) in our new tests, alongside Intel retests for the same games. For now, though, we’re reviewing the R5 1600X and R5 1500X CPUs in the Ryzen family, priced at $250 and $190, respectively.
AMD R5 1600X, 1600, 1500X, 1400 Specs
| R5 1400 | R5 1500X | R5 1600 | R5 1600X | |
| Cores/Threads | 4C/8T | 4C/8T | 6C/12T | 6C/12T |
| Base/Boost | 3.2/3.4GHz | 3.5/3.7GHz | 3.2/3.6GHz | 3.6/4.0GHz |
| Stock Cooler | Wraith Stealth | Wraith Spire | Wraith Spire | None |
| TDP | 65W | 65W | 65W | 95W |
| Release Date | April 11, 2017 | April 11, 2017 | April 11, 2017 | April 11, 2017 |
| Price | $170 | $190 | $220 | $250 |
The Ryzen 5 CPUs more directly target the i5 CPUs, even in gaming applications. This is AMD’s most interesting launch of the Ryzen family, we think, given the heavy market saturation of aging i5 CPUs.
We received the 1600X and 1500X CPUs for immediate review, which are 6C/12T and 4C/8T CPUs, respectively. These CPUs run two CCXs with a few cores enabled per CCX. The 1600X is the high-end, priced at $250 with a 95W TDP (and targeting the 7600K); the 1500X, meanwhile, is a $190 CPU that targets the 7500. Keep in mind that TDP numbers are not comparable cross-architecture, as the definition of TDP – more a measure of power required to cool a chip – is not the same between companies.
Regardless, the R5 1600X and R5 1500X are built to target the best of Intel’s i5 lineup. We may test the other R5 SKUs later.
CPU Test Methodology
Our usual testing methodology is defined further below, per typical copy/paste of methods between reviews, but we have a few explicit items to address with Ryzen.
During R7 testing, GamersNexus discovered that Windows would occasionally engage core parking or other power saving features that could impact framerate in some games, specifically with Ryzen. This was not always detectable, but some games reacted more than others (our biggest observable difference was ~4-5%). As such, all tests were conducted in performance mode.
We’ve been using the newest (and correct) version of AMD’s chipset drivers since we began testing, and we’ve been on ASUS’ version 1006 (latest available when testing began) BIOS for the Crosshair Hero VI.
A clean image is used for all testing. We have Windows images on multiple SSDs, each labeled for the appropriate CPU architecture. We pull an SSD with the correct label from the shelf (e.g. Skylake, Broadwell-E, Ryzen) and use that for testing. Note also that Windows HPET can affect performance.
Game Test Methodology
Windows 10 b970 was used for testing. R7 CPUs have been retested; some i7 & i5 CPUs have been retested. Game settings were manually controlled for the DUT. All games were run at presets defined in their respective charts. All other game settings are defined in respective game benchmarks, which we publish separately from GPU and CPU reviews.
Average FPS, 1% low, and 0.1% low times are measured. We do not measure maximum or minimum FPS results as we consider these numbers to be pure outliers. Instead, we take an average of the lowest 1% of results (1% low) to show real-world, noticeable dips; we then take an average of the lowest 0.1% of results for severe spikes.
Hardware Used
Core Components (Unchanging)
- NZXT 1200W Hale90v2
- For DDR4 platforms: Corsair Vengeance LPX 32GB 3200MHz*
- For Ryzen DDR4: Corsair Vengeance LPX 3000MHz clocked to 2933MHz (See Page 2)
- Premiere & Blender tests do not exceed 8GB DRAM. Capacity is a non-issue for our testing, so long as it is >16GB
- For DDR3 platforms: HyperX Savage 32GB 2400MHz
- Intel 730 480GB SSD
- Open Air Test Bench
- Cooler #1 (Air): Be Quiet! Dark Rock 3
- Cooler #2 (Cheap liquid): Asetek 570LC w/ Gentle Typhoon fan
- Cooler #3 (High-end): Kraken X62
- EVGA GTX 1080 FTW1
Note: fan and pump settings are configured on a per-test basis.
AM4 Platform:
- GEIL X 3200MHz CL16 (R5s, R7 1700, R7 1800X)
- GSkill Trident Z 3200MHz CL14 (R7 1700X)
Used for R7 1800X, R7 1700X, R7 1700.
Z270 Platforms:
- Gigabyte Aorus Gaming 7 (primary)
- MSI Gaming Pro Carbon (secondary - for thermal validation)
- i7-7700K (x2) samples from motherboard vendors
Both used for the 7700K.
Z170 Platform:
- MSI Gaming M7
- i7-6700K retail
Z97 Platform:
- Gigabyte Z97X G1 WIFI-BK
- i7-4790K
Z77 Platform:
- MSI GD65 Z77
- i7-2600K
Dx12 games are benchmarked using PresentMon onPresent, with further data analysis from GN-made tools.
Note: We'd like to add the i5, i3, and FX CPUs, but this was enough for now. We'll add those as we expand into coverage of Zen or i5 Kaby Lake products.
Thermal Test Methodology
Thermal measurement on Ryzen is not necessarily trivial, as most software is incorrect or inaccurate in these early days. See this page from our 1800X review for further information, or AMD’s own statement.
Power testing is simply done at the wall. We do not presently tap into the rails, and openly identify this as our weakest point in current test methodology. This is something we will eventually work toward revamping. For now, we use wall meters to determine a power delta in A/B tests.
Continue to Page 2 for temperatures and power.
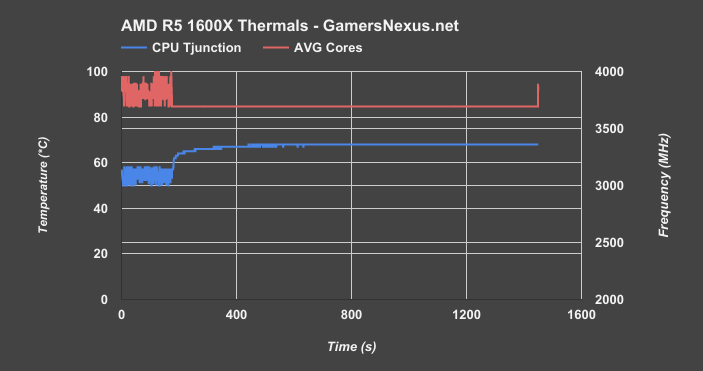
AMD R5 1600X & 1500X Temp vs. Time
Thermal testing on the R5 1600X shows that, using our Kraken X62 cooler, we are not in danger of encountering a clock throttle at any point during the test; this wasn’t true for some previous CPUs, like the 1800X and 1700X units that had higher vCore out of the box. The 1700 and 1600X, however, are able to keep a flat clock when under the thermal torture test. The sporadic lines at the front-end illustrate XFR prior to test execution, if you’re curious.
We’re still working on running a separate thermal piece on Ryzen and are working on collecting info, as the tests are not necessarily as straight forward as normally. Stay tuned for that standalone content.
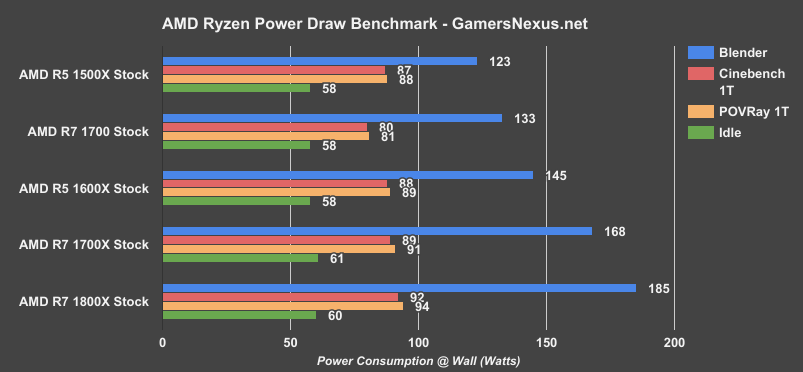
As for voltages and power, the 1600X draws about the same power from the wall as all the other Ryzen chips, expectedly, as does the 1500X. Under a Blender multithreaded workload, the 1600X stock CPU clocks at 3.7GHz across all cores, running a voltage of about 1.7 to 1.2vCore. Power draw is 145W constant with this workload, compared to 123W constant on the R5 1500X with its 3.6GHz speed and 1.2 to 1.24 vCore. Comparatively, the 1800X drew about 185W in the same test, with the 1700X drawing 168W and 1700 Stock CPU drawing 133W, pre-overclock.
R5 1500X Stock, Balanced
| Stock + balanced | Idle | Blender (multi-thread) | Cinebench (single-thread) | POV-Ray (single-thread) |
| Watts | 58 | 123 | 87 | 88 |
| CORE #0 Frequency MHz | 3600 | 3900 | 3875-3900 | |
| Core Voltage | 1.243 | 1.417 | 1.395-1.417 |
R5 1600X Stock, Balanced
| Stock + BALANCED | Idle | Blender (multi-thread) | Cinebench (single-thread) | POV-Ray (single-thread) |
| Watts | 58 | 145 | 88 | 89 |
| CORE #0 Frequency MHz | 3700 | 3700-4100 | 4100 | |
| Core Voltage | 1.177-1.199 | 1.395-1.417 | 1.395 |
Let’s move to competitive benchmarks, starting with Blender, Premiere, and then gaming.
Continue to Page 3 for Blender, Premiere, & Synthetics.
AMD R5 1600X & 1500X Blender Benchmark
We’re running our Blender tests using release candidate-ready settings, with 400 samples per pixel and 16x16 tiles. This is an optimal use case for Blender, and one with which we’re familiar for our own animations we render in-house. As is known, Blender cares most about threads, and so there should be significant differences between the R5 12-thread and 8-thread chips here, despite likely minimal differences clock-for-clock in games.
We’re seeing the R5 1500X ($190) stock renders the 4K scene in 55.5 minutes, faster than the overclocked i5-7600K ($240) by 7 minutes, resulting in an 11% reduction in render time. The next closest CPU is the 2011 i7-2600K overclocked to 4.7GHz, which completes the render in 54.5 minutes. Overclocking the 1500X to 4GHz leapfrogs the 2600K OC, landing at 50.7 minutes, at which point we’re in Devil’s Canyon i7 territory. Most critically, the common thread here is threads, something Blender holds in high esteem. Now, you’re still limited by single-thread performance at some level – but Blender load balances exceptionally well, and adding more threads is almost always better.
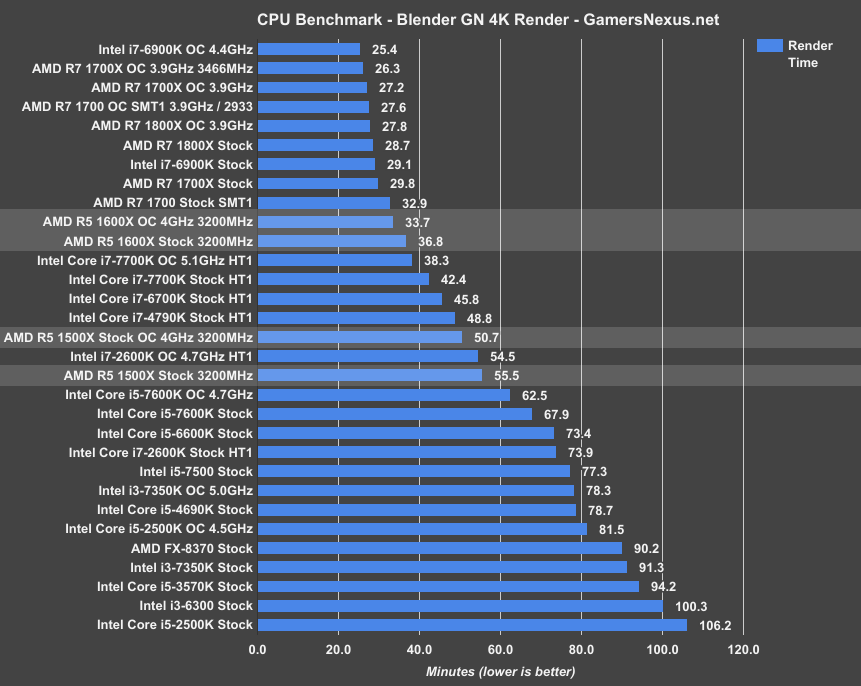
The 1600X ($250) stock leverages its extra four threads here, completing the render in 36.8 minutes. Compared to the 1500X stock, that’s a render time reduction of 33.6%. Note here that our R7 CPUs haven’t yet been rerun on 3200MHz, though you can see the memory benefit between the 2933MHz R7 1700X OC and R7 1700X with 3466MHz. That should allow some extrapolation – it’s minimal in these types of tests; at least, when compared to the gains found in gaming tests.
Price-to-performance, Intel i5 CPUs don’t stand up here. The i5-7600K, overclocked to 4.7GHz, finishes its render in 62.5 minutes. The R5 1600X, overclocked to 4GHz, finishes in 33.7 minutes – that’s a render time reduction of 46% for roughly the same price. Again, it follows that, given a reasonably comparable frequency, the additional four threads on the 1600X are beneficial in thread-bound production tasks.
If you actually plan to do some CPU-bound rendering, the R5 and R7 chips remain – as we have said from the get-go – the chief consideration at the price. Granted, anyone rendering for professional (read: non-hobbyist) reasons would do well to consider an R7 1700 instead of the R5 CPUs. At the price, Intel does not presently hold up in this particular test. The R7 1700 ($330) more or less invalidates the higher-cost R7 alternatives, if you’re willing to invest a few minutes in overclocking. The R5 CPUs do well – significantly better than the i5 CPUs (in a greater way than i7-7700K vs. R7 comparisons), but professionals may get ROI on an extra $70 on the 1700.
AMD R5 1600X & 1500X Adobe Premiere Benchmark
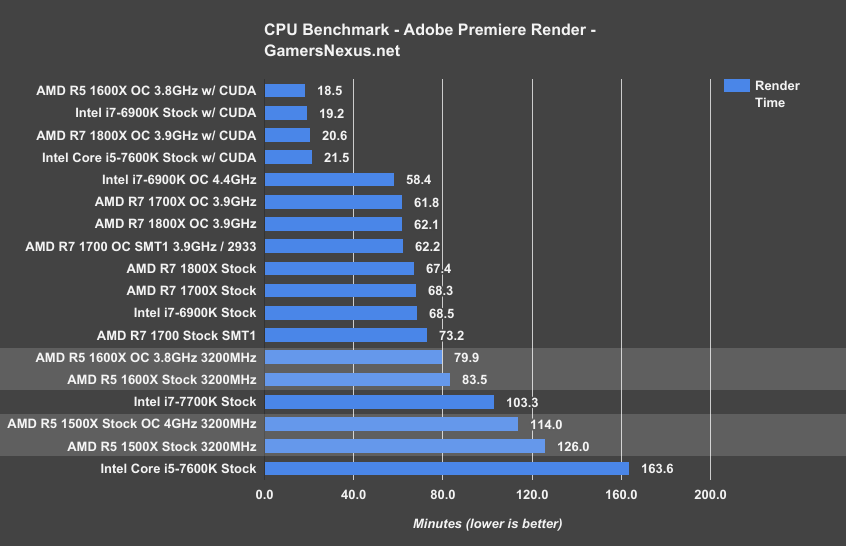
Let’s look to Adobe Premiere rendering now. We’ve included CUDA accelerated benchmarks here as well, just to provide perspective for users who prefer CUDA-accelerated rendering to software acceleration in compatible applications. Premiere is one of those.
We immediately see that GPU acceleration is somewhat of an equalizer with our render workload, which features color correction, warp stabilization, and spits out our EVGA ICX review. With a GPU, the 1600X, 6900K, 1800X, and 7600K are all within a few minutes of each other, performing multiple times faster than their software-accelerated counterparts.
Looking instead to CPU rendering, the R5 1500X finishes the render in 114 to 126 minutes, depending on overclock, which lands it a render time reduction of 23% from the i5-7600K stock-to-stock. The i7-7700K finishes the render in 103 minutes, which is 23.7% behind the 12-thread R5 1600X (at 84 minutes). Compared to an R7 1700 overclocked, which we still think is the best buy of the R7 family, the overclocked R5 1600X is about 28% slower.
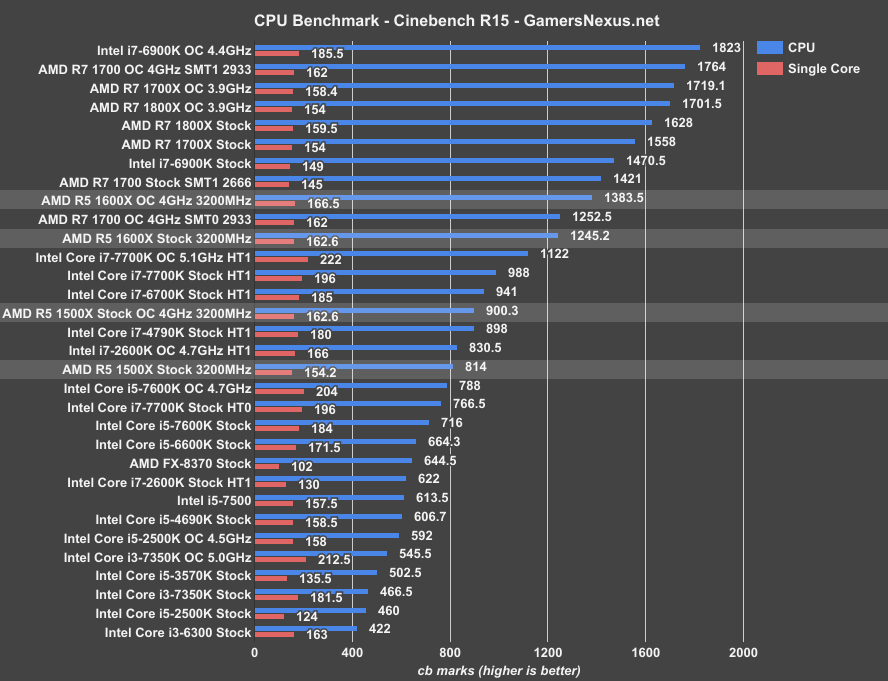
Cinebench has stood as a preferred synthetic benchmark of AMD’s, although our Blender tests tell more of a real-world story (both using similar routines for CPU rendering). With this latest updated, the R5 1500X (stock) lands just below the i7-2600K in both NT & 1T performance, or just ahead of the overclocked i5-7600K same-price, current-gen CPU. The 2600K, although impressive in many ways, is primarily holding on as a result of its thread count – render software likes threads, generally speaking.
The R5 1500X OC is pushed up to Devil’s Canyon levels in NT performance, though still behind in 1T. Slower 1T performance will come into play more when we observe Amdahl’s Law in gaming tasks. The R5 1600X CPU pushes beyond the 7700K at 5.1GHz, expectedly, with 1245 for its cb mark score.
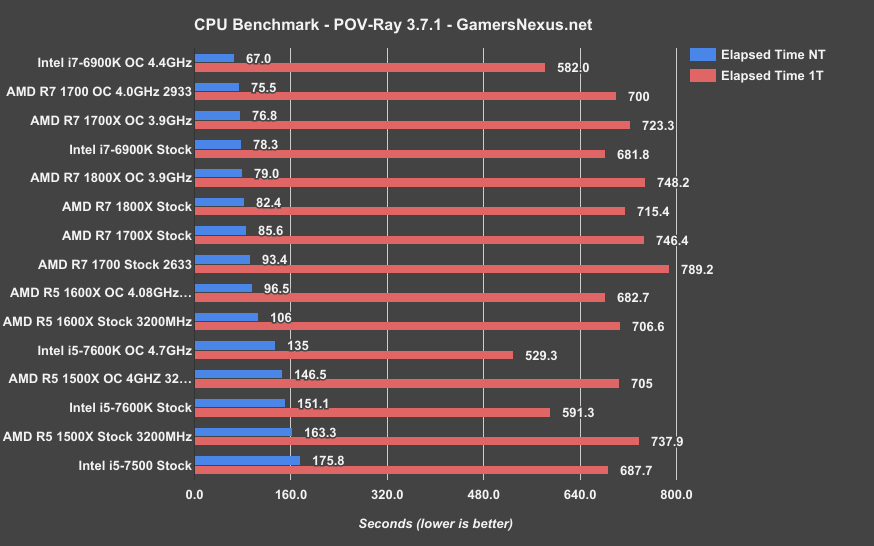
And POVRay:
Continue to Page 4 for gaming benchmarks.
Battlefield 1 CPU Benchmark – AMD R5 1600X vs. 7600K, 1500X, 7500
Battlefield 1 is one of the games where we saw performance uplift following recent patch 1.08, which improved performance on both Ryzen and Intel CPUs. Our Ryzen Revisit showed R7 uplift, but did not revisit Intel’s CPUs. For this review, we’ve rebenchmarked the i7-7700K ($345), i5-7600K ($240), and i5-7500 ($200); other Intel CPUs have not been retested in this title, and so will place a few percentage points lower on the charts than if retested. This is just a matter of time limitations. All AMD chips (sans FX-8370) and the most relevant Intel chips have been retested on 1.08.
The AMD R5 1500X places on the chart at 126FPS AVG, with lows at 80FPS 1% low and 63FPS 0.1% lows. Surrounding the 1500X, the Intel i5-4690K runs at 132FPS AVG, 83FPS 1% low, and 72FPS 0.1% lows. This plants the 4690K about 4.3% ahead of the 1500X when both are stock. The 1500X outperforms the i5-3570K Sandy Bridge CPU, which runs around 125FPS AVG, and the i5-2500K overclocked, around 124FPS AVG.
The i5-7500, AMD’s closer price competition from this generation, operates at around 138FPS AVG, 87, and 77FPS lows. That lands the i5-7500 about 9% ahead of the R5 1500X, with a $10 increase in MSRP. The i3-7350K ($170) further reinforces our initial review’s point that the CPU is cool from a perspective of an unlocked i3, but at $170-$180, doesn’t make much sense. The 7500 or 1500X both make way better sense for the small price gap.
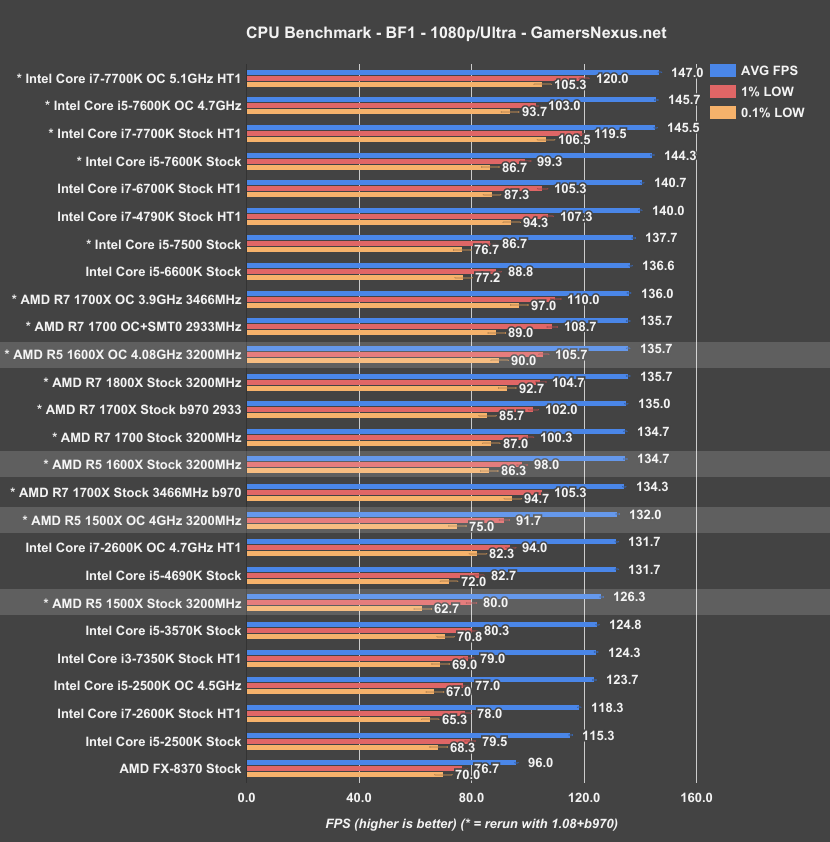
Overclocking the R5 1500X to 4.0GHz lands us at 132FPS AVG, now ahead of the overclocked i7-2600K (*prior to version 1.08 tests) and behind the R7 1700X with its 3466MHz memory config.
Looking at the R5 1600X now, the CPU places at 135FPS AVG with lows at 98 and 86, just behind the R7 1700 stock CPU. This proves that games don’t much care for the extra cores; in fact, you’d most often be better off killing some threads and just overclocking a cheaper chip, if gaming is the core desire.
Overclocking the 1600X gets the CPU up to 136FPS AVG at 4.08GHz, which is right around where the 1700X at 3.9GHz with 3466MHz memory landed. Given a $150 price disparity, if gaming is your thing, the 1600X effectively invalidates the 1700X in this title. We’ll have to look at others for a better understanding.
Now, the update didn’t only benefit AMD. Intel’s i5-7600K also saw uplift, now placing at 144FPS stock and 146FPS overclocked. That lands the i5-7600K stock about 7% ahead of the 1600X stock, with lows effectively equal. The overclocked 7600K is also roughly 7% ahead of the overclocked 1600X.
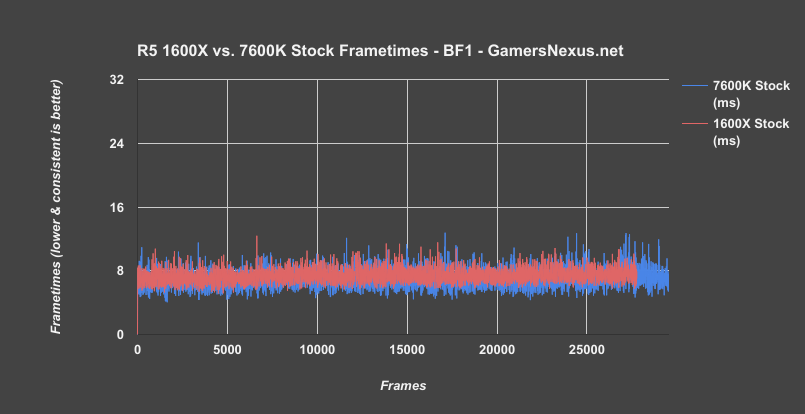
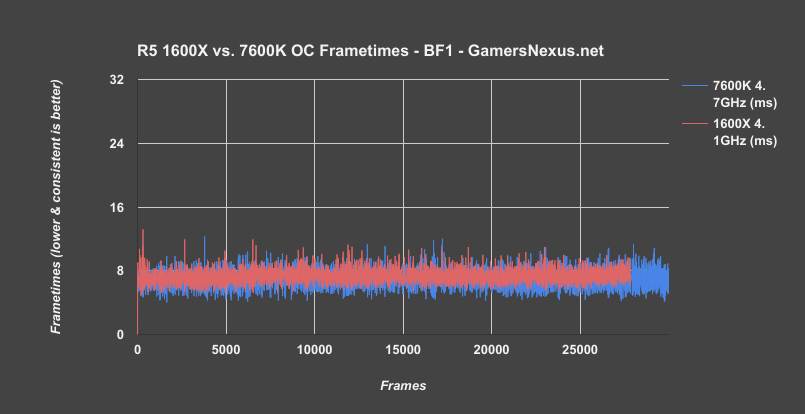
Here are a few frametime charts for this title:
1600X BF1 Frametimes: Stock (v. 7600K)
1600X BF1 Frametimes: Overclocked (v. 7600K)
1500X BF1 Frametimes: Stock vs. OC
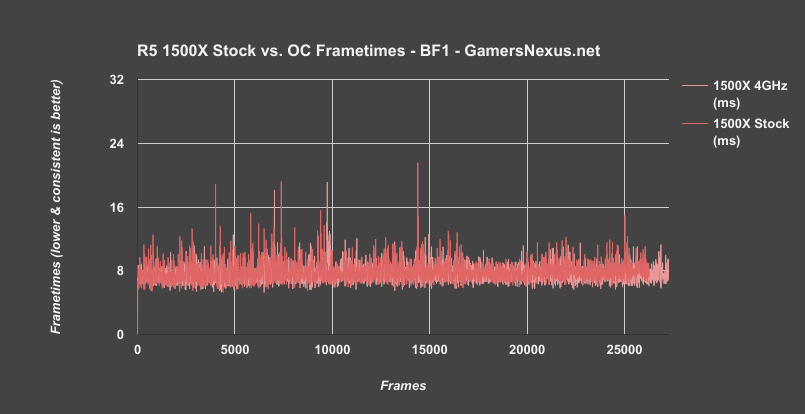
Above: The 1500X shows marked improvement in smoothing over frametimes from an overclock, and benefits in more ways than just the average FPS bar.
Total War: Warhammer CPU Bench – AMD R5 1600X vs. i5-7600K, 1500X, 7500
Moving to Total War: Warhammer, this is another game where game updates – not Windows updates, as folks seemed to think – provided improvement for AMD CPUs. Upon running retests, we also saw performance uplift on Intel CPUs. We have designated CPUs that were retested with an asterisk. CPUs lacking the asterisk would potentially see some performance improvement if retested.
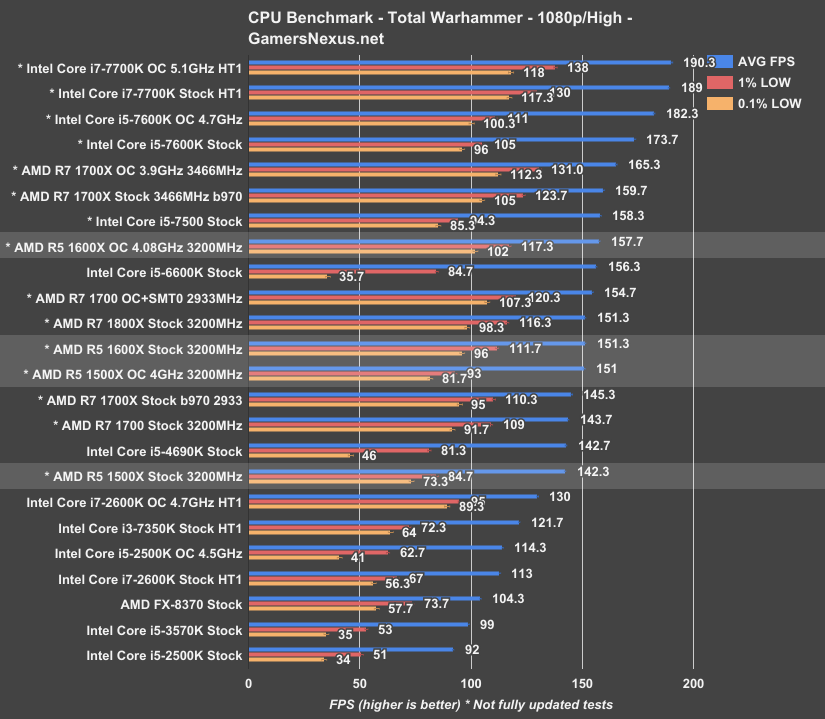
The i7-7700K is running into an external constraint, as indicated by the lack of overclock scaling. This is a limitation elsewhere in the bench, as illustrated by the positive scaling seen between the 7600K and the overclocked variant (lacking in the 7700K units – ergo, constraint). This means that a rough 190FPS is about our performance ceiling in this bench course.
The R5 1500X stock averages 142FPS, with lows at 85 and 73. This places the R5 1500X ahead of the overclocked i7-2600K at 4.7GHz, running an average of 130FPS with lows at 95 and 89, and markedly ahead of the i3-7350K in frametime performance.
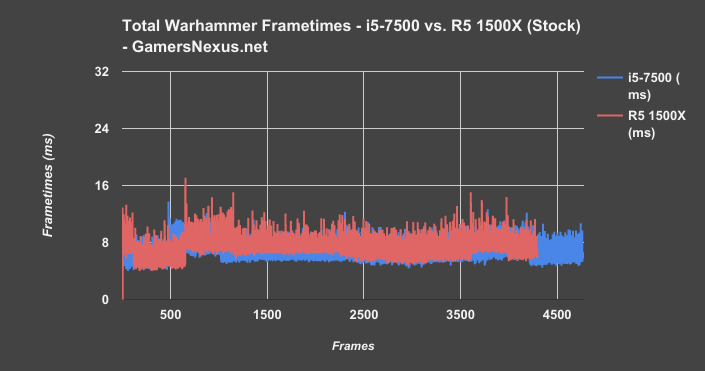
By comparison, the stock i5-7500 – a locked CPU – performs at around 158FPS AVG with lows at 94 and 85, thanks to the latest update. Before the update, this CPU struggled with low-end frametime performance. The 7500 leads the 1500X in average framerate by roughly 11%. The 7500 also leads in average milliseconds between frames, but as the below frametime chart shows, the difference is imperceptible to the end-user. We’re talking 85 versus 73 for the 1% slowest frames, here; not a huge difference, at that point.
Overclocking the 1500X gets the CPU to 151FPS, closing on the 7500. The 1500X outperforms the stock 1700X and 1700 once said R5 is overclocked, and is effectively equivalent in average framerate to the 1600X, despite a slight frametime disparity.
The R5 1600X stock performs equivalently to the 1800X stock, aiding the overclocked 1700 in further challenging the existence of the 1800X, a chip we’ve never found appealing. The 1600X overclocked to 4.08GHz outperforms the stock R7 CPUs and is effectively equal in averages to the i5-7500, though outperforms the 7500 significantly in low values. The point, here, is that it’s not all about threads: There is a point of diminishing returns and limited gains from increasing thread-count. Ultimately, per Amdahl’s law, you will become bound by the performance of a single thread. Clocking higher, saving the money by going for 4C/8T (or 6C/12T), and putting saved money toward other components (faster memory) makes a lot more sense.
By way of comparison, the overclocked i5-7600K is about 15.6% ahead of the R5 1600X overclocked in averages, with lows more or less equal. The non-overclocked 7600K does worse in lows in a statistically significant fashion than the R5 1600X stock, with averages maintained at 174FPS versus 151FPS.
Watch Dogs 2 CPU Benchmark – AMD R5 1600X vs. i5-7600K, 1500X, 7500
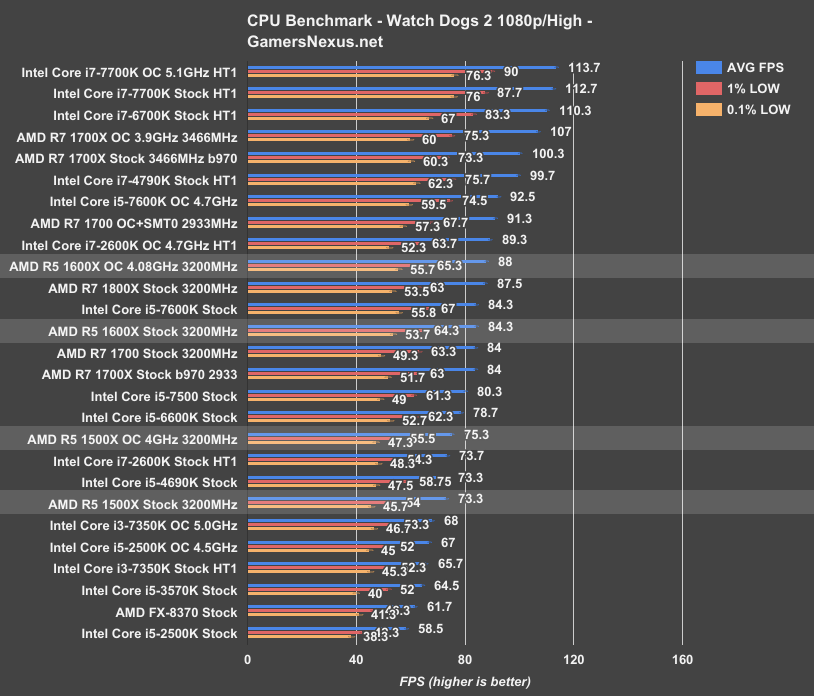
Watch Dogs 2 has proven itself to be more reliant on thread count than other games on the bench, to some extent, but does still care about clock-speed – it’s just that the i7 CPUs post a distinct advantage over the i5 CPUs. Similarly, we should expect to see some resemblance of that scaling on Ryzen CPUs.
The R5 1500X stock CPU performs effectively equally to the i5-4690K and outperforms the i3-7350K (even at 5GHz). This, again, further invalidates the i3-7350K, in just the same way that the more affordable Ryzen chips effectively invalidate the 1800X in gaming when considering overclocks. Versus the price comparative i5-7500, we’re looking at a framerate of 80FPS AVG on the 7500 non-K CPU, with the overclocked 1500X and 3200MHz RAM landing at 75FPS AVG. Considering the price difference and production advantage, assuming you run mixed workloads, this closing distance places the R5 chip in the best price-to-performance brackets of AMD’s current offerings. Intel technically leads in this comparison, but the gap is now close enough (AMD’s strength is its R5, we believe, more than the R7) to support the R5.
Moving to the R5 1600X, this CPU lands at 84FPS AVG, or about 15% ahead of the stock 1500X. Overclocking the 1600X gets it beyond 1800X stock levels, just below overclocked i7-2600K levels (SNB remains impressive), and nearing the i5-7600K 4.7GHz test’s 93FPS AVG. The 7600K (overclocked) holds a lead of about 5% over the overclocked 1600X. Stock-to-stock, we’re looking at a performance lead of effectively 0%. The 7600K and 1600X are equal when both are stock. Intel retains a lead when overclocking is considered, thanks to its additional headroom.
Metro: Last Light CPU Benchmark – AMD R5 1600X vs. i5-7600K, 1500X, 7700K
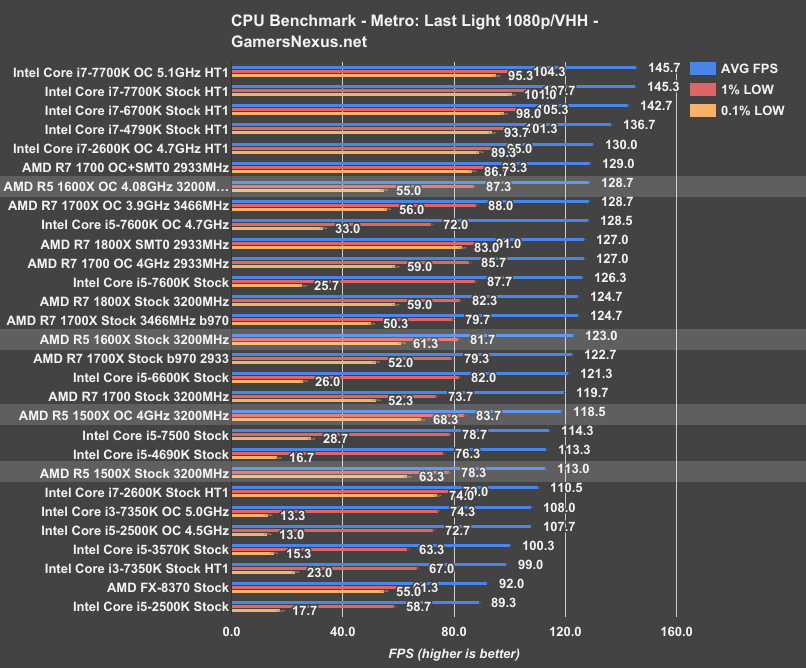
Moving to Metro: Last Light – useful, as it hasn’t been updated in years – we see an interesting scenario that resembles what Total War: Warhammer did just two weeks ago. The i5 CPUs have trouble in frametime consistency with this game – they always have, and disabling hyperthreading on i7 CPUs reinforces that – though they do OK in averages.
The R5 1500X stock CPU performs around 113FPS AVG, with lows at 78 and 63FPS. This is similar to the stock i7-2600K Sandy Bridge CPU in frametimes and averages. Overclocking the 1500X to 4GHz lands its performance right around where the stock R7 1700 sits. The i5-7500 CPU operates an average of 114FPS, with sporadic enough frametimes to result in 30FPS 0.1% values.
The R5 1600X, meanwhile, is effectively equal to an R7 1700X in performance – showing that, for games where thread count isn’t as relevant, there’s not much tangible gain from an extra four threads. The i5-7600K overclocked nets a higher average FPS, but reflects the same sporadic frametime performance. Intel Core i7 chips maintain a healthy lead in Metro: Last Light, including the i7-2600K at 4.7GHz, but R5 chips look good in this benchmark when compared to price-equivalent i5 chips.
Ashes of the Singularity Bench – AMD R5 1600X vs. 1500X, 7600K, R7 1700
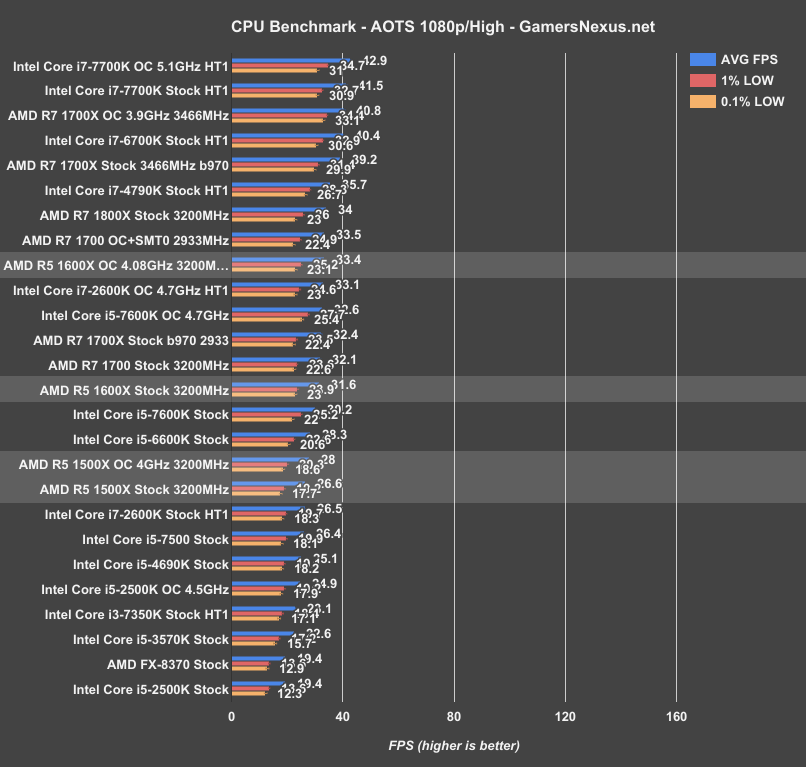
This first Ashes benchmark chart shows the old version of the game; the next chart will show the Escalation update, which has fewer data points present.
Ashes of the Singularity with High settings plants the R5 1500X stock at about 26.6FPS AVG, 19 1% lows, and 18 0.1% lows. This is effectively identical to the i7-2600K stock CPU in performance. Overclocking the R5 1500X to 4GHz doesn’t gain us much ground here, moving to 28FPS AVG; as we proved in our Ryzen Revisit piece, Ashes cares a whole lot more about a memory overclock than a core overclock. If you wanted high marks in this game, you’d be better off investing the time in memory overclocking than core overclocking. We’ve left our 3466MHz R7 1700X overclocks on this chart to illustrate that – though you should check the Ryzen Revisit content for a better understanding.
Compared to modern CPUs, the Intel i5-7500 performs at 26.4FPS, with lows from 18-20. This is, again, effectively identical to the R5 1500X stock.
The R5 1600X is a little more interesting, performing within 1.4FPS of the i5-7600K stock. Overclocking both the i5-7600K and R5 1600X maintains a similar gap: The i5-7600K is now at around 32.6FPS AVG, with the R5 1600X around 33.4FPS AVG.
More interestingly, the R5 1600X overclocked performs roughly equally to an R7 1800X stock, even with the same memory speed. Again, this further emphasizes our point that the R7 1800X is a bad buy for gaming at the price; if you are building a pure gaming machine, as we stated previously, you’re best off with either Intel, the R7 1700, or now, one of the R5 chips. We’ll talk more about this in the conclusion. The 1700X and 1800X just don’t offer good value for pure gaming performance, and never did. Even if ignoring Intel, AMD’s own product line-up competes with the two higher-cost (but not “higher-end,” as they’re the same when tuned) R7 CPUs in an effective fashion.
Ashes: Escalation – AMD R5 1600X vs. 1500X, 1700, 7600K
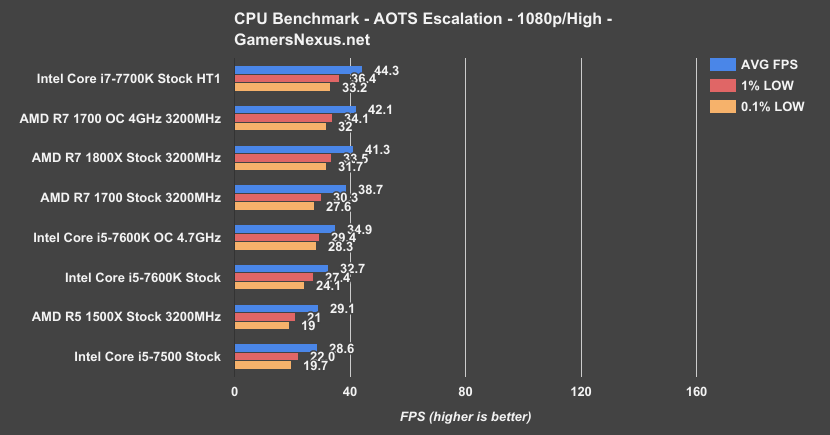
(Update: original error bars on Escalation were incorrect. We don't have enough data yet to generate those, as it is a new test. Was a copy/paste artifact.)
We haven’t retested everything in Escalation, at this point. It’s more AMD-heavy than Intel heavy, since we just started running these tests a few days ago when R5 came in.
The R5 1500X is now at around 29FPS AVG, with lows in the 19-21 range. This is effectively equal to the i5-7500, again. The R7 CPUs were rerun here, but we haven’t put the 1600X through just yet.
Conclusion: i5 Hangs On with Fading Grasp
There’s no argument that, at the price, Ryzen is the best price competitor for render workloads if rendering on the CPU – though GPU-accelerated rendering does still serve as an equalizer, for people who use compatible workloads (see: Premiere w/ CUDA on i5-7600K, 6900K, & 1800X). If CPU rendering is your thing, Ryzen 5 is well ahead of same-priced i5 CPUs.
For gaming, AMD ties same-priced Intel i5 CPUs in some games – like Watch Dogs 2 before OC – and is 7-15% behind in other games (7-10%, generally). AMD has closed the gap in a significant way here, better than they did with R7 versus i7, and offers an even stronger argument for users who do legitimately plan to do some content creation alongside gaming. With regard to frametimes, AMD’s R5 series is equal in most worst cases, or well ahead in best cases. Although the extra threads help over an i5 CPU, the R7’s extra threads – Watch Dogs notwithstanding – do not generally provide much of an advantage.
If you’re purely gaming and not looking to buy in $300-plus territory, it’s looking like R5 CPUs are close enough to i5s to justify a purchase, if only because the frametimes are either equal or somewhat ahead. Interestingly, buying an R5 1600X ($250) and overclocking it would also more or less invalidate R7 purchases. If you’re not ever going to leverage those threads in encodes or render tasks, there’s not much point in having them. The 1600X would save you money that you could put toward better RAM, which actually makes a huge difference in Ryzen; in fact, as our revisit indicates, using the savings on some really high-end memory would get your 1600X to outperform a 1700 with cheaper RAM in most games.
Yes, i5 CPUs still provide a decent experience – but for gaming, it’s starting to look like either you’re buying a 7700K, because it’s significantly ahead of R5 CPUs and it’s pretty well ahead of R7 CPUs, or you’re buying an R5 CPU. We don’t see much argument for R7s in gaming at this point, although there is one in some cases, and we also see a fading argument for i5 CPUs. It's still there, for now, but fading. The current juggernauts are, interestingly, the i7-7700K and the R5 1600X with an overclock. Because the games don’t much care for the R7's extra four threads over the 1600X, performance is mostly equal to the R7 products when running similar clocks. These chips, by the way, really should be overclocked. It’s not hard and the gain is reasonable.
If you’re already settling for an i5 from an i7, it’s not much of a jump to go for an R5 and benefit in better frametimes with thread-thrashing games. The i5 is still good, don’t get us wrong, it’s just not compelling enough. It’s not as strong as the i7 is against R7, as the 7700K is still the definitive best in our gaming tests. Going beyond 8 threads doesn’t do a whole lot for your gaming experience, but as we’ve shown numerous times in i5 reviews, going beyond 4 threads does help in consistent frametimes. It’s not required – you can still have a good experience without 8 threads in most games – but that is the direction we’re moving. 16 threads won’t much matter anytime soon, but 8 will and does already. If you buy an R5, overclock it, and buy good memory, it’ll be competitive with Intel. That said, be wary of spending so much on the platform and memory that you’re put into i7+3200MHz territory, because at that point, you’d be way better off with the i7 for gaming. It’s a fine balance, but getting near an i5’s average FPS isn’t too hard with the right board and RAM.
Price is everything, ultimately. The price of the R5 CPUs, yielding mostly the same performance as the R7 CPUs (clock-for-clock), plants them as a significantly competitive alternative to same-priced Intel chips. These R5 CPUs are significantly more arguable at the price than R7 alternatives for gaming. Spend a few minutes on an overclock. It's worth it. This testing reinforces our belief that the R7 1800X is not a good buy for gaming at the price; it wasn't before R5 (see: 7700K, 1700 with OC), and now it most definitely isn't.
One final reminder: It’s not just cores doing this. People seem to forget that cores between architectures are not necessarily the same. If it were just cores, the FX series would have been defensible – but the architecture was vastly different. We are still limited by the slowest thread in gaming; it is the architecture and design of those cores that matters.
-
Check back soon for our continued VR benchmarking, thermal testing, and GTX 1080 Ti AIB partner card reviews. If you like our type of testing, you can support us on Patreon or check out our new shirt store.
Editor-in-Chief, Test Lead: Steve Burke
Sr. Editor, Tester: Patrick Lathan
Video Producer: Andrew Coleman