One of the most requested additions to our video card testing has been to normalize for noise. Several of you have emailed, tweeted, or tagged us on Reddit to ask for this type of testing, and so we started the process of re-testing some devices to build a database. The idea is to find fan RPM at a fixed dBA output – 40dBA, for example – and then test thermal performance when fans match that noise level. This doesn’t take into account the type of noise, e.g. frequency spectrum analysis, but it’s a good start to a new type of testing. And, honestly, most of these coolers sound about the same pitch/frequency (subjectively) with regard to frequency output.
The ASUS ROG Strix 1080 Ti review is our first to introduce normalized noise testing, and it’s an interesting card to start us off. We’ll talk more about that specific testing approach lower down.
The ASUS Strix cooler is fairly straight-forward: The baseplate covers only key areas, like the VRAM, with the right half of the cooler taking care of VRM components. The baseplate is secured by several screws on the top side of the PCB, rather than using screws only in the back half of the card like most vendors do. This means that removal of the shroud consists of unscrewing two back-side Phillips screws, the four retention screws for the heatsink, and then some force. The baseplate is secured by two screws in the expansion cover, four screws around the GPU (top of the PCB), and several longer screws also on the top-side.
ASUS’ cooler is clearly less intense in its utilization of aluminum and engineering than EVGA’s ICX solution, but that doesn’t instantly make it worse: the stuff that’s being cooled matters, clearly, as do default fan profiles (something EVGA’s been routinely aggressive with). ASUS has a different VRM design from EVGA’s same-priced FTW3, which we detailed electrically here, opting to use the voltage controller used on nVidia’s FE card and a doubled 5-phase VRM (using IR3555 60A power stages).
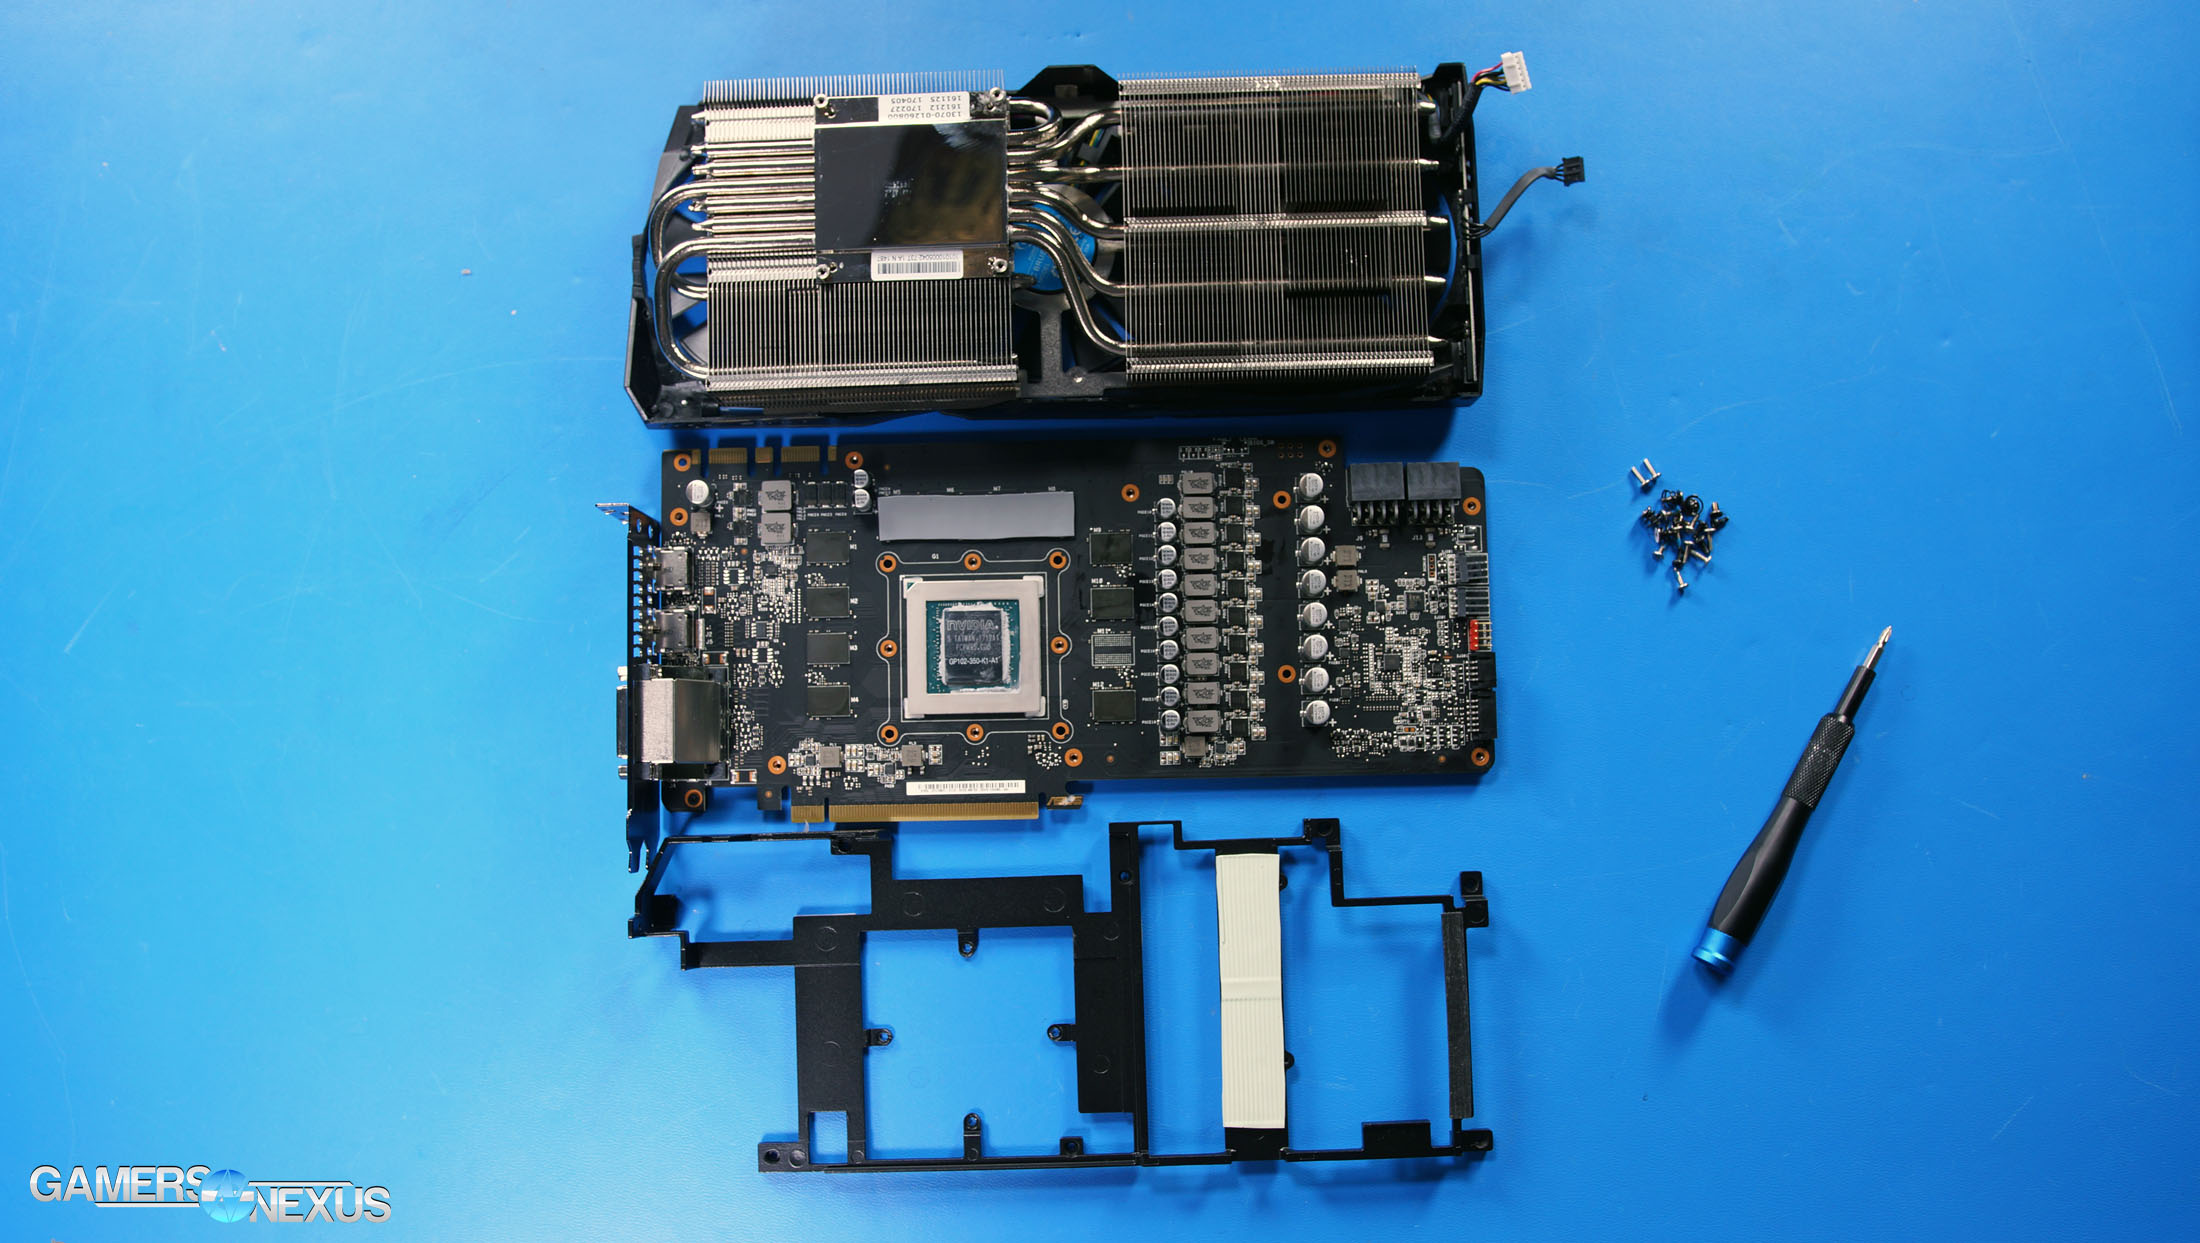
The cooler is fairly straight-forward: There’s an aluminum baseplate that’s simply flat and contacting VRAM, two finstacks over the GPU and VRM, and 6x6mm heatpipes running through the heatsinks. ASUS uses straight fins rather than the new L-shaped design that EVGA’s been touting. The only difference is that, theoretically, the L-shaped fins provide additional surface area for a wider contact patch to thermal pads, but still allow for airflow. A straight fin allows all the airflow, but has a more limited contact patch with the thermal pads. In our final ACX VRM analysis, we found that thermal pads contacting straight fins do actually help quite a bit more than no contact at all, but the L-shaped design does improve this. Whether or not it’s relevant, of course, is a different story. VRMs can take a lot of heat – easily 125C, in most cases – and don’t really need special attention. It’s not a bad thing and helps with efficiency, but also not necessary.
Anyway, the ASUS Strix version of the 1080 Ti is priced at $780, meaning it’s among the most expensive two GTX 1080 Ti cards we’ve reviewed. The other would be the EVGA GTX 1080 Ti FTW3 (review is located here), with the rest of the packing landing at $750 (or $700 for the FE model). Stock frequency isn’t really a relevant thing to talk about with these cards, seeing as they just boost to whatever the thermal + power limits allow, anyway, but ASUS is going with 1708MHz boost - OC mode or 1683MHz boost - gaming mode.
Pascal means that we’re inevitably restricted in stock and overclocking performance, as voltage is regulated to a maximum of ~1.093v (to protect longevity of the silicon), despite the VRMs being capable of well over that target. This means that video card purchases should hinge almost entirely on thermal and acoustics performance, seeing as gaming performance is going to be effectively the same on all reasonably built 1080 Ti cards. Overclocking isn’t much of a differentiator, either.
For that reason, we’re focusing almost exclusively on thermals and noise for this review. The rest just doesn’t matter, plainly, as gaming performance is identical to everything else (within reason). The only real difference is in FE-type cards, where a thermal limit is encountered prior to other limits. This is resolved by converting it in to a Hybrid or running higher fan speeds.
GPU Testing Methodology
For our benchmarks today, we’re using a fully rebuilt GPU test bench for 2017. This is our first full set of GPUs for the year, giving us an opportunity to move to an i7-7700K platform that’s clocked higher than our old GPU test bed. For all the excitement that comes with a new GPU test bench and a clean slate to work with, we also lose some information: Our old GPU tests are completely incomparable to these results due to a new set of numbers, completely new testing methodology, new game settings, and new games being tested with. DOOM, for instance, now has a new test methodology behind it. We’ve moved to Ultra graphics settings with 0xAA and async enabled, also dropping OpenGL entirely in favor of Vulkan + more Dx12 tests.
We’ve also automated a significant portion of our testing at this point, reducing manual workload in favor of greater focus on analytics.
Driver version 378.78 (press-ready drivers for 1080 Ti, provided by nVidia) was used for all nVidia devices. Version 17.10.1030-B8 was used for AMD (press drivers).
A separate bench is used for game performance and for thermal performance.
Thermal Test Bench
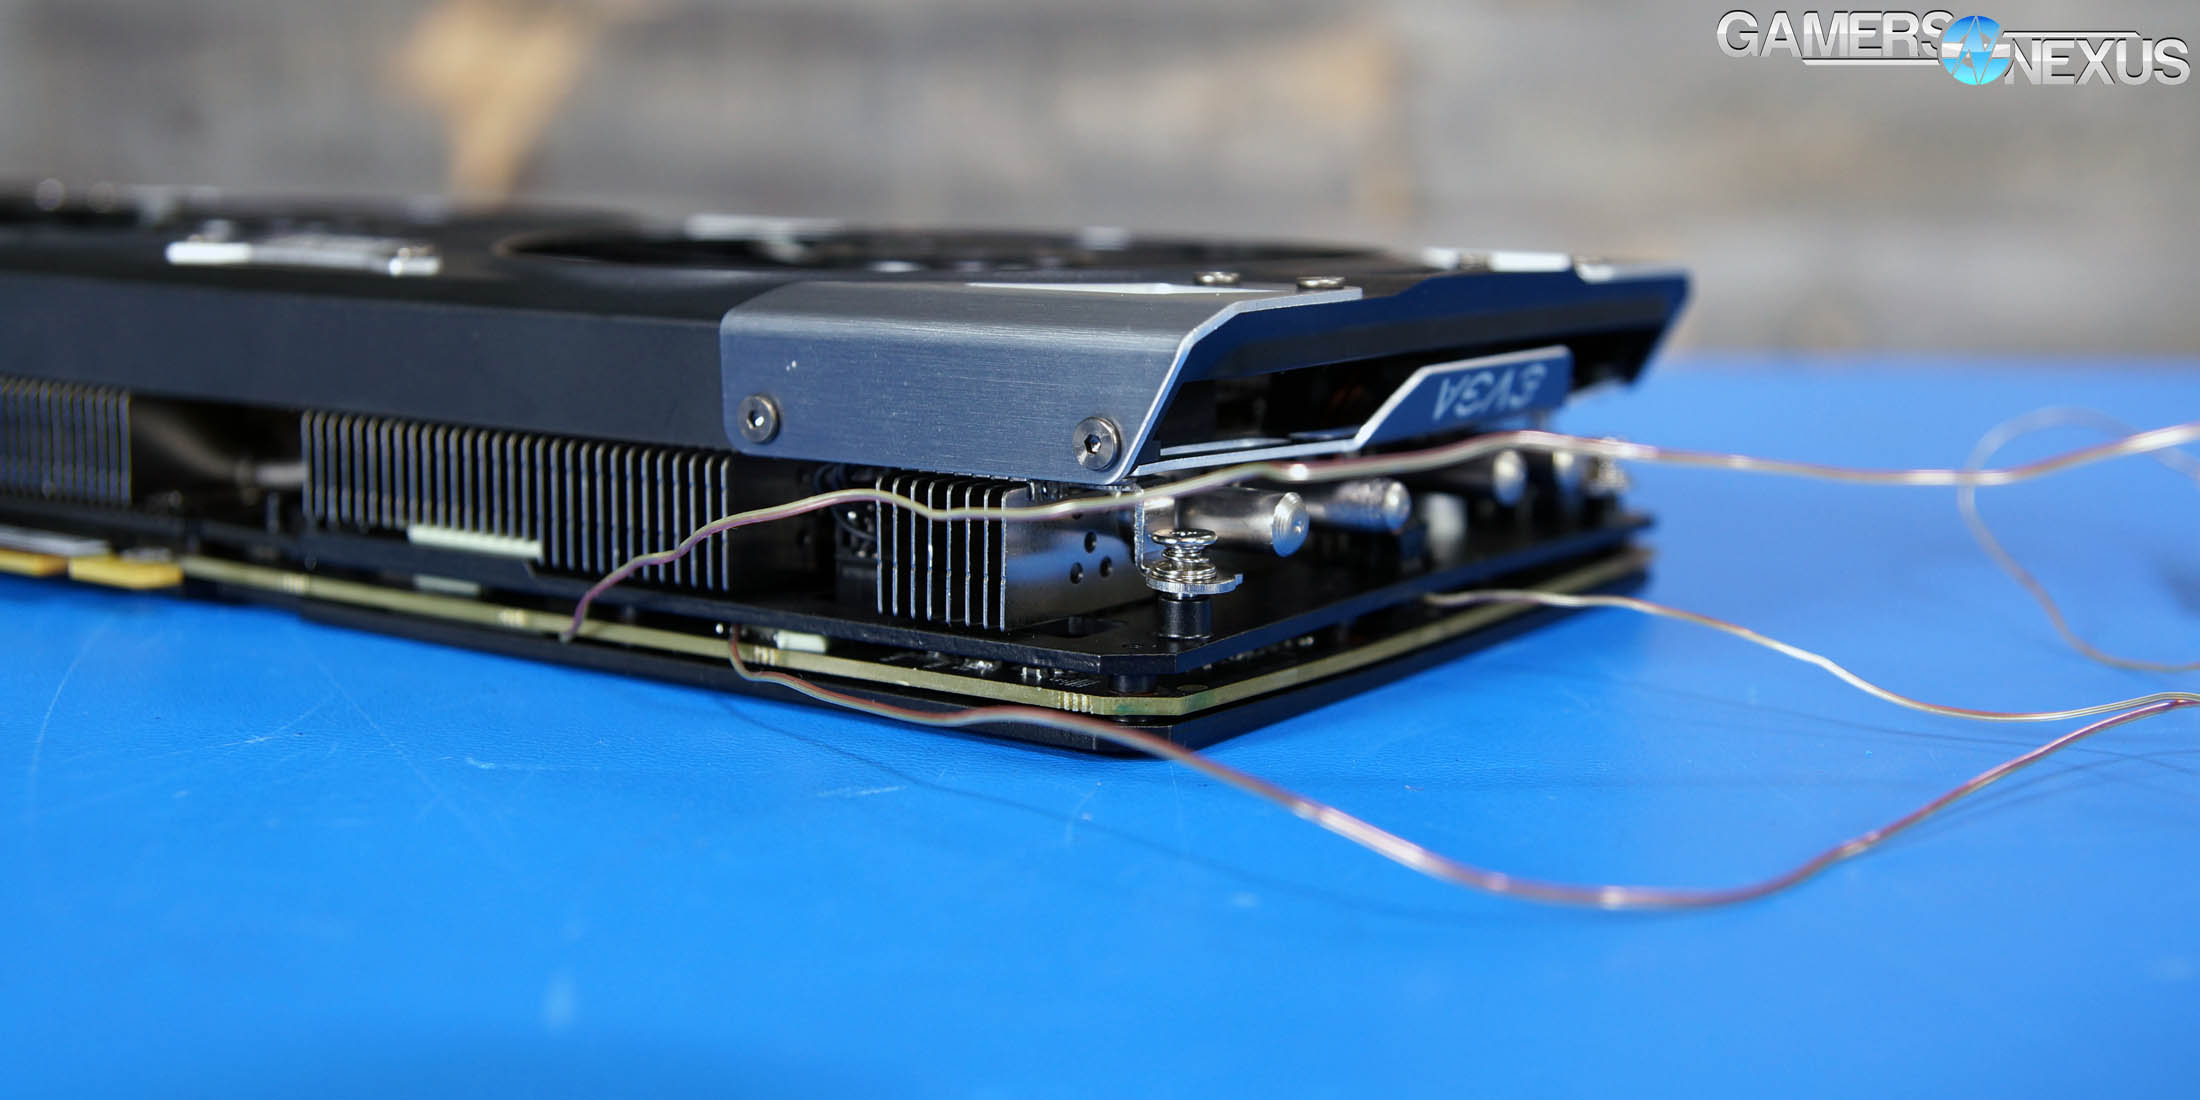
Our test methodology for the is largely parallel to our EVGA VRM final torture test that we published late last year. We use logging software to monitor the NTCs on EVGA’s ICX card, with our own calibrated thermocouples mounted to power components for non-ICX monitoring. Our thermocouples use an adhesive pad that is 1/100th of an inch thick, and does not interfere in any meaningful way with thermal transfer. The pad is a combination of polyimide and polymethylphenylsiloxane, and the thermocouple is a K-type hooked up to a logging meter. Calibration offsets are applied as necessary, with the exact same thermocouples used in the same spots for each test.
Torture testing used Kombustor's 'Furry Donut' testing, 3DMark, and a few games (to determine auto fan speeds under 'real' usage conditions, used later for noise level testing).
Our tests apply self-adhesive, 1/100th-inch thick (read: laser thin, does not cause "air gaps") K-type thermocouples directly to the rear-side of the PCB and to hotspot MOSFETs numbers 2 and 7 when counting from the bottom of the PCB. The thermocouples used are flat and are self-adhesive (from Omega), as recommended by thermal engineers in the industry -- including Bobby Kinstle of Corsair, whom we previously interviewed.
K-type thermocouples have a known range of approximately 2.2C. We calibrated our thermocouples by providing them an "ice bath," then providing them a boiling water bath. This provided us the information required to understand and adjust results appropriately.
Because we have concerns pertaining to thermal conductivity and impact of the thermocouple pad in its placement area, we selected the pads discussed above for uninterrupted performance of the cooler by the test equipment. Electrical conductivity is also a concern, as you don't want bare wire to cause an electrical short on the PCB. Fortunately, these thermocouples are not electrically conductive along the wire or placement pad, with the wire using a PTFE coating with a 30 AWG (~0.0100"⌀). The thermocouples are 914mm long and connect into our dual logging thermocouple readers, which then take second by second measurements of temperature. We also log ambient, and apply an ambient modifier where necessary to adjust test passes so that they are fair.
The response time of our thermocouples is 0.15s, with an accompanying resolution of 0.1C. The laminates arae fiberglass-reinforced polymer layers, with junction insulation comprised of polyimide and fiberglass. The thermocouples are rated for just under 200C, which is enough for any VRM testing (and if we go over that, something will probably blow, anyway).
To avoid EMI, we mostly guess-and-check placement of the thermocouples. EMI is caused by power plane PCBs and inductors. We were able to avoid electromagnetic interference by routing the thermocouple wiring right, toward the less populated half of the board, and then down. The cables exit the board near the PCI-e slot and avoid crossing inductors. This resulted in no observable/measurable EMI with regard to temperature readings.
We decided to deploy AIDA64 and GPU-Z to measure direct temperatures of the GPU and the CPU (becomes relevant during torture testing, when we dump the CPU radiator's heat straight into the VRM fan). In addition to this, logging of fan speeds, VID, vCore, and other aspects of power management were logged. We then use EVGA's custom Precision build to log the thermistor readings second by second, matched against and validated between our own thermocouples.
The primary test platform is detailed below:
| GN Test Bench 2015 | Name | Courtesy Of | Cost |
| Video Card | This is what we're testing | - | - |
| CPU | Intel i7-5930K CPU 3.8GHz | iBUYPOWER | $580 |
| Memory | Corsair Dominator 32GB 3200MHz | Corsair | $210 |
| Motherboard | EVGA X99 Classified | GamersNexus | $365 |
| Power Supply | NZXT 1200W HALE90 V2 | NZXT | $300 |
| SSD | OCZ ARC100 Crucial 1TB | Kingston Tech. | $130 |
| Case | Top Deck Tech Station | GamersNexus | $250 |
| CPU Cooler | Asetek 570LC | Asetek | - |
Note also that we swap test benches for the GPU thermal testing, using instead our "red" bench with three case fans -- only one is connected (directed at CPU area) -- and an elevated standoff for the 120mm fat radiator cooler from Asetek (for the CPU) with Gentle Typhoon fan at max RPM. This is elevated out of airflow pathways for the GPU, and is irrelevant to testing -- but we're detailing it for our own notes in the future.
Game Bench
| GN Test Bench 2017 | Name | Courtesy Of | Cost |
| Video Card | This is what we're testing | - | - |
| CPU | Intel i7-7700K 4.5GHz locked | GamersNexus | $330 |
| Memory | GSkill Trident Z 3200MHz C14 | Gskill | - |
| Motherboard | Gigabyte Aorus Gaming 7 Z270X | Gigabyte | $240 |
| Power Supply | NZXT 1200W HALE90 V2 | NZXT | $300 |
| SSD | Plextor M7V Crucial 1TB | GamersNexus | - |
| Case | Top Deck Tech Station | GamersNexus | $250 |
| CPU Cooler | Asetek 570LC | Asetek | - |
BIOS settings include C-states completely disabled with the CPU locked to 4.5GHz at 1.32 vCore. Memory is at XMP1.
We communicated with both AMD and nVidia about the new titles on the bench, and gave each company the opportunity to ‘vote’ for a title they’d like to see us add. We figure this will help even out some of the game biases that exist. AMD doesn’t make a big showing today, but will soon. We are testing:
- Ghost Recon: Wildlands (built-in bench, Very High; recommended by nVidia)
- Sniper Elite 4 (High, Async, Dx12; recommended by AMD)
- For Honor (Extreme, manual bench as built-in is unrealistically abusive)
- Ashes of the Singularity (GPU-focused, High, Dx12)
- DOOM (Vulkan, Ultra, 0xAA, Async)
Synthetics:
- 3DMark FireStrike
- 3DMark FireStrike Extreme
- 3DMark FireStrike Ultra
- 3DMark TimeSpy
For measurement tools, we’re using PresentMon for Dx12/Vulkan titles and FRAPS for Dx11 titles. OnPresent is the preferred output for us, which is then fed through our own script to calculate 1% low and 0.1% low metrics (defined here).
Power testing is taken at the wall. One case fan is connected, both SSDs, and the system is otherwise left in the "Game Bench" configuration.
Continue to Page 2 for Thermals, Noise, & Conclusion.
ASUS Strix 1080 Ti Frequency vs. Temperature
Our first chart is a simple one. We’re plotting temperature and frequency under a power virus scenario, which helps us better understand thermal performance, fan performance, and frequency performance under a VRM torture scenario.
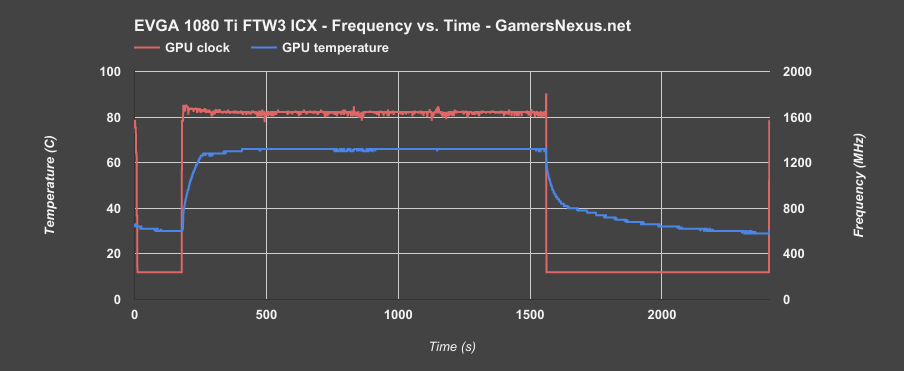
As the GPU approaches 55-60C, the stock profile dictates that the fans kick-in and start ramping-up to match temperature. The GPU frequency fluctuates more heavily with this card than with the FTW3. We saw a frequency range of approximately 62MHz on the EVGA FTW3 ($780) and a range of about 152MHz on the ROG Strix ($780). Some of this can be credited to chip-to-chip manufacturing tolerances and variance. We do not have a large enough sample size of the Strix to be sure.
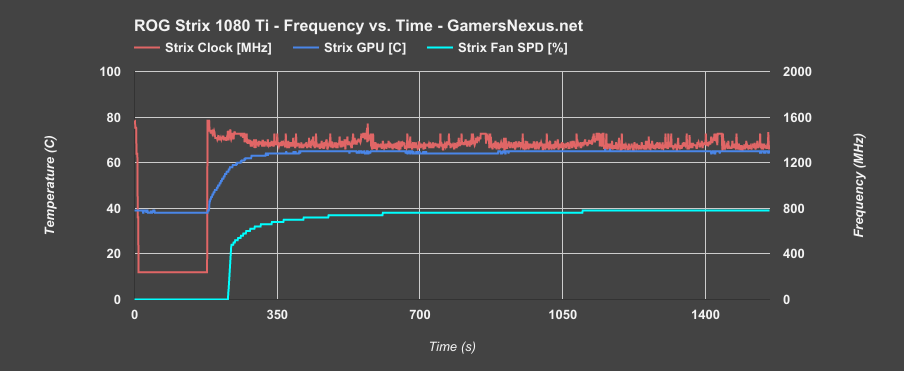
Regardless, the card’s temperature target seems to be 65C, at which point the fans are spinning at 1400RPM on our bench. We’ll look at fixed-noise temperature performance in a bit.
ASUS ROG Strix 1080 Ti Component Temperatures
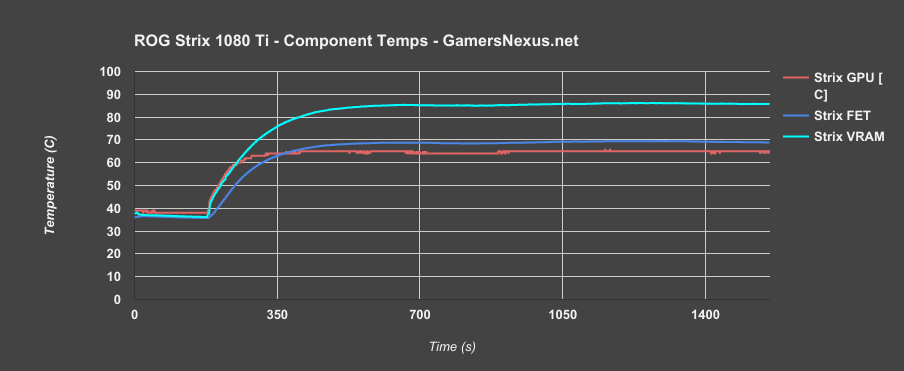
Moving on, our next chart shows individual component temperatures for the ASUS 1080 Ti Strix card when under auto cooling conditions. We measure the power components around the center of the VRM, as that’s the hottest location. The MOSFET temperature reading spits out at around 68-69C, which is well within any reasonable MOSFET spec. Most FETs can take 125C and beyond, so this one’s no problem. So far, we’re cooler than the Gigabyte Xtreme power components.
VRAM is a bit on the warm side, but still well within spec. We’re looking at around 85-87C for the hottest VRAM module, sandwiched between the GPU and the capacitor bank for the VRM.
ASUS ROG Strix Temperatures vs. EVGA FTW3, Gaming X, Xtreme Aorus

Let’s move on to some comparative benchmarks. This first chart shows GPU diode and power component temperatures with auto settings. We’ll look at fixed 40dBA tests next.
The ASUS 1080 Ti ROG Strix card targets a 65C GPU diode temperature, putting it nearly equal with EVGA’s FTW3 66C target, cooler than the SC2, cooler than the Gigabyte Xtreme by a considerable 7C, and cooler than the Gaming X by a few degrees.
Looking at power component temperatures, EVGA’s FTW3 still reigns king in this department – entirely thanks to its overbuilt heatsink and asynchronous fans – with ASUS landing middle of the pack. The only real takeaway here is that Gigabyte’s card is the least impressive when looking at out-of-box thermals.
Normalizing for 40dBA Output: Best GPU Cooler Testing
There are some challenges with this approach to testing. To “normalize” for a fixed noise output means we must fairly achieve that noise level on all tested devices. We use a passive test platform for finding the correct fan RPM to meet a 40dBA measurement (noise floor is ~26dBA), then guess/check fan RPMs until our reading is 40dBA @ 20”, +/- 0.3dBA.
EVGA’s asynchronous cooling makes things complicated, though. With cards that use a fixed fan speed across all three fans, it’s a straight-forward process: Find the output, set the fan speed, run the test. For EVGA, we have a choice as to how we achieve that dBA output – we can increase GPU fan, decrease MEM fan and PWR fan, or we can do a balance of all of them, or we can run higher MEM + GPU fans and a very low PWR fan. There are lots of options. For our initial testing, we ran the FTW3 with proportional fan speeds to what we typically see in real workloads with EVGA’s default profile (54%/40%/40%).
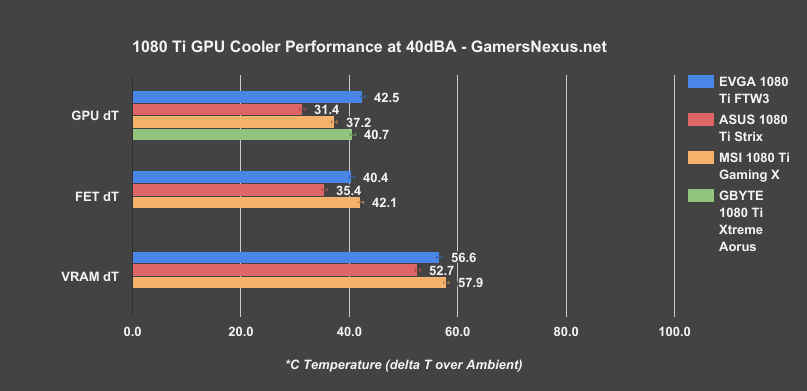
With fan speeds configured to a fixed 40dBA output, we finally start to see some distinction between these AIB partner cards. The other cards are all-or-nothing fan speeds, making them easier. ASUS is impressive, here: The ROG Strix runs cooler on the GPU, producing a 31.4C delta T over ambient value, which is a full 6C cooler than the next closest card – the Gaming X. The Gaming X has generally been one of the quietest cards on our bench. That card has now been dethroned by ASUS.
Next, the Gigabyte Xtreme Aorus, which doesn’t look great when these are all tested at stock speeds, is running 40.7C delta T. The FTW3 is last, but again, it is the most difficult to configure. You could get these temperatures lower and sacrifice other component temperatures, if so desired.
Power temperatures measured on the middle MOSFET, offset up, land the Strix again at the lead, with a 35.4C delta T measurement. EVGA’s FTW3 is the coolest for VRM components when all cards are configured to auto, but loses ground to ASUS here with its 40.4C delta T value, with MSI trailing at 42.1C delta T.
Finally, the VRAM module between the GPU and VRM measures at 52.7C delta T on the ASUS Strix card, where EVGA runs a 56.6C VRAM temperature, trailed by MSI at 57.9C.
With these noise-equalized tests, ASUS is the clear victor – and not in an insignificant way, in the GPU test. We’re excited about this new test procedure and will be rapidly expanding it for future reviews. It only really works when we’ve got a bunch of the same card, as comparing these numbers between multiple GPUs wouldn’t really make much sense. Still, we’ll play around with it as content continues to ramp.
Strix ROG 1080 Ti Noise Testing @ Auto, 50%, Idle
Let’s look at our older noise chart.
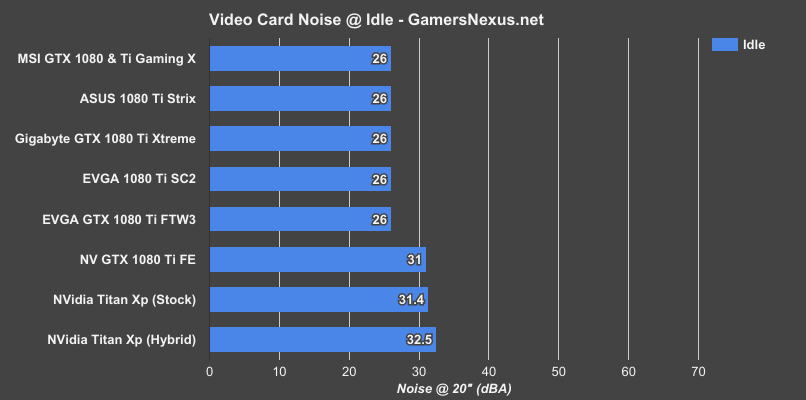
Under idle conditions, the ASUS Strix makes no noise, and so we see our noise floor for the test environment. The Strix card’s fans spin down when under no load, as do the fans of the SC2, FTW3 with BIOS2, Gaming X, and Xtreme Aorus.
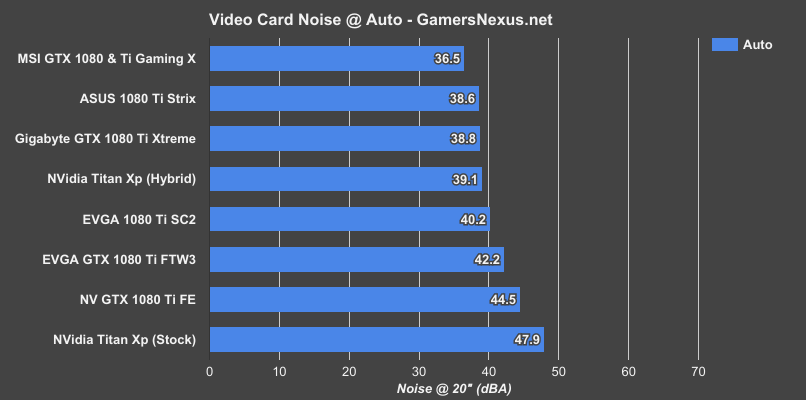
When left to their own devices, the Strix is the second quietest card, with the Gaming X holding on to the quietest rank. The Strix pushes about 38.6dBA when under an auto fan curve, so it’s spinning slower than in our aforementioned 40dBA test. This plants it roughly tied with the Xtreme Aorus card, and perceptibly quieter than the FTW3 card with auto fan speeds. To be fair to EVGA, though, the FTW3 is a dual-slot card – not many others can claim that at this time.
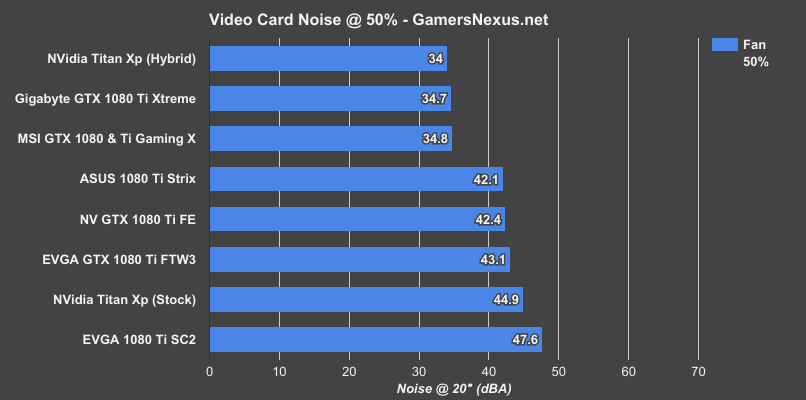
At 50% fan speeds, the 1080 Ti Xtreme and Gaming X cards are roughly tied, with the Strix, FTW3, and FE roughly tied. All three are noticeably louder than the Xtreme and Gaming X. The SC2 is more than 2x louder than the Gaming X in perceived noise output, as this is a logarithmic scale. This number isn’t all that useful, though, since you’re either running the coolers under auto conditions or under fixed fan curves.
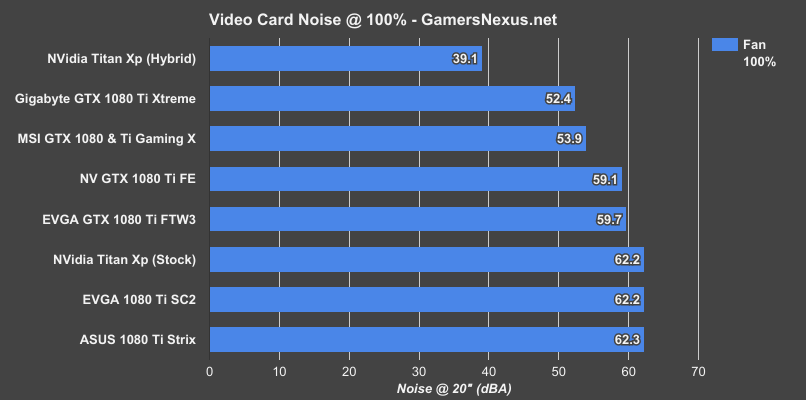
We also have a chart of noise at 100%, just to provide perspective. Your fans will never realistically reach a 100% fan speed, as the cards would rather sacrifice frequency than push decibel levels this high.
At 100% fan speed, the Strix is among the loudest three cards on the bench, including the SC2 and Titan Xp. All this really means is that ASUS allows its fans to go faster than the others, combined with acoustics of the cooling solution.
If you’re using your card out-of-box, with no changes whatsoever, auto settings are the acoustics you can expect. ASUS has one of the most efficient coolers we’ve tested thus far, shown by the thermal performance overall and by the 40dBA normalized charts.
Gaming Tests: The Least Important Aspect
As stated heavily in the video version of this review, gaming tests lose their value once we’ve established a baseline for performance for the 1080 Ti. They’re all about the same, +/- small percentages on either side. Most of the differences are in chip quality, not in actual PCB/cooler quality. There are exceptions – but not with these high-end contenders.
Anyway, let’s get a few gaming tests in there just for validation.
| Peak Clock (MHz) | AVG Clock (MHz) | Core Offset (MHz) | MEM CLK (MHz) | MEM Offset (MHz) | Power Target | Voltage | Pass/Fail |
| 1974 | 1949 | 0 | 1377 | 0 | 100 | 1.012 | P |
| 1987 | 1974 | 0 | 1377 | 0 | 100 | 1.05 | P |
| 2000 | 2000 | 50 | 1377 | 0 | 120 | 1.043 | P |
| 2025 | 2012 | 75 | 1377 | 0 | 120 | 1.043 | P |
| 2038 | - | 100 | 1377 | 0 | 120 | 1.043 | F |
| 2025 | 2012 | 75 | 1501 | 500 | 120 | 1.043 | P |
Ghost Recon: Wildlands – 4K

Not much difference between the cards – not enough to speak of, anyway. They’re all roughly the same when stock, +/- 3%, with the only routinely noticeable gain being against the FE card (unless you remove its thermal limit).
Mass Effect: Andromeda – 4K
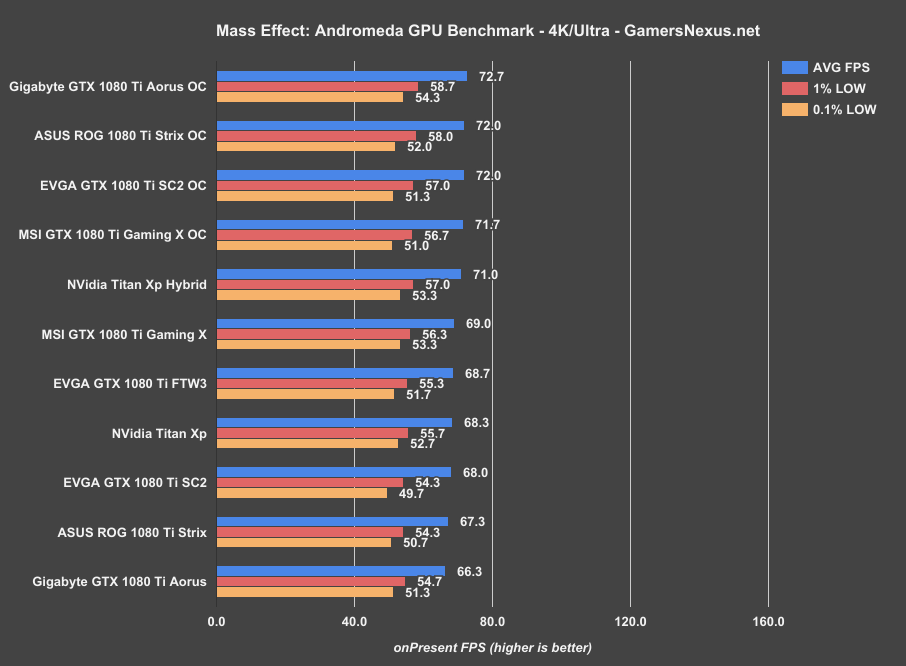
More of the same. These 1080 Ti cards all perform effectively equally.
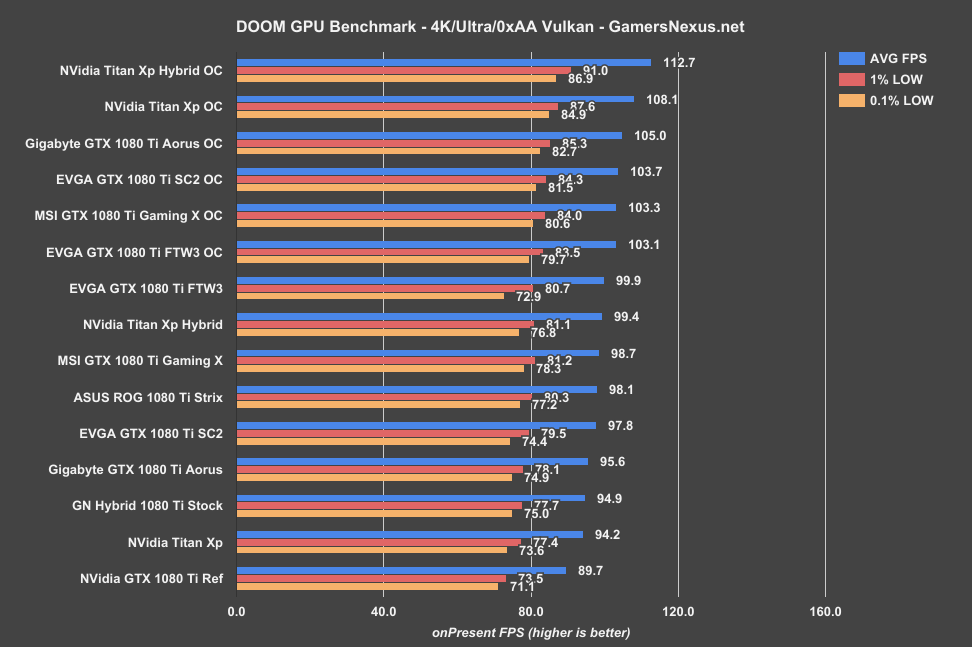
DOOM (Vulkan) – 4K
Conclusion
Like the EVGA GTX 1080 Ti FTW3, this card is a tough sell at $780. Also like the FTW3, it’s a well-engineered card with superior build quality to many of the cheaper options on the market. If you’re buying just for gaming performance, though, you’re in for a disappointment with Pascal – they’re all roughly the same, once accounting for poor PCB and cooling designs (read: entering $720+ range).
But noise and thermals are where these cards make their differences. ASUS’ distinction is in our normalized 40dBA test, where the card’s solution is clearly superior to nearby competitors. The ROG Strix cooler bests EVGA and MSI in cooling performance for the GPU, VRAM, and MOSFET temperatures we collected. We are confident in stating that ASUS’ cooler design reigns supreme when normalizing for a 40dBA output. EVGA still has the most interesting features – ICX is tough to beat, and made huge strides to further the industry’s understanding of what makes a GPU cooler unique (primarily by way of thermistors). The Gaming X remains quietest under auto conditions, in our tests. The Xtreme Aorus card gets increasingly difficult to justify, it turns out, as we test more of these alternatives.
ASUS does deserve praise for its cooler’s efficiency. They keep all measured components cool while running a low noise emission fan setting. It’s not going to make your gaming better if FPS is all that matters, but it’ll make it quieter.
Whether or not it’s worth an extra $30 for the thermal and noise performance – that’s largely up to the buyer. We think most people would be perfectly happy with a ~$720-$750 GPU purchase, like the SC2, Gaming X, or potential alternative ASUS options in the future.
Editor-in-Chief: Steve Burke
Video Producer: Andrew Coleman