The launch of Threadripper marks a move closer to AMD’s starting point for the Zen architecture. Contrary to popular belief, AMD did not start its plans with desktop Ryzen and then glue modules together until Epyc was created; no, instead, the company started with an MCM CPU more similar to Epyc, then worked its way down to Ryzen desktop CPUs. Threadripper is the fruition of this MCM design on the HEDT side, and benefits from months of maturation for both the platform and AMD’s support teams. Ryzen was rushed in its weeks leading to launch, which showed in both communication clarity and platform support in the early days. Finally, as things smoothed-over and AMD resolved many of its communication and platform issues, Threadripper became advantaged in its receipt of these improvements.
“Everything we learned with AM4 went into Threadripper,” one of AMD’s representatives told us, and that became clear as we continued to work on the platform. During the test process for Threadripper, work felt considerably more streamlined and remarkably free of the validation issues that had once plagued Ryzen. The fact that we were able to instantly boot to 3200MHz (and 3600MHz) memory gave hope that Threadripper would, in fact, be the benefactor of Ryzen’s learning pains.
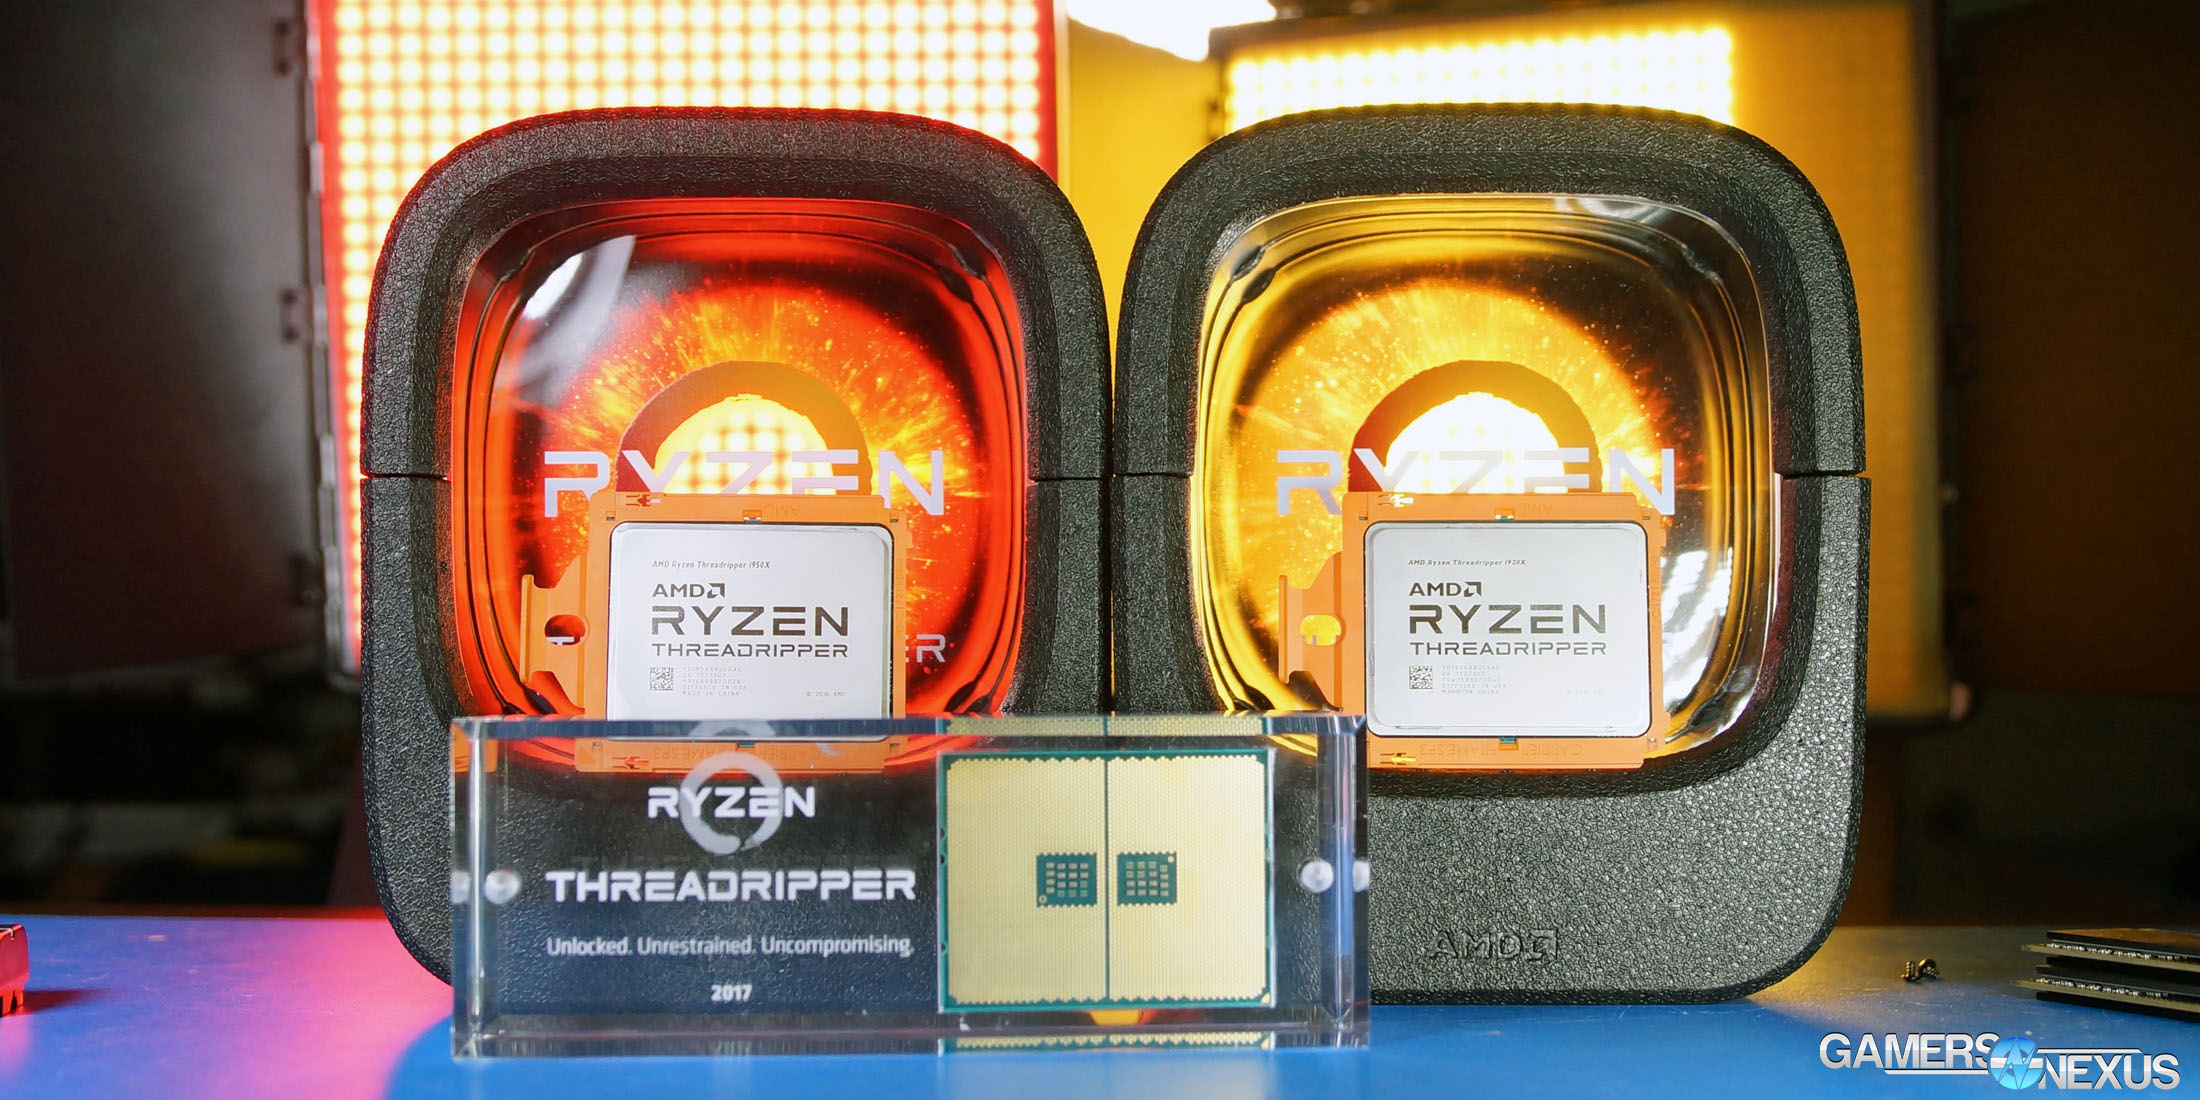
Threadripper will ship in three immediate SKUs:
- 16C/32T 1950X
- 12C/24T 1920X
- 8C/16T 1900X
Respectively, these units are targeted at price-points of $1000, $800, and $550, making them direct competitors to Intel’s new Skylake-X family of CPUs. The i9-7900X would be the flagship – for now, anyway – that’s being more heavily challenged by AMD’s Threadripper HEDT CPUs. Today's review looks at the AMD Threadripper 1950X and 1920X CPUs in livestreaming benchmarks, Blender, Premiere, power consumption, temperatures, gaming, and more.
A Note on Overclocking & Memory Access
AMD’s done well with XFR on the Threadripper CPUs. Because of this multi-die configuration, Threadripper is able to engage XFR on up to four cores simultaneously, boosting +200MHz over base. The result is a possible 4.2GHz speed on 4C for Threadripper, which consequently proves itself most beneficial in lightly threaded applications. A game might be a good example of such an application. Because we were unable to overclock beyond 4.2GHz XFR (maxing out at 4.0GHz all-core OC), some overclocking numbers will be lower than the stock configuration. This is true for any application which better makes use of XFR than our overridden all-core clock configuration.
Per-core overclocking is not available on Threadripper, and won’t be. Overclocking can be done in core pairs, with OC expectations similar to Ryzen. AMD noted that the Threadripper CPUs consist of the top 5% of presorted Ryzen dies (though later changed this number to 2%, depending on who was talking). The performance headroom is leveraged already in Threadripper’s relatively high frequency, particularly considering core count, though there’s some room for play for overclockers. An XOC team at the AMD event was able to push the 1950X to 5.2GHz on 1.6V, using LN2 as the cooling solution. Expect in the 4.0 to 4.2GHz range for more traditional modes of cooling.
There are also two memory access modes, here: Distributed and local, also known as UMA (Uniform Memory Access) and NUMA (Non-Uniform Memory Access). Distributed is the default mode and tends to work best for content creation tasks, as UMA isn’t restricted to one die and allows the scheduler to do whatever it wants. NUMA tends to be better in some games, but restricts a workload to 1 die and the memory attached to that one die. Creative applications, meanwhile, minimize thread sharing and synchronization between cores, so they’re not that latency intensive. Gaming applications care a lot about latency and synchronization; you might be synchronizing the physics and game logic threads with AI, for instances, and so NUMA tends to be better in these use cases. Threadripper hosts two separate memory controllers, working to support quad-channel memory on the board. For reference, we were able to get 3200MHz working with no effort, and managed 3600MHz with some trivial amount of effort (both GSkill kits). The 3600MHz kit was used for stream benchmarking on both the 7900X and 1950X.
As an aside, cores 0-15 are located on the first die of the CPU, with cores 16-31 on the second die. Each Threadripper CPU consists of four total pieces of silicon under the IHS, two of which are active. AMD tells us that the same two dies are active each time in Threadripper, something that we later looked into with thermal imaging of our 1950X & 1920X. We do not have a large enough sample size to conclude that AMD’s statement is accurate, but hopefully some other media members have also checked their CPUs. For our units, we determined that, orange pull tab oriented down, the top-left and bottom-right corners of the CPU are the active dies. The other two units appear to be deactivated or dead, depending. AMD claims that these are silicon substrate interposers that are instituted for mechanical mounting reasons, though it is still entirely possible that they’re actually just Epyc CPUs which have been pushed as Threadripper.
Test Procedure
Learn more about our stream testing here (part 1) and here (part 2). The rest is discussed on the next page, where we define differences for today.
Game settings were manually controlled for the DUT. All games were run at presets defined in their respective charts. All other game settings are defined in respective game benchmarks, which we publish separately from GPU and CPU reviews.
Average FPS, 1% low, and 0.1% low times are measured. We do not report maximum or minimum FPS results as we consider these numbers to be pure outliers. Instead, we take an average of the lowest 1% of results (1% low) to show real-world, noticeable dips; we then take an average of the lowest 0.1% of results for severe spikes. GN originally coined the phrases “1% LOWs” and “0.1% LOWs” for these metrics.
Note: fan and pump settings are configured on a per-test basis.
X399 Platform:
- ASUS Zenith Extreme X399
- 32GB 3200MHz GSkill RGB Memory
- EXCEPT: Streaming benchmarks conducted with 3600MHz GSkill Trident Z Black memory (this is also used on the X299 platform for streaming benchmarks)
X299 Platform:
- Gigabyte Gaming 9 X299
- 32GB 3200MHz GSkill Trident Z Black Memory
- EXCEPT: Streaming benchmarks conducted with 3600MHz GSkill Trident Z Black
X58 Platform:
EVGA Supernova 750 G2L 80+ Gold
HyperX Savage 32GB 2400MHz (4x8GB)
Corsair Force LE 240GB SSD
Open Air Test Bench
Kraken X62
EVGA GeForce GTX 1080 FTW
970 (RD9x0) Platform:
-ASUS 970 PRO GAMING/AURA
-Phenom II X6 1055T (125W TDP)
-Phenom II X6 1090T
Core Components (Unchanging)
- NZXT 1200W Hale90v2
- For DDR4 platforms: Corsair Vengeance LPX 32GB 3200MHz
- For DDR3 platforms: HyperX Savage 32GB 2400MHz (note: only 2133MHz was supported on our SNB platform)
- Intel 730 480GB SSD
- Open Air Test Bench
- Cooler #1 (Air): Be Quiet! Dark Rock 3
- Cooler #2 (Cheap liquid): Asetek 570LC w/ Gentle Typhoon fan (this is the one we used for this particular article)
- Cooler #3 (High-end): Kraken X62
- Video Card: EVGA GTX 1080 FTW1
- Note: fan and pump settings are configured on a per-test basis.
Z270 Platforms:
- MSI Gaming Pro Carbon
- i7-7700K (x2) samples from motherboard vendors
- i5-7600K purchased by GN
Z170 Platform:
- MSI Gaming M7
- i7-6700K retail
- i5-6600K
Z97 Platform:
- Gigabyte Z97X G1 WIFI-BK
- i7-4790K
- i5-4690K
Z77 Platform:
- MSI GD65 Z77
- i7-2600K
- i5-2500K
- i5 3570K
AM4 platform:
- ASUS Crosshair VI
Dx12 games are benchmarked using PresentMon onPresent, with further data analysis from GN-made tools.
X58 Platform:
- ASUS Deluxe Pro X58
BIOS 0305 was used on the Zenith Extreme.
Continue to the next page for streaming & gaming benchmarks.
Streaming & Gaming Benchmarks
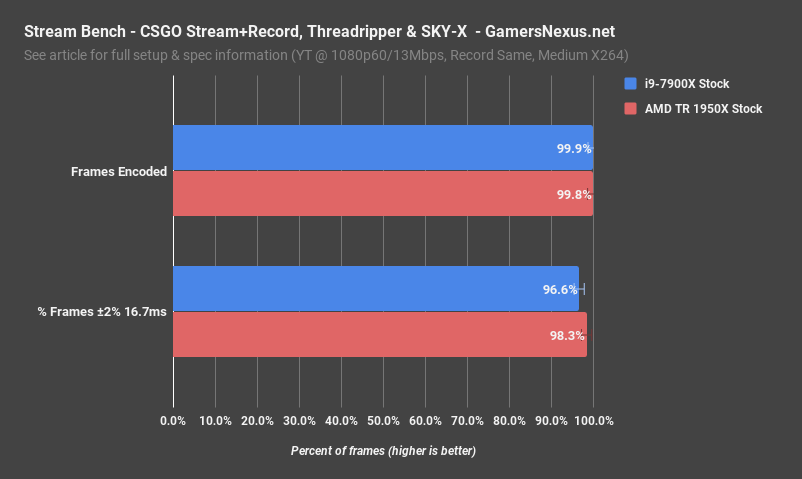
We again modified our stream benchmarking tests for this review. We started out our streaming benchmarks with just a single stream output to YouTube at 1080p60 – more info on the settings in a moment – and found that, unsurprisingly, neither the 7900X nor the 1950X had any trouble. To be fair, the 1700 also has no trouble with this. Both HEDT CPUs delivered 100% of their frames to the stream with no stress at all, and so we needed to increase load. One such way was to broadcast while simultaneously recording, using OBS for H264 encoding for both tasks. Using the “faster” preset, we still found that neither CPU became burdened to a point of showing differences. The next addition was increasing encoding difficulty to the “medium” preset, then streaming at 13Mbps and encoding at the same bit-rate while simultaneously recording to the disk.
Ultimately, it proved difficult to find the breaking point of either the 7900X or 1950X for this type of workload. One surely exists, it’s just a matter of what’s required to meet the point of failure.
Dual-Streaming: DOTA2 to YouTube & Twitch
First up, our simultaneous streaming of DOTA2 to YouTube and Twitch provides a look at H264 “Faster” dual-stream encoding at 1080p60. The YouTube bit-rate runs at 10Mbps, followed by Twitch at 4Mbps bit-ratae. These outputs cover all the bases of the most common stream setups.
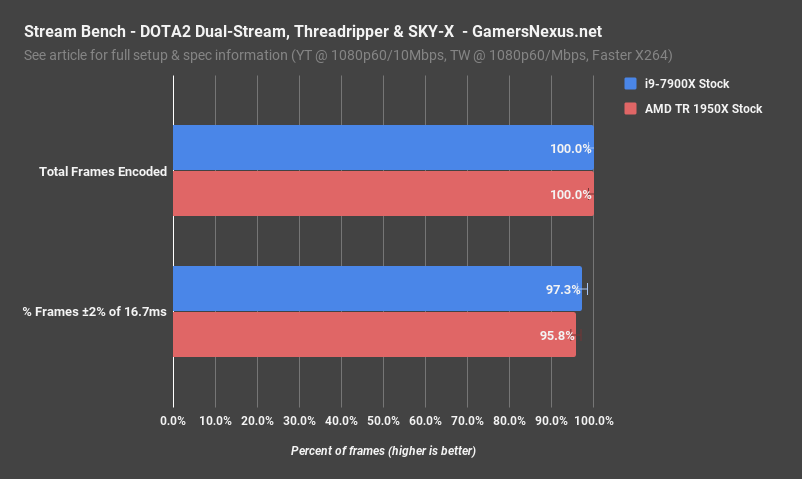
As seen here, even with this non-trivial load, we drop effectively 0% of the frames on all tested devices. We’ll look at the 1920X in the near future, though it’d be fair to assume that would perform about the same, given where the 10C and 16C parts land. As far as the viewer’s experience is concerned, both these CPUs output effectively a perfect 60FPS to two streaming services simultaneously.
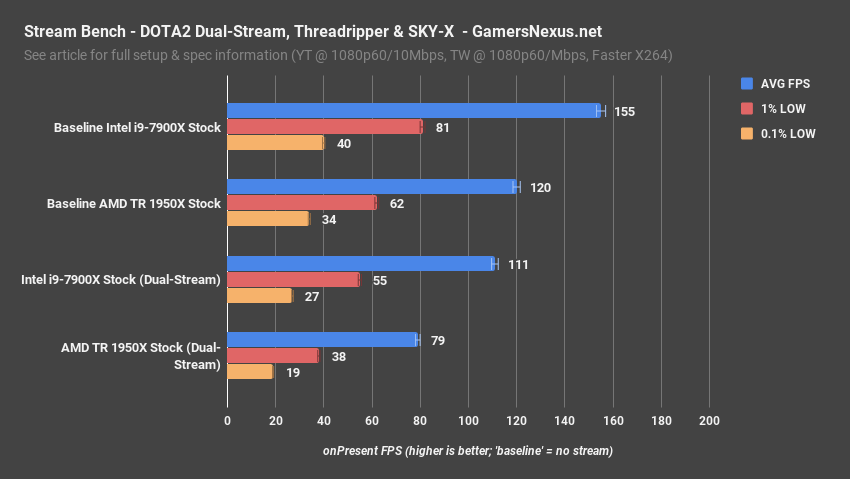
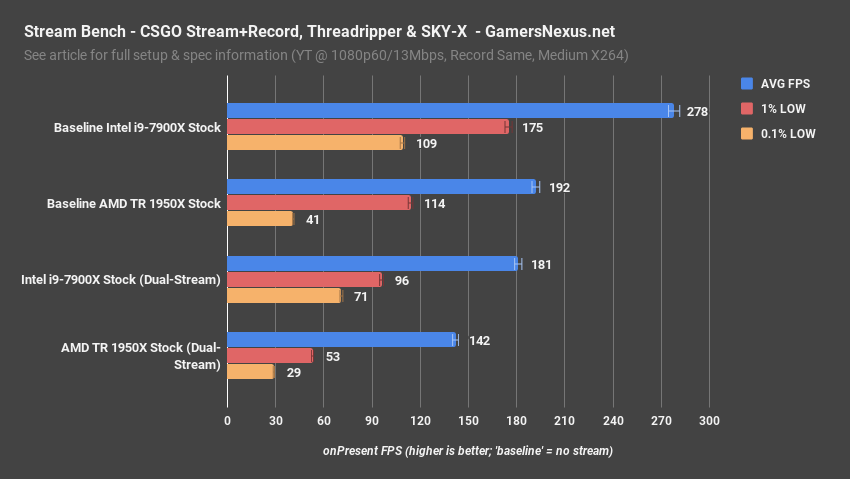
Here’s a look at the FPS output to the player, now that we know the viewer experience is good. When dual-streaming, the 1950X manages 79FPS AVG to the player, though dips somewhat in frametimes toward the 1% and 0.1% slowest frametimes. The 7900X performs well ahead here, but we also know that DOTA2 does tend to favor Intel parts. Regardless, Threadripper is hanging on plenty well and could be tuned for better performance, if really needed. Ultimately, if you wanted extreme framerates and consistent frametimes anyway, it’s probably best to just build a separate capture box to offload work. Both still do well here, though the 7900X is outperforming the 1950X in player-side framerates significantly. There’s more to this story than just frames, as always: The two CPUs are tied in viewer-side output, so we now seek tie-breakers. By running thermal and power monitoring while running the streaming benchmarks, we’re able to determine which CPU completes its task most efficiently.
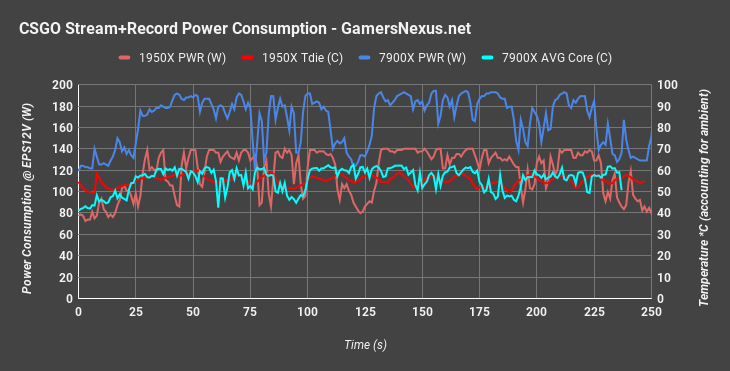
During the CSGO record & stream test with medium encoding speed, the i9-7900X was consuming 193W at the EPS12V rails when under averaged peak conditions. The Threadripper 1950X consumed about 134-140W averaged peak power. The 7900X does outperform the 1950X in player-side framerate, but the 1950X competes at 27% lower power consumption and with equivalent viewer-side output.
During this synchronized CSGO workload, we see the 7900X ramping up to an averaged peak core temperature of 62C, with the 1950X around 57C on average. Ambient is accounted for in these measurements. Not a huge difference, particularly when considering that TjMax is different for each CPU.
There’s plenty more that can be done here – all manner of affinities and process prioritization can be done to improve streaming performance, but it’s just not necessary. Both of these CPUs handle intense dual-stream and stream+record scenarios well (though you’d still get best frametimes with an external box, not everyone needs that). Intel does handily outperform AMD in player-side FPS with these two particular titles, but please be aware that this isn’t the full story. Both games are made by Valve – DOTA2 & CSGO – and tend to perform well with Intel’s higher IPC. This stated, we tried to use DiRT Rally (as this was already a part of our test suite), but found that it is one of the very few titles that refuses to launch on Threadripper. DiRT just doesn’t know what to do with the cores, and so crashes instantly. Disabling cores resolves that, but then we’re not really comparing the processors directly anymore.
Our video discusses this series of results more articulately in some places – we’d encourage watching that first benchmark section for details on the stream benchmarking. In order to really start provoking differences between these CPUs, we’d probably have to start doing some crazy workloads – dual-streaming while rendering a Blender output, for instance.
Total War: Warhammer - TR 1950X & 1920X Benchmarks
If you skipped the part earlier where we talked about how overclocking and cores impact games, now’s a good time to go back and read. Should save a few confused comments.
We’ll walk through a handful of game benchmarks next. Again, as this is an HEDT platform, we’re more interested in the X399 configurations from the standpoint of gaming while streaming – but we always look at just gaming, too, it’s just not weighted as much for HEDT.
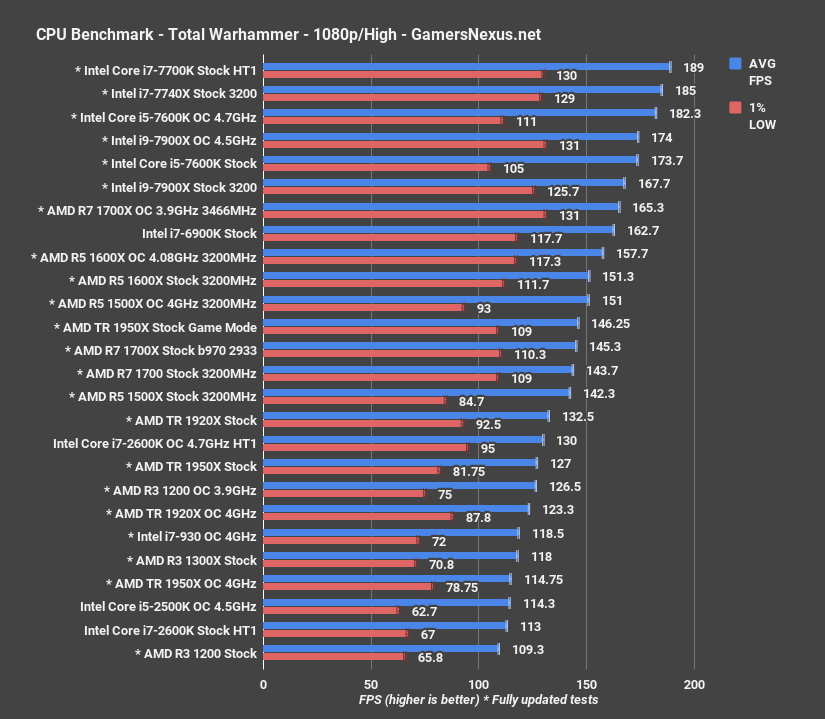
AMD’s Threadripper CPUs benefit in Total War: Warhammer from game mode, which requires a reboot and disables half the cores, then switches the memory mode to Local from distributed. Stock, with distributed memory and 16C, the 1950X operates an AVG FPS of around 127, with lows at 82FPS and 42.8FPS. Rebooting with Local memory access and half the cores enabled, we operate instead at a significantly boosted 146FPS AVG, with lows also significantly boosted to 109FPS 1% LOW and 68FPS 0.1% LOW, up about 20FPS for each category. The AVG FPS bump is about 15% with game mode in this particular title.
Here's where it gets interesting: Notice that the all-core 4GHz overclock, which overrides XFR and other features, is performing noticeably worse than the stock configuration. This is partly because of XFR, which occasionally boosts threads to frequencies between 4.1 and 4.2GHz. AMD’s done well with XFR here: the range has expanded significantly, now at +200MHz over boost, and it functions well enough that it’d actually be worse to overclock in some games and applications; that is, unless you can overclock to 4.2GHz or higher.
As for the 1920X, we’re seeing competitive performance with the 1950X largely because the game doesn’t understand what a 16C CPU is -- or what the hell to do with it. 12C CPUs have existed in some consumer-ready capacity before, which we think may benefit the 1920X in some titles.
Comparatively, the 7900X stock CPU operates a 168FPS AVG with 70FPS 0.1% low values, and so is significantly boosted over the 1950X in this particular workload. 1440p won’t change this scaling much unless running something very graphics-intensive, but 4K will; if gaming on higher resolutions, the performance gap somewhat minimizes – though games that don’t understand the threads will still need gaming mode to resolve frame latency issues, even at higher resolutions. As usual, though, none of these HEDT CPUs are good value for gaming. You’re way better off with an R5 1600 or i7-7700K for something like this – but those won’t handle the workstation tasks nearly as well.
GTA V – TR 1950X & 1920X, 7900X Benchmarks
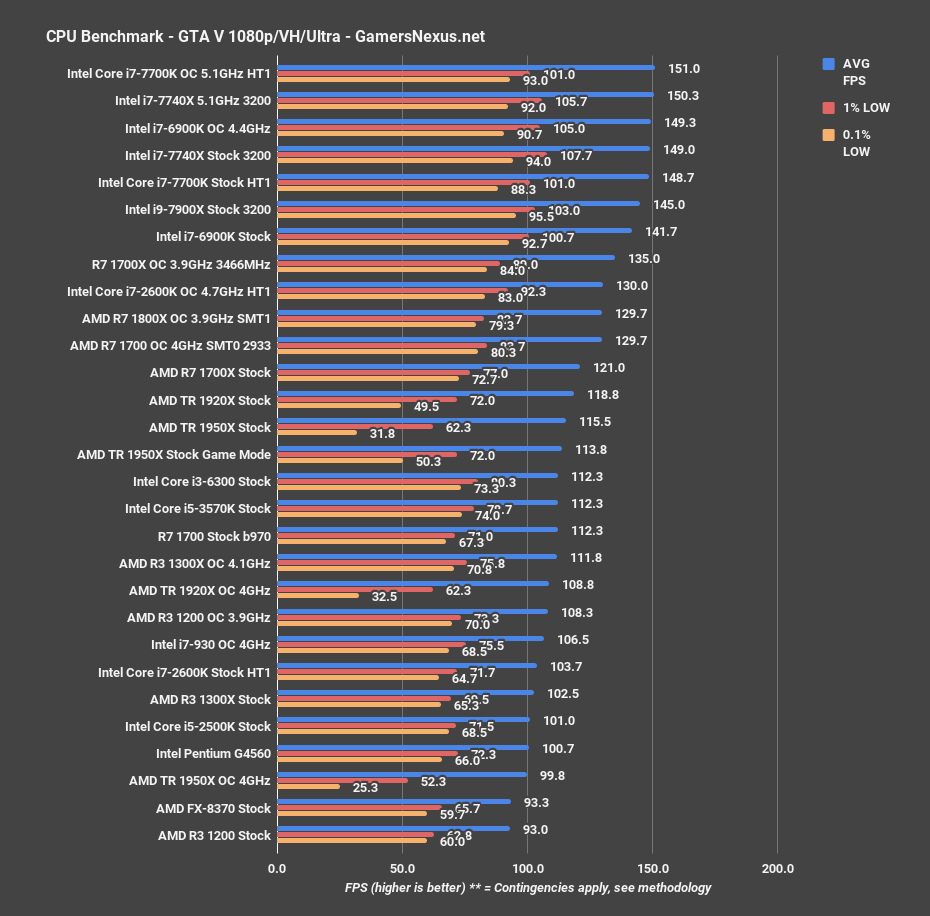
GTA V is our next title, and posts an AVG FPS of 116 for the 1950X Stock CPU, with 1% lows at 62FPS and 0.1% low frametimes calculating to 32FPS. These low-end frametime performance metrics are pretty damn bad, and that’s because the game doesn’t quite know what to do with the CPU. The frametimes are inconsistent enough that we’re experiencing visible stuttering, to a point where it’s not a pleasant gaming experience. Fortunately, enabling the “gaming mode” toggle in Ryzen Master helps resolve this issue. Game mode brings up the worst 0.1% of frametimes to about 50FPS, effectively eliminating most the visible stuttering or hitching. AVG is roughly the same. The 1920X stock CPU isn’t affected in the same way, given its lower core count, and so enjoys the benefit of a 50FPS 0.1% low out of box, with averages proportionately higher overall. Overclocking, once again, serves only to bring down our performance as we lose XFR, other automatic frequency controls, and didn’t push past 4GHz on these CPUs.
For reference, the i9-7900X operates at 145FPS AVG, with lows at 103FPS 1% and 96FPS 0.1%. This boosts AVG FPS by about 26% over the 1950X stock CPU.
Ashes: Escalation – TR 1950X & 1920X, 7900X Benchmarks
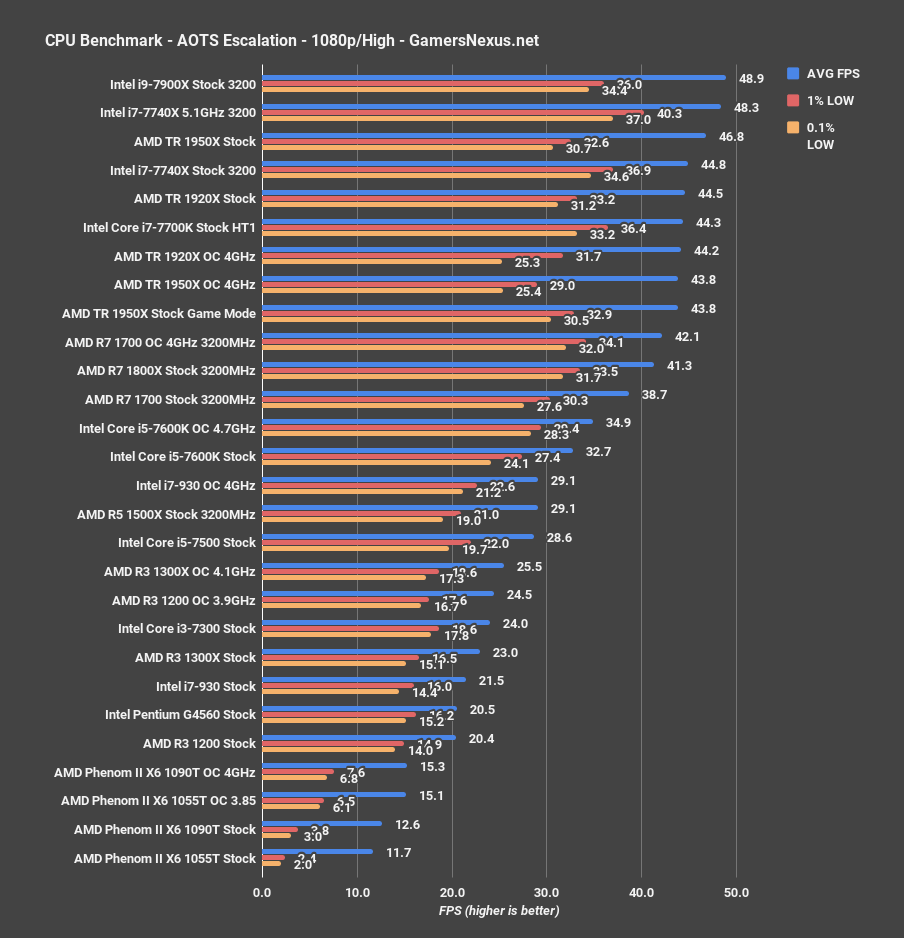
Ashes: Escalation posts the 1950X at 47FPS AVG, with lows at 33 and 31. This is one of the few tests where we consistently see higher thread counts utilized, and is also one of the few where we see a performance loss by enabling game mode. AMD acknowledged this and noted that the loss, as expected, is simply because Ashes actually uses those threads and the distributed memory mode.
This positions the 1950X about 4.5% behind the 7900X – not bad, given previous results. The 1920X isn’t far behind, and actually does lose to the 1950X in this particular title given the core difference.
Metro: Last Light – TR 1950X & 1920X Benchmarks
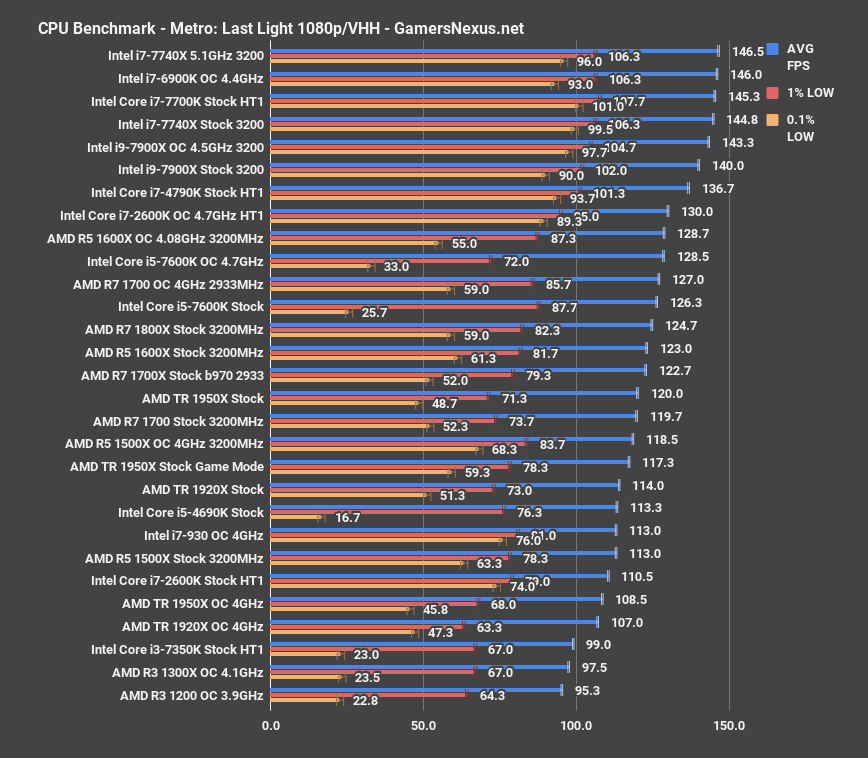
Metro: Last Light is one of the other games where the 1920X is behind the 1950X, as Metro has always been way ahead of its time for core and high thread-count utilization – as seen in i5 results, where frametimes are much lower.
Battlefield 1 – TR 1950X & 1920X Benchmarks
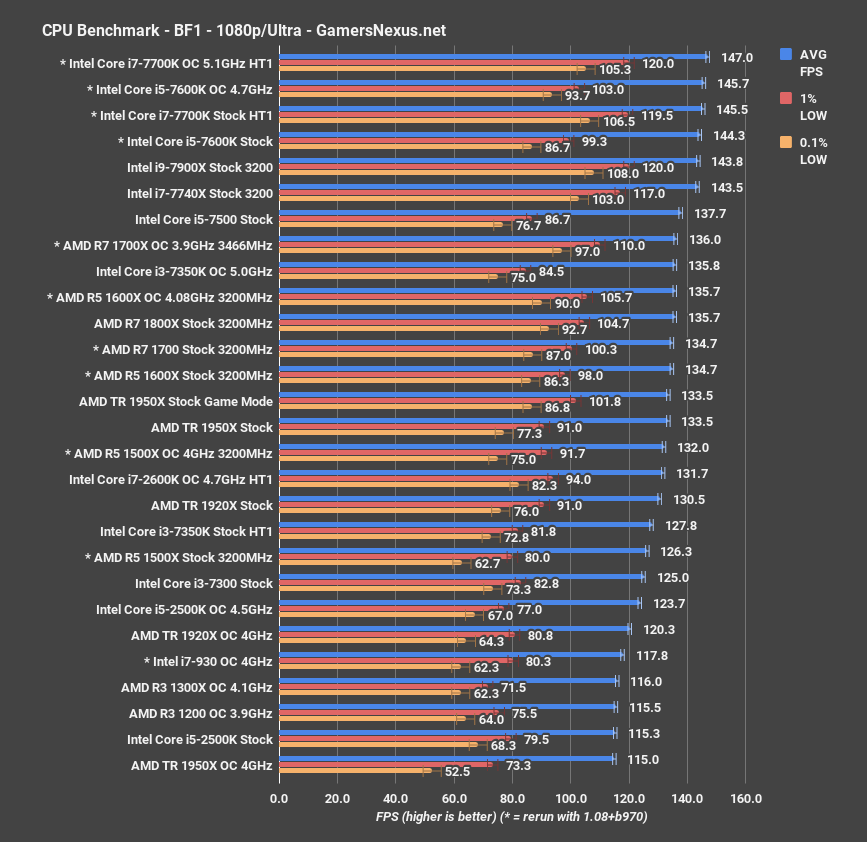
Performance here is better overall than some of the other games, though that all-core 4GHz OC is hurting us more than helping. AMD has done well to optimize Threadripper out-of-box, to the point where it's not worth the OC for this type of task. Like with some of the other games, reverting to "game mode" improves our frametime response.
Before anyone flips for the lack of 1440p results, note well that we elected instead to run the streaming+gaming benchmarks. There are plenty of media outlets and there's a finite amount of time. Not many do the streaming tests, so we spent our limited time -- as it is now one hour before embargo lift, after 23 awake -- running the streaming tests. Other folks will have 1440p results -- grab them from there.
Continue to the next page for production benchmarks (Blender, Premiere, etc.)
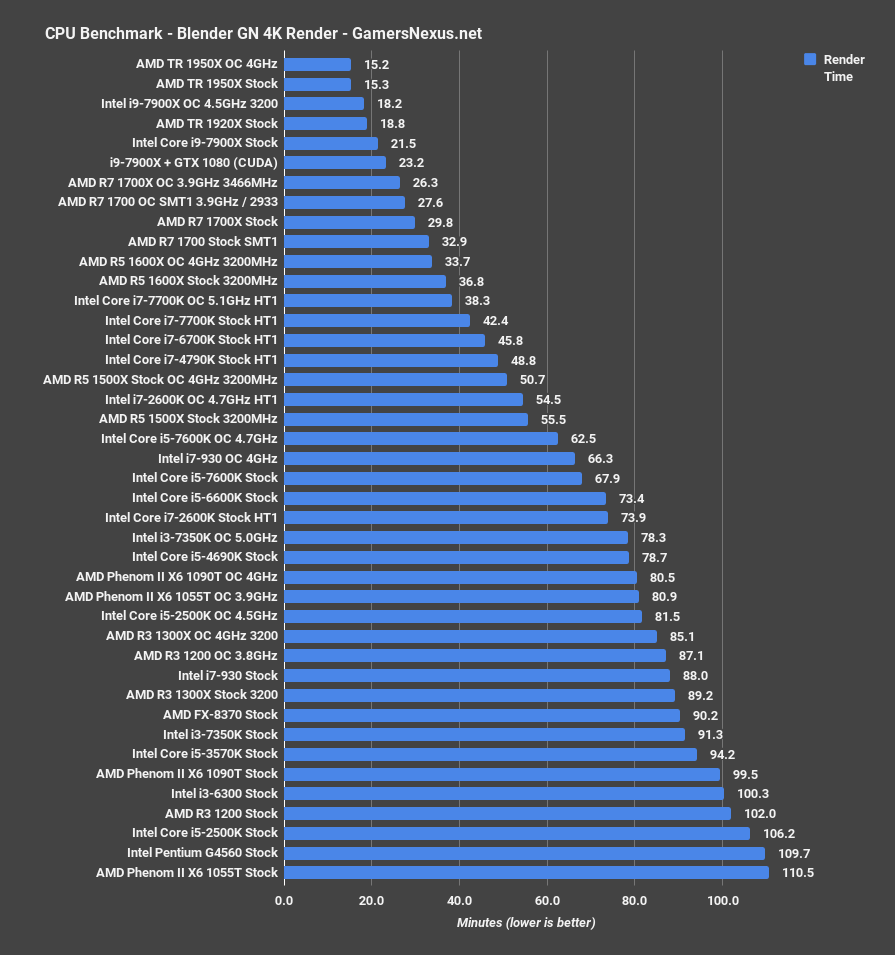
Threadripper 1950X & 1920X Blender Benchmark vs. 7900X
Getting into production workloads next, we start with our in-house Blender animation for CPU workload benchmarking. The Threadripper CPUs don’t even need a highlight – they’re all on top. The 1950X completes our render in 15 minutes, a remarkable speed considering we were only recently impressed with the R7 1700’s 27.6-minute completion time. This performance places the 1950X ahead of the ~$1000 i9-7900X CPU when overclocked to 4.5GHz, and the $800 1920X manages to keep pace with this line-item. Coming in $200 cheaper and at about the same render performance, it’s clear that the 1920X carries the trend of lower-SKU AMD CPUs offering the best value. That said, the 1950X does reduce render time by a still noteworthy 19%. That’s not a bad price for such a reduction, assuming you’re doing something that’ll leverage it; otherwise, the 1920X is looking impressive from this testing.
Off to a good start on this one, AMD.
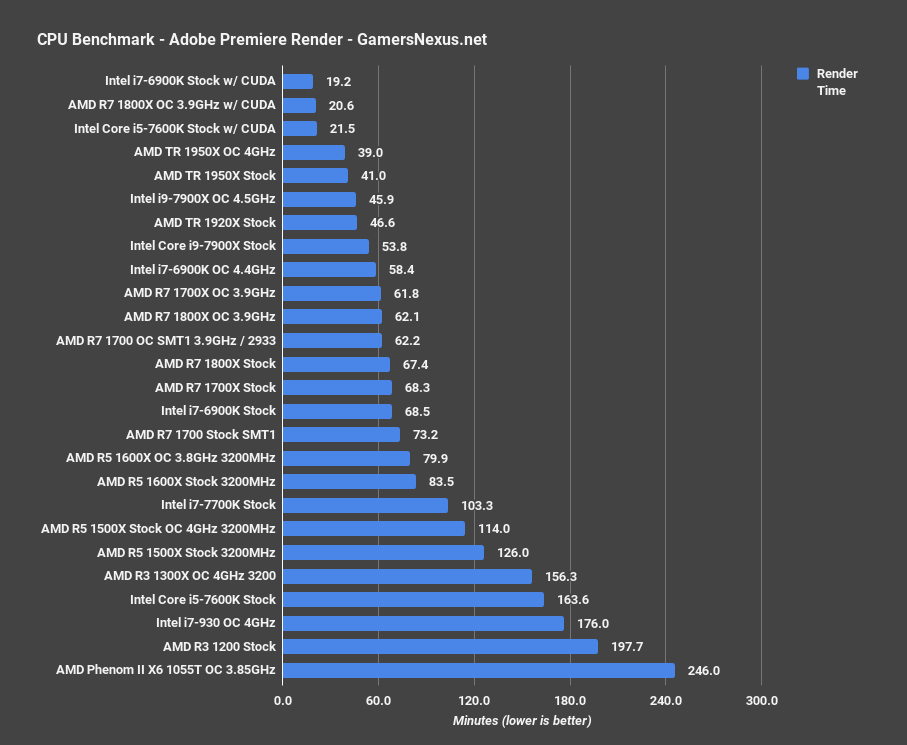
Threadripper 1950X & 1920X Adobe Premiere Benchmarks
Adobe Premiere is next. This test uses one of GN’s own project files as a benchmark for a real workload, and positions the 1950X again at the top of the chart – well, aside from CUDA-accelerated workers. Premiere still benefits from boosted CPU performance for certain types of renders, though it is not the most optimized application you’ll ever use.
Regardless, the 1950X completes the render in 41 minutes, with the 1920X finishing the render 14% slower at 46.6 minutes. Just behind this is the i9-7900X CPU at 54 minutes, though its overclocked variant does claw back a good amount of ground.
For perspective, the R7 1700X overclocked to 3.9GHz finishes the render in 62 minutes, showing that the similarly-clocked 1920X provides a 25% render time reduction from its extra cores.
Threadripper POVRay Benchmark – 1950X & 1920X
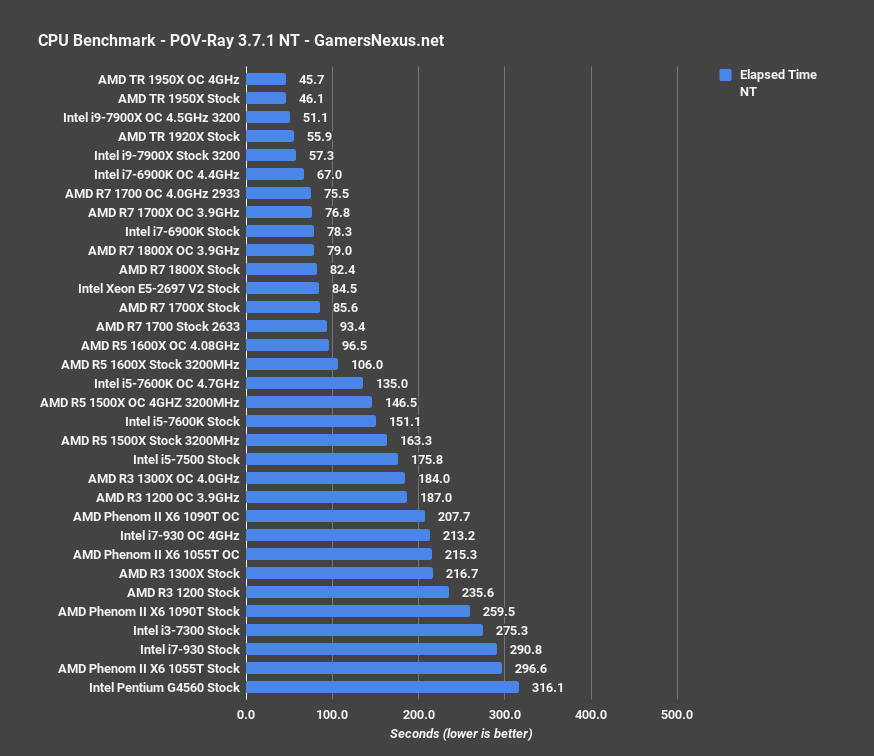
POVRay multi-threaded rendering posts the 1950X completing the workload in 46 seconds, followed by the 7900X 4.5GHz OC CPU at 51 seconds. The render time increase is 11% here, and is followed next by the stock 1920X CPU. For perspective, our highest-scoring R7 CPU completes the work in 76 seconds multi-threaded, for a render time increase of 64% from the 1950X stock CPU.
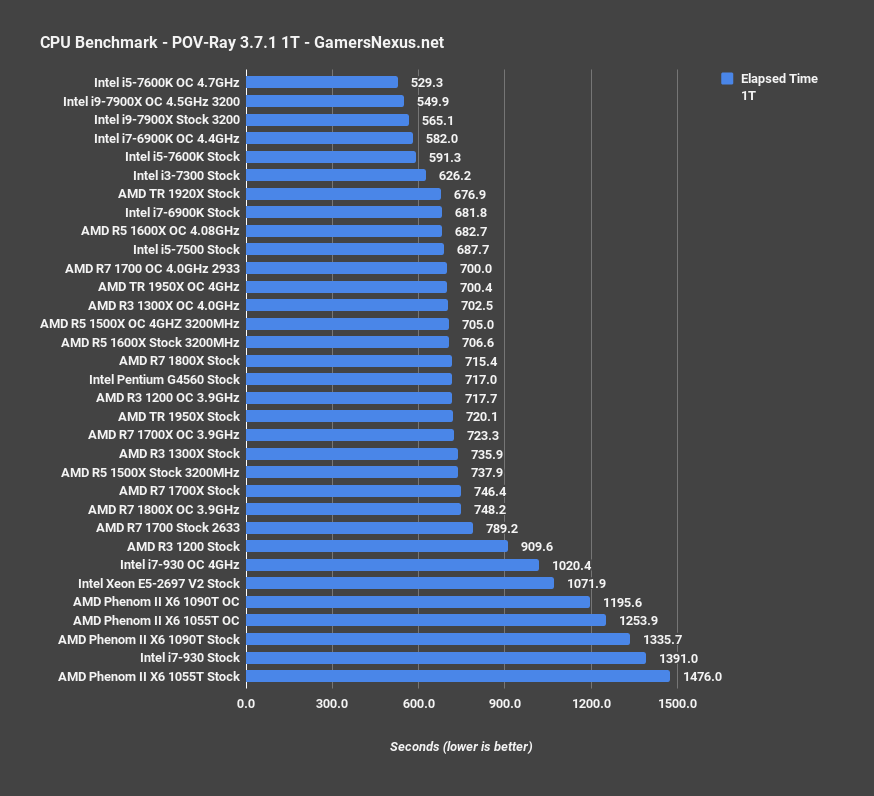
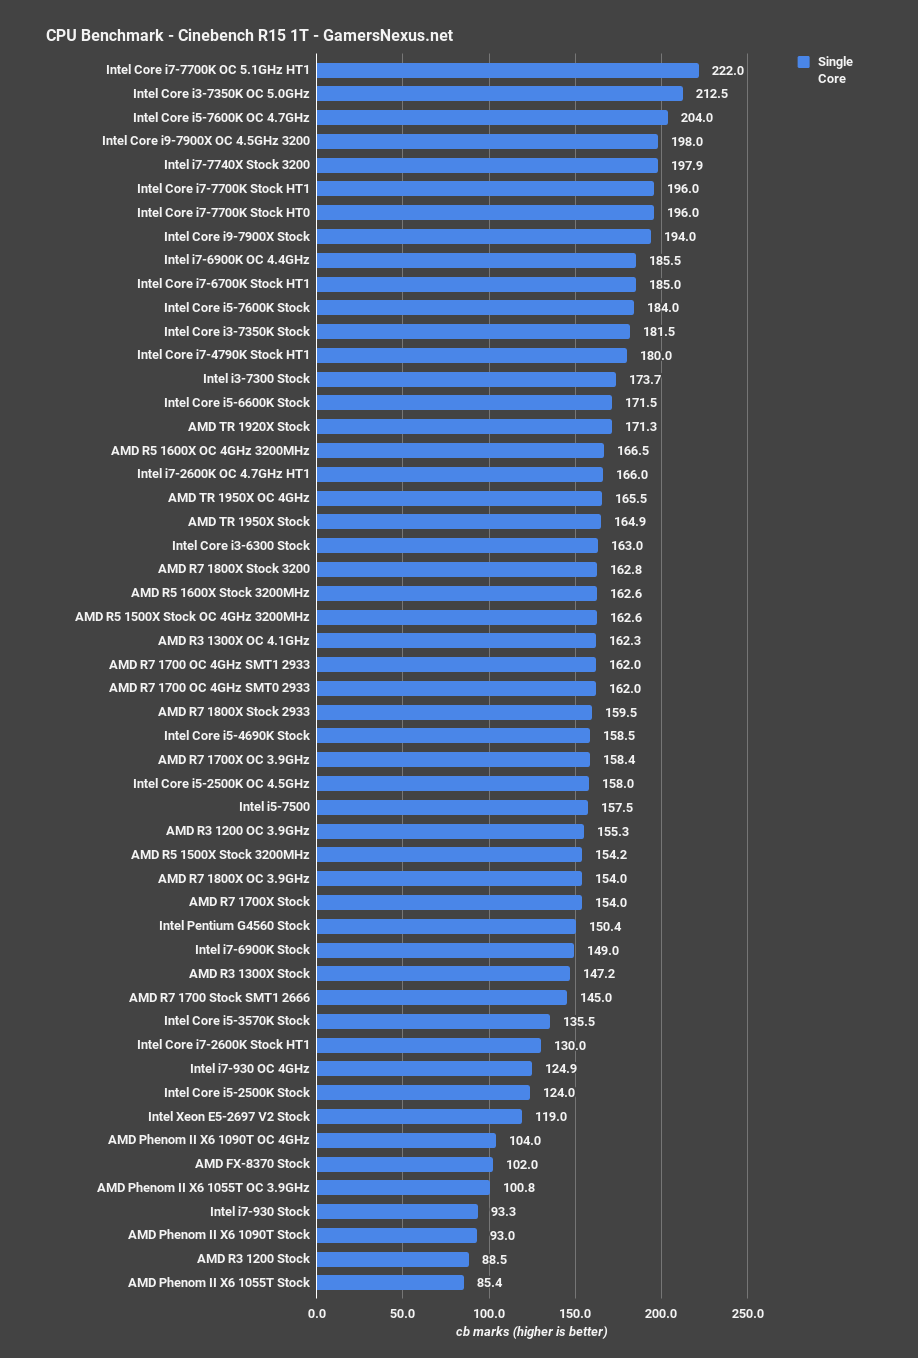
Here’s the single-threaded version of this test. It’s clear as day that Intel still holds a significant lead in single-threaded performance, and that’s not changing with this current generation. The 7900X stock CPU completes the 1T workload in 565 seconds, for a 22% time reduction from the 1950X stock CPU. That’s a big jump in Intel’s favor, and also coincides with Intel’s still-stronger performance in other single-thread intensive applications. That’s not news, though: Don’t buy the Ryzen architecture CPUs if you want the strongest possible single-threaded performance or highest IPC. For most folks in the enthusiast content creation audience, though, thread count holds a lot of relevance, and so the Ryzen architecture is completely valid in those use cases.
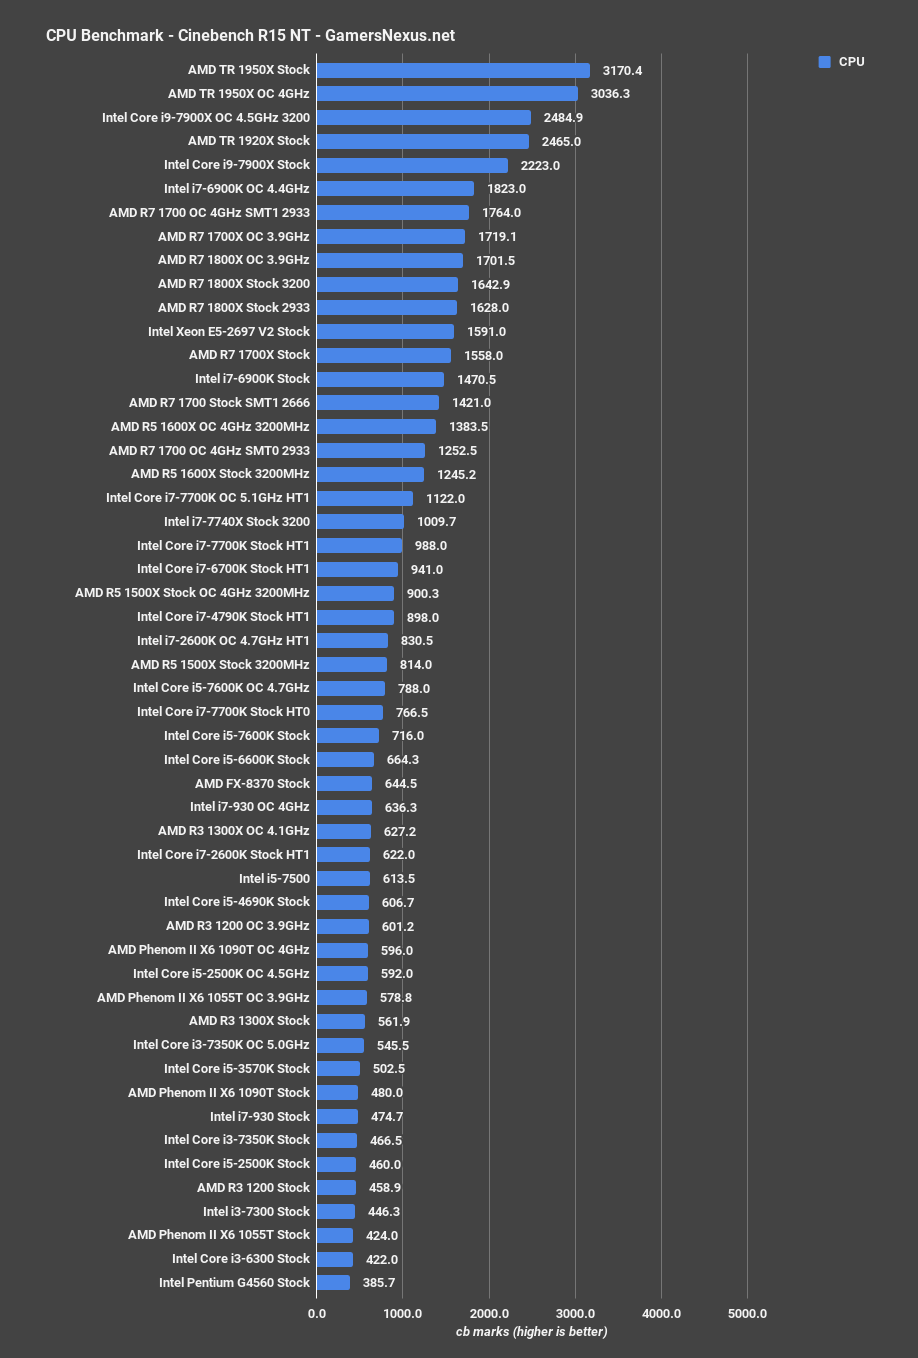
AMD Threadripper 1950X & 1920X Cinebench vs. 7900X
AMD Threadripper 1950X & 1920X FireStrike
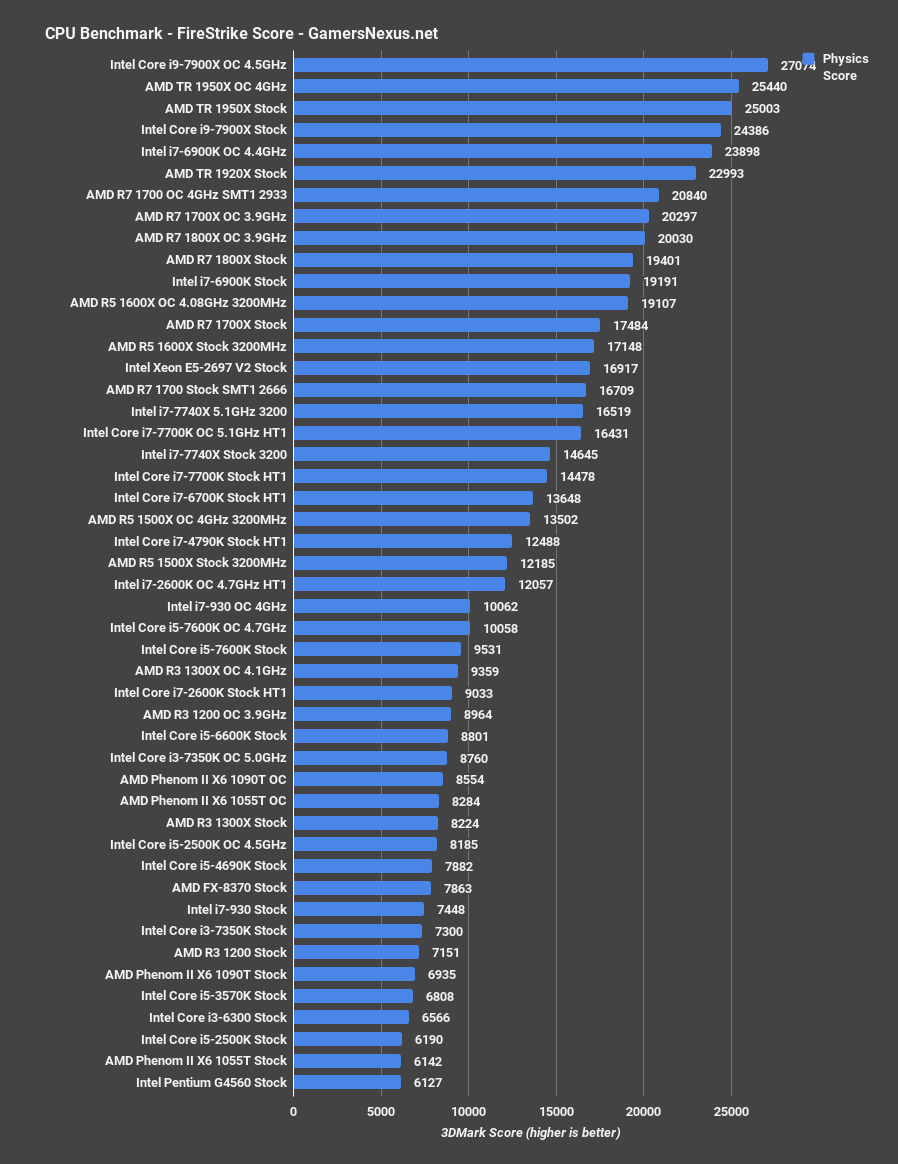
In FireStrike, the 7900X chart-tops after an overclock and carries a physics score that’s 6.4% ahead of the closest Threadripper CPU. That shouldn’t be much of a surprise at this point – each CPU is good at different things, and Intel really starts looking better when factoring in overclock headroom. That said, we did track higher or roughly equal performance on Threadripper when the 7900X was left stock.
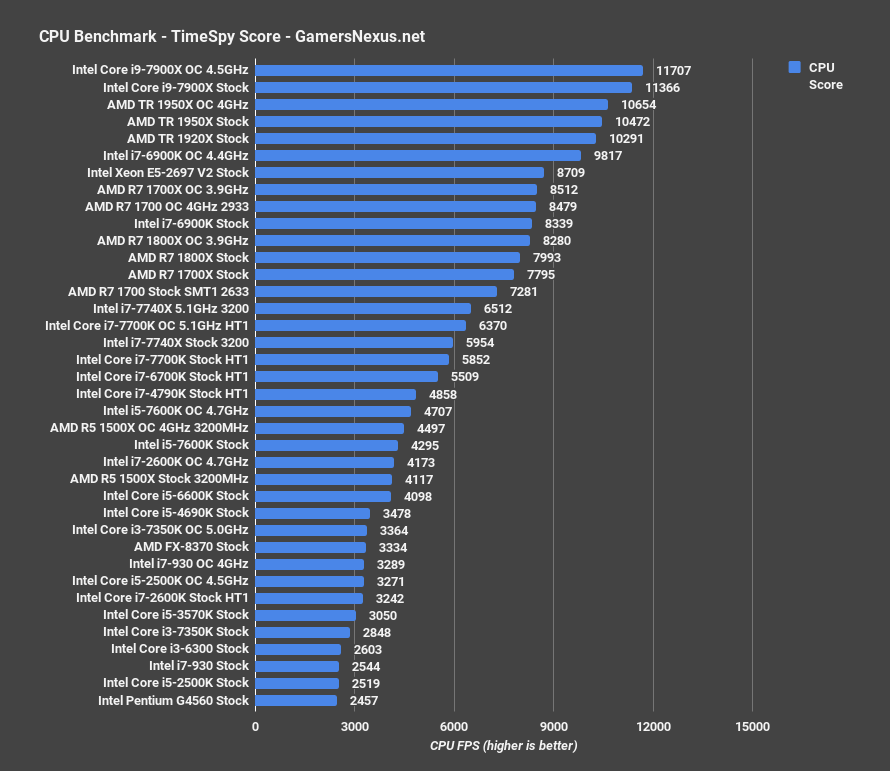
AMD Threadripper 1950X & 1920X TimeSpy
Continue to the next page for power & thermals.
AMD Threadripper 1950X & 1920X Power Consumption
This is a good time to segue into power consumption metrics. We’re measuring at the EPS12V rail for power consumption, so this is not aggregate wall draw like we used to measure. We also have High Performance mode set for these measurements. Because measurements are now taken with a different instrument and in a different fashion, our previous at-wall power measurements are not comparable to today’s results. Measuring at the wall gives an idea of full system power draw and allows us to work off of deltas, but measuring at the EPS12V headers provides much greater accuracy to what the CPU pulls.
Power consumption has been a weak point of Skylake X, potentially gaining Threadripper some favor in the power/thermal department (as the two are directly tied).
Threadripper Idle Power Consumption
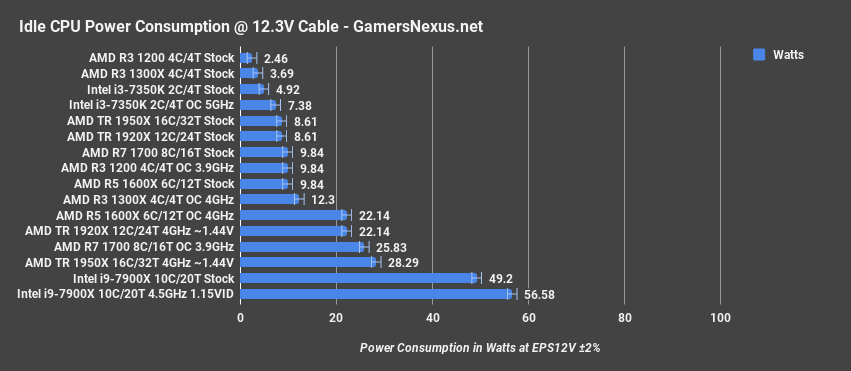
Idle, the Threadripper 1950X and 1920X stock CPUs were consuming 8.6W – within measurement margins for error of the R3 and R7 CPUs, accounted for by the motherboard change. Overclocking gets us up to 22W to 30W draw idle when using the High Performance power plan. Comparatively, we measured the 7900X at 49W idle in the same power plan – though both CPUs can draw less when using a more conservative performance mode.
Threadripper Blender Power Consumption
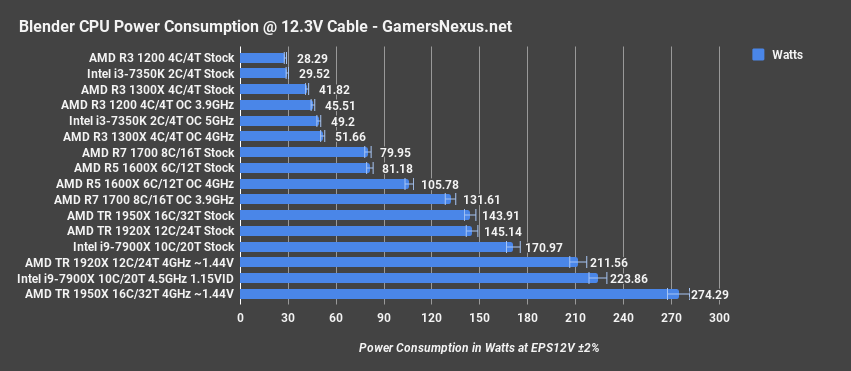
In Blender, the Threadripper CPUs sit within variance of one another, both at around 145W at the EPS12V cables. This puts our TR CPUs as consuming about 10% more power at stock than the overclocked 1700. The i9-7900X stock CPU runs the same Blender test at 171W, with its overclocked variant at 224W. Threadripper remains remarkably efficient in its out of box state, but starts guzzling power when overclocked on higher voltages to sustain all-core OC. We’re at 274W with the overclocked 1950X and 212W with the overclocked 1920X.
Threadripper Total War Power Consumption
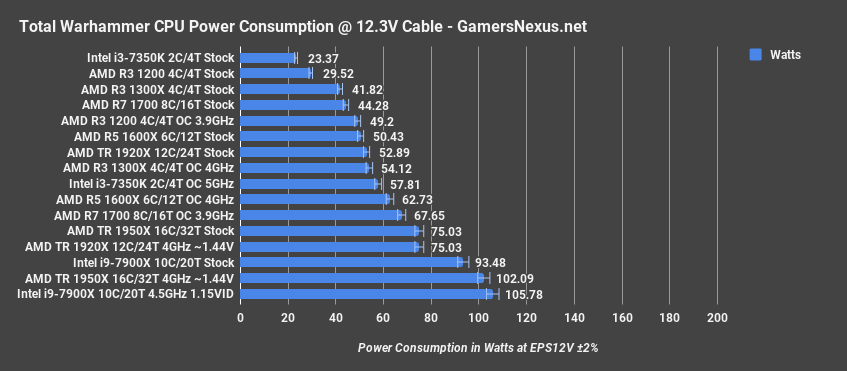
Total War: Warhammer demands 75W when the 1950X is in its stock configuration (16C/32T), and 53W when the 1920X is in stock configuration. Note that these are with auto voltages on the Zenith. The stock 7900X consumes 93W for the same task, with overclocking pushing both flagships to 100W territory. To be fair, the 7900X also outperforms AMD in these games, so tit-for-tat.
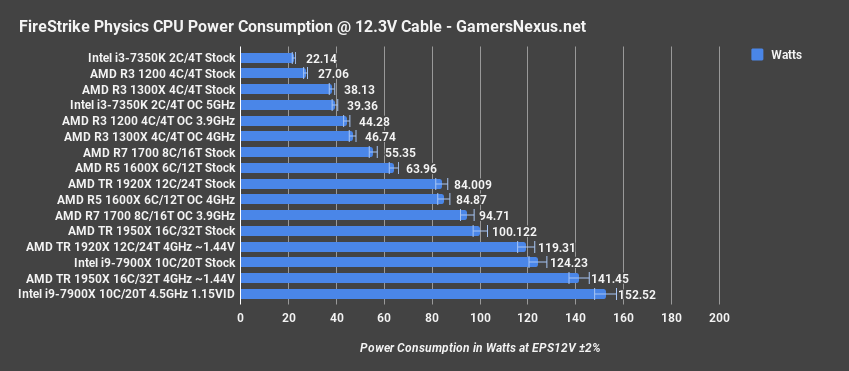
Threadripper FireStrike Physics Power Consumption
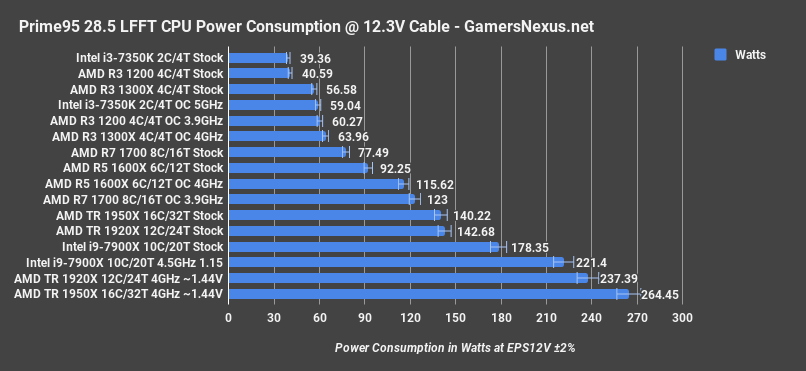
Threadripper Prime95 28.5 LFFT Power Consumption
Threadripper Cinebench NT Power Consumption
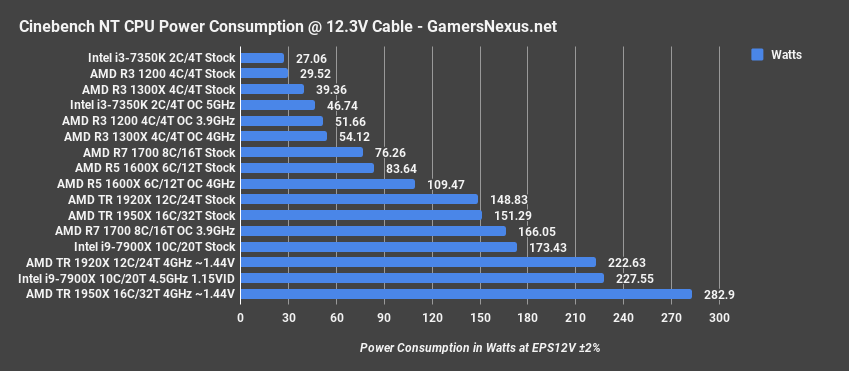
Cinebench is one of the more power-hungry applications, and taxes the CPUs to the point of requiring ~150W stock for Threadripper. The 7900X stock uses about 173W for the same test, or about 15% more than the 1950X, though the 1950X claims the crown for most power-hungry at 283W when overclocked.
AMD Threadripper 1950X & 1920X Thermals
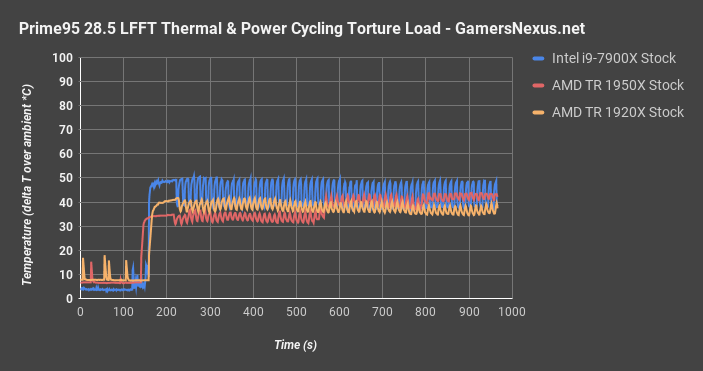
Here’s a quick look at thermals over time in a Prime95 28.5 LFFT torture workload. Note that this chart shows spikes as the test iterates between larger FFT sizes, and so you’ll see a thermal torture scenario enumerated as power and FFT cycles iterate. The 7900X runs warmest here, using our X62, and sits at a delta T over ambient of around 50C peak average. As FFT size progresses, we see the 1950X begin to heat-up more and reach what is more-or-less steady state at 44C delta T over ambient.
Keep in mind that distance from TjMax is different on AMD and Intel processors, so the significance of this tracked heat will vary. Intel maintains a distance from TjMax of about 25C. We think AMD’s TjMax on Threadripper is about 85-90C, though we haven’t been able to confirm this. That assumption is based on observation of when Threadripper throttled in one test. If that’s the case, assuming a 90C TjMax, AMD maintains a distance of about 22-25C also. Not so different, in that case.
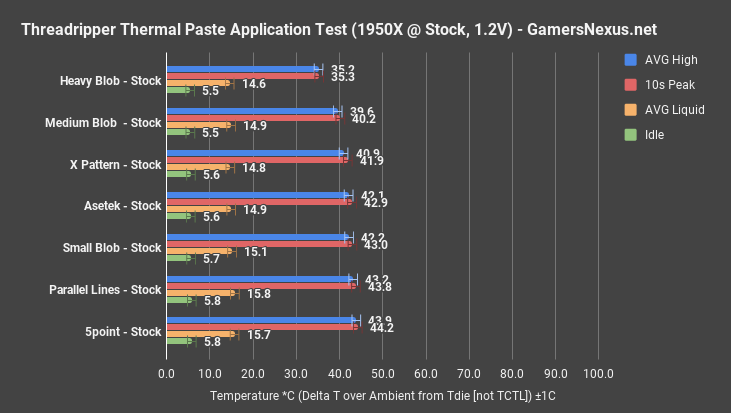
Here’s a chart showing thermal paste application methods, if curious:
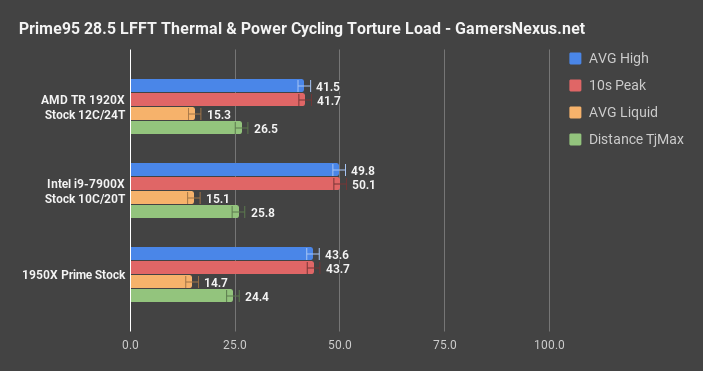
And steady state thermals:
Conclusion: AMD Threadripper 1950X & 1920X Worth It?
Threadripper is in a good space. Ignoring all aspects of performance just briefly, the most immediately noticeable difference between Threadripper’s review cycle and Ryzen’s has been the platform stability. Comparatively, the former is easy to work with – no funny tricks and fewer limitations on the memory side. Threadripper is ultimately just a bigger Ryzen, and so motherboard manufacturers and AMD alike have been able to work on improving the foundation. To give an idea of how our opinions have shaped over the past few months, we initially felt wary of Ryzen’s stability for use in any in-house workstations, having observed many of its teething faults first-hand. With Threadripper, we’d feel confident enough in the platform and CPU to build a workstation machine around it; that is, if we didn’t need the parts for ongoing benchmarking. The point, though, is that we’d trust Threadripper enough to use it as a daily production machine. The same couldn’t be said for Ryzen upon its initial launch (though Ryzen is now significantly improved in these aspects). Threadripper has matured greatly from Ryzen’s pains, and that’s a good thing.
The CPU is still significantly behind in standalone gaming tasks, to the point where it’s at R5 levels (and below) in some games. We’re also not weighting standalone gaming heavily in this review, though (not that folks will get past the first sentence prior to commenting); as noted abundantly in the content, the gaming performance is secondary to streaming+gaming, production tasks, and workstation implementations. Not everyone is a content creator – that’s fine – but folks who do genuinely want to build a workstation for work should seriously consider Threadripper. Anyone who’s just gaming – don’t buy it. Stop right now. You’d be far better off buying an R5 1600X or i7-7700K; not just because the price/value is better for gaming, but because the performance is better. We can’t state enough that enthusiast gamers with no interests in render tasks (Blender, Premiere), transcode/encode/rip tasks, livestreaming, or other “work” tasks should stay away from Threadripper. It’s not for you. Some games don’t understand what to do with Threadripper’s thread-count, and so panic and crash. Others benefit from switching to “gaming mode,” or just experience poor performance and stuttering with the out-of-box memory access mode and core count. The 7900X is also poor value with regard to standalone gaming, but does have better build-and-forget design that would better accommodate less-informed buyers seeking “the best.” Of course, it’s not – it’s also an underperformer in gaming when compared to its cheaper 7700K counterpart, like Threadripper is an underperformer in gaming when compared to its cheaper 1700 counterpart. This is similar to AMD’s lineup: The lower-end CPUs are meant for that job – let them handle it. Threadripper is reserved for HEDT jobs.
And on that front, it delivers fully. The 1950X is a chart-topper in our Blender production workload, beating out the 7900X by a few minutes in total render time required. Similarly, the 1950X excels in Adobe Premiere rendering tasks and manages to match or barely outperform the 4.5GHz overclocked 7900X, with the 1920X not far behind. Streaming while gaming is actually too light of a workload to be a telling benchmark for Threadripper or the 7900X, so we had to get inventive: Streaming at 13Mbps while recording locally, playing CSGO, and watching the stream playback was our multitasking workload – and it was still too easy. To be fair, the 7900X also accomplished this task without dropframes, but the 1920X comes in $200 cheaper and (as we’ll show in a soon-to-come piece) performs just as well in livestream benchmarks. That’s a significant cost savings.
Cores aren’t everything, of course. Threadripper does lose in a handful of IPC-focused applications or workloads, like POVRay single-threaded rendering, Cinebench 1T, or gaming. At this point, that’s a known quantity – that’s just Ryzen. It’s an architectural difference between how Intel and AMD built their processors, and that’s fine; both can be good in their respective approaches to design.
If you’re still trying to figure out if Threadripper is right for you, here are some points to consider:
- Streaming, but only to one source and not recording locally, with no plans to leverage NT rendering: Pass on Threadripper and instead consider the R7 1700. It’s significantly cheaper, yes, but it is also a better performer in games. The R7 1700 can handle livestreaming while gaming with no issues whatsoever, rendering Threadripper “overkill” for this specific task (and slightly detrimental to performance in some instances).
- Streaming to multiple sources, recording locally: Seriously consider Threadripper and the 7900X. As for how to pick between them, some more items to ponder:
- Rendering animations, 3D art, and videos for later upload – strongly consider Threadripper. This is where the CPU shines.
- Expected long uptimes of thread-intensive workloads, like H264 Handbrake transcodes – get Threadripper.
- “These things don’t sound right – I want to play games and maybe render a video a few times a year” – get something else, like the R5 1600X or R7 1700.
- “I want to play games at 144Hz” – go for the 7700K.
The 7900X is still a damn good CPU, particularly if a significant amount of a machine’s daily use (alongside “work,” whatever that may be) is actually gaming. It’s just better on that front, as you’d expect and as AMD itself will admit. Now, of course, bottlenecking on the GPU does diminish that lead, but it’s still present. The differences emerge especially in low-end frametimes, where we’d recommend using AMD’s “game mode” to change memory access and core presence for bolstered performance. All that said of the 7900X, though, it’s also slower in thread-limited render tasks (Blender), slower in encoding (Premiere), a bigger consumer of power, about the same temperature, and equal in price (1950X) or $200 more (1920X).
AMD’s done well, here. We can strongly and confidently recommend Threadripper for the above-outlined applications, given the handful of exceptions.
Stay tuned for more.
Editorial, Test Lead: Steve Burke
Testing: Patrick Lathan
Video: Andrew Coleman