
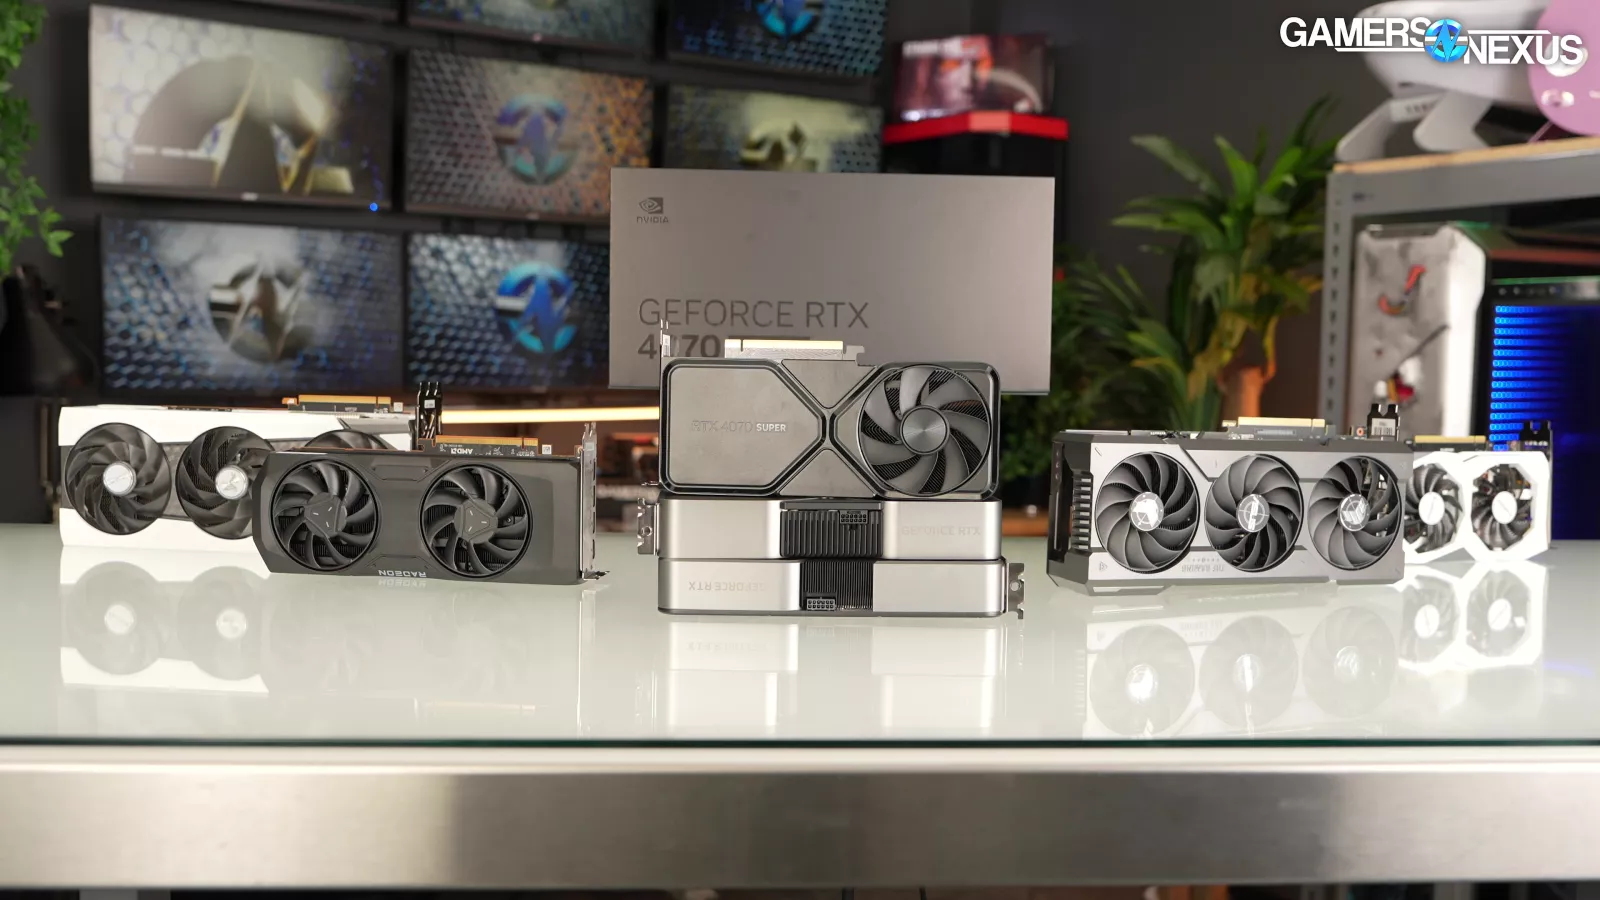
We put the NVIDIA RTX 4070 Super through numerous rasterized, ray-tracing, and latency benchmarks
The Highlights
- The 4070 Super has 7168 CUDA cores, which is higher than the 4070’s 5888 but lower than the 4070 Ti’s 7680
- The 4070 Ti has about a 10% advantage over the 4070 Super in our benchmarks
- The 4070 Super has about a 15% advantage over the original 4070 and costs about $50 more
- Original MSRP: $600
- Release Date: January 8, 2024
Table of Contents
- AutoTOC

Intro
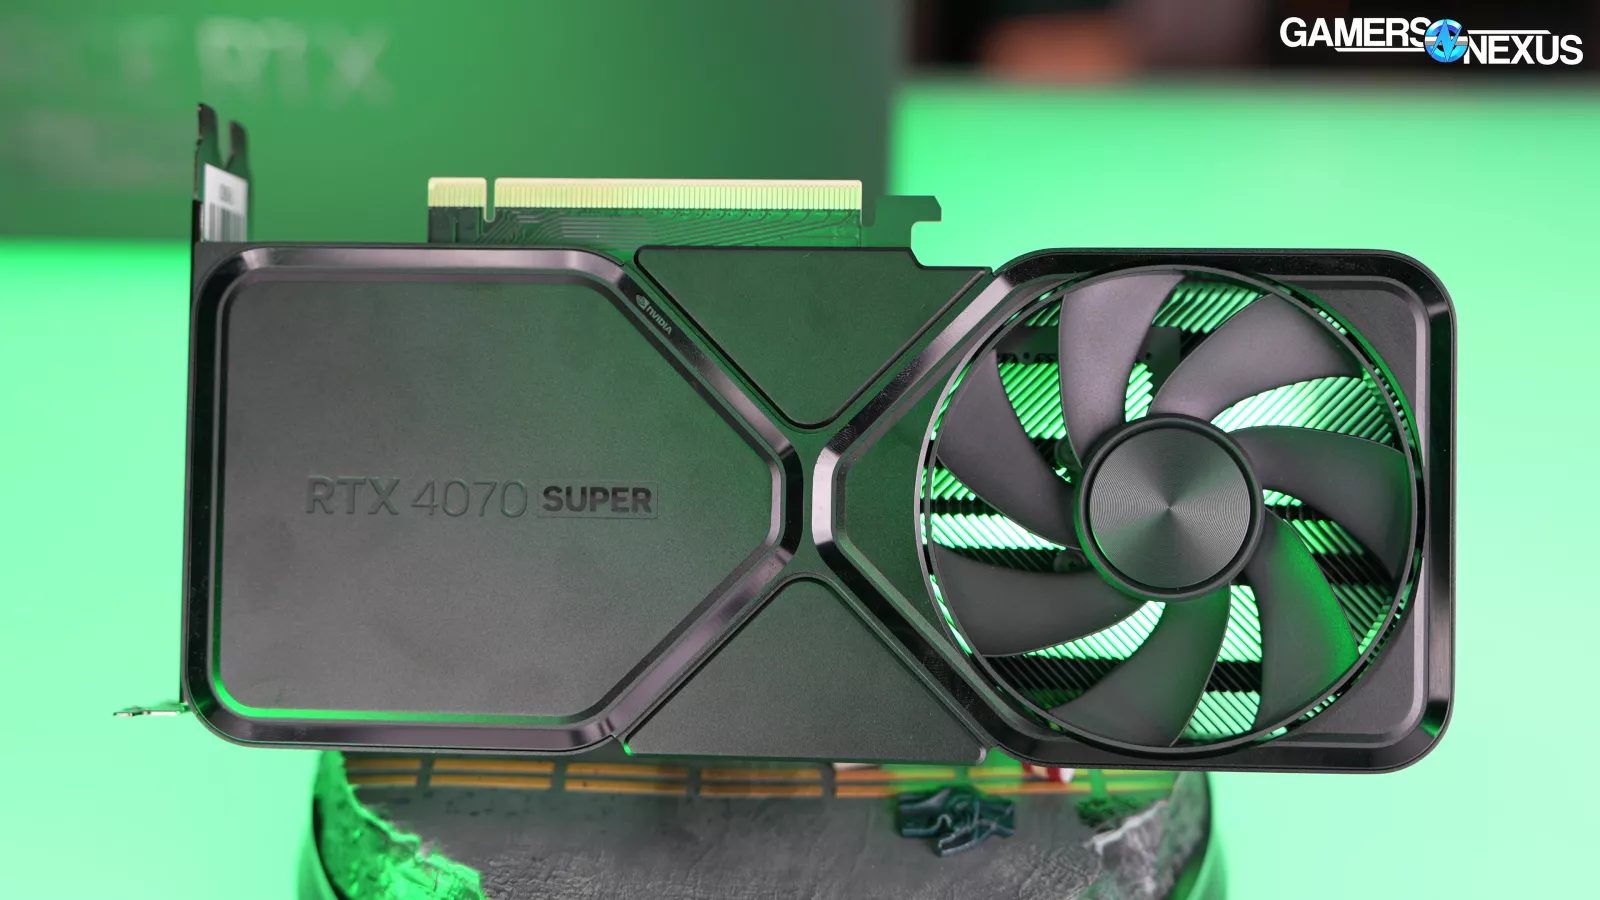
We’re reviewing the NVIDIA RTX 4070 Super today. It joins the RTX 4070 in the stack. It costs $600, which is roughly $50 more than the 4070 (find our original review here), which sometimes comes down to $530. The other new cards come out in a couple weeks, with the RTX 4080 Super (specs here) launching on January 31 for $1,000 and the 4070 Ti Super launching on January 24 for $800.
The main changes with the RTX 4070 Super and the original 4070 are in the core count: the 4070 Super will run 7168 CUDA cores, whereas the 4070 Ti has 7680 and the 4070 has 5888.
Based on the early community reaction, it seems like the 4080 Super might be the most awaited of these 3; however, each of the cards has a different area where it may establish itself as interesting: For the 4080 Super, that’s the price. For the 4070 Super, it’ll be the relatively large core count increase. And for the 4070 Ti Super, it’ll be the memory bandwidth and capacity, which both increase significantly over the 4070 Ti.
Editor's note: This was originally published on January 16, 2024 as a video. This content has been adapted to written format for this article and is unchanged from the original publication.
Credits
Test Lead, Host, Writing
Steve Burke
Testing
Mike Gaglione
Video Editing
Vitalii Makhnovets
Camera
Tim Phetdara
Testing
Patrick Lathan
Web Editing
Jimmy Thang
NVIDIA GeForce RTX 4070 Super Benchmarks & Latency
This one is fairly straight-forward: We’ve refreshed a number of our tests and have added some new ray tracing and upscaling benchmarks. In addition to the gaming and power tests, we’ve also introduced latency testing for the first time as a part of our permanent and standard GPU review suite. We’ll be doing more with this going forward.
We’ve been working toward this for a few months now, mostly because framerate has gotten so comically high in some FPS games that it starts to feel almost meaningless when you’re comparing, say, 700FPS vs 600FPS. Instead, normally what people want when they describe a high framerate experience in a shooter is to feel connected with the input, where higher framerate mostly goes to help reduce the total end-to-end system latency.
We’ll talk about this more in the latency section, but it gives us something new and provides a different number to look at for the charts. And there are a lot of charts in this review.
Quick Recap of Results
The quick version of the data today is all upfront: The 4070 Ti is generally between 6 and 16% ahead of the 4070 Super in our testing, with many of the results clustering around 10%, depending on resolution. The 4070 Super often leads the 4070 by 13% to 17%, with a few break-outs to 21% and 23%. Against the 3070, the 4070 Super improves by around 30-60%, with most results clustered around 50%.
On AMD’s side, the closest alternative is the RX 7800 XT at $500, the RX 6800 XT at $500, the 6950 XT, where still available, for $600, or the 7900 XT for about $750, plus or minus a bit on each of these prices. We wouldn’t be surprised if they drop another $20 between the time we’re writing about this and the time of embargo lift. Intel mostly occupies a lower price tier and won’t be in the discussion today, but is included in the charts.
Let’s get straight into the games.
GPU Test Bench & Methodology
You can find additional details about our game graphics settings, test choices, and methodology in this living document.
| Part | Component | Provided By |
| CPU | Intel Core i7-12700KF Overclocked (4.9GHz P-Cores, 3.9GHz E-Cores) | Bought by GN |
| Motherboard | MSI Z690 Unify | MSI |
| RAM | DDR5-6000 G.Skill Trident Z (manually tightened timings) | G.Skill |
| Cooler | Arctic Liquid Freezer II 360 @ 100% Fan Speed | Bought by GN |
| PSU | EVGA 1600W T2 Supernova Corsair AX1600i | EVGA Corsair |
| OS | Windows 11 | Bought by GN |
RTX 4070 Super Specs vs. RTX 4070 Original
| 4080 Super | 4080 | 4070 Ti Super | 4070 Ti | 4070 Super | 4070 | |
| GPU | AD103 | AD103 | AD103 | AD104 | AD104 | AD104 |
| Cores | 10240 | 9728 | 8448 | 7680 | 7168 | 5888 |
| Tensor Cores | 320 | 304 | 264 | 240 | 224 | 184 |
| RT Cores | 80 | 76 | 66 | 60 | 56 | 46 |
| Memory Size & Type | 16GB GDDR6X | 16GB GDDR6X | 16GB GDDR6X | 12GB GDDR6X | 12GB GDDR6X | 12GB GDDR6X |
| Bus Width | 256-bit | 256-bit | 256-bit | 192-bit | 192-bit | 192-bit |
| Memory Bandwidth | 736 GB/s | 716 GB/s | 672 GB/s | 504 GB/s | 504 GB/s | 504 GB/s |
| Base/Boost (Advertised) | 2.29/2.55GHz | 2.2/2.5GHz | 2.3/2.6GHz | 2.3/2.6GHz | 1.98/2.48GHz | 1.9/2.48GHz |
| ROPs | 112 | 112 | 96 | 80 | 80 | 64 |
| TMUs | 320 | 304 | 264 | 240 | 224 | 184 |
| TDP | 320W | 320W | 285W | 285W | 220W | 200W |
| Launch MSRP | $1,000 | $1,200 | $800 | $800 | $600 | $600 |
| Announce Date | January 8, 2024 | September 20, 2022 | January 8, 2024 | January 3, 2023 | January 8, 2024 | April 12, 2023 |
| Release Date | January 31, 2024 | November 16, 2022 | January 24, 2024 | January 5, 2023 | January 17, 2024 | April 13, 2023 |
NVIDIA RTX 4070 Super Rasterized Gaming Benchmarks
Shadow of the Tomb Raider
Shadow of the Tomb Raider 4K Benchmarks
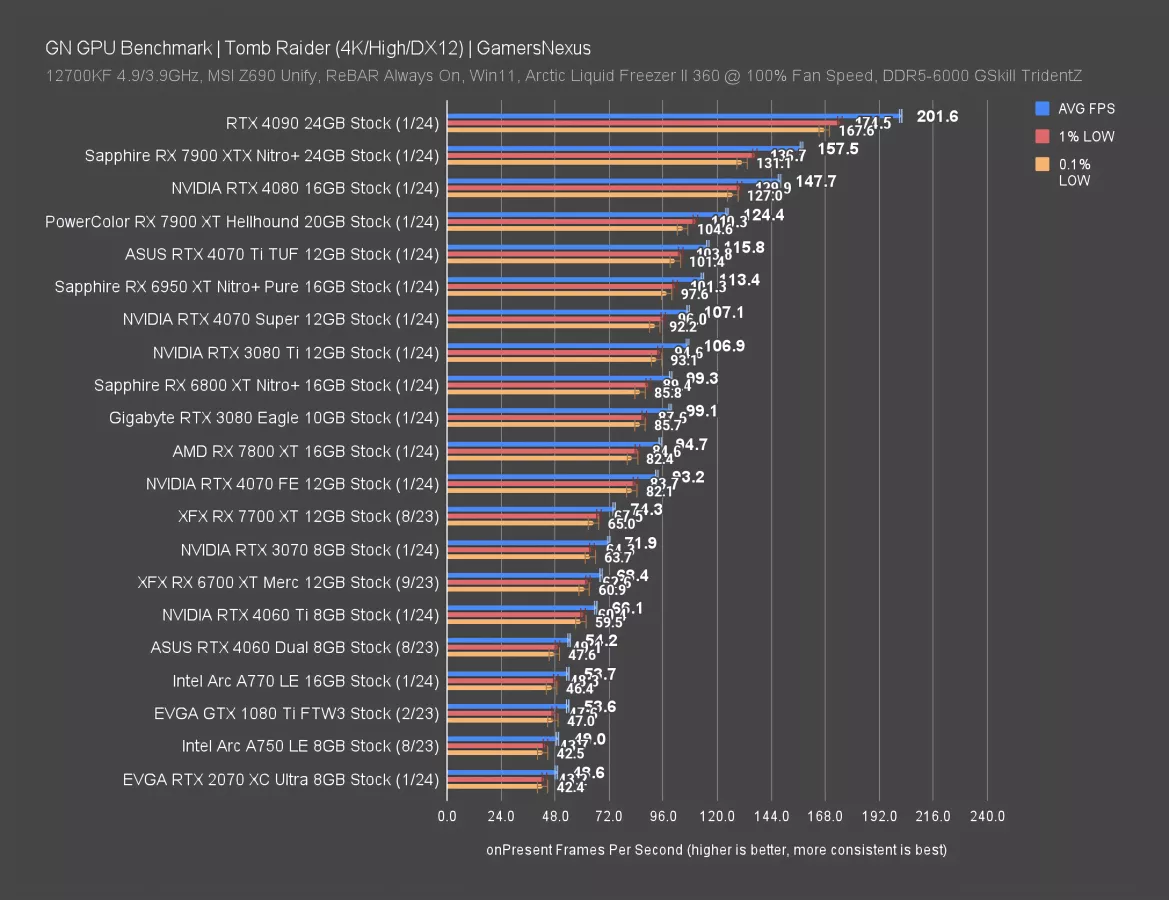
In Shadow of the Tomb Raider at 4K and rasterized, the RTX 4070 Super ran at 107 FPS AVG, with lows close behind. There are no meaningful excursions in any of the 1% or 0.1% lows for this chart -- everything is effectively perfectly cascaded from the average.
The 4070 Super’s result has it roughly tied with the 3080 Ti and just behind the 6950 XT. The outgoing 4070 Ti leads the Super by 8%, with the outgoing 4080 leading by 38% with its 148 FPS AVG. Looking down the stack in descending order, the RTX 4070 ran at 93FPS AVG, and that gives the Super a 15% lead, the 3070 ran at 72FPS AVG, giving the Super a 49% lead, and the 2070 ran at 49 FPS AVG. The 2070’s result was hierarchically in about the same spot as years ago, with the 1080 Ti about 10% ahead of it.
Compared to AMD, the 6950 XT at its $600 sale price was a good deal if you bought it in the last year. The closest competing alternative in rasterization would otherwise be the 6800 XT or 7800 XT, with the former being superior. The 7900 XT is 16% ahead of the 4070 Super here but is also more expensive.
Shadow of the Tomb Raider 1440p Benchmarks
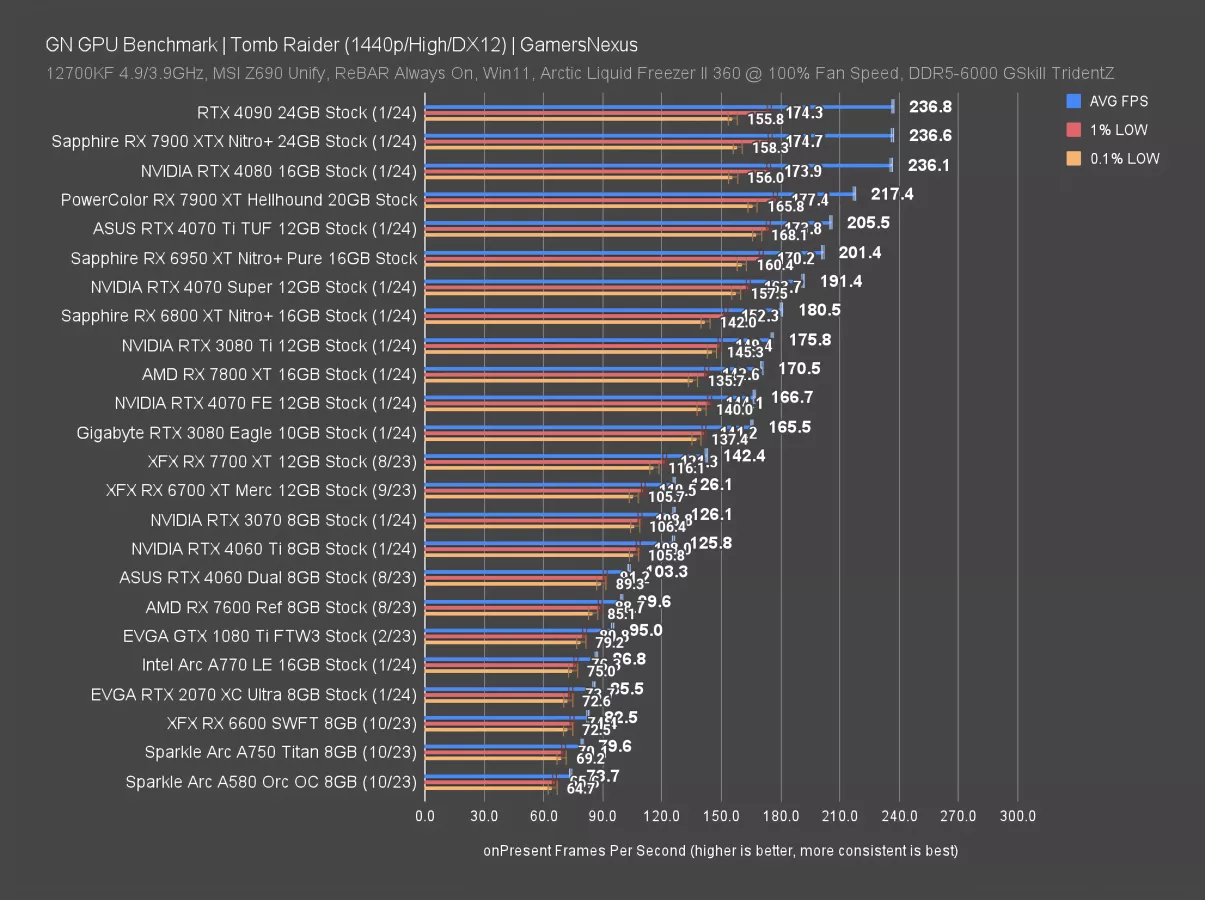
At 1440p, the top 3 entries are CPU-bound. The 4070 Super is not, though: At 191 FPS AVG, the 4070 Ti leads it by 7.4%, similar to at 4K, with the 4070 Super leading the 4070 by 15% and the 3070 by 52%.
AMD’s best competition would be the prior 6950 XT, which is just ahead of the 4070 Super, or the 7900 XT if you’re spending more money, currently leading by 14%. Against the 7800 XT, NVIDIA’s Super holds a lead of 12%.
1080p is GPU-bound for these cards, so we’ll skip it.
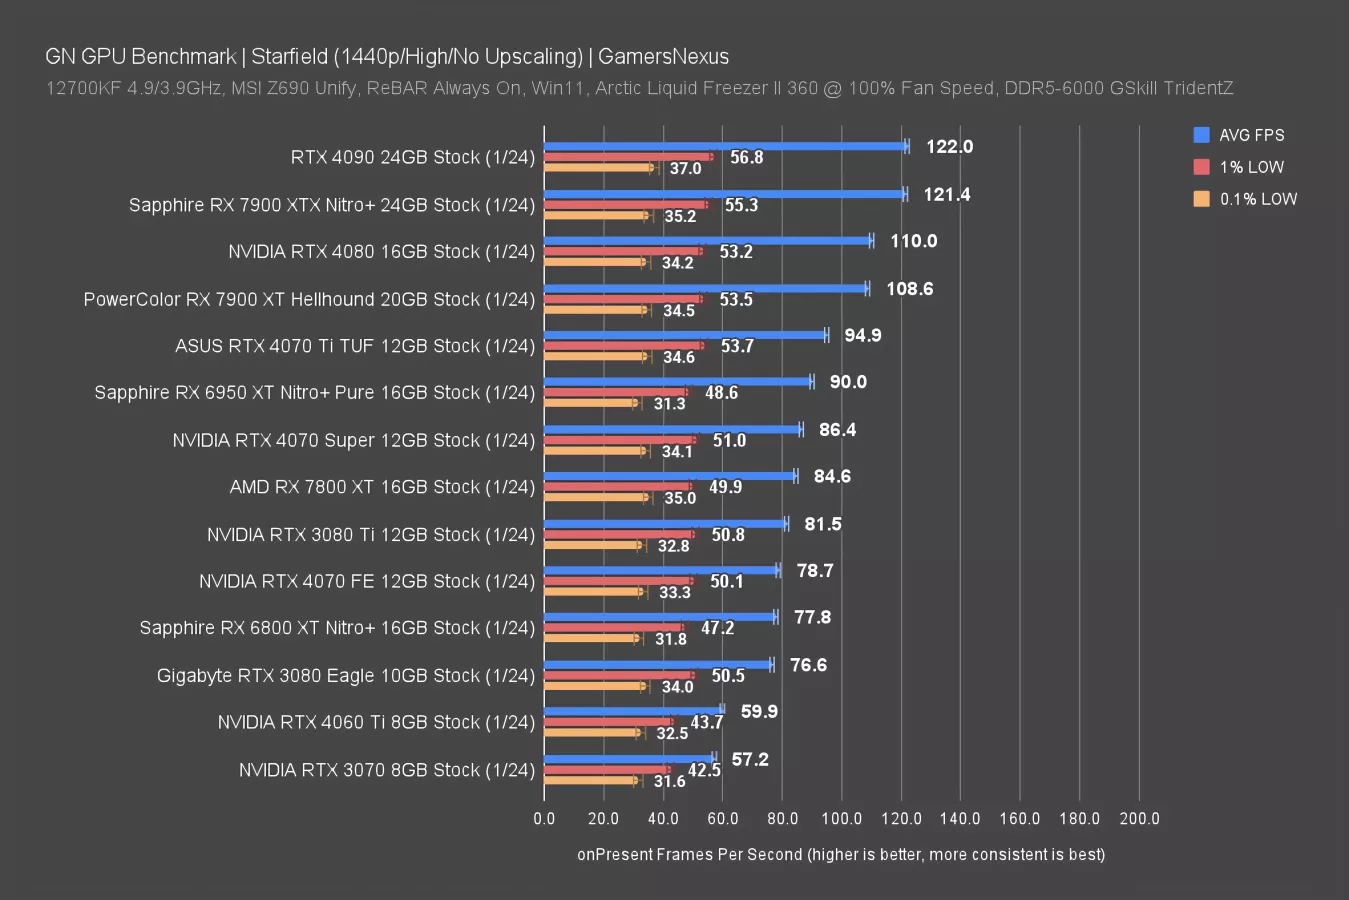
Starfield
Starfield 4K Benchmarks
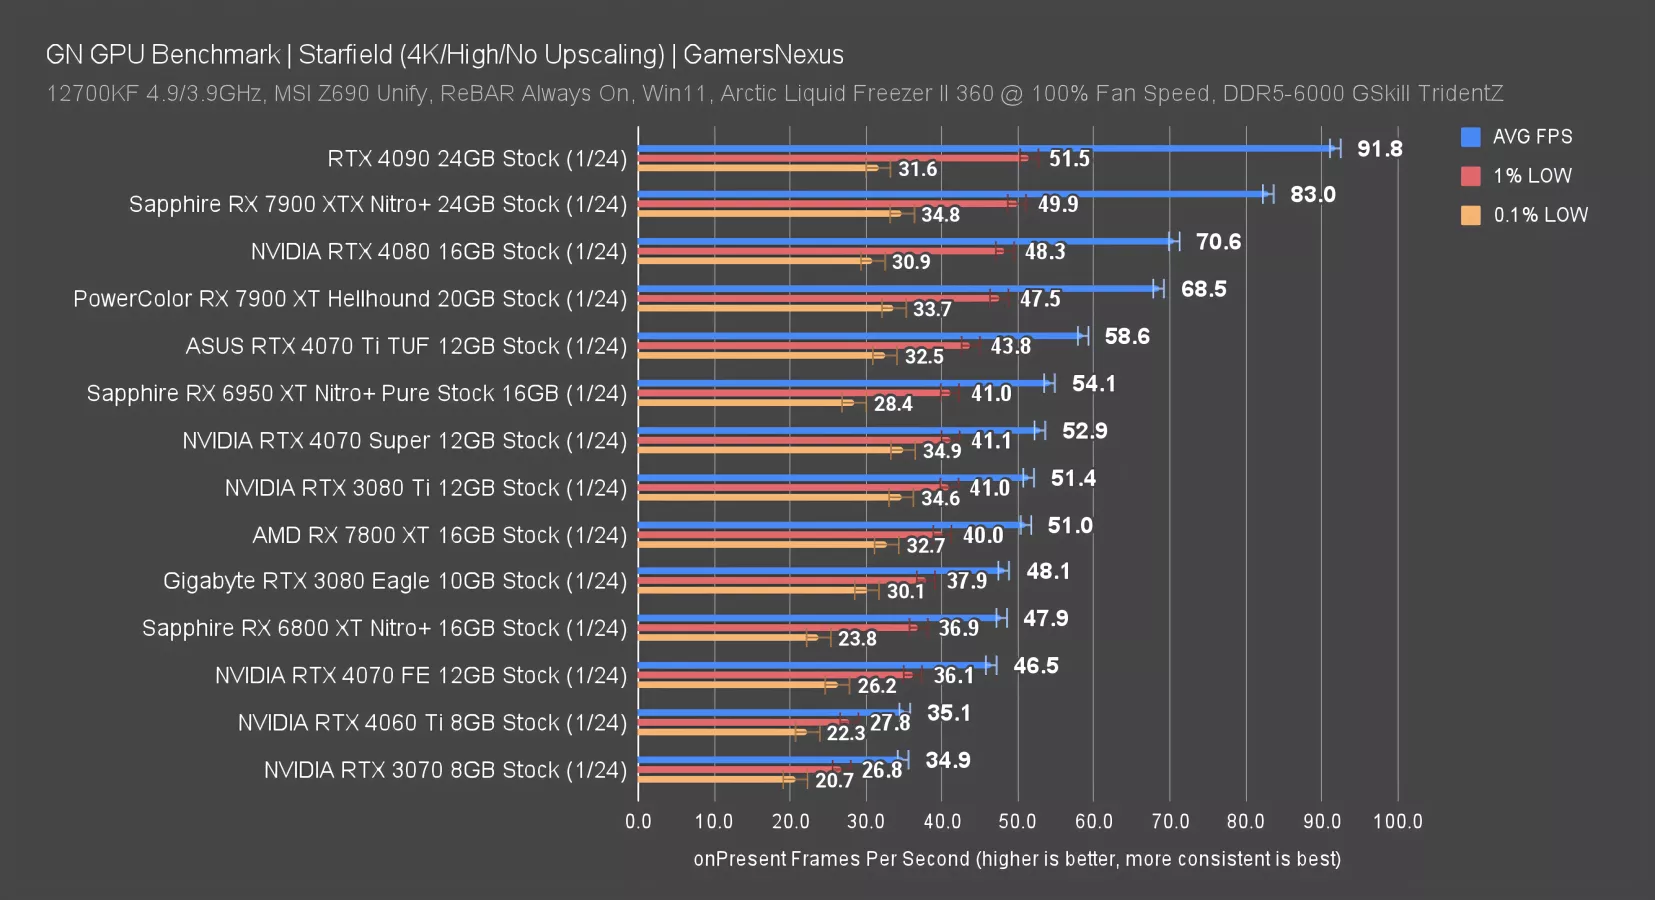
Starfield is up next. This has entirely new data because the game has recently had several major updates, so we have had to ditch our prior dataset to move forward with the most recent patch. There are fewer cards on these charts as a result.
At 4K, the RTX 4070 Super ran at 53FPS AVG, so the 4070 Ti ends up about 11% ahead, with the 4070 Super ahead of the 4070 non-Super by 13.8% and the 3070 by 52%.
AMD still has a strong position in Starfield for GPUs, even with all the recent patches. AMD’s cards were ahead at launch and they remain comparatively well positioned now. The 7900 XT leads the 4070 Ti by about 10FPS and the 4070 Super by 30%, but the 7900 XT also costs around $750 right now. At $500, the 7800 XT roughly ties the 4070 Super in these tests, positioned just ahead of the 3080 and 6800 XT.
Starfield 1440p Benchmarks
At 1440p, the RTX 4070 Super’s 86FPS AVG had it about tied with the 7800 XT and just behind the 6950 XT. The 4070 Ti leads by 10%, at 95 FPS to 86. Against the original 4070’s 79FPS AVG result, the Super’s improvement is about 10%, and over the 3070, it’s about 51%. Both of these results are about the same as we’ve seen elsewhere.
An extra $150 or so on the 7900 XT would push you 26% ahead, with the 4080 a bit ahead of that (and soon to be replaced by its own Super).
Starfield 1080p Benchmarks
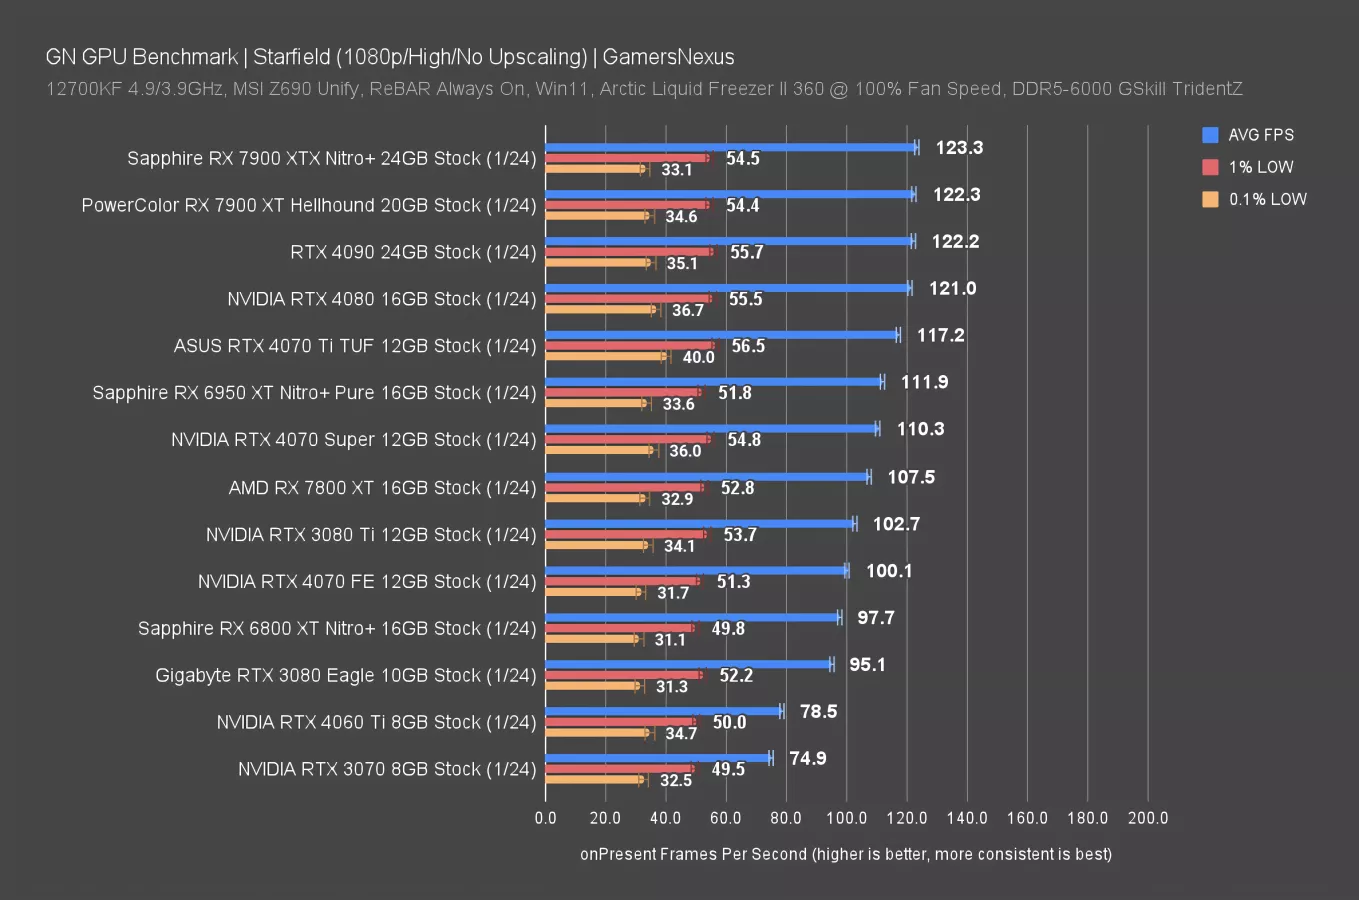
At 1080p, we’re limited by other components on most of these devices. The 4070 Ti is pushing up against the boundary for this test. The 4070 Super is still within test bounds; however, some frames are ricocheting off of them, so we’ll just move on to a better comparison.
F1 2022
F1 2022 4K Benchmarks
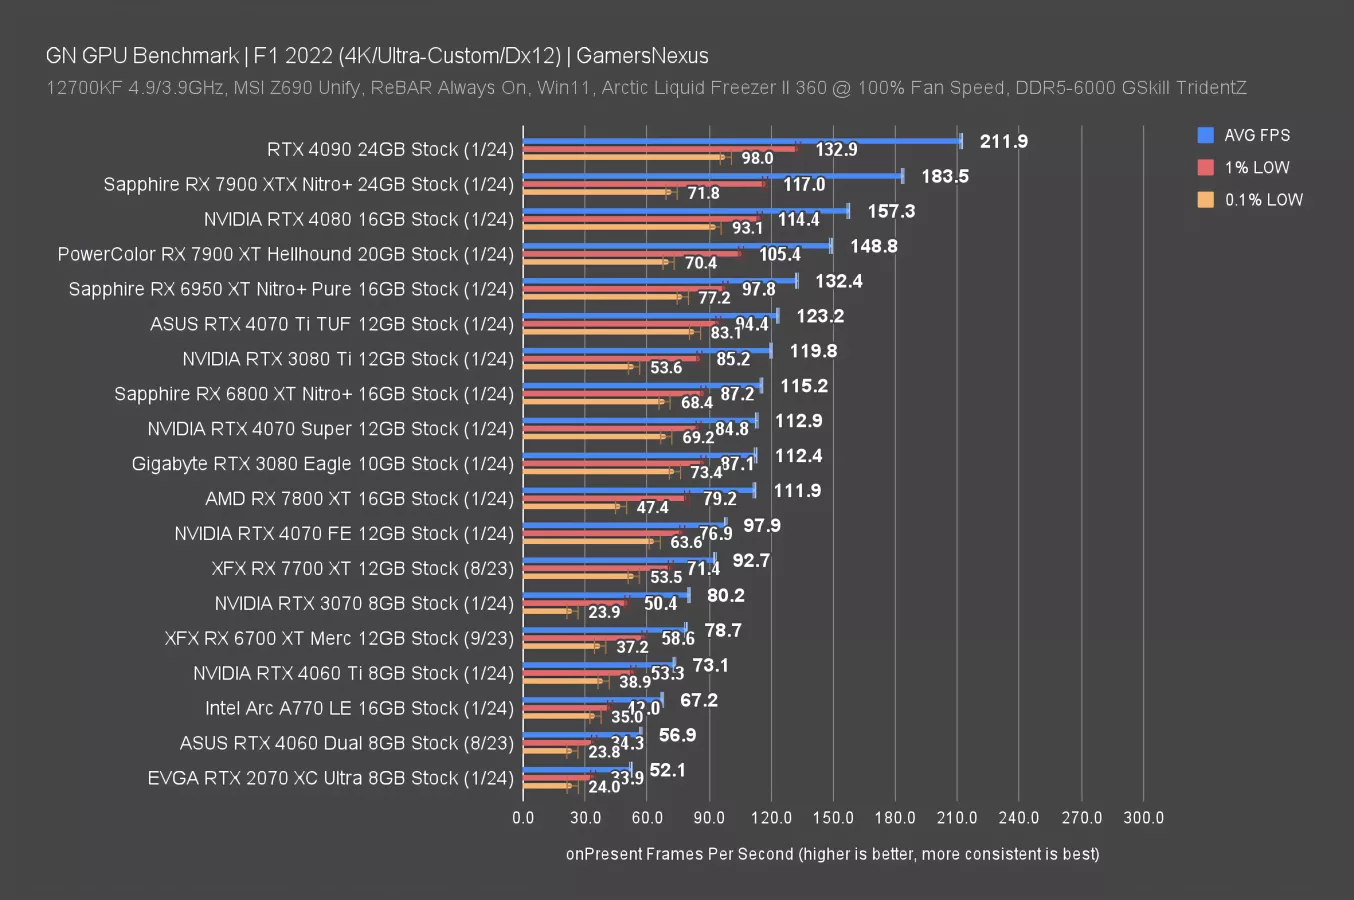
In F1 22 benchmarks at 4K and without RT (that comes later), we tested the 4070 Super at 113 FPS AVG and with 1% and 0.1% lows predictably and properly spaced-out. That has it about 117% ahead of the RTX 2070, 41% over the RTX 3070, 15% over the RTX 4070 non-Super, and has the 4070 Ti ahead by about 10FPS, or 9%.
AMD’s 6800 XT does well here and is still priced at about $500, making it a worthwhile consideration -- especially compared to the weaker 7800 XT in many comparisons. The 7900 XT posts a more meaningful increase with its price hike, at 32% uplift, and the 4080 is a step beyond that.
F1 2022 1440p Benchmarks
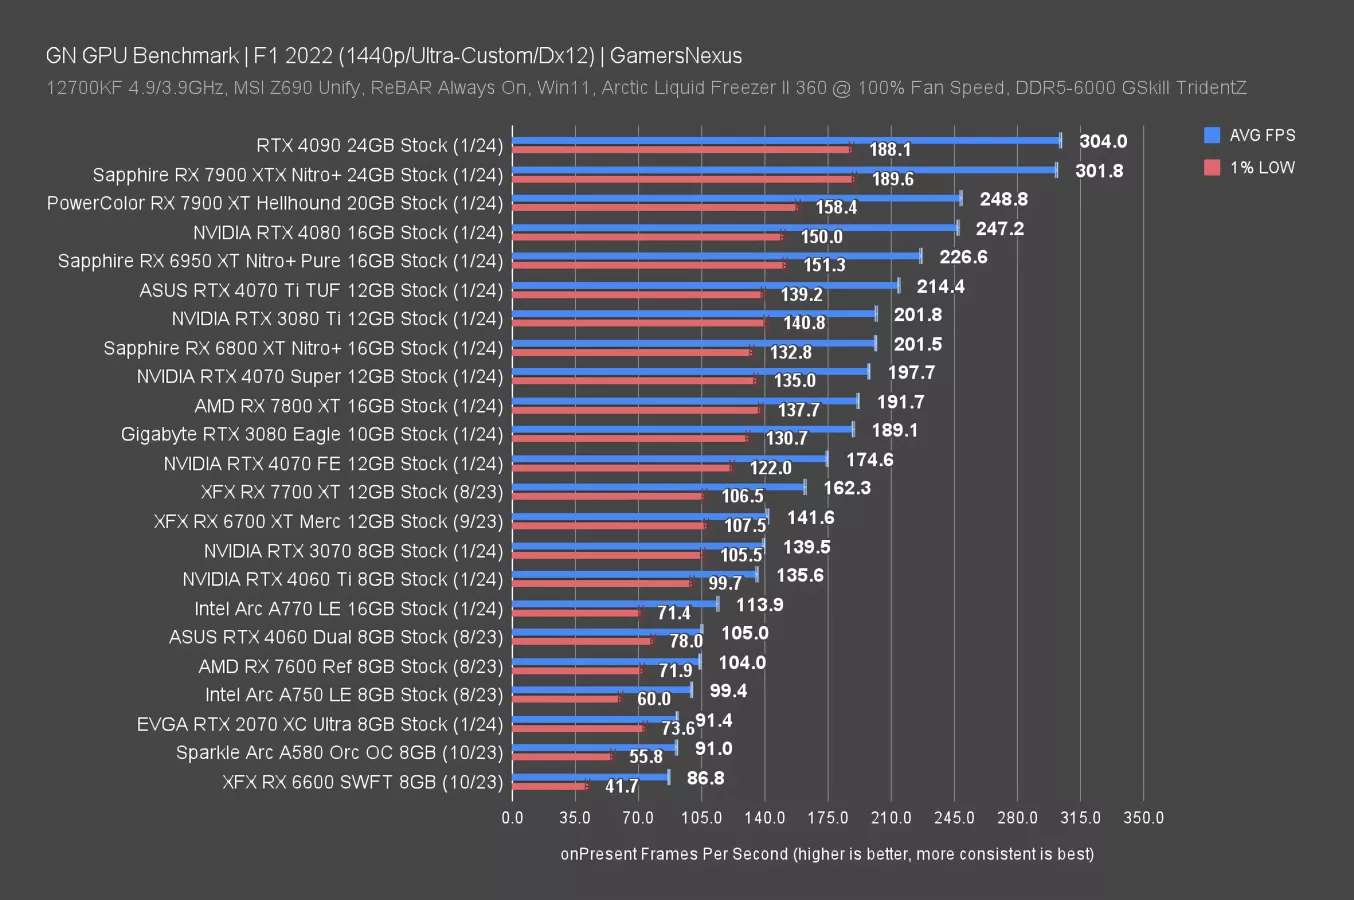
At 1440p, F1 had the 4070 Super at 198FPS AVG, with still plenty of headroom for higher framerate. That allows the 4070 Ti a lead of 8.5%, with the 6950 XT the next GPU beyond that. Compared down the stack, the 4070 Super leads the 4070 FE by 13% and the 3070 by 42%, with an improvement over the 2070 by 116%.
The RTX 4070 Super would obviously not be worth upgrading from the original 4070. We also think owners of the 3070 should keep their cards unless really feeling limitations, as it’s still plenty capable. A multi-generational jump makes more sense here, like, say, from the 2070 or a 1070, the latter of which isn’t on this chart.
F1 2022 1080p Benchmarks
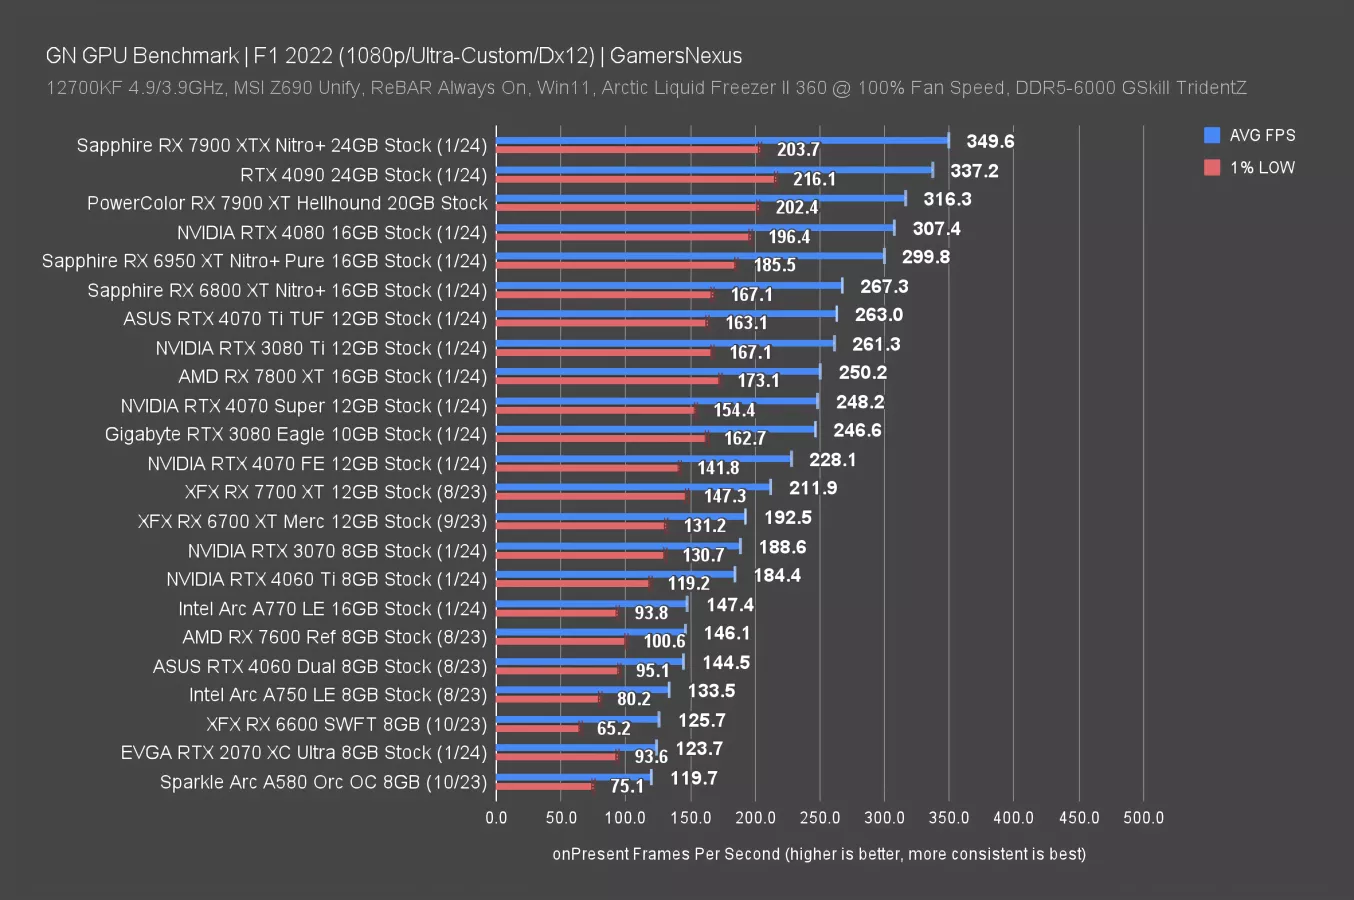
At 1080p, the top few cards are starting to hit external limitations -- but we still have plenty of room to improve on the 4070-series. The 4070 Ti leads the Super by 6%, which itself leads the original 4070 by 8.8% and the 3070 by 31.6%.
At 1080p, the 7800 XT pulls ahead of the RTX 4070 Super. AMD is scaling stronger here in some instances. Even the 3080 is right alongside the 4070 Super, with the 6800 XT ahead of both. The stack shuffled a bit at this resolution, which is one of the main reasons we test multiple resolutions: It can sometimes reveal architectural differences or an impact of difference choices the GPU manufacturers make, like in regards to memory bandwidth, for example.
Rainbow Six Siege
Rainbow Six Siege 4K Benchmarks
Rainbow Six Siege is next. This one will also appear for our latency testing.
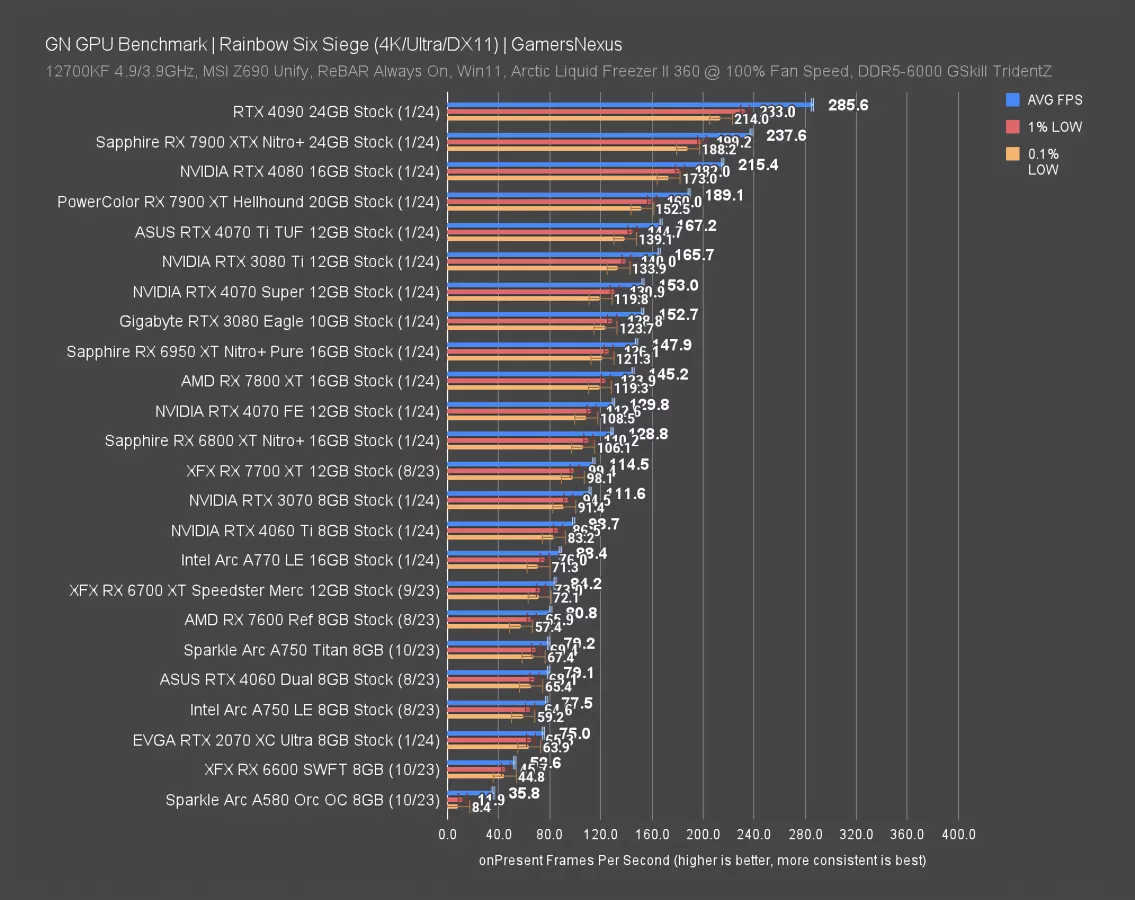
At 4K, the RTX 4070 Super held a 153 FPS AVG framerate, so the stack arranges like this for NVIDIA: The 4070 Ti is 9% ahead, the Super is ahead of the 4070 FE by 18%, and it’s ahead of the 3070 by 37%.
The lead against the 3070 is reduced versus Tomb Raider and Starfield, whereas the lead against the 4070 is increased marginally compared to F1, Tomb Raider, and Starfield. AMD’s alternatives include the 6950 XT at a reduced framerate compared to the 4070 Super. The 7900 XT pushes beyond the 4070 Ti, with the 4080 ahead of that, predictably. The 7800 XT increased its framerate by about 5FPS as compared to launch testing for us, helping improve its positioning but not changing the stack in a major way.
Rainbow Six Siege 1440p Benchmarks
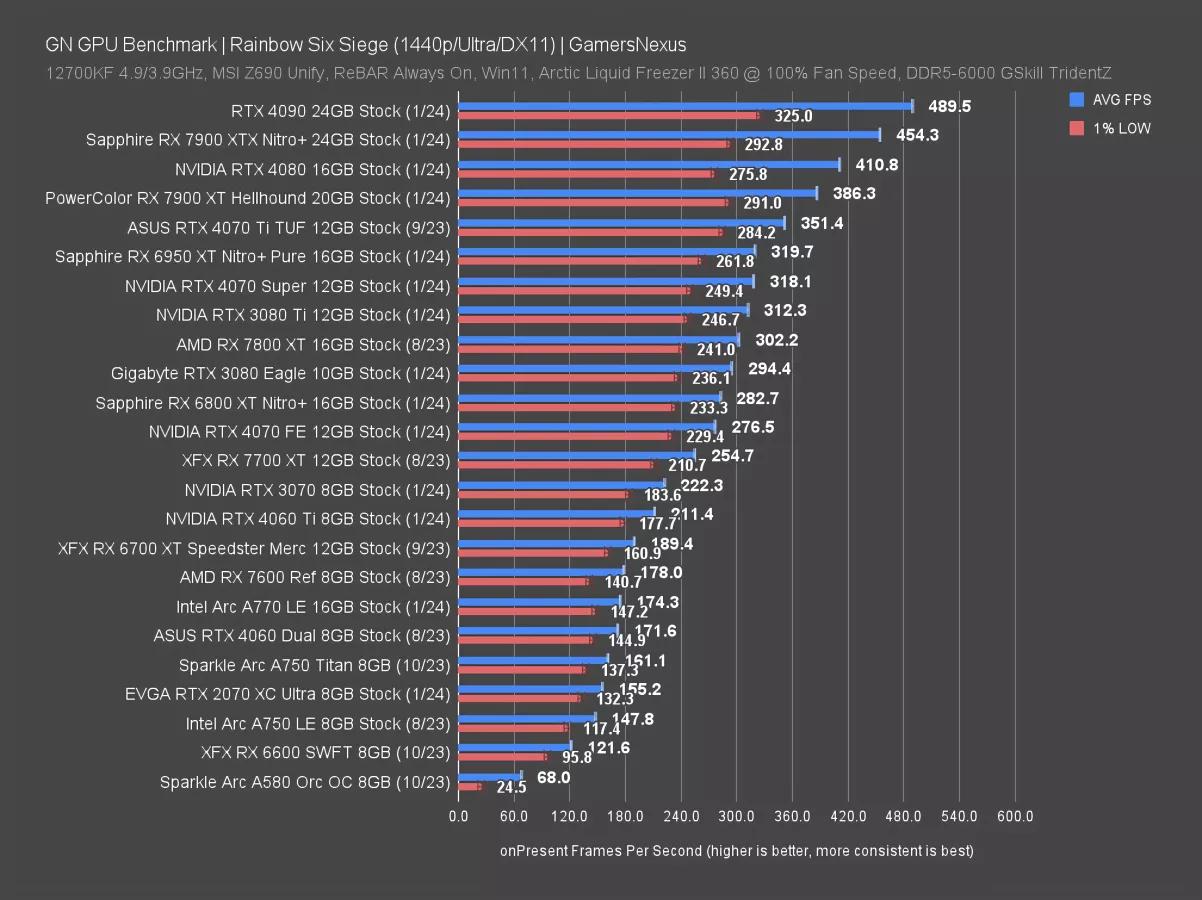
At 1440p, the RTX 4070 Ti’s 351 FPS AVG still has plenty of room before the ceiling, established at 490 FPS by the 4090 -- and even that’s not the full limit. That has the 4070 Ti 10.5% ahead of the 4070 Super, about the same as we saw in previous tests. The 4070 Super led the 4070 by 15%, also about the same as we’ve seen, and the Super is 43% over the RTX 3070.
Not much has moved here. The 4070 Super’s relative rank is similar in this test as before. It’s just ahead of the 3080 Ti and behind the 6950 XT.
Resident Evil 4
Resident Evil 4 4K Benchmarks
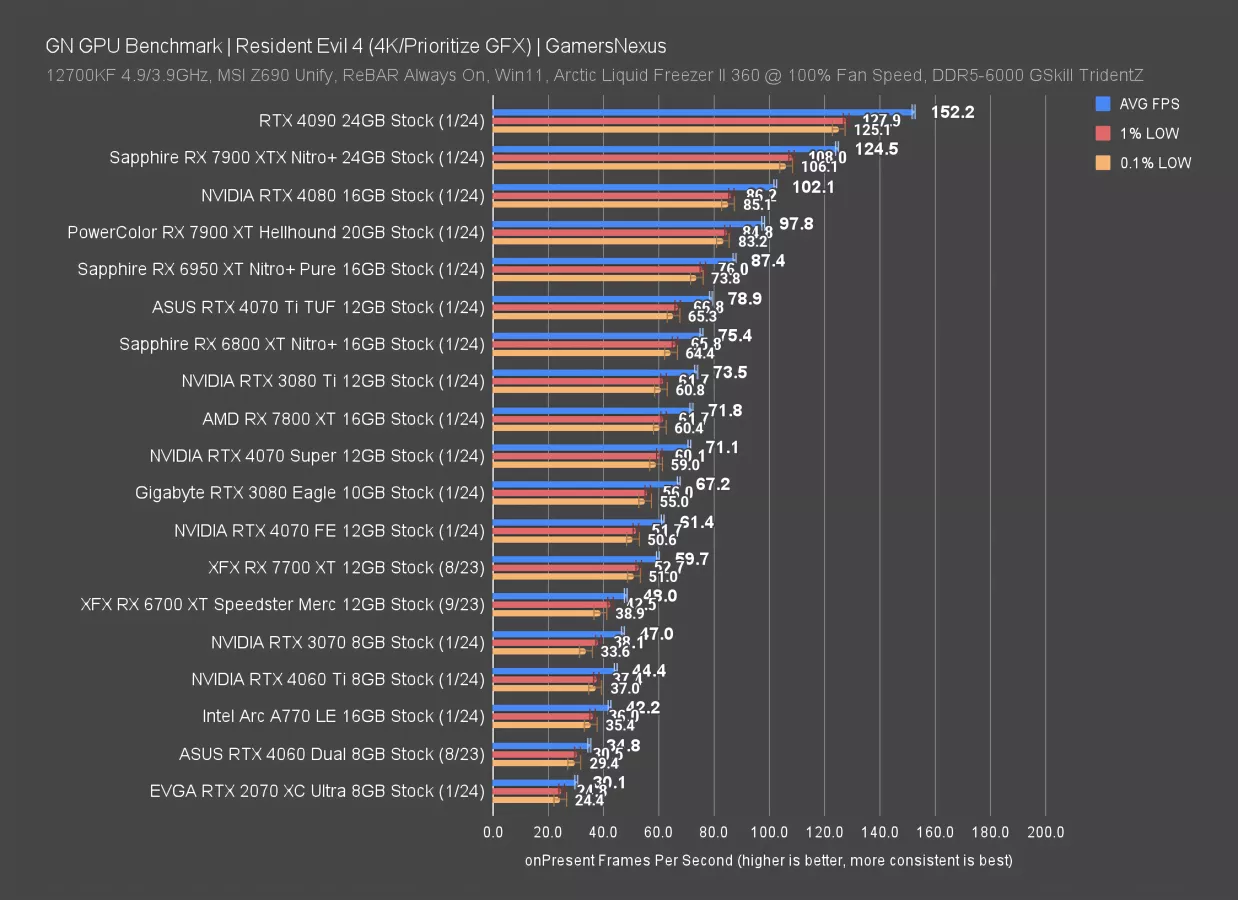
Up next, Resident Evil 4. We added this one within the past 6 months.
At 4K, the RTX 4070 Super’s 71 FPS AVG has the card sandwiched between the 3080 and 7800 XT, with the 6800 XT ranking just ahead of that. The relative scaling has the 4070 Ti’s 79 FPS AVG about 11% over the 4070 Super, with the Super almost 16% improved from the original 4070 and 51% over the RTX 3070.
AMD’s 7800 XT gives cheaper competition in this raster test, roughly tying the 4070 Super while costing $100 less. The 4080 Super will be a big competitor here though, potentially challenging the 7900 XTX’s position in price and performance once it launches.
Resident Evil 4 1440p Benchmarks
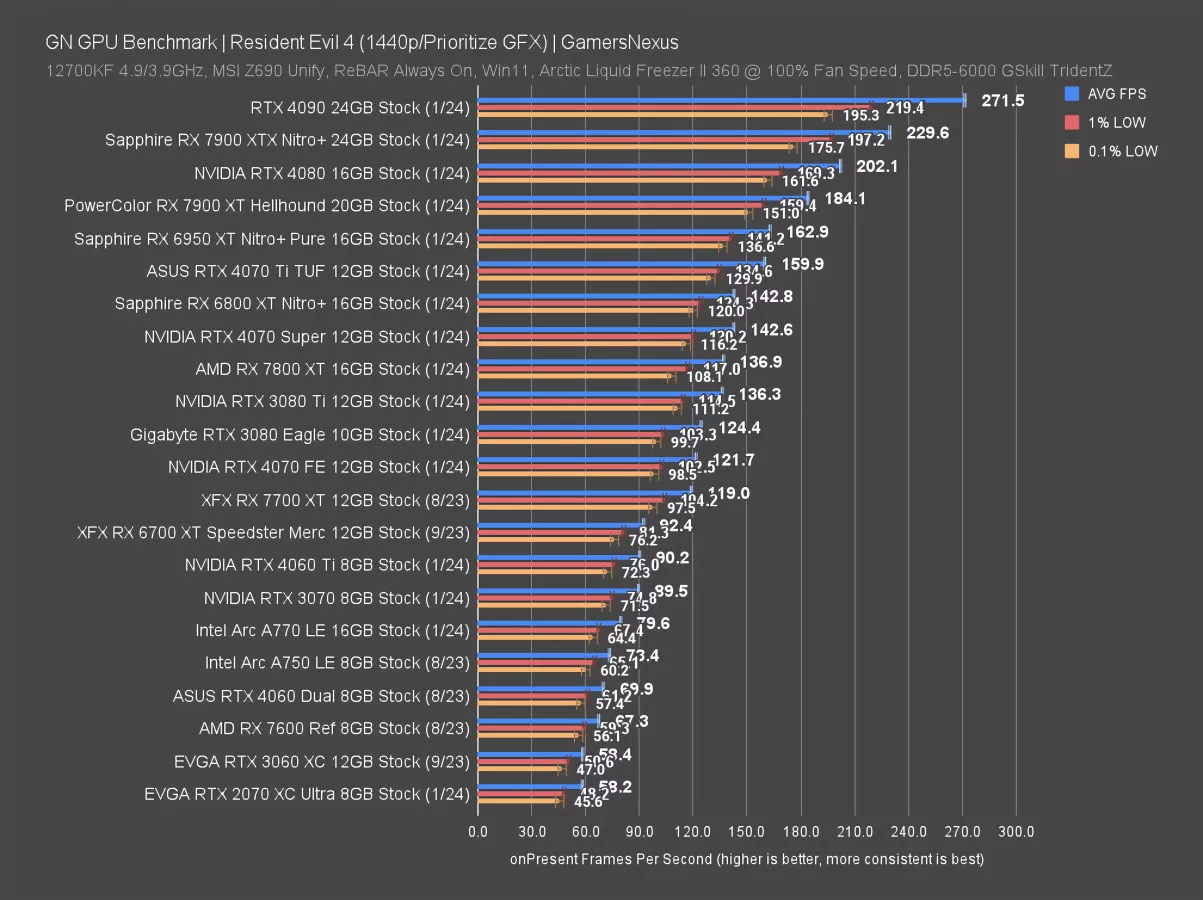
At 1440p, the 4090 illustrates that we have plenty of room to measure the 70-class cards and establishes a large gap between itself and the next card down, which is the 7900 XTX.
The RTX 4070 Ti’s 160 FPS AVG has it 12% ahead of the 4070 Super, which itself is 17% ahead of the 4070 and 59% improved over the 3070.
AMD’s 7800 XT is slower than the 4070 Super here, though not by a meaningful amount when rasterized, and the 7900 XT again outperforms the new Super card.
Resident Evil 4 1080p Benchmarks
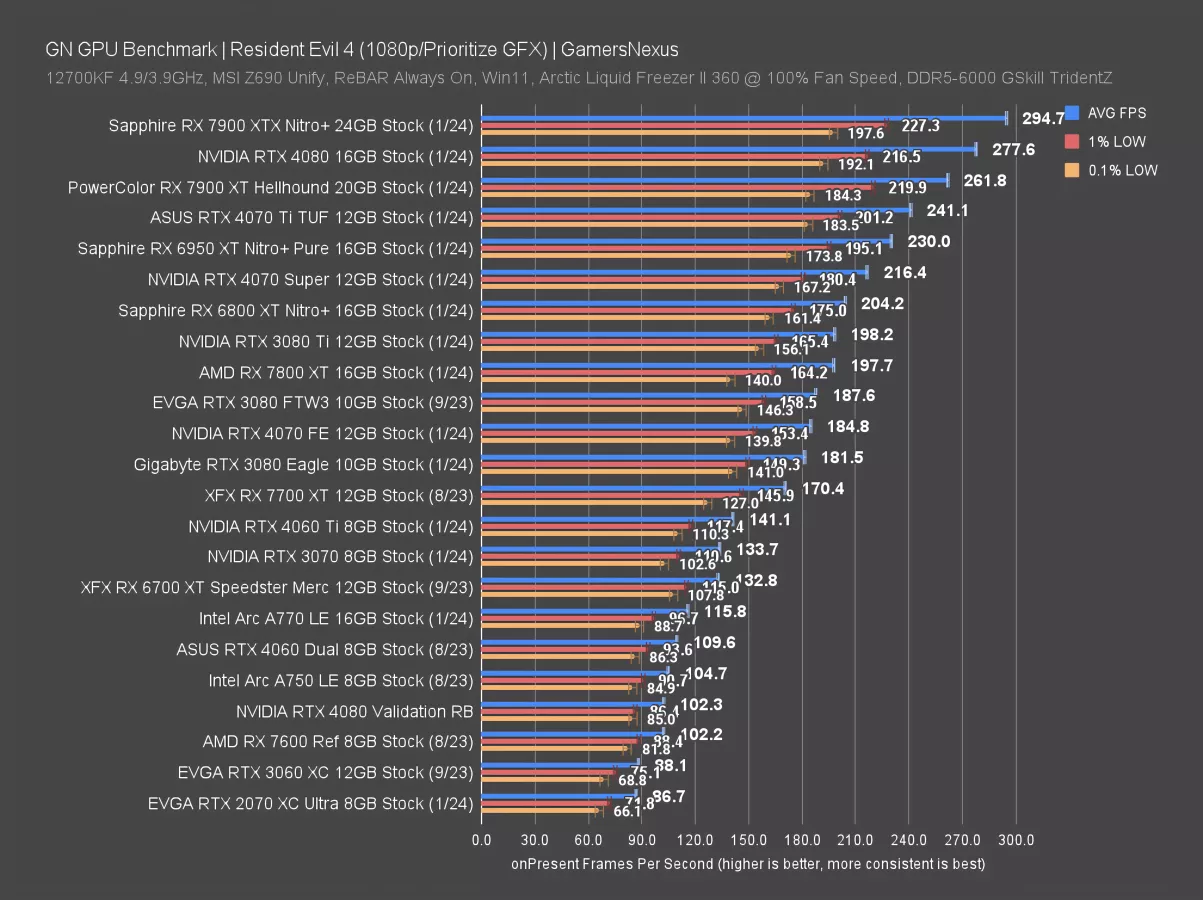
At 1080p, the 7900 XTX sets our ceiling mark at almost 300 FPS AVG. The 4070 Ti has plenty of distance from that limiter, down at 241 FPS AVG and leading the 4070 Super’s 216 FPS result by 11.4%
As for the Super, it’s ahead of the 7800 XT by 9.5% this time, the 4070 FE by 17%, and ahead of the 3070 by 62%.
AMD’s 7800 XT ran below the 6800 XT in this one, as it does in a lot of games, at 198 FPS AVG. From the AMD side, the 7900 XT would offer a meaningful uplift, whereas the 6800 XT would come close, but doesn’t surpass the 4070 Super in this test.

Dying Light 2
Dying Light 2 4K Benchmarks
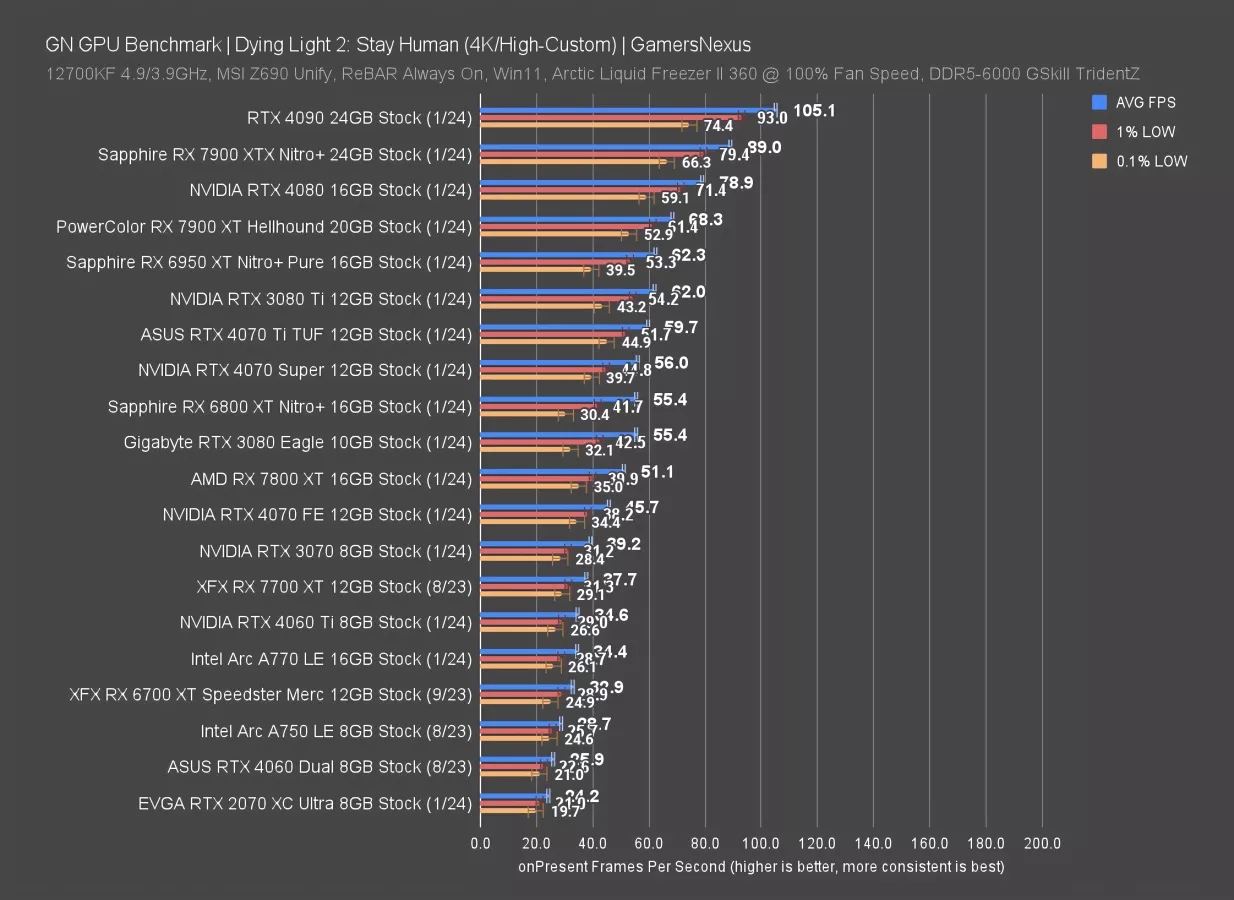
Now for Dying Light 2, another relatively new test addition. At 4K, the RTX 4070 Ti ran at about 60 FPS AVG, leading the 4070 Super by a reduced and uneventful 6.6%. The 4070 Super leads the 4070 FE by 22.5%, then the 3070 by 42.9%. That has the positioning against the 4070 a little higher than in other games, although still within a reasonable range.
The RX 7800 XT and 6800 XT encroach on the 4070 Super, with the 6800 XT basically equating it and providing an indistinguishable experience, while the 7900 XT again leads. This game is fairly heavy on all these cards, helping illustrate clean scaling from one to the next. The 4080 is about 41% ahead of the 4070 Super, so we’re looking forward to seeing how close to the 4090 the 4080 Super will be to each other.
Dying Light 2 1440p Benchmarks
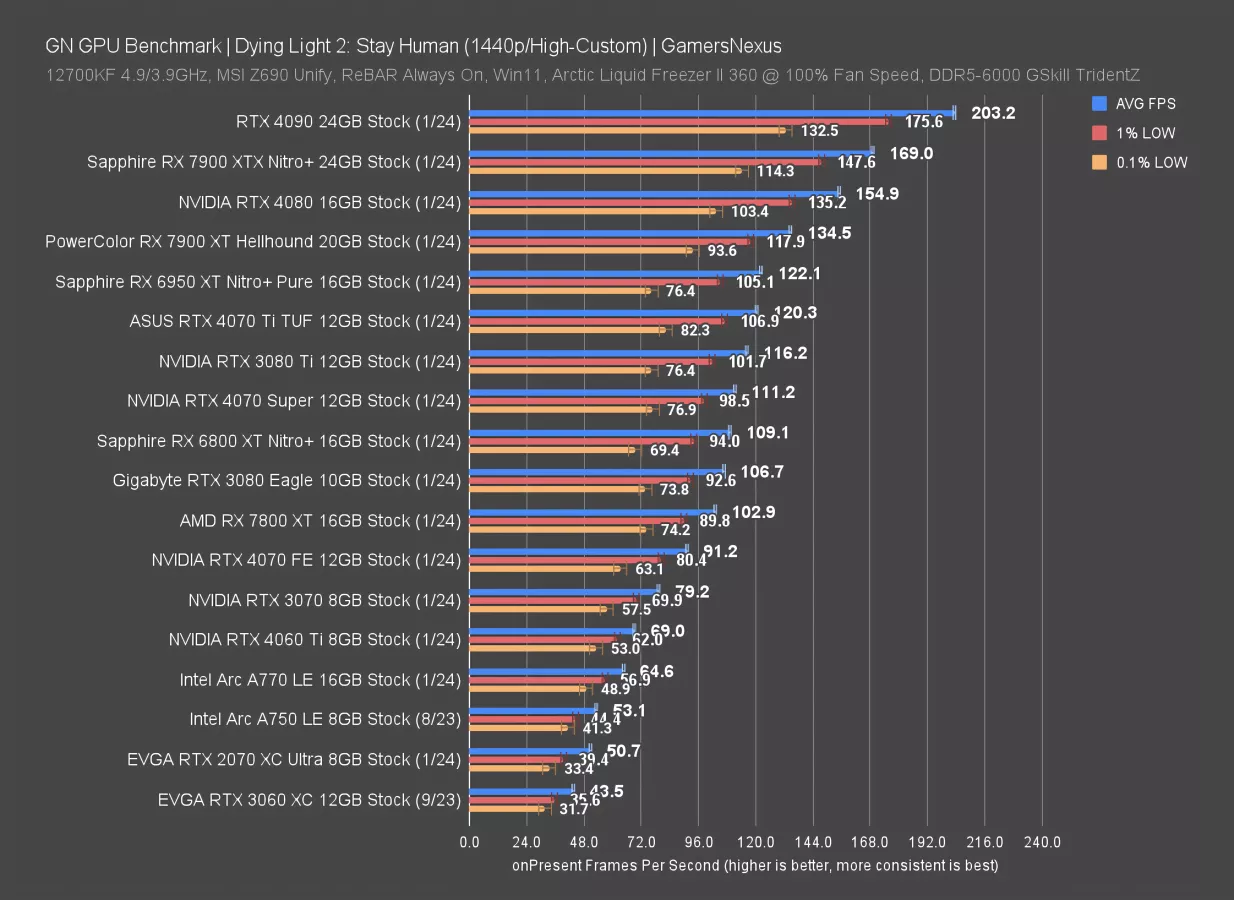
At 1440p, the RTX 4070 Super’s 111 FPS AVG result has it about tied with the 6800 XT again, or leading the 7800 XT by 8%. The 4070 Ti runs 8.2% ahead of the 4070 Super, with the Super ahead of the original 4070 by 22% and ahead of the 3070 by 40%.
Again, AMD’s most direct price competitor would be the 800 XT class cards, with the 7900 XT being the next price and performance class up.
Dying Light 2 1080p
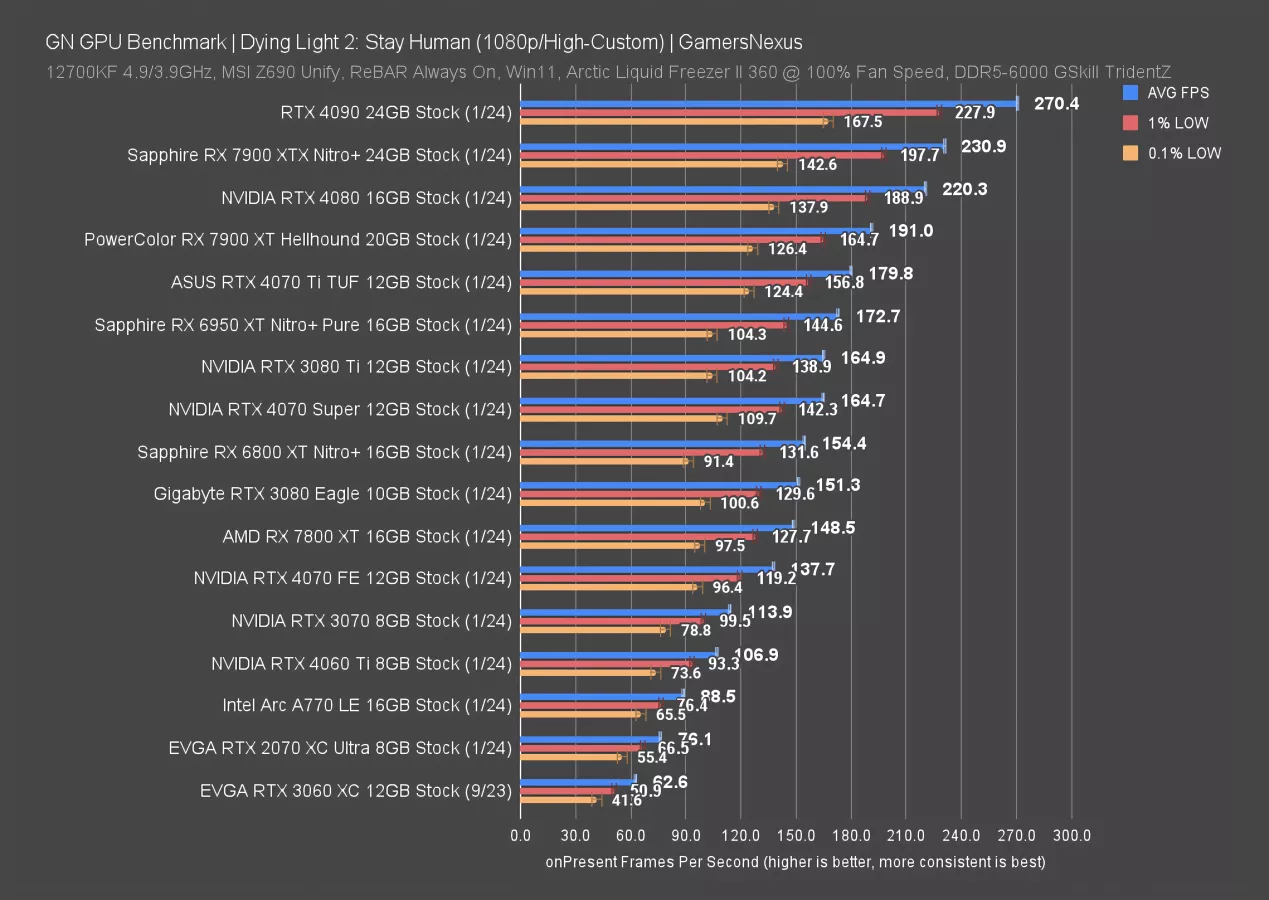
At 1080p, scaling has slightly improved for the 4070 Ti, now at 9.2% ahead of the 4070 Super. That’s consistently increasing the gap as resolution decreases, although not meaningfully. The gap against the 4070, meanwhile, has diminished by about 1 percentage point per resolution change, now at 19.6%. As for the 3070, the 4070 Super is about 45% ahead of that. AMD’s 6950 XT and 6800 XT remain the closest flanks to the 4070 Super.
FFXIV
FFXIV 4K Benchmarks
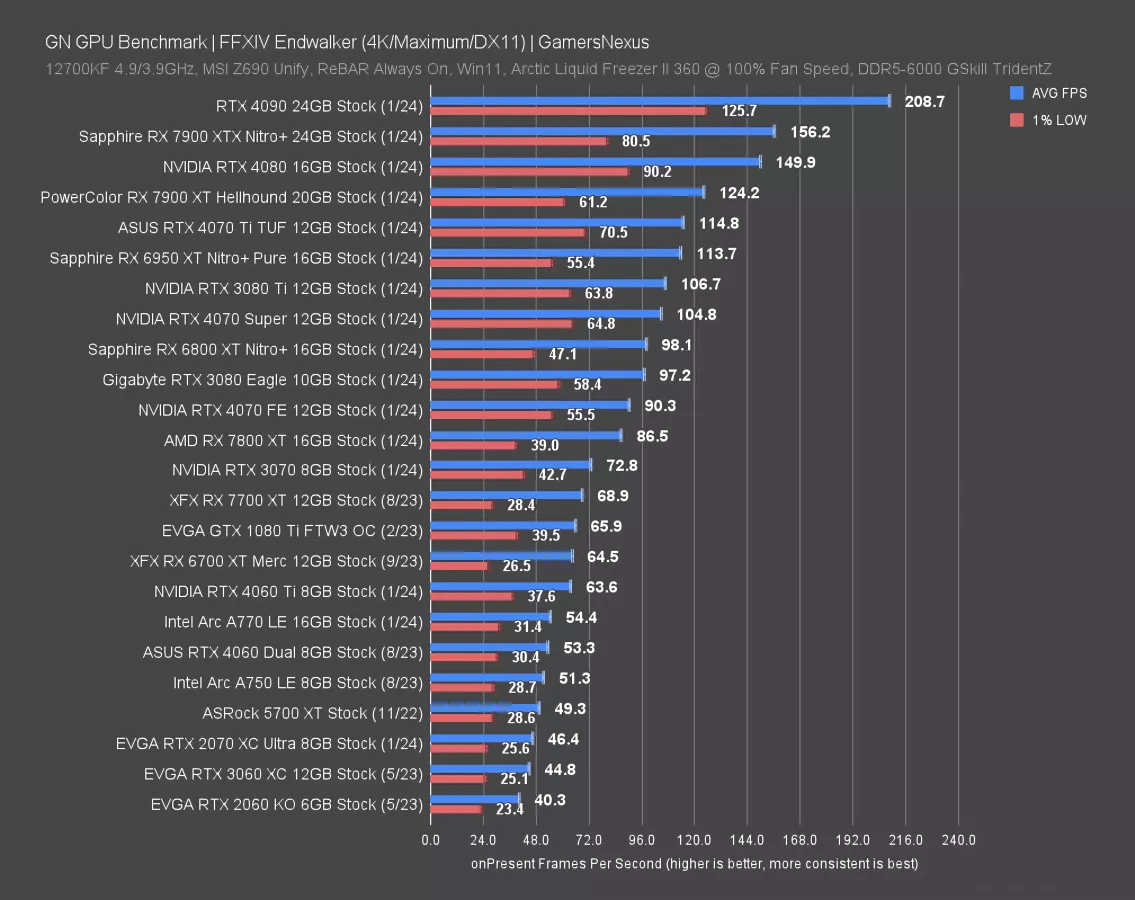
For Final Fantasy 14, which has been one of the most reliable GPU benchmarks we’ve used in a while. At 4K, the RTX 4070 Ti’s 115 FPS AVG had it just behind the 7900 XT and 9.5% ahead of the 4070 Super. That’s right in-line with what we’ve seen in the other games. The 4070 Super leads the original 4070 by 16%, which is a relatively large gap if these cards are only within $50. NVIDIA establishes an upsell by keeping the 4070 on the market while perhaps putting some pressure on AMD’s $500 price class. The lead over the 3070 by the Super is 44%, again mostly in-line with what we’ve seen elsewhere. The pattern has formed.
Compared to AMD, the 6800 XT remains one of the most competitive options at the price, with the 7800 XT dragging unfortunately behind it. The 6950 XT outperforms the 4070 Super, but is rarely available new these days. We saw a few first-party listings holding on for $600, but they’re dwindling.
AMD’s lows remain slightly lower than the scaling set by NVIDIA here, although not in a way that ruins the experience.
FFXIV 1440p Benchmarks
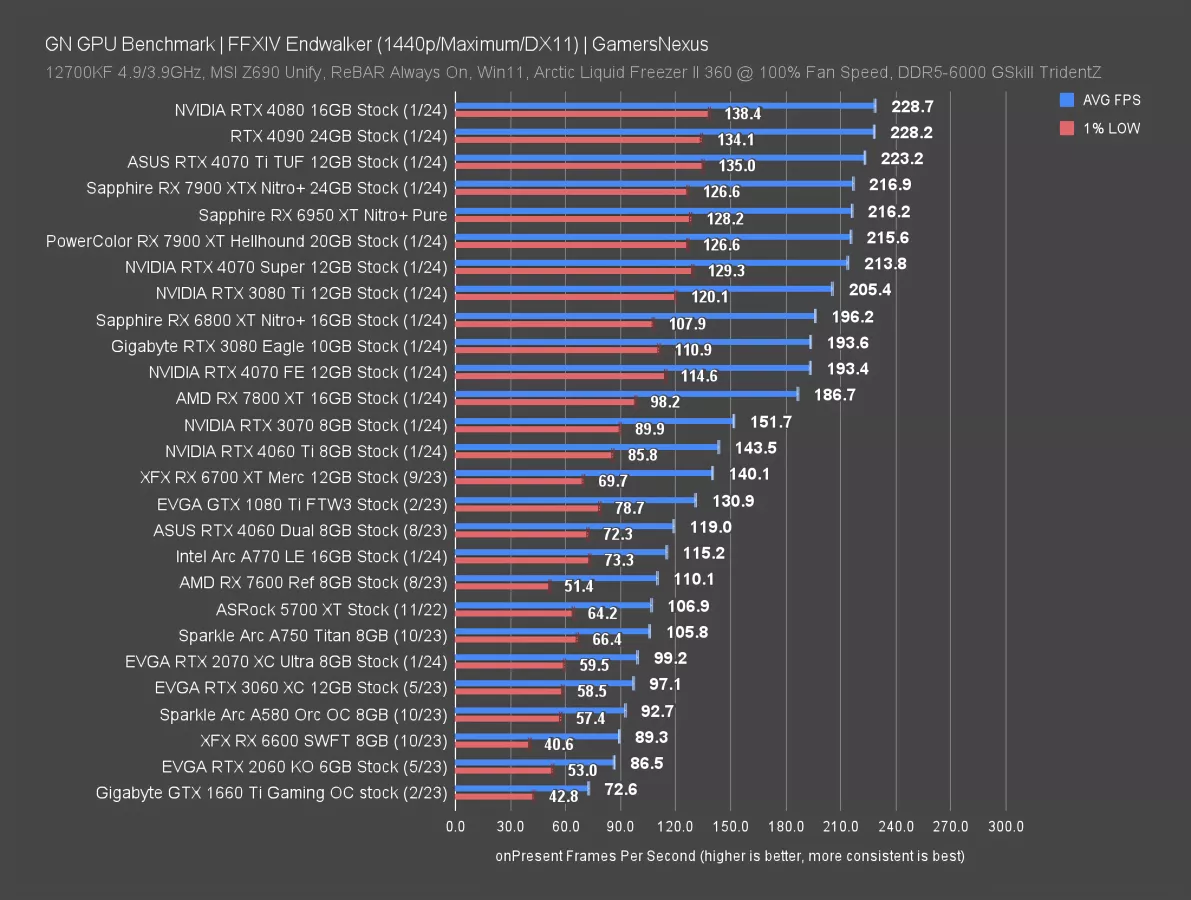
At 1440p, we’re CPU-bound on everything ranked 4070 Super and above. This isn’t a useful test, so let’s move on.
GTA V
GTA V 4K Benchmarks
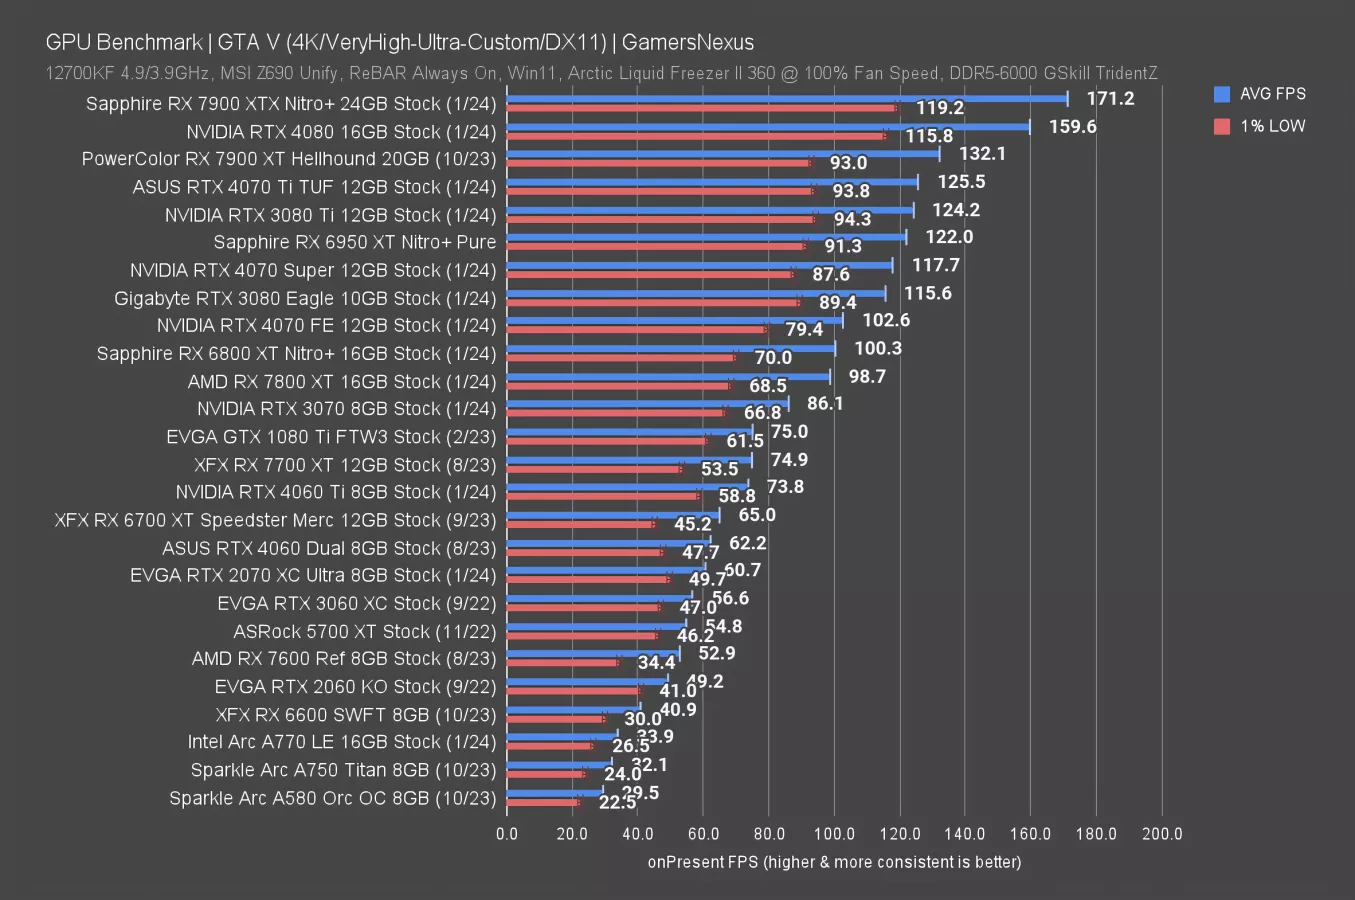
We ran GTA V at 4K for old time’s sake. Somehow, there’s still scaling with our test settings. The 4070 Ti leads the 4070 Super by 6.6%, with the 4070 Super about 15% over the 4070 FE and 37% ahead of the 3070. The gap between these cards is slightly smaller in this game than some of the others.
NVIDIA GeForce RTX 4070 Super Ray Tracing Tests
Now we're moving on to ray-tracing tests. These results aren't comparable to the previous non-RT charts unless, for some reason, you just wanted to compare RT to non-RT.
Ray Tracing - Dying Light 2: Stay Human
Ray Tracing - Dying Light 2: Stay Human 4K Benchmarks
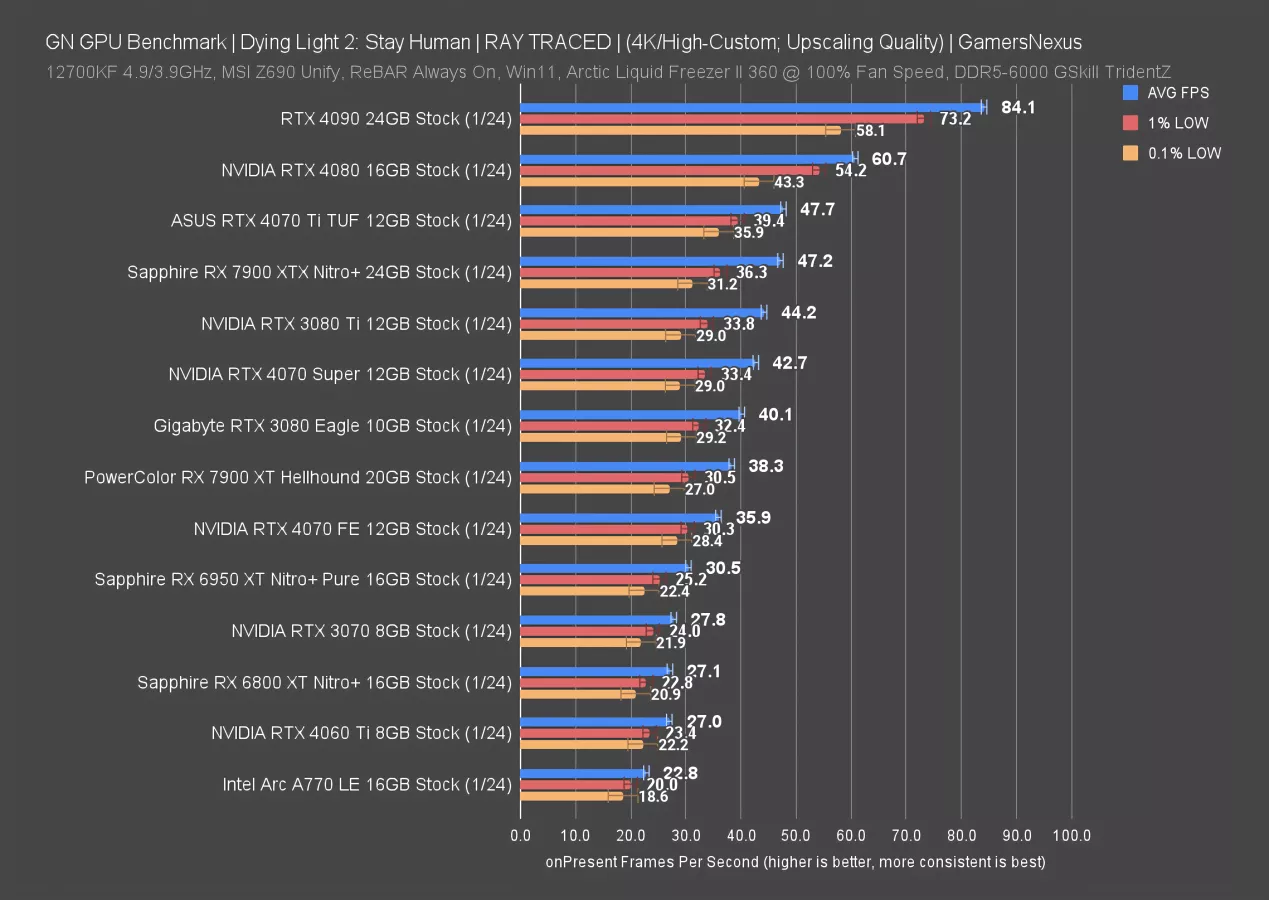
In Dying Light 2 with high RT and DLSS quality or equivalent settings for FSR and XeSS, we end up with this chart. The RTX 4070 Super held 43 FPS AVG here, showing that these cards actually need upscaling to run with these settings. The 4070 Ti leads it by 12%, with the Super card leading the 4070 FE by 19% and the 3070 by 54%. These numbers are similar to what we saw when rasterized, painting no meaningful deviation between these NVIDIA devices with RT and DLSS. The AMD cards tumble down the stack some more, with the 7900 XTX now equivalent to the 4070 Ti and the 7900 XT closer to the 3080 when both are using upscaling.
Ray Tracing - Dying Light 2: Stay Human 1440p Benchmarks
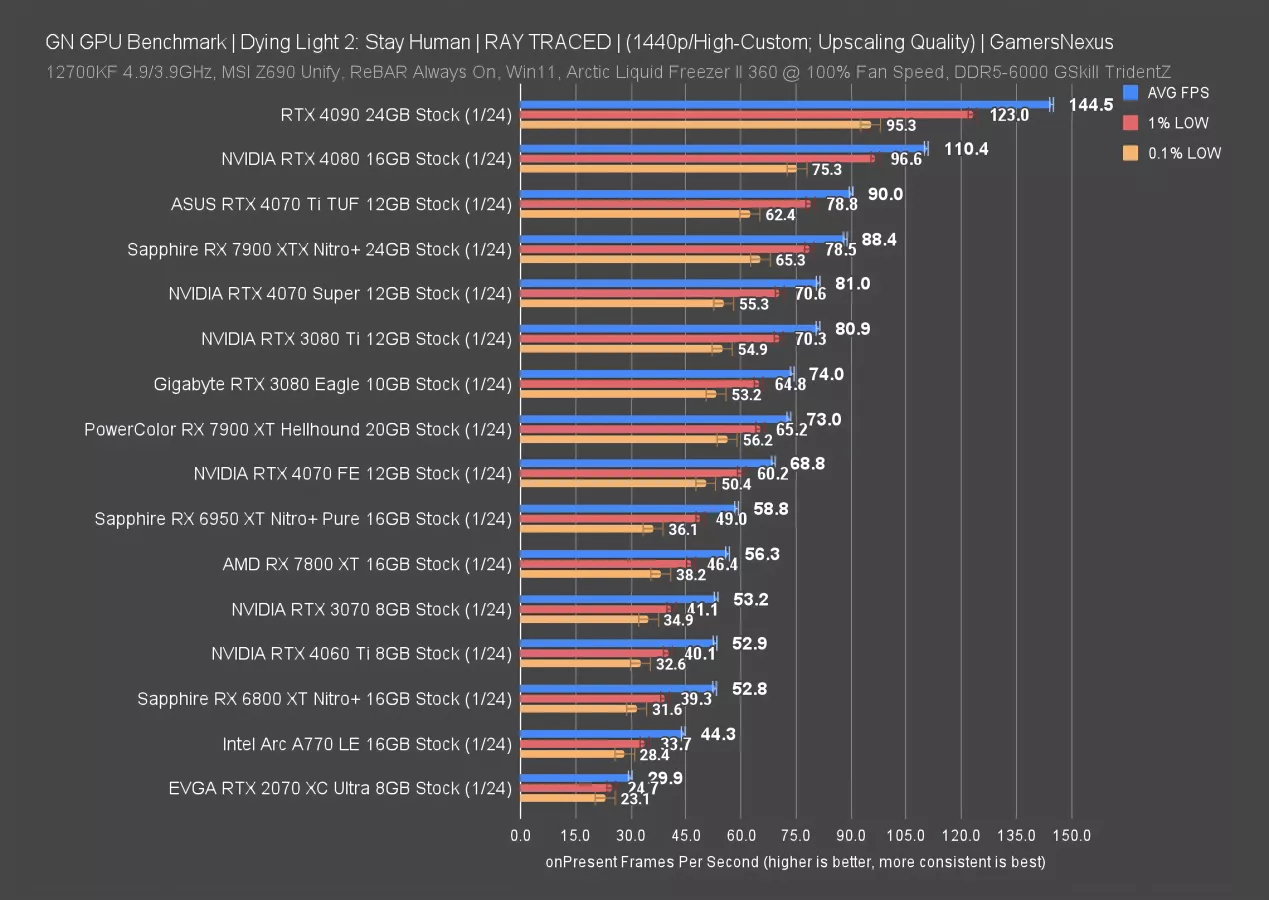
At 1440p, the RTX 4070 Ti climbs to 90 FPS AVG, now a much better framerate, leading the 4070 Super by 11%, which leads the 4070 FE by 18% and 3070 by 52%. Again, these are about the same as we saw in rasterization. Unlike in rasterization, AMD falls behind a little bit here: The 7900 XTX is about the same as the 4070 Ti for performance, with the 7900 XT closer to the 3080 again. The 6800 XT ends up closer to the forlorn 4060 Ti 8GB.
Ray Tracing - Dying Light 2: Stay Human 1080p Benchmarks
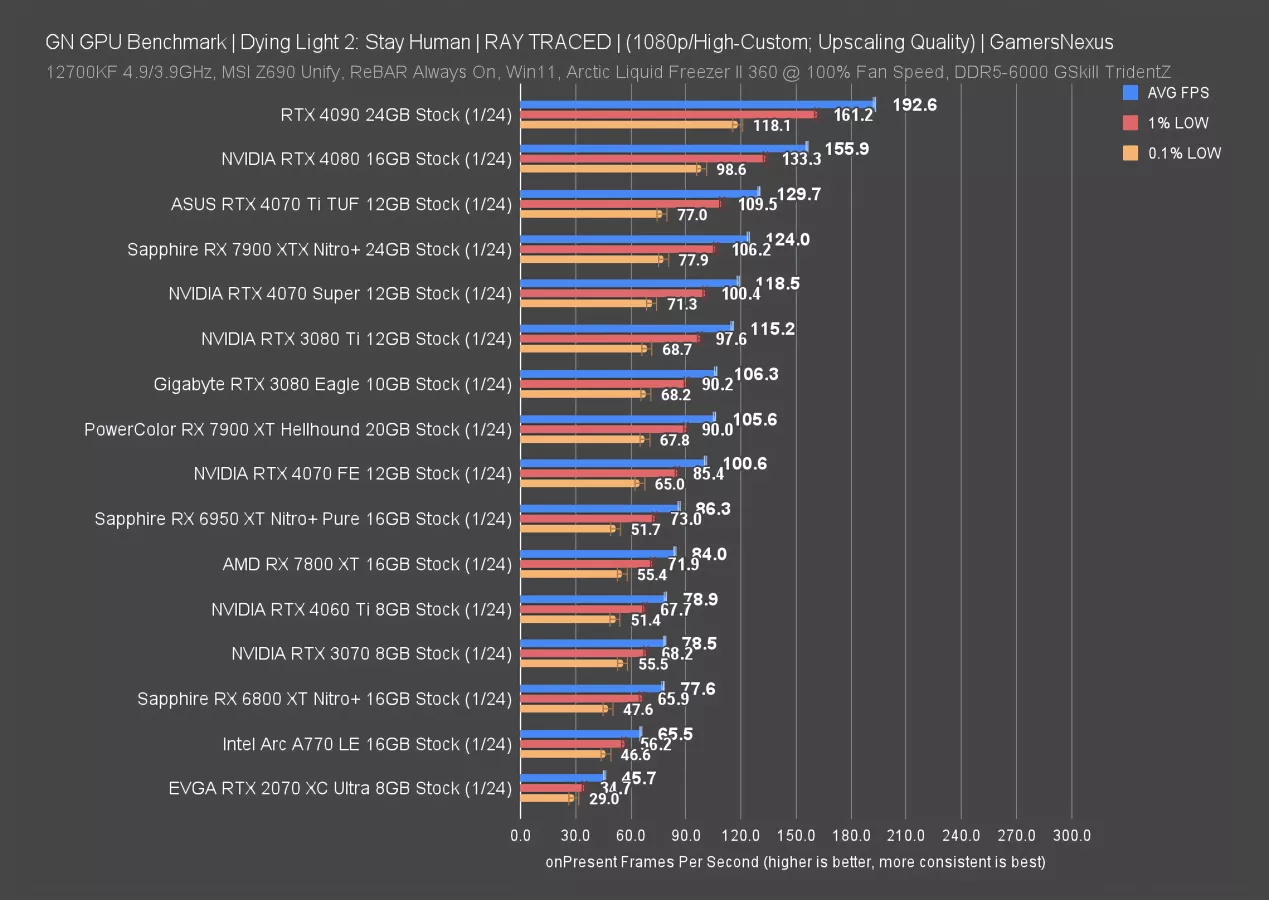
Finally, at 1080p, the 4070 Ti runs at 130 FPS AVG, leading the 4070 Super by just 9.5%, The 4070 Super is 18% ahead of the 4070 and 51% ahead of the 3070 once again. AMD’s 7900 XTX runs just behind the 4070 Ti and ahead of the 4070 Super.
Ray Tracing Resident Evil 4
Ray Tracing Resident Evil 4 4K Benchmarks
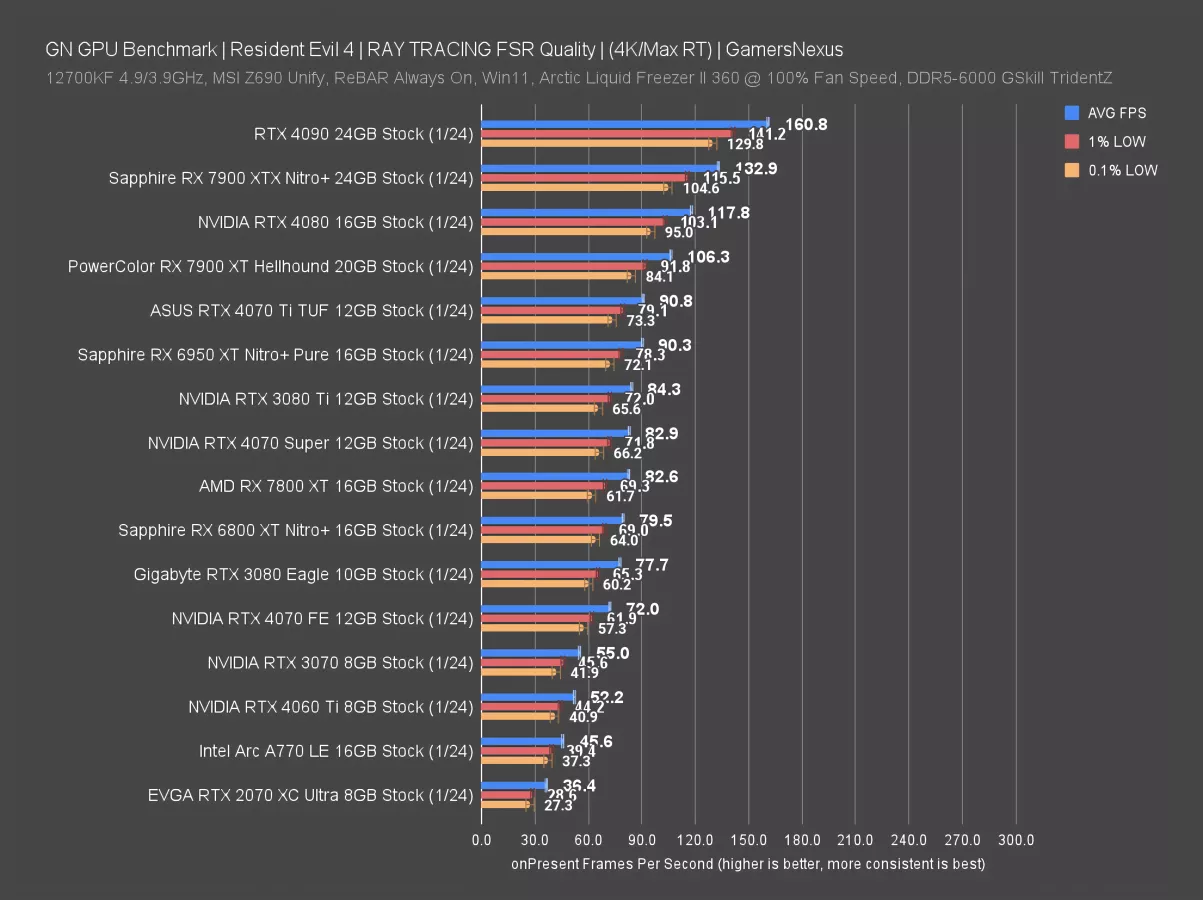
This one uses FSR on all cards. The RTX 4070 Super ran at 83 FPS AVG here, about tied with the 7800 XT and 3080 Ti. AMD is doing a little better in this one. The 7900 XTX now leads the 4070 Ti, the latter of which runs at 91 FPS AVG and leads the 4070 Super by 9.5%.
Ray Tracing Resident Evil 4 1440p Benchmarks
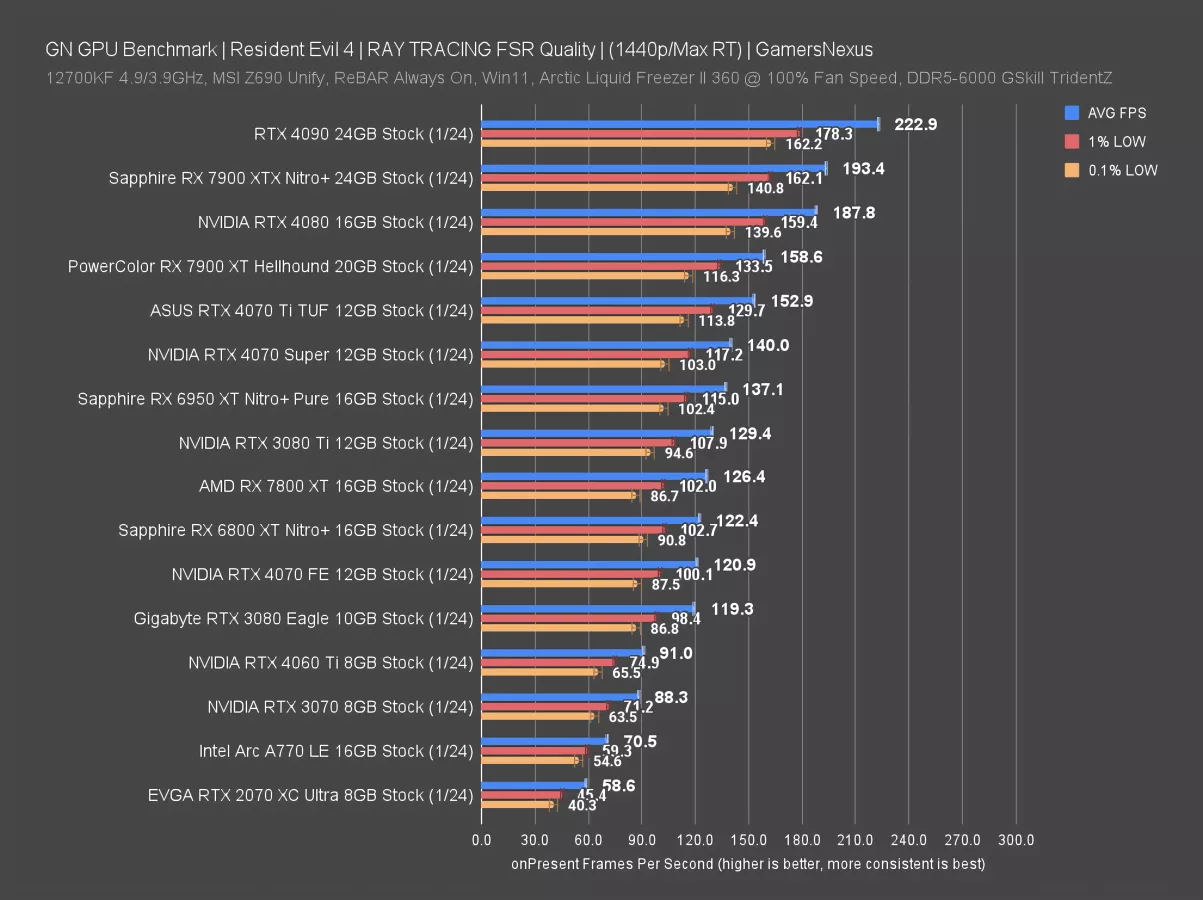
The 4070 Ti leads the 4070 Super by 9% here, with the 6800 XT and 7800 XT closer to the 4070 baseline. They held more of a lead over it at upscaled 4K.
Ray Tracing Resident Evil 4 1080p Benchmarks
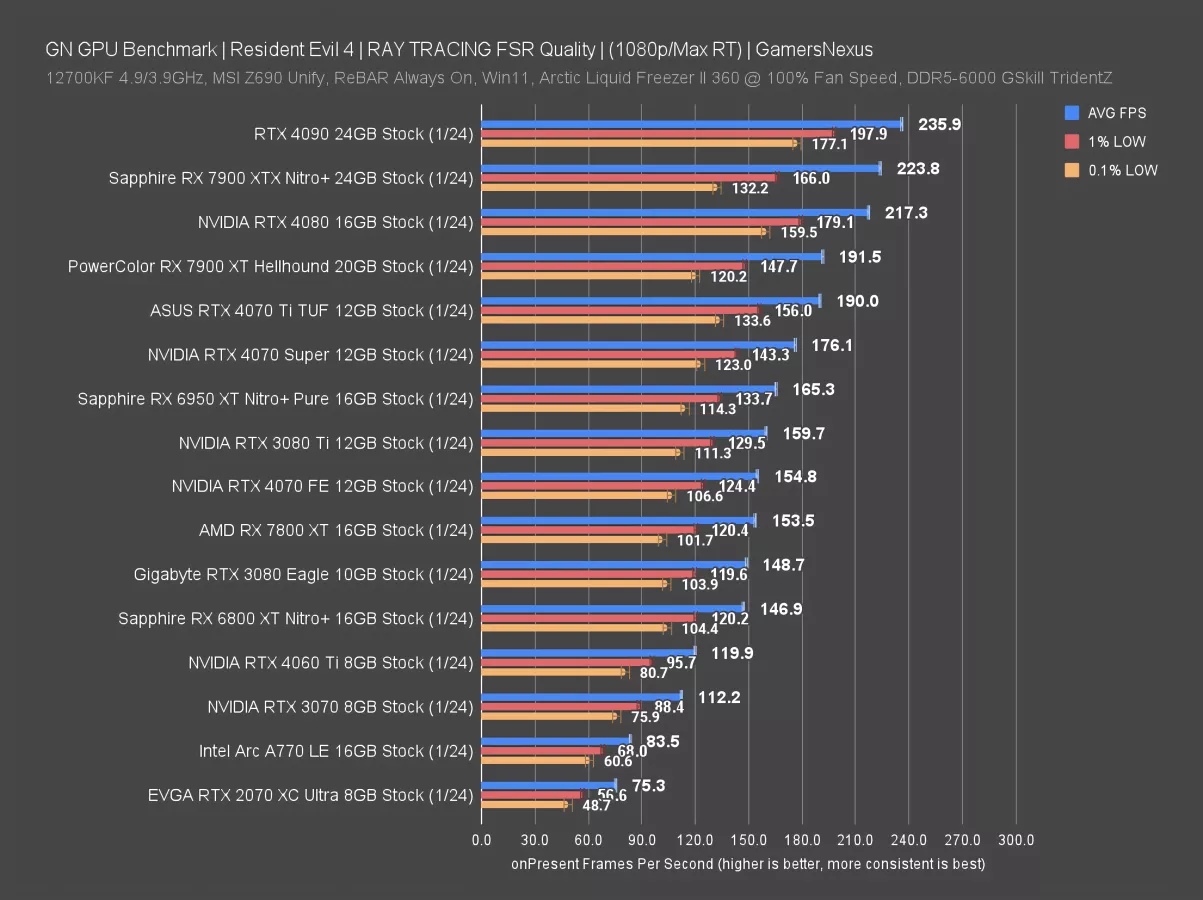
At 1080p, we’re mostly interested in what trend emerges. Here, the 7900 XTX pushes further ahead, with the 7900 XT now about tied with the 4070 Ti. The 4070 Ti leads the 4070 Super by 8%, with the Super leading the 4070 by 14% and 3070 by 57%. The 7800 XT is about equal with the baseline RTX 4070.
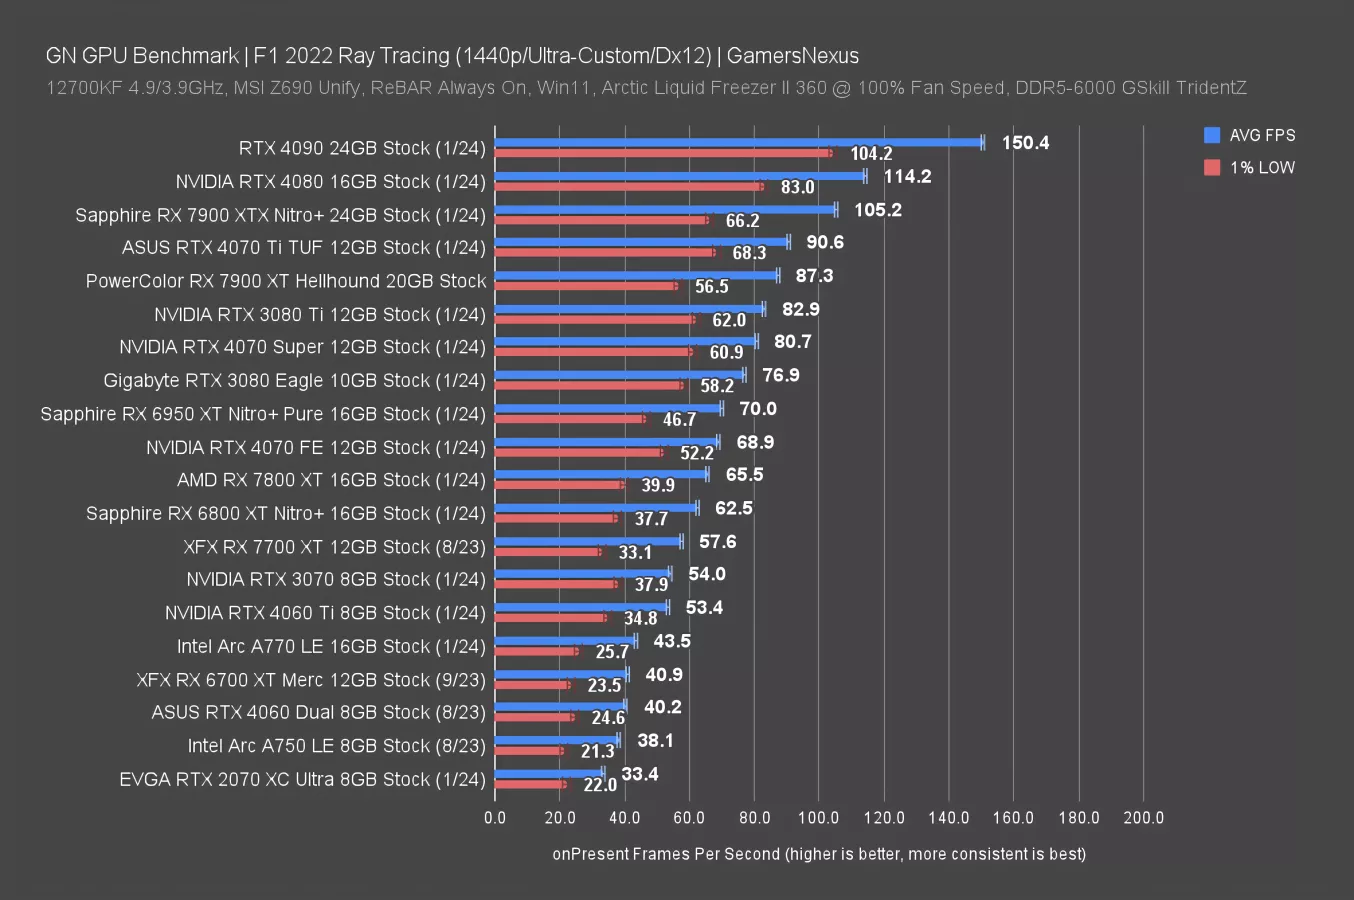
Ray Tracing F1
Ray Tracing F1 4K Benchmarks
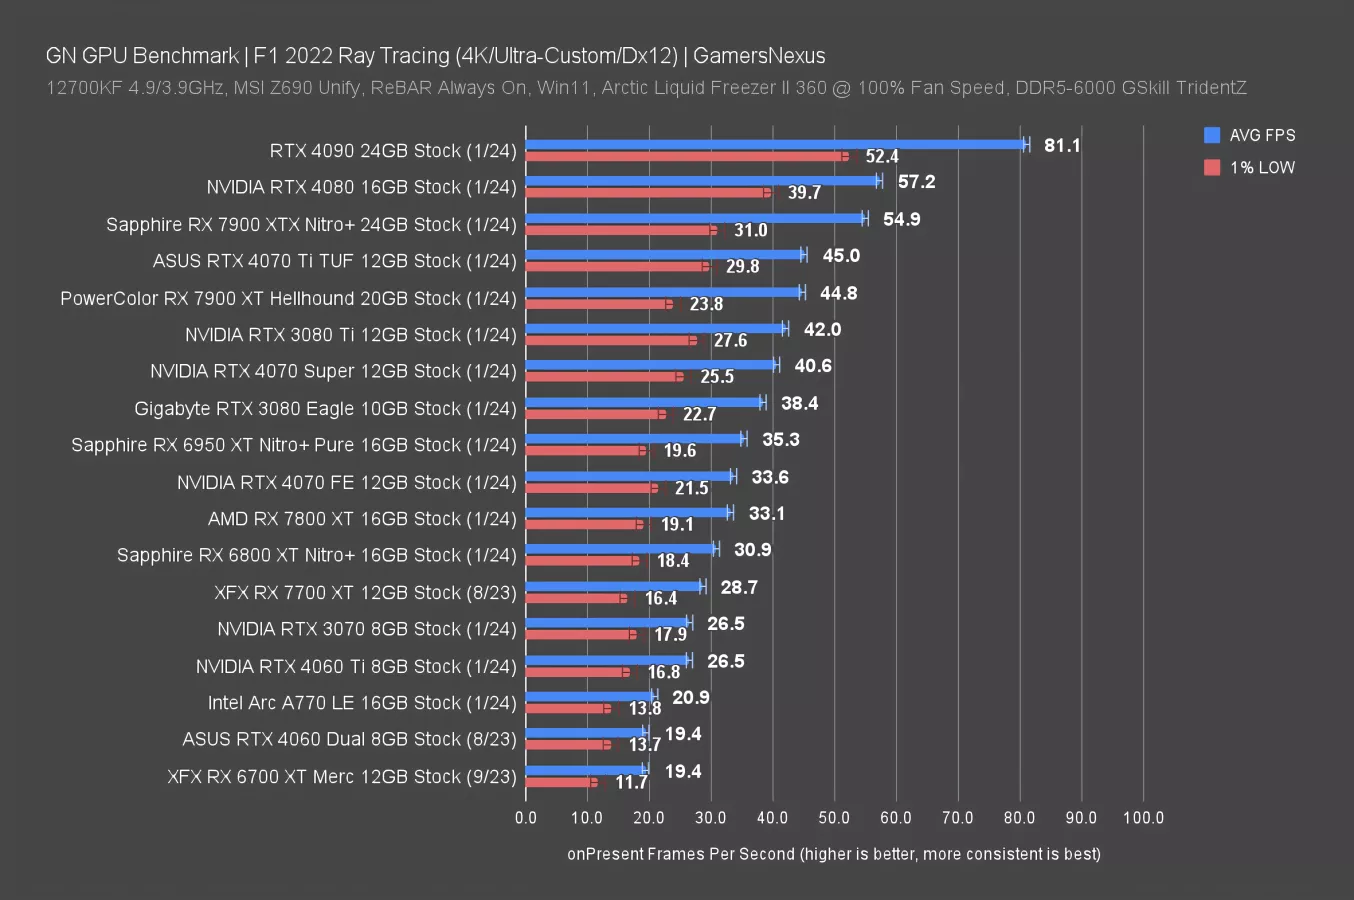
In F1 with ray tracing and without any upscaling, the RTX 4070 Super ran at 41 FPS AVG, or about tied with the 3080 Ti. The 4070 Ti’s 45FPS AVG doesn’t meaningfully distance these from an experience standpoint. Over the 4070 FE, it’s about a 21% advantage for the Super. AMD’s 7900 XT roughly equates the 4070 Ti, with the 6950 XT as AMD’s closest card to the 4070 Super. The 7800 XT is closer to a 4070 in 4K RT performance.
Ray Tracing F1 1440p Benchmarks
At 1440p, the 4070 Super keeps its lead over the $500 7800 XT and the former 6950 XT flagship, with the 7900 XT posting-up between the 4070 Ti and 4070 Super. The lead over the other 70-series cards is about the same as everywhere else.
NVIDIA GeForce RTX 4070 Super Power Consumption
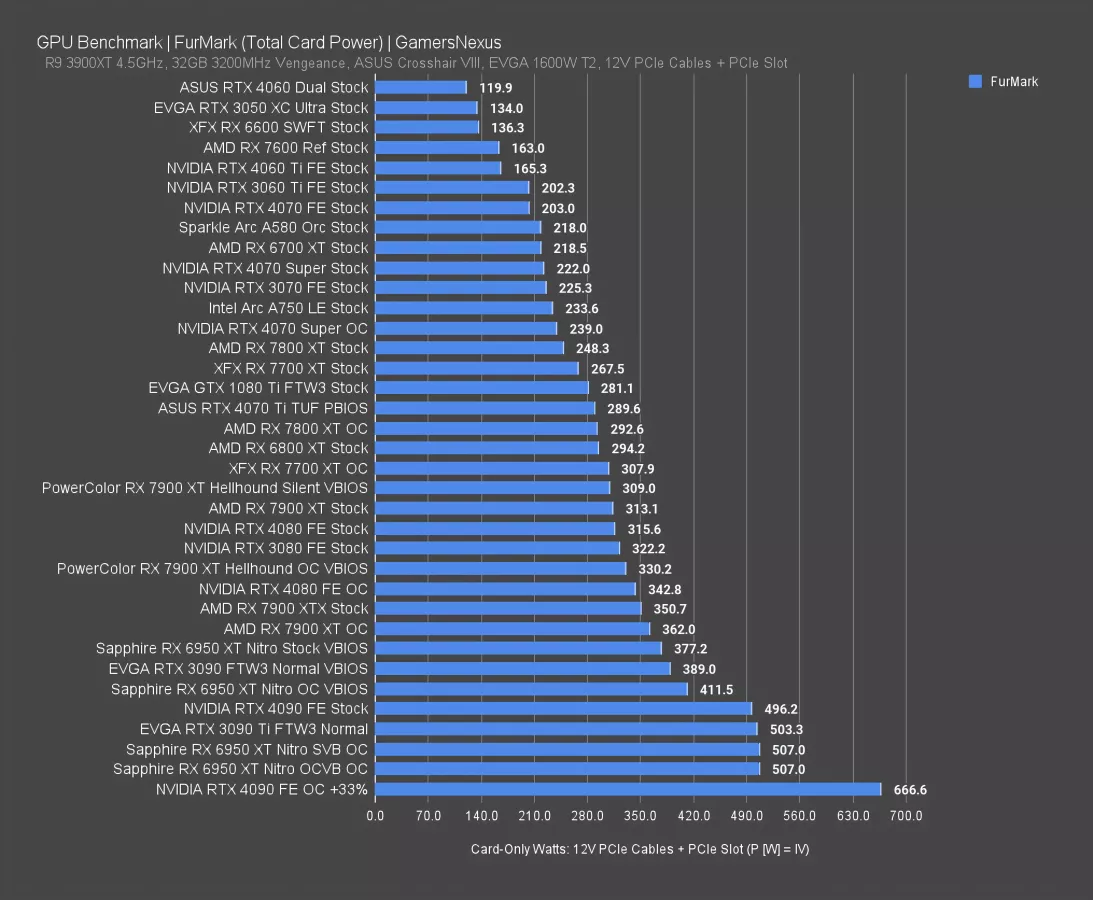
Power consumption is quick. In a total card workload, we found the 4070 Super to pull 222W at the PCIe rails, which has it about the same as a 3070 and about 20W more than the original 4070. That’s where part of the performance boost is coming from. Overclocking the 4070 Super puts it at 240W, which is just below AMD’s 7800 XT stock power consumption. NVIDIA remains overall efficient, despite the 20W bump from the 4070.
NVIDIA GeForce RTX 4070 Super Latency Benchmarks
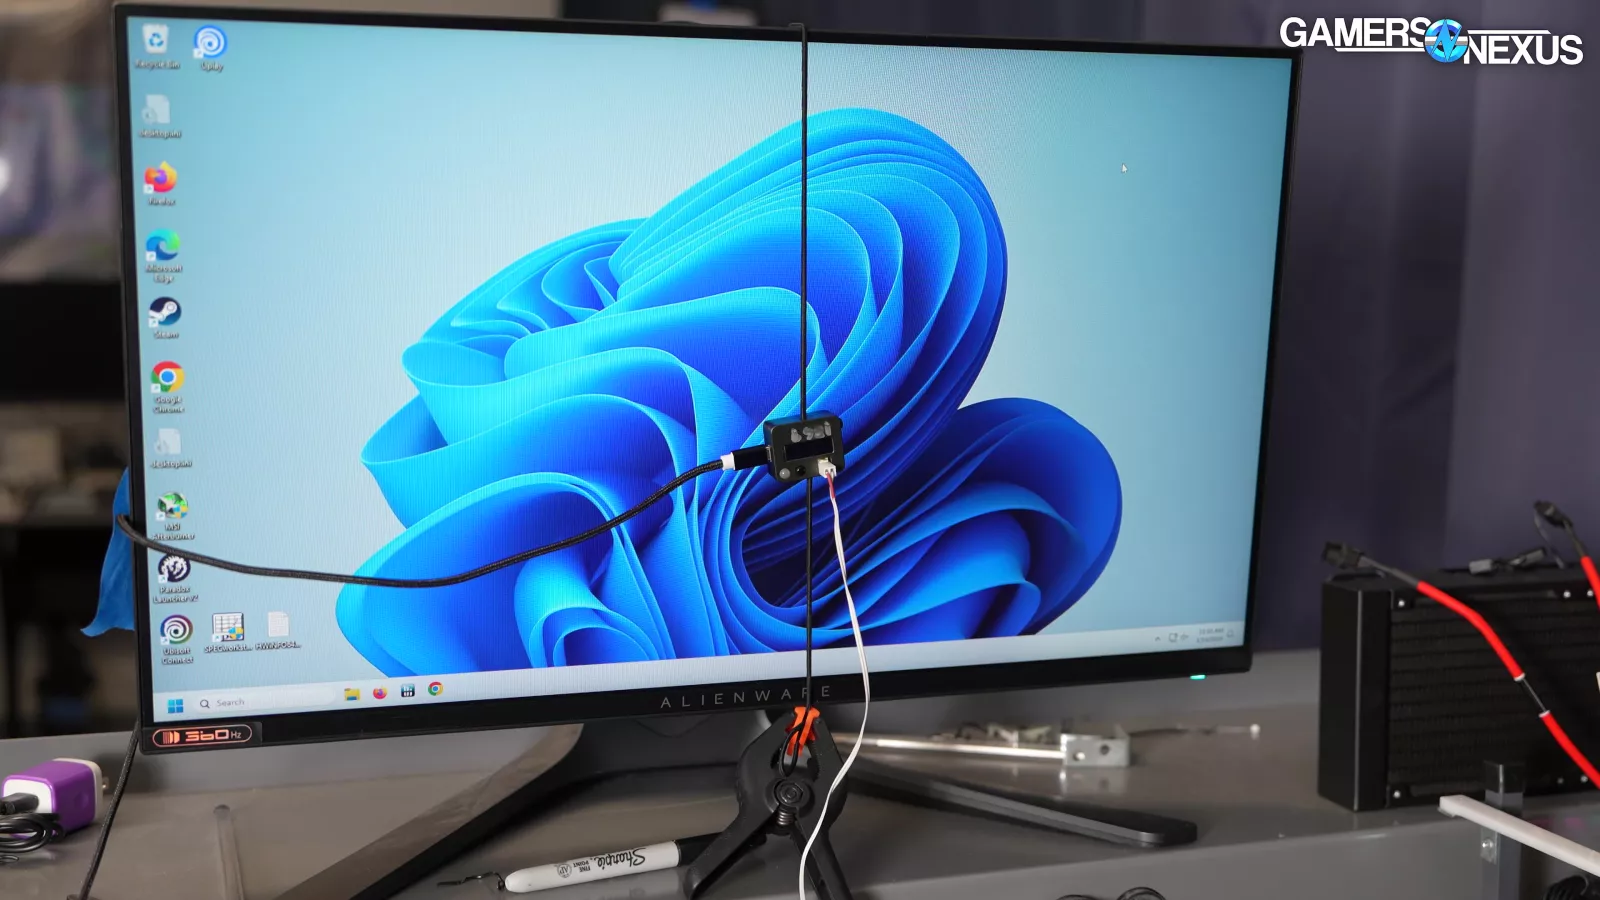
Our latency testing was conducted on a different test platform, which makes the framerate data incomparable to other tests in this suite. We tested using a 360Hz display at 1080p and using an LDAT, which is an external physical measurement device for total end-to-end system latency. We previously analyzed the LDAT on our YouTube channel. Testing was done with a 2-second shot delay and auto activation on 30 shots (and 100 passes). We attempted move-on-click and flick testing, but found it unreliable in this game. There are problems with muzzle flash detection, but we filtered the data for outliers and had other issues with flick testing.

NVIDIA GeForce RTX 4070 Super Latency Testing - Rainbow Six Siege
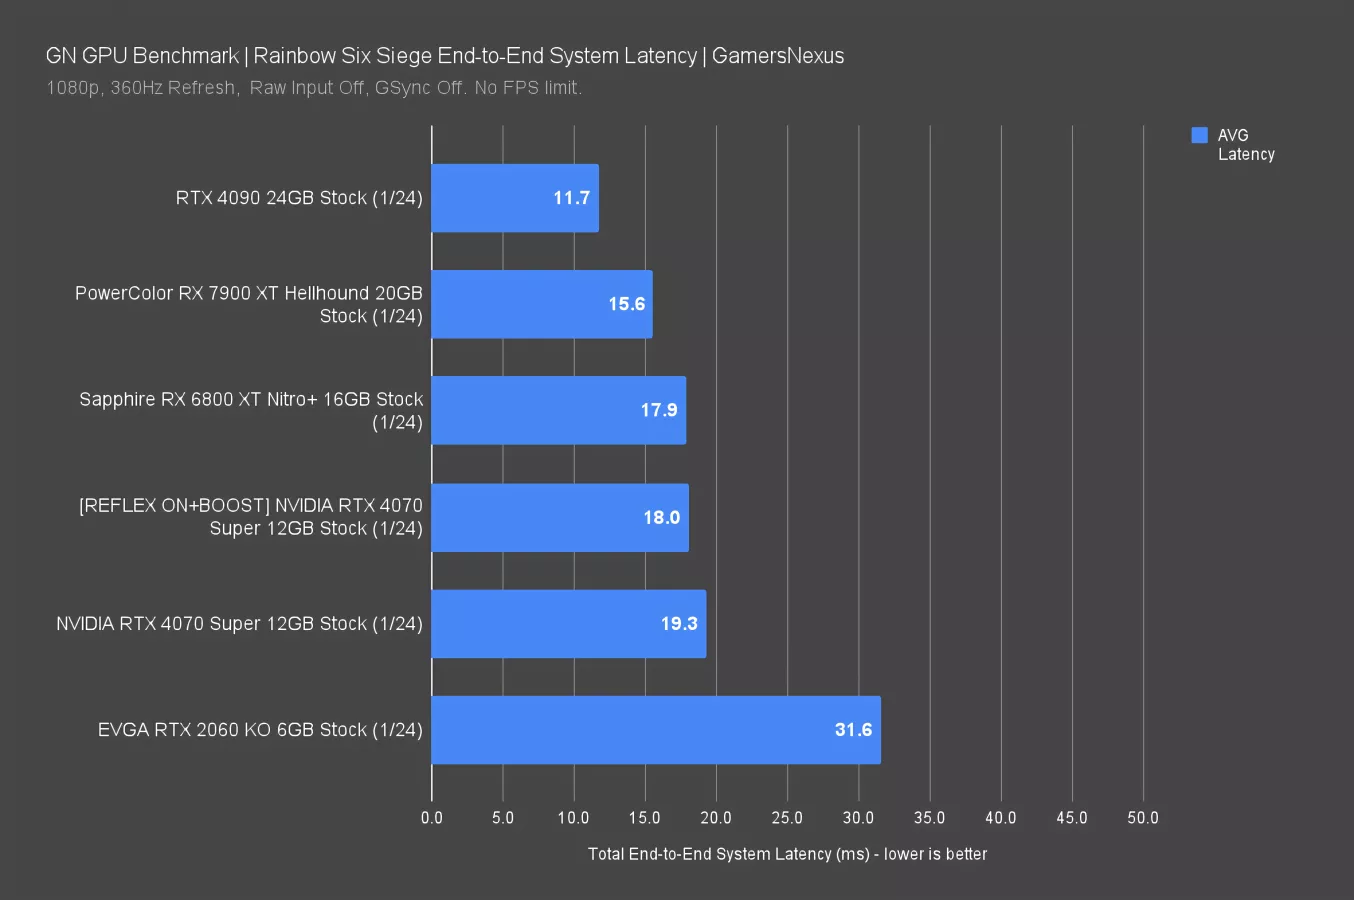
Here are the results. These numbers represent the total end-to-end system latency, represented in milliseconds. It’s not accurate to call this “input latency” or “input lag,” as this is the latency for the entire system. That’s from click to seeing the action. This will directly correlate with FPS in a lot of ways, but sometimes, it’s possible for the driver to break away from purely being related to framerate. It’s possible for a higher FPS device to perform worse than another in latency. It’s also the point to just show a new number.
The 4070 Super combination had an end-to-end system latency of 19.3 ms in this test. The floor is set by the 2060 for perspective, which was holding us back at 32 ms. Enabling Reflex boosted performance to 18.0 ms, a reduction in latency of almost 7% end-to-end. The RX 6800 XT is about tied with the Reflex-enabled 4070 Super. The 7900 XT had a 15.6-ms total end-to-end latency, with the 4090 at 11.7 and setting the performance cap.
NVIDIA GeForce RTX 4070 Super Latency Testing - Counter-Strike 2
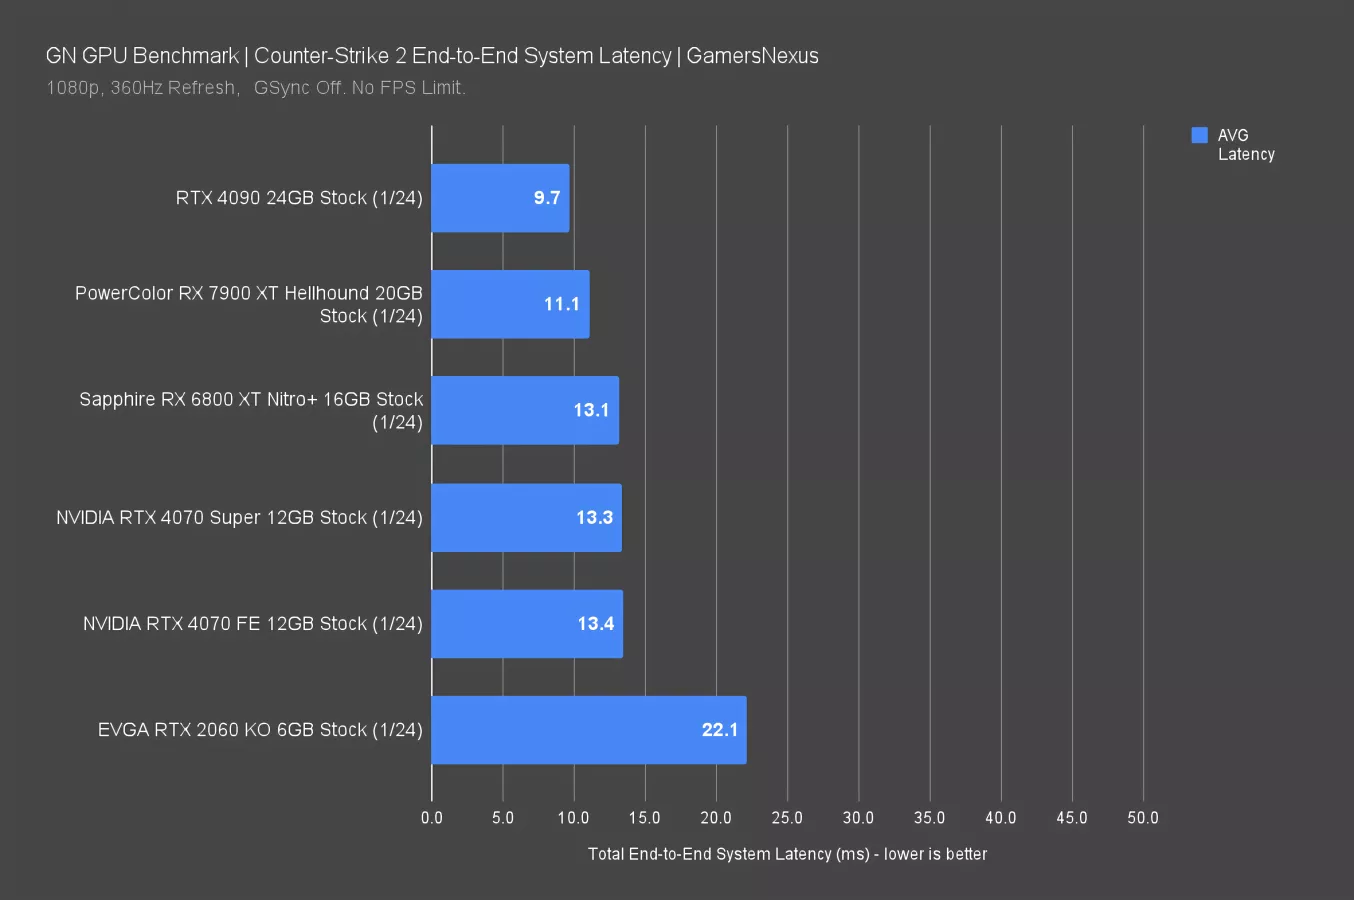
In Counter-Strike 2, we tested in Dust II on practice and with a closed lobby without bots visible.
The 4070 Super and 4070 FE both appear in this test. They were about the same here, or within test error. The 6800 XT is also within run-to-run variance. The 7900 XT measured 11ms end-to-end here, with the 4090 at 9.7 ms. The 2060 KO set the floor at 22 ms. Just for reference here, too, the 4090 was running at 858FPS average in this test. This is kind of the point and is exactly why we wanted to introduce the latency analysis because it helps reset the scale and gives us a number that's a little more meaningful as a human.
This is something we’re still working on, so we have a lot to do here in the future for latency testing. We plan to continue overhauling and exploring this testing. Currently, the run-to-run deviation is higher than we’d like it to be. We'd also like to move to movement testing or flick testing rather than click to photon with the shots, so that’s our next place to try and narrow-down the responsiveness, but it does help put things into perspective for how the system feels to play on and isn’t just a framerate number.
NVIDIA GeForce RTX 4070 Super Conclusion

That pretty much sums it all up. To give a recap: The 4070 is sticking around, the 4070 Super is obviously the new GPU. The 4070 TI is outgoing; they are not going to continue making those. The 4080 is also outgoing, and so those two cards will be replaced by their new Super variants, and that'll define the new stack for NVIDIA at this sort of high end.
Again, the quick version of the recap is that we’re seeing about a 10% advantage favoring the outgoing 4070 Ti vs the 4070 Super, about a 15% advantage with some break-outs favoring the 4070 Super over the 4070 original, and then about 50% against the 3070 (original review here). There’s more nuance to those numbers, but that’s the most compacted version.
AMD competes relatively closely in rasterization with the most relevant cards being the 6800 XT, the 7800 XT, 6950 XT, and the 7900 XT sort of in that order with the 7900 XT representing a kind of step-up, and if you’re going up to that price point, you’ll need to look at NVIDIA’s more expensive options, too. For ray tracing, AMD falls behind. That’s not new, but it’s a repeat behavior. Using upscaling across both company’s cards doesn’t really change that picture too much.
For value, it at least hasn’t gotten worse for the 4070 Super: The Super is better than the non-Super and is about $50 more on average, with the 4070 continuing to exist but at its newer price point. One of the larger considerations is that the power consumption does go up but it’s 20 watts, which isn’t a crazy power increase but does allow NVIDIA to push performance a little more and get higher clocks.
If you’re considering this card, the things to really think about include ray tracing -- which still primarily favors NVIDIA for performance -- and total budget. If you don’t care about ray tracing at all, AMD’s cards become much more viable and often have strong value propositions. For example, we recently revisited the 7900 XT and at the price we bought it for, we liked it a lot. You should check that out if you are considering going up a price class.
We’d recommend waiting around for the next two Super cards to drop to see how they change the stack, then we can all regroup in the 4080 Super review and talk about the value proposition across the market.