We showcase how the AMD R5 2600X, 2600, and 1600 AF hold up in over a dozen modern CPU benchmarks
The Highlights
- The AMD R5 2600X and 2600 were great value CPUs when they released back in 2018
- After over 5 years since launch, they’re beginning to show their age compared to modern CPUs in multithreaded workloads
- For those looking to upgrade and keep their motherboard, the 5800X3D would provide the most out of AM4
- Original MSRP: $200 (2600), $230 (2600X), $85 (1600 AF)
- Release Date: April 19, 2018 (2600 and 2600X), October 11, 2019 (1600 AF)
Table of Contents
- AutoTOC
Intro
Today we’re revisiting some of 2018’s best CPUs: The Ryzen 5 2600, 2600X, and 1600 AF (original reviews linked), the latter of which is basically a 2600 that came out later in 2019 and quickly sold out at its $85 launch price.
In this story, we’ll be looking at how the 2600 series (and we’re including the 1600 AF here) performs against modern CPUs. So we’ll be looking at AM4 options for drop-in upgrades like the 5800X3D, new Intel options, and also AM5 processors.
If you’ve been running on a 2600-class system for a while and you’re thinking about upgrading, this should give an idea for what kind of relative percent uplift you could see or some absolute numbers in some cases.
Editor's note: This content was originally published on December 1, 2023. It has been converted to an article format and published on the website with the current date of publishing. The original content is unchanged.
Credits
Test Lead, Host, Writing
Steve Burke
Testing
Mike Gaglione
Video Editing
Vitalii Makhnovets
Writing, Web Editing
Jimmy Thang
Overview
We initially gave the R5 2600 the best overall value CPU award back in 2018. The Ryzen 5 series CPUs were incredible performers at the price back then, punching above their weight class for value and in a market where Intel wasn't as present. The 2600 launched at $200 and the 2600X launched at $230, which were extremely competitive deals at the time, not to mention the $85 1600 AF (a somewhat sneaky launch using an updated node, despite the naming). They offered a good amount of performance, particularly good multithreaded performance for the time, which made them awesome options for AM4 builds.
A lot of people are running those CPUs and they’re still good today, especially in games (as long as the GPU can keep up); however, at the time of launch, they did struggle a bit compared to Intel’s best options in games that were more frequency-dependent at the time. Things may have changed in the time since, and that's what we're looking at today.
Since it’s been a while, let’s check back in on those specs.
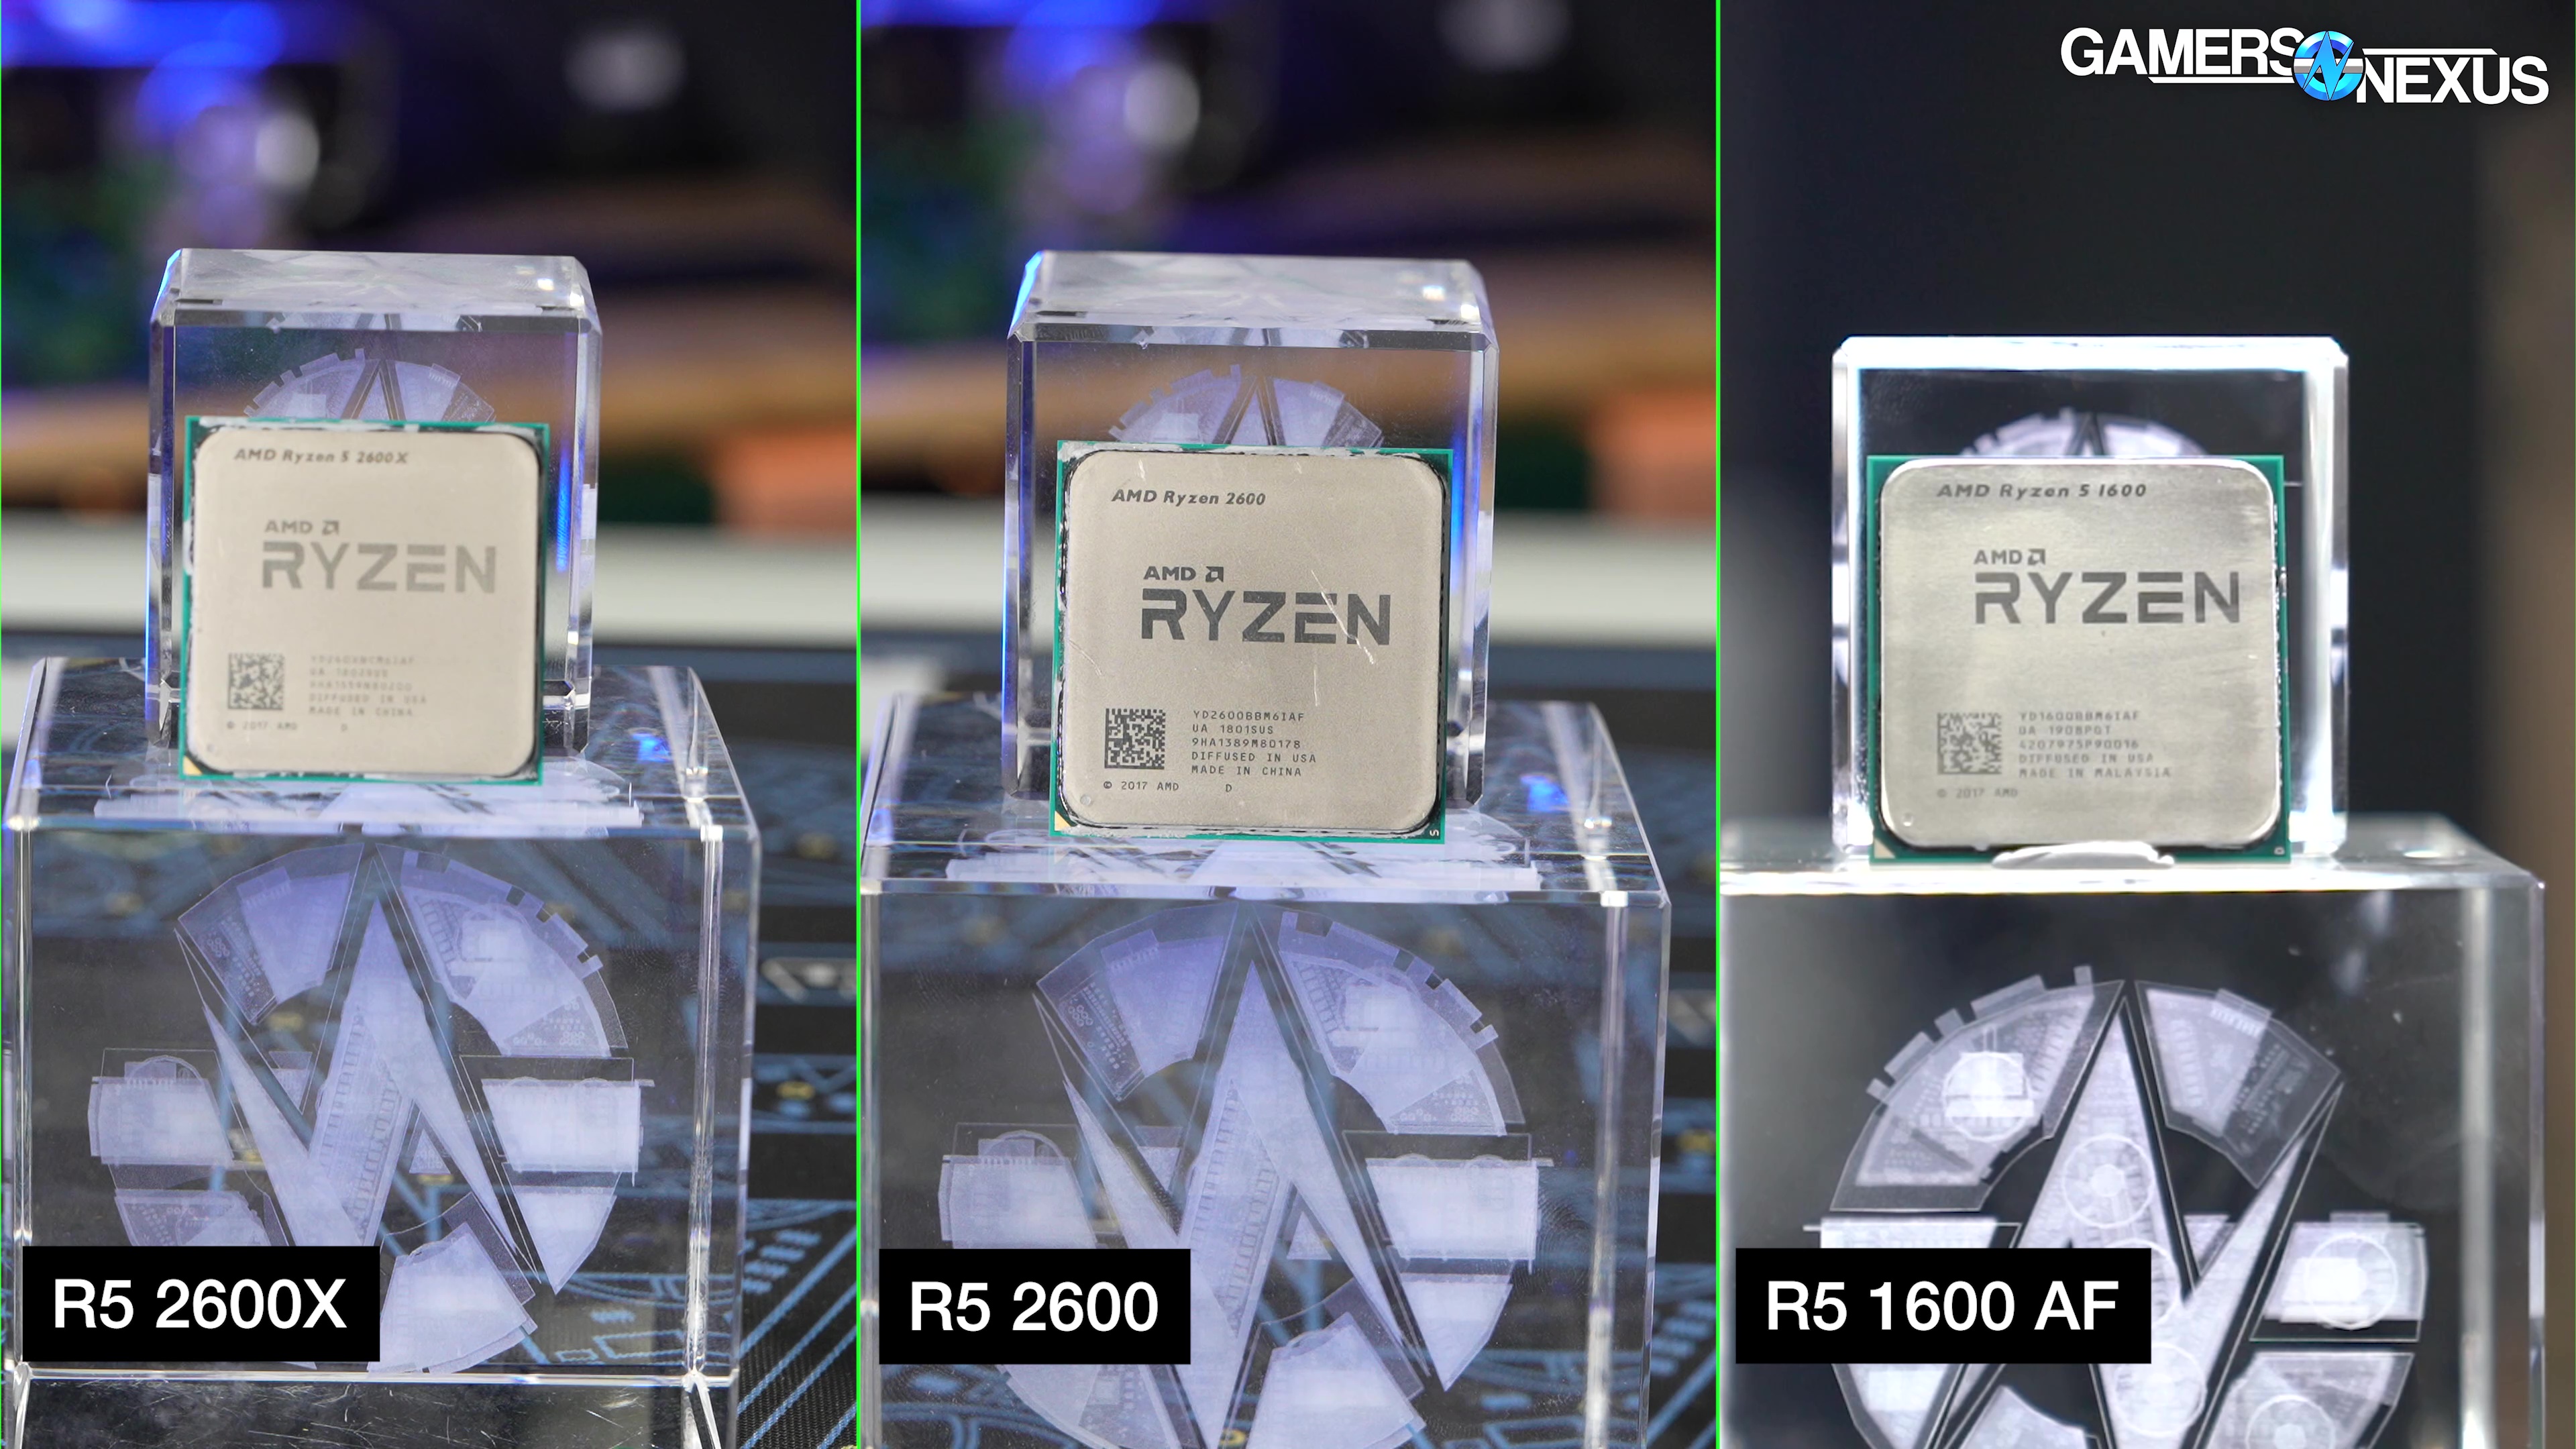
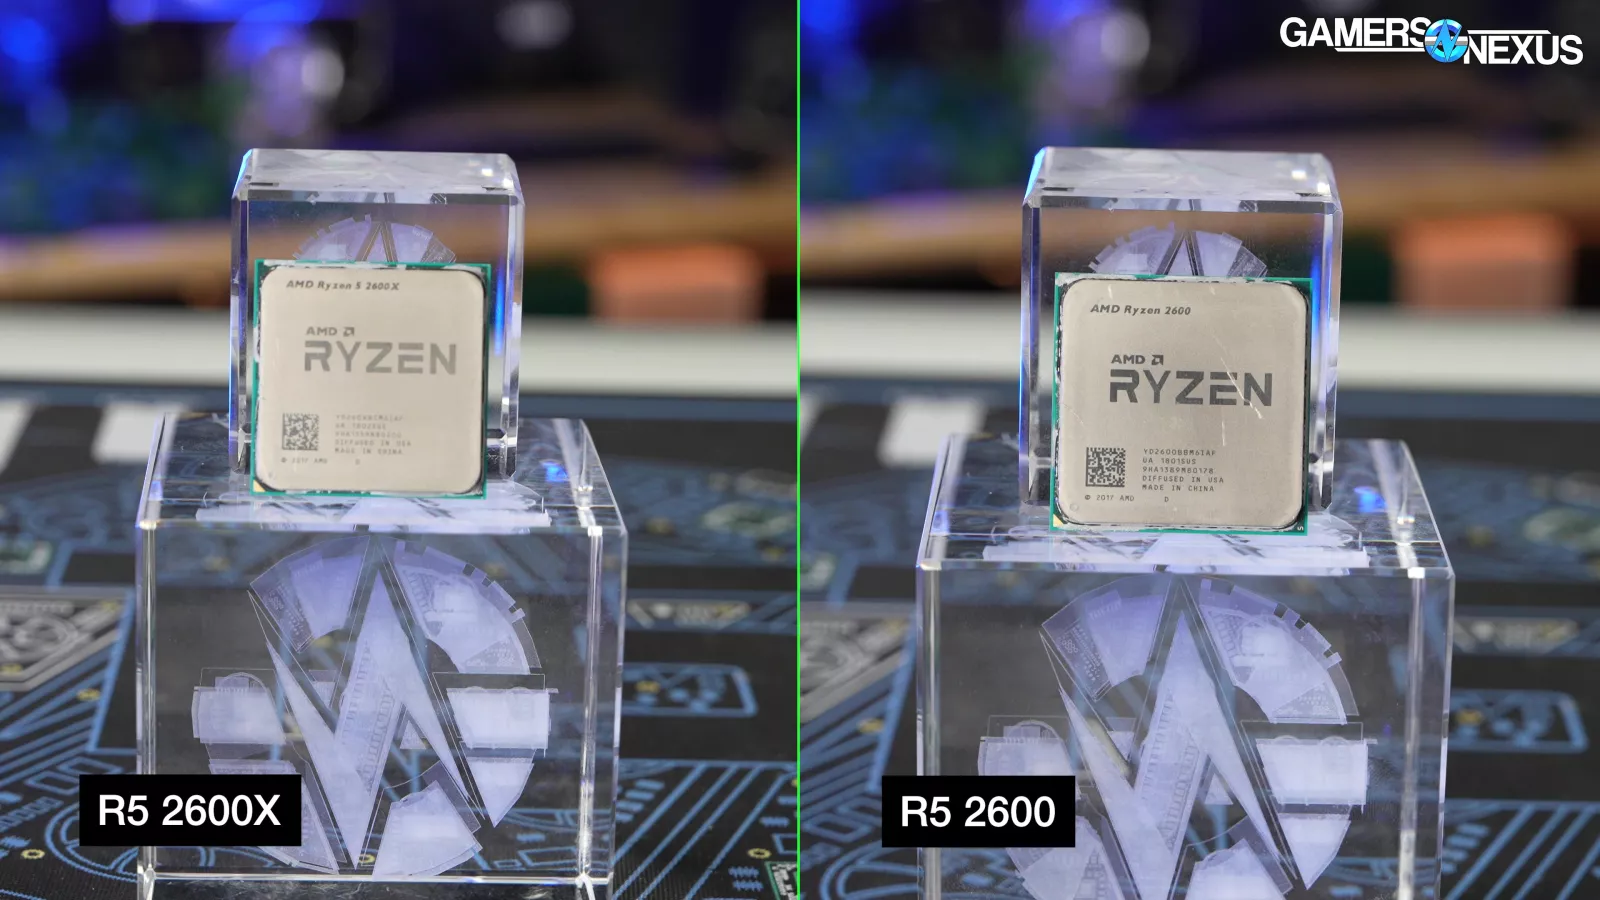
CPU Lineup: 2600, 2600X, and 1600 AF
Here are the spec listings for the CPUs we’re revisiting today:
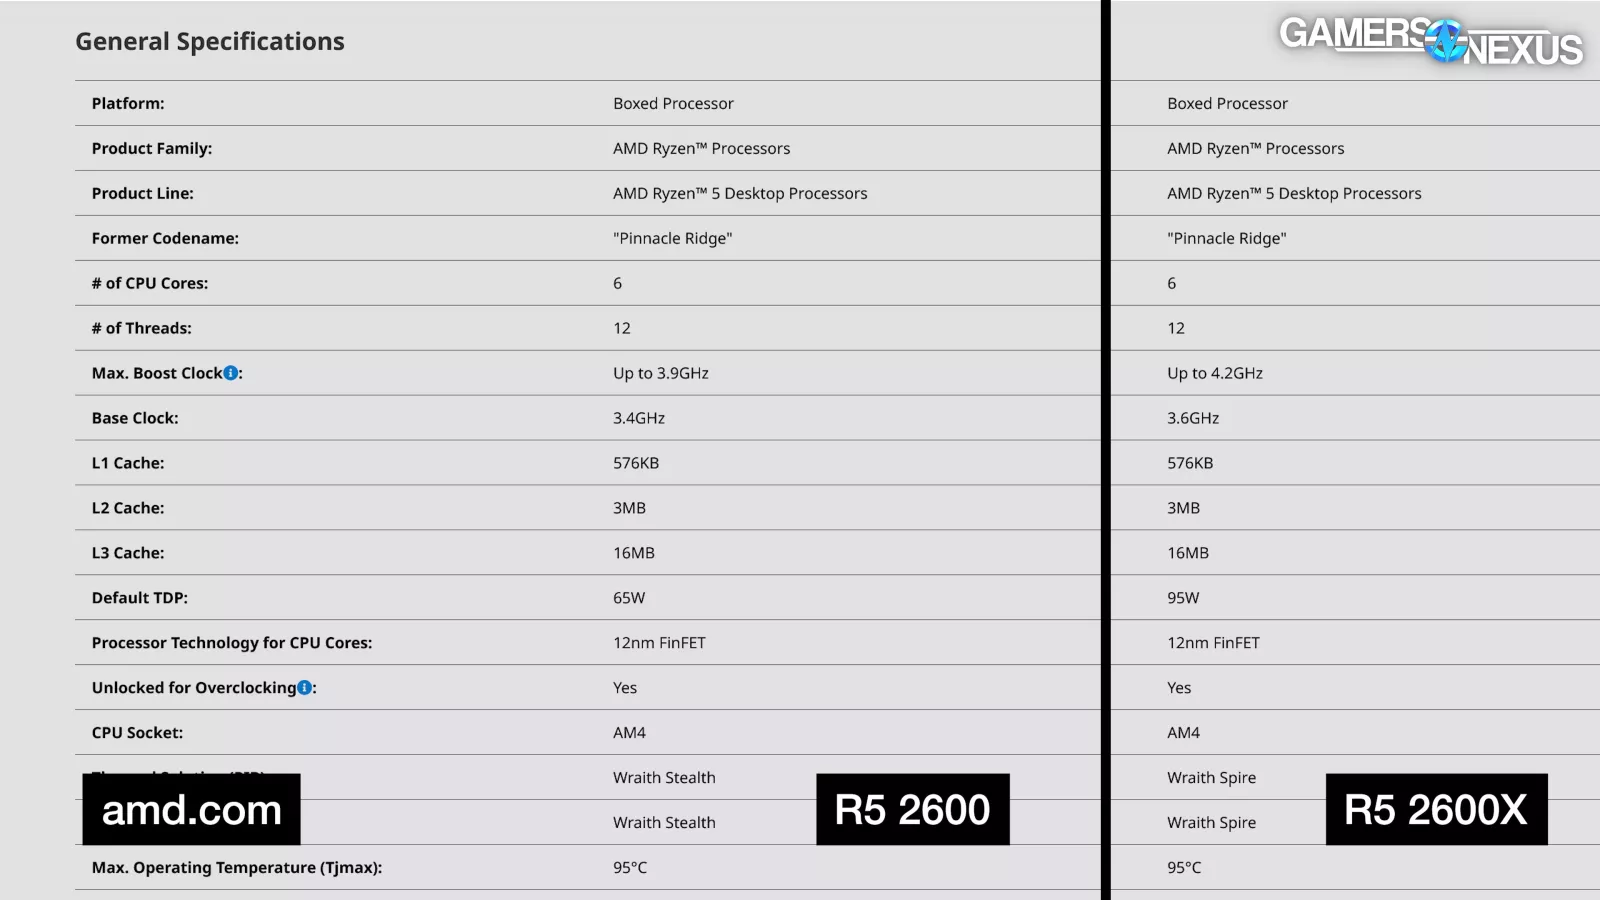
The AMD R5 2600 is a 6C, 12T CPU that advertises a boost of up to 3.9GHz. Back in the day, overclocks could commonly hold 4.0-4.2GHz. The 2600X is also 6C and 12T, but advertises a maximum boost of 4.2GHz. Its base clock is also 3.6GHz, up from 3.4GHz. The R5 1600 AF is a slower variant of Zen+ 2000-series CPUs, just with an older name. Back when we reviewed it, we noted that it may not be as good a bin as a 2600, but that there’d be no way to know. Its price was shockingly low. Our 1600 AF and our 2600 ran at almost identical clock speeds when stock, so it’s effectively an R5 2600. There are some slight differences, but we talked about those in the 1600 AF review.
Now we’ll talk about pricing and options. This should help anyone who hasn’t followed the industry get reacquainted with what CPUs exist currently.
AMD Ryzen Upgrade vs. New Build CPUs
GamersNexus R5 2600(X) Revisit (11/29)
| CPU | Price (11/29) |
| R5 2600 (Original Price) | $200 |
| R5 2600X (Original Price) | $230 |
| R5 1600 AF (Original Price) | $85 |
| R5 5600 | $130 |
| R5 5600X | $158 |
| R7 5700X | $170 |
| R7 5800X | $220 |
| R7 5800X3D | $322 |
| R5 7600X | $220 |
| R7 7700X | $320 |
| R7 7800X3D | $360 |
First, here’s a quick reference table for some pricing right now on modern AM4 and AM5 CPUs. We’ll look at Intel next. The R5 2600, 2600X, and 1600 AF original prices are also listed. The 2600 was a $200 CPU, which most recently has been handled by the 7600 non-X, or the 7600X as shown here. The 1600 AF was briefly an $85 CPU, which was an insane price considering it’s a 2000-series CPU from a generational standpoint. That price didn’t last long and it quickly got scalped.
Modern in-socket upgrades could include the 5600 or 5600X, the 5700X (which is basically the same in performance as a 5800X, and the 5800X3D. The X3D is still available new. It costs around $322. If your budget dictates that you either get a 7600 and a new board or a 5800X3D, then the X3D will get you the most gaming uplift if newer board features and I/O aren’t needed. The 7800X3D (review here) isn’t too distant in price right now, although it’s been on and off sales.
These prices were all spot-checked on Amazon and Newegg for this piece, but remember that prices are fluctuating nearly daily right now.
Let’s look at Intel.
Intel New Build CPU Options
GamersNexus R5 2600(X) Revisit (11/29)
| CPU | Price (11/29) |
| R5 2600 (Original Price) | $200 |
| R5 2600X (Original Price) | $230 |
| R5 1600 AF (Original Price) | $85 |
| Intel i5-13400F | $200 |
| Intel i5-13600K (KF) | $270 ($250) |
| Intel i7-13700K | $345 |
| Intel i9-13900K (KF) | $547 ($519) |
| Intel i5-14600K | $320 |
| Intel i7-14700K | $401 |
| Intel i9-14900K | $577 |
For Intel, some of the relevant options include the 13600K or KF at $250-$270 (find the review here), which are cheaper than the new 14600K (watch the review here) and functionally the same -- or the same enough that it’s not worth extra money. The 13700K is around $345 now, with the higher-end i9 CPUs at $580 or so for the 14900K.
There are a lot more CPUs than this, of course. These are just some of the most relevant ones right now. We’ve taken out some of the ultra high-end CPUs just because it’s such a difference in performance class. If you want to see those, you can check out our 7980X review for the truly high-end stuff. Today, we’ll be focusing more on the gaming side of things with some production benchmarks at the end.

Gaming Benchmarks
Baldur’s Gate 3 R5 2600 & 2600X Benchmarks
1080p/Medium CPU Comparison
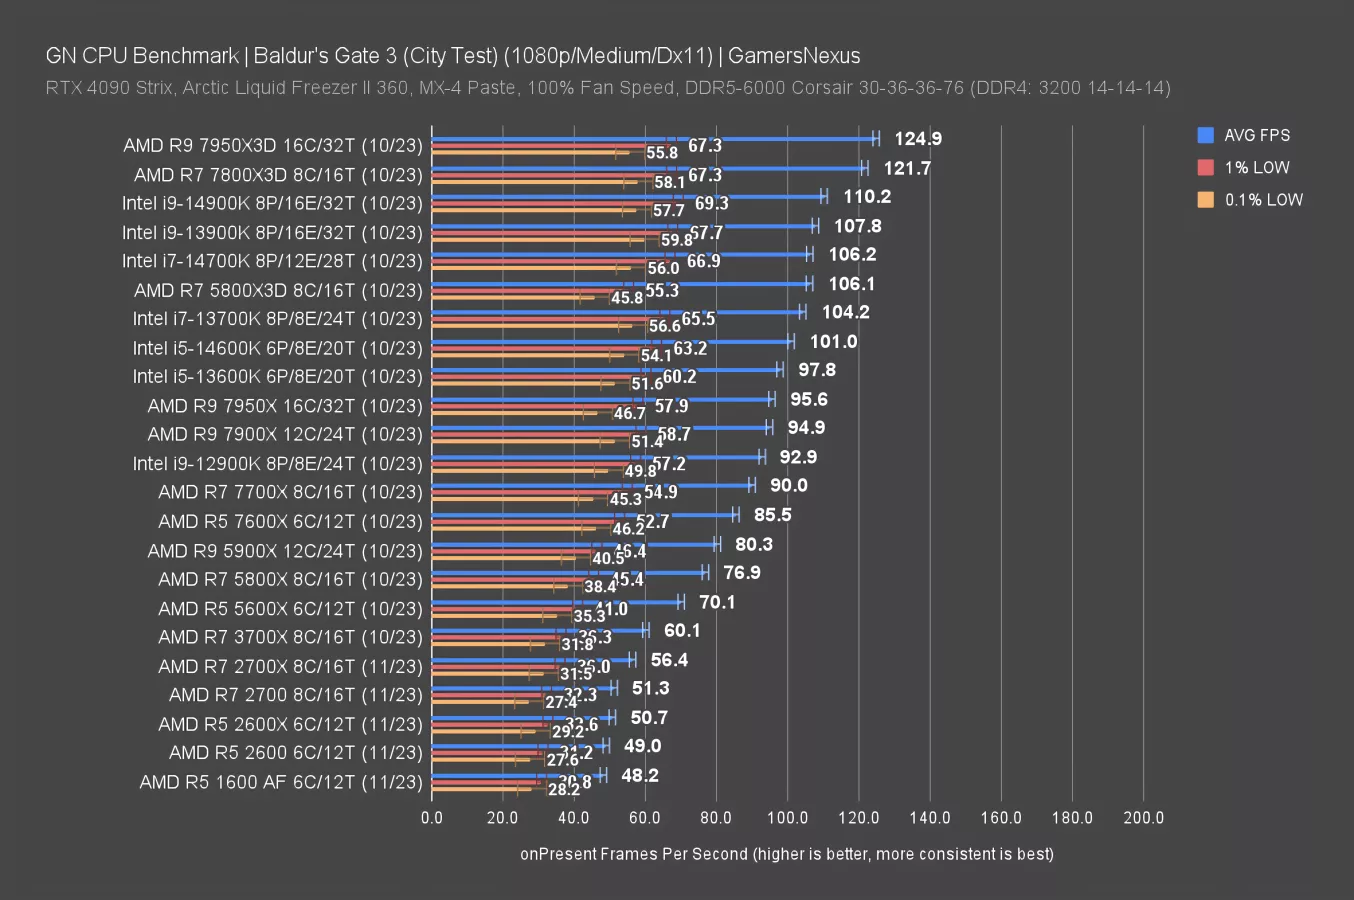
Baldur’s Gate 3 is up first, tested at 1080p/medium. This one has been a reliable CPU load and shows clean scaling for most parts tested, but especially for these older CPUs.
The R5 2600X ran at about 51FPS AVG, with the 2600 just behind it and 1600 AF effectively tied with the 2600, which makes sense for reasons we discussed above.
We’ll talk upgrades first: The 5800X3D would be the largest in-socket improvement, pushing a little past doubling the FPS for any of these 3 older Ryzen parts. Assuming your GPU can keep up, it’d feel like a new system.
Other in-socket options might include a cheaper bump to a 5700X or 5800X, where we saw about a 54% increase in performance, depending on which CPU you look at. It wouldn’t make much sense to move to a 2700-series CPU from a 2600, but a 5600 or 5600X might be an option if the cost were low enough.
On the new platform side, Intel’s 13600K or 14600K would be the most price-conscious improvement. You’d have some added benefit in multithreaded workloads and applications that the 5800X3D won’t match, despite a deficit in some of these games. For most people watching, probably the gaming performance matters more.
As for new AMD, the 7800X3D would push past the 5800X3D to 122FPS AVG, while something like the 7700X or 7600X would offer uplift with a lot of new motherboard and I/O options, but a lower barrier to entry price.
Baldur’s Gate 3 R5 2600 & 2600X Benchmarks
1440p/Medium CPU Comparison
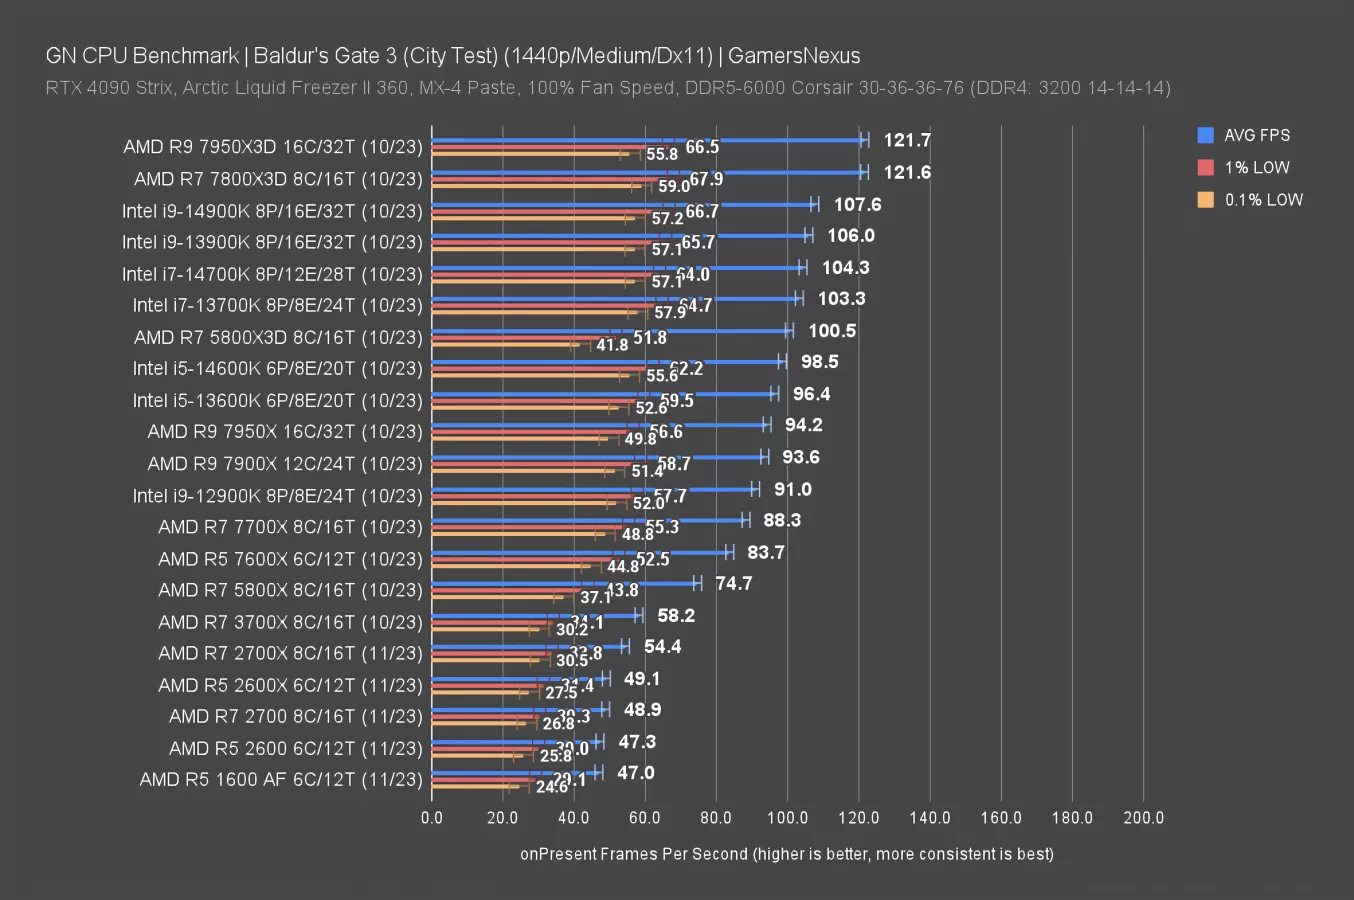
At 1440p, the lineup is mostly the same. That makes sense since we’re so CPU-bound. If you were running a better GPU than CPU, or just in games that are more CPU-constrained, you’d see an uplift even as resolution or graphics options increase. That’s shown in this example.
Cyberpunk: 2077 - Phantom Liberty CPU Benchmarks
1080p/Medium Ryzen 5 2600 Performance
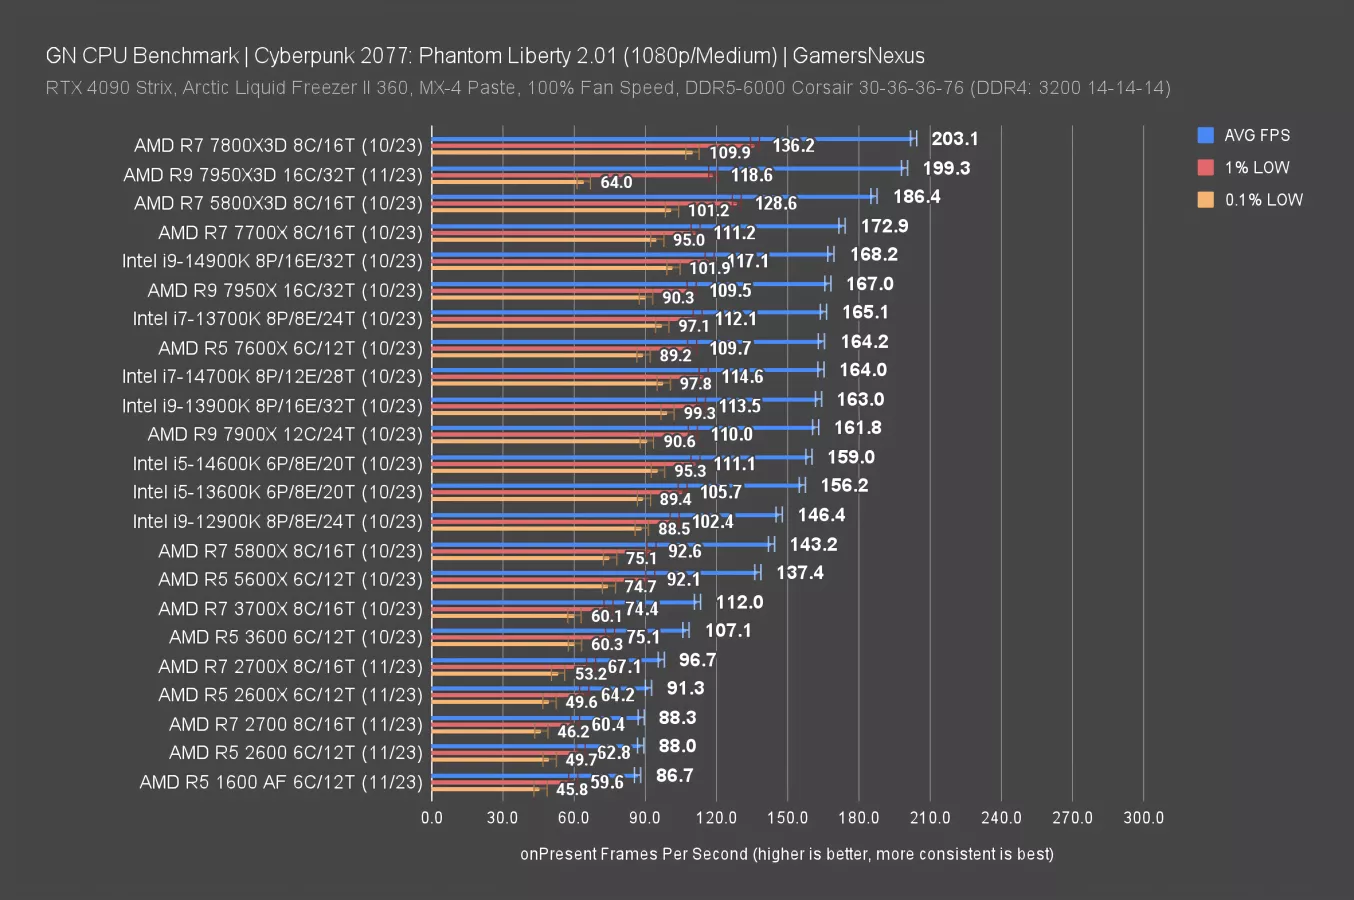
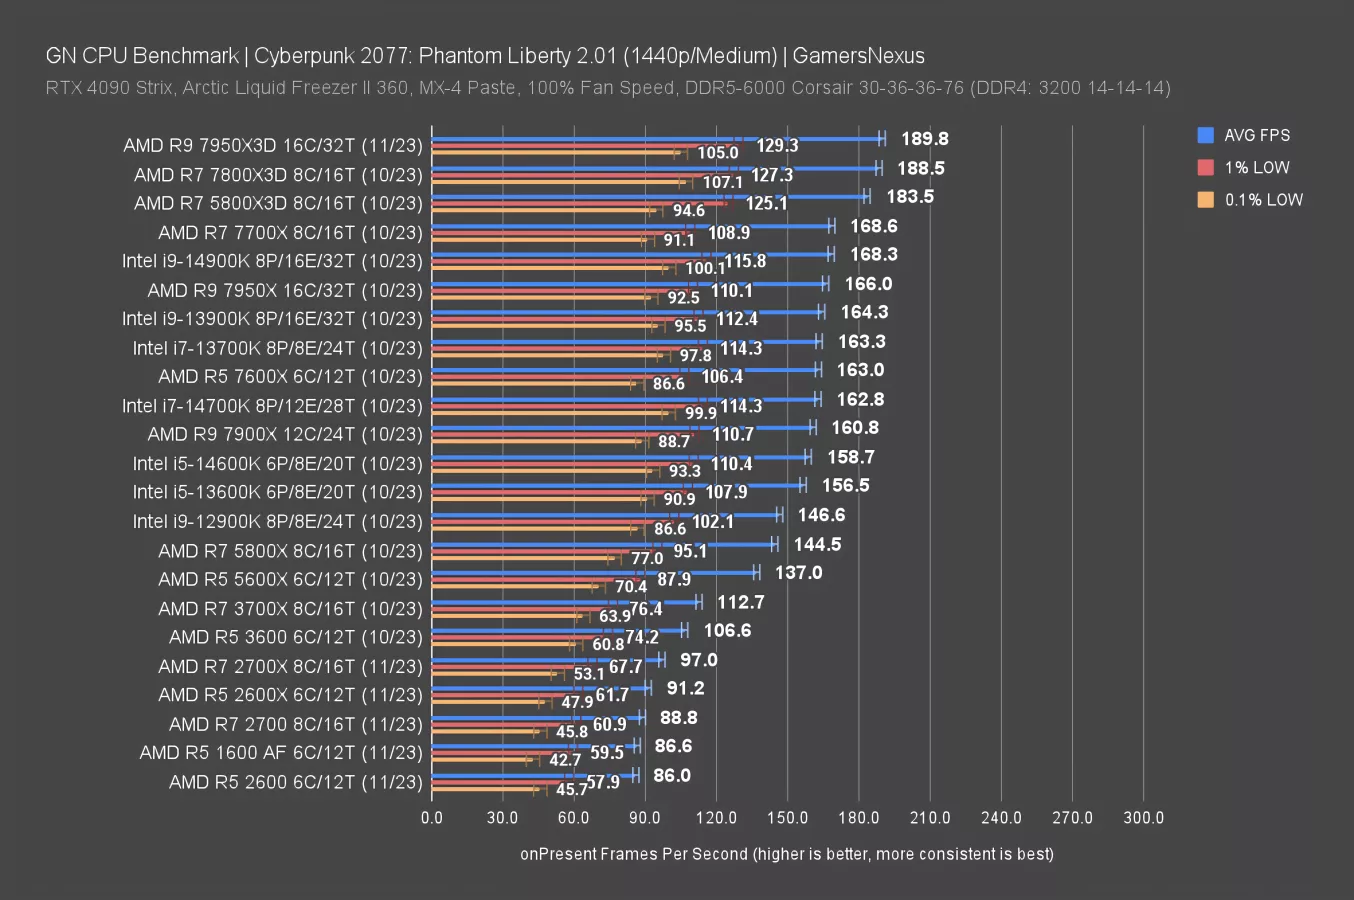
Cyberpunk 2077’s new Phantom Liberty expansion is up now, serving as another relatively high CPU load for a modern and popular game.
At 1080p, the 1600 AF and 2600 ran at about 87-88 FPS AVG, which is within run-to-run variance for two entirely different chips. The 2600X ran at 91FPS AVG, boosted from its higher clocks (and also benefited against the 2700 non-X, as the 2600X has a higher maximum boost clock).
These CPUs are still handling Cyberpunk well, despite the age. The lows are also completely acceptable here, with no major game-ruining spikes in our test passes. The 5800X3D in-socket upgrade would add about 100FPS to the framerate, up at 186FPS AVG. In a relative sense, that’s about 104% over the 2600X. A new CPU and board, like with the 7800X3D, move the needle to 122% uplift, at which point we’re likely grappling with some non-CPU limitations.
Going from the R5 2600 series to the R5 5600X or 5600 would still provide meaningful uplift if you can get one for cheap enough, with the 5800X (and likewise, the unshown but nearly identical 5700X) posting some scaling beyond that. Intel’s 13600K would provide a major improvement of about 71% on the lower end. Non-3D new CPUs, like the 7700X, get most of the benefit of the 5800X3D.
1440p/Medium Ryzen 5 2600 Performance
At 1440p, we saw about the same lineup. The very top-end is now slightly limited, cut from 203FPS AVG at the peak to about 190, but otherwise, you’d still get a big improvement with a sufficiently high-end GPU if moving off of the R5 2600 or 1600 AF CPUs.
Starfield CPU Benchmarks (Ryzen 2600 & 2600X)
1080p/Low
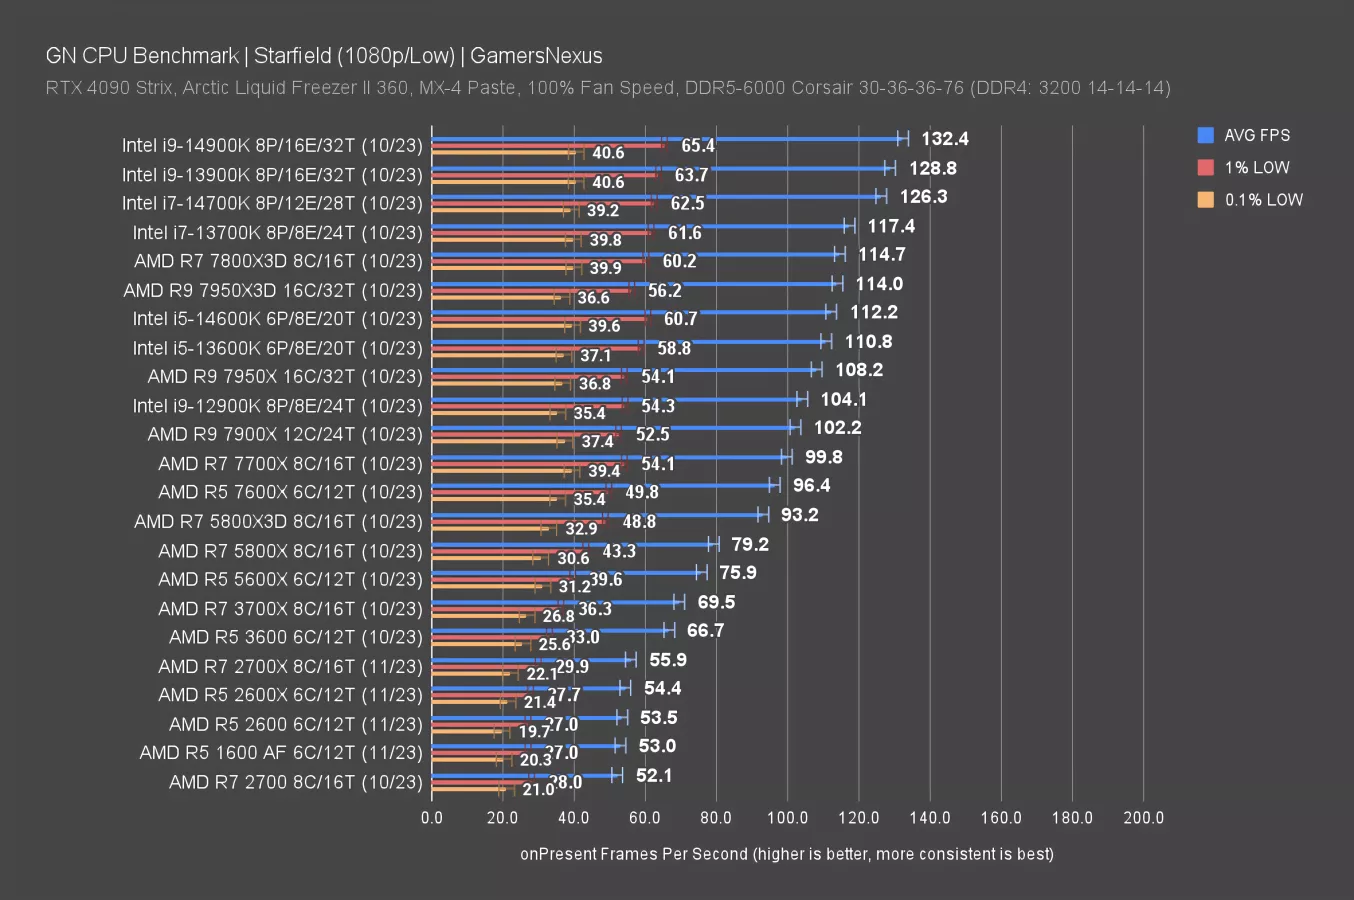
Starfield is up now. As another of the 3 brand new games we’ve recently added, it’s gone through the most dramatic changes. All of the testing for this was conducted on the same game version, which is one version prior to the recent mega patch. That means the data on this chart is directly comparable to itself, but that you’d get some uplift moving to a new game version. For purposes of comparing old CPUs though, we still have plenty of room to see scaling.
The R5 2600, X, and 1600 AF all ran at about 53-54FPS AVG. The 2700X was around 56FPS AVG, so not much difference there. The 2700 data on this chart is within error of the 2600 and 1600 AF. Another round of reruns might get us another 1-2 FPS depending on variance. That’s within error. But the 5800X3D definitely isn’t: The 5800X3D would give you around 71% uplift against the 2600X. That’s not as crazy as in some other games, but still a huge improvement. The 14900K sets the ceiling at 132FPS AVG in this one, so the 13600K or 14600K would be viable alternatives providing around double the framerate.
F1 2023: CPU Upgrade Comparison
1080p/High Ryzen 2000 Benchmarks in 2023
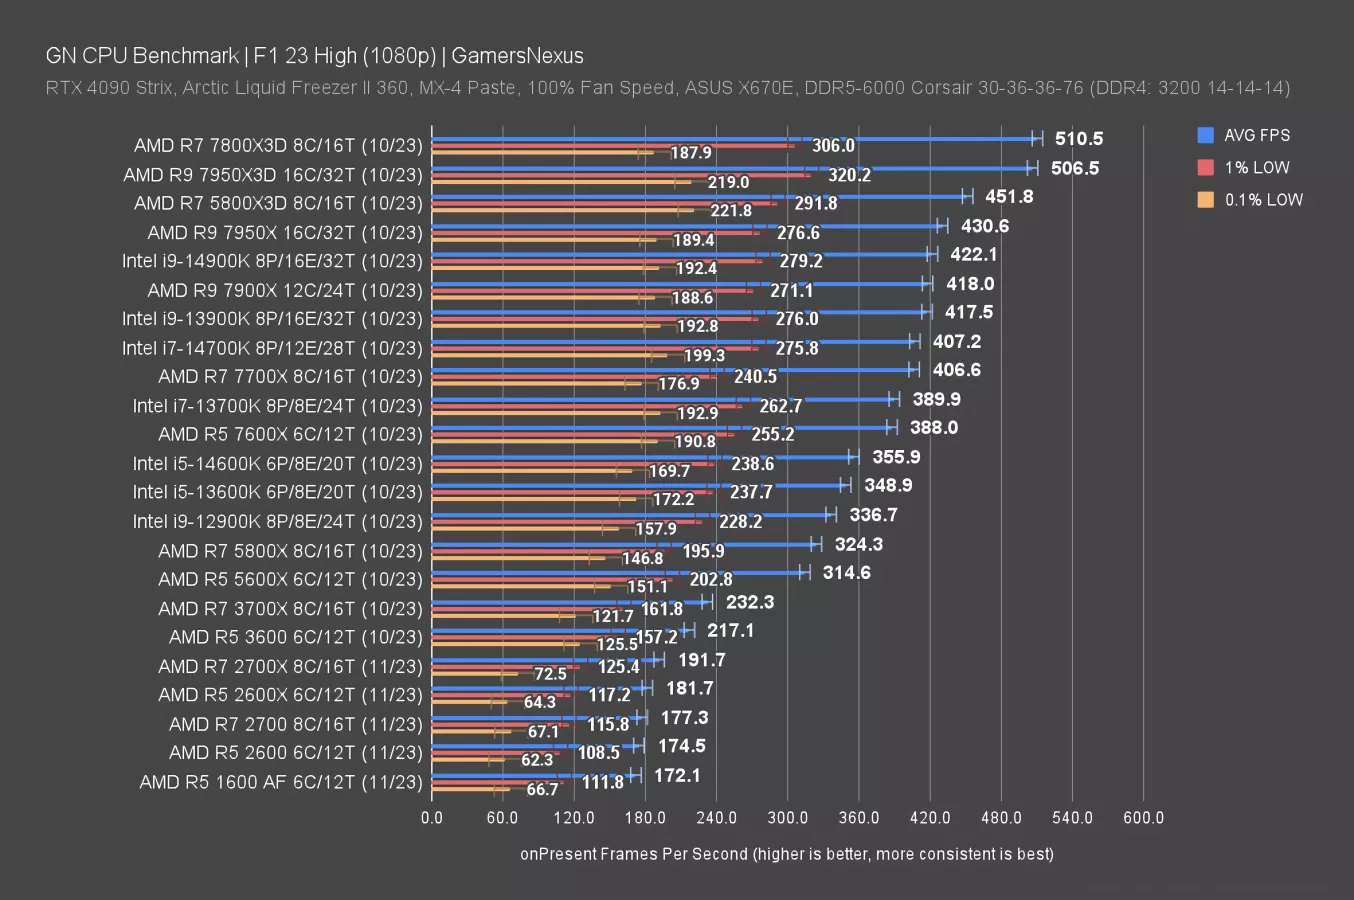
F1 2023 is up now. In this one, the 2600 ran at 175FPS AVG, with the 2600X holding a 4% lead. The 1600 AF was near the 2600, at 172FPS AVG. That’s basically run-to-run variance at this scale.
That these CPUs can still run modern games in the hundreds of frames per second shows how viable they still can be. It all depends on the game, of course, but at least here, we’re seeing good performance.
The 5800X3D leads the 2600X by about 149%, which is an insane jump considering the in-socket nature of the change. As we’ve said before, it’s crazy that such a wide gap can exist while being tested in the exact same board, with the exact same RAM and other components. But remember, that’s only made possible if the GPU provides enough scaling headroom.
The 7800X3D boosts further, at 181% over the 2600X. Intel’s options might land you on a 13600K at about 350FPS AVG or the 14700K at 407FPS AVG, which itself is about tied with the 7700X (although it produced higher 1% lows, at least on a technicality).
1440p/High
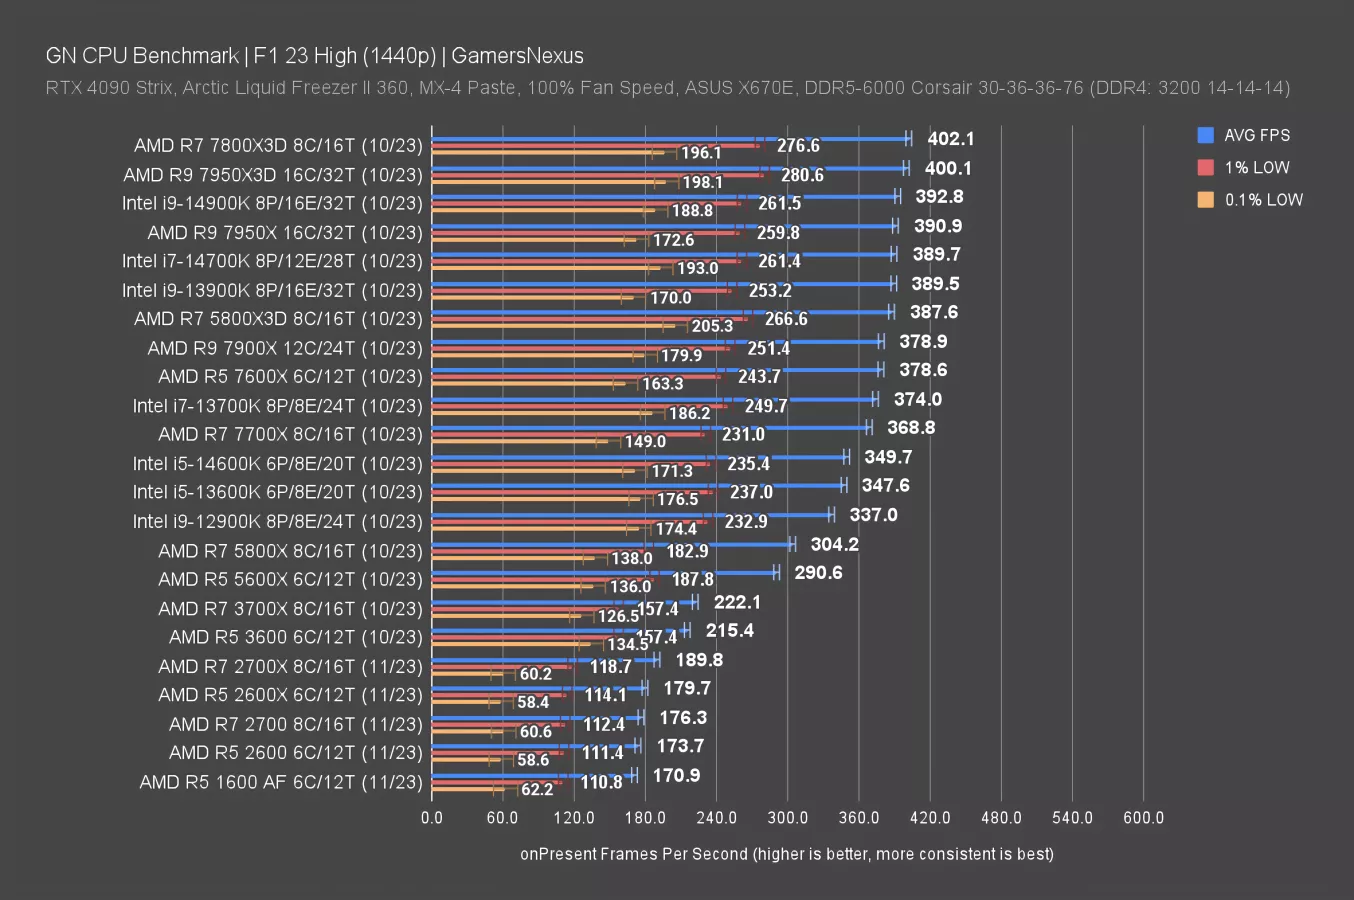
At 1440p, the R5 2000 series (and the AF) ran in the 170-180FPS AVG range. The top of the chart has changed, with the limit now closer to the 400FPS mark.
Stellaris CPU Simulation Time Benchmarks
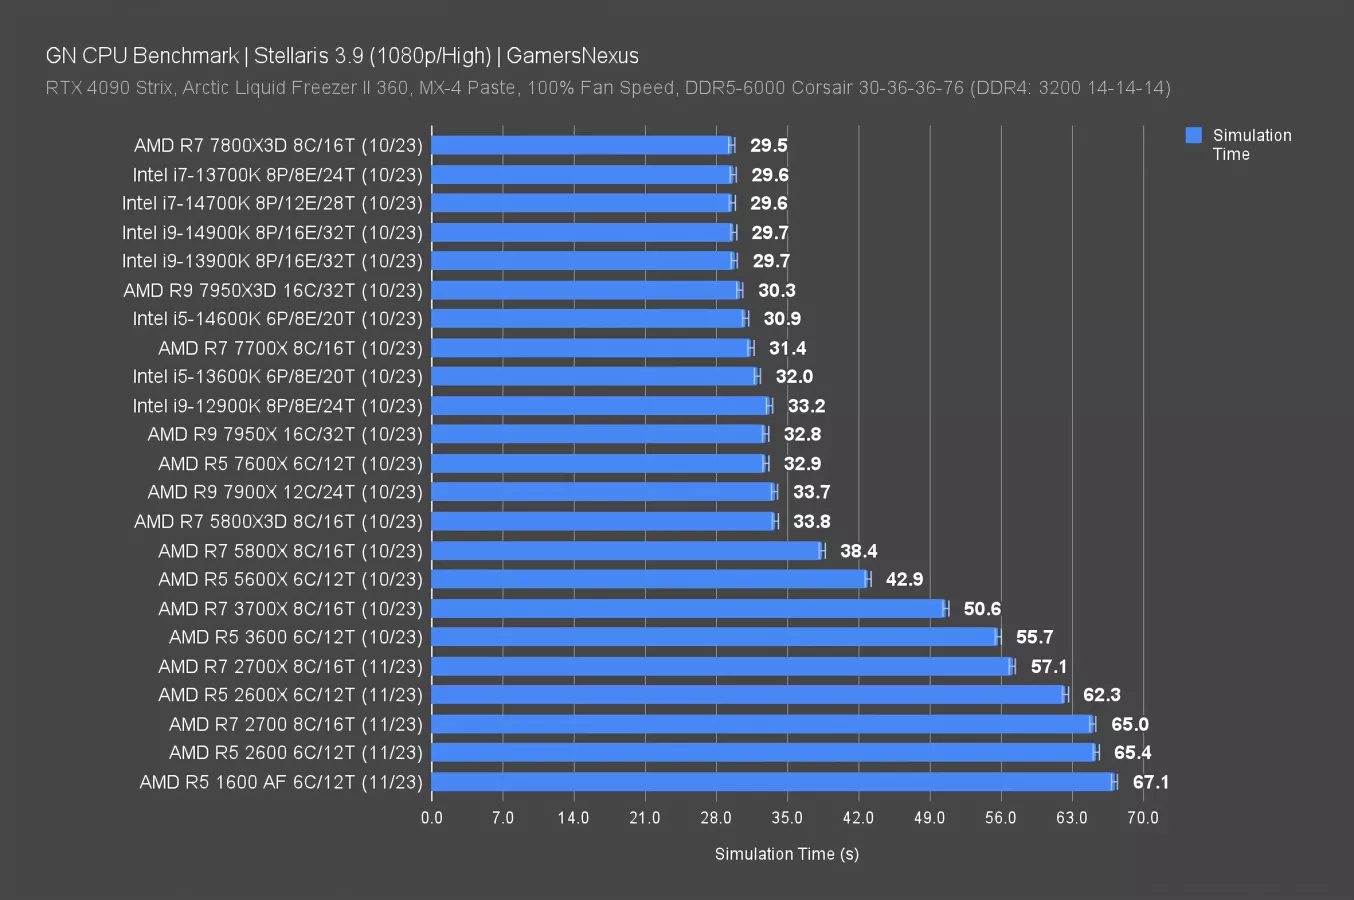
In Stellaris, we’re looking at time reduction for CPU simulation time. As always, that means we calculate in the direction of improvement -- which is reduction -- so faster simulation time here means % time reduced from the reference point.
In this one, the R5 2600 required a long 65 seconds for the simulation time. That’s noticeable as a player -- you’re waiting over a minute for the full simulation to process. The 2600X is similar, with an improvement of 4.7% time reduced. The 1600 AF ran a little behind the 2600, where the 2600 was improved by 2.5%.
The 2600X shows us that frequency does have an impact here, and the 2700X vs. 2700 comparison teaches the same lesson. 3D Cache benefited the 5800X3D over the 5800X, where we saw an uplift of 12% time reduced, but didn’t meaningfully help the 7800X3D over the 7700X as a result of encountering other limitations -- possibly engine limits.
The Intel upgrade pathway for a new build might yield a 13600K or 14600K as the best affordable options. Here, we see simulation times of 32 seconds on the 13600K, or 51% improved over the 2600, where improved again means % time reduced.
AMD R5 2600 & 2600X Shadow of the Tomb Raider Benchmark
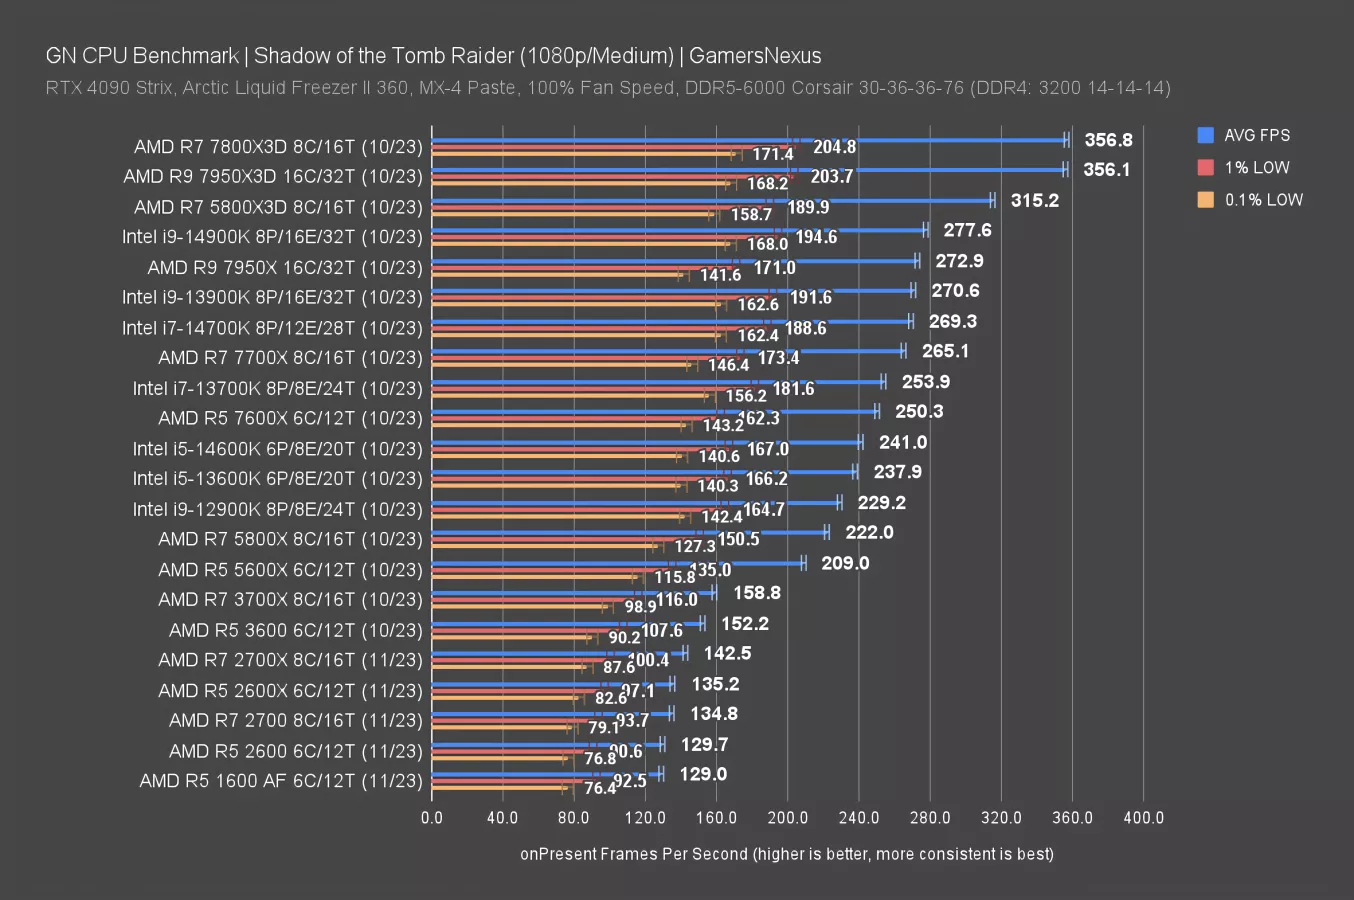
In Shadow of the Tomb Raider, the R5 2600 ran at 130FPS AVG, with the 2600X at about 135FPS AVG. That’s about a 4% lead over the 2600 and similar over the 1600 AF. Lows are similar on all of these. As for the upgrade avenues, the first meaningful one might be the R5 5600X at 209FPS AVG or 5800X (or 5700X). Intel’s 13600K reference point we’ve used improves by about 76% over the 2600X. The 5800X3D approaches the limit for this chart, but doesn’t quite hit it. It’s at 315FPS AVG, or about 133% over the 2600X.
The 7800X3D and 7950X3D show us the limitations of scaling in this test, even at 1080p.
AMD R5 2600 & 2600X Rainbow Six Siege Benchmark
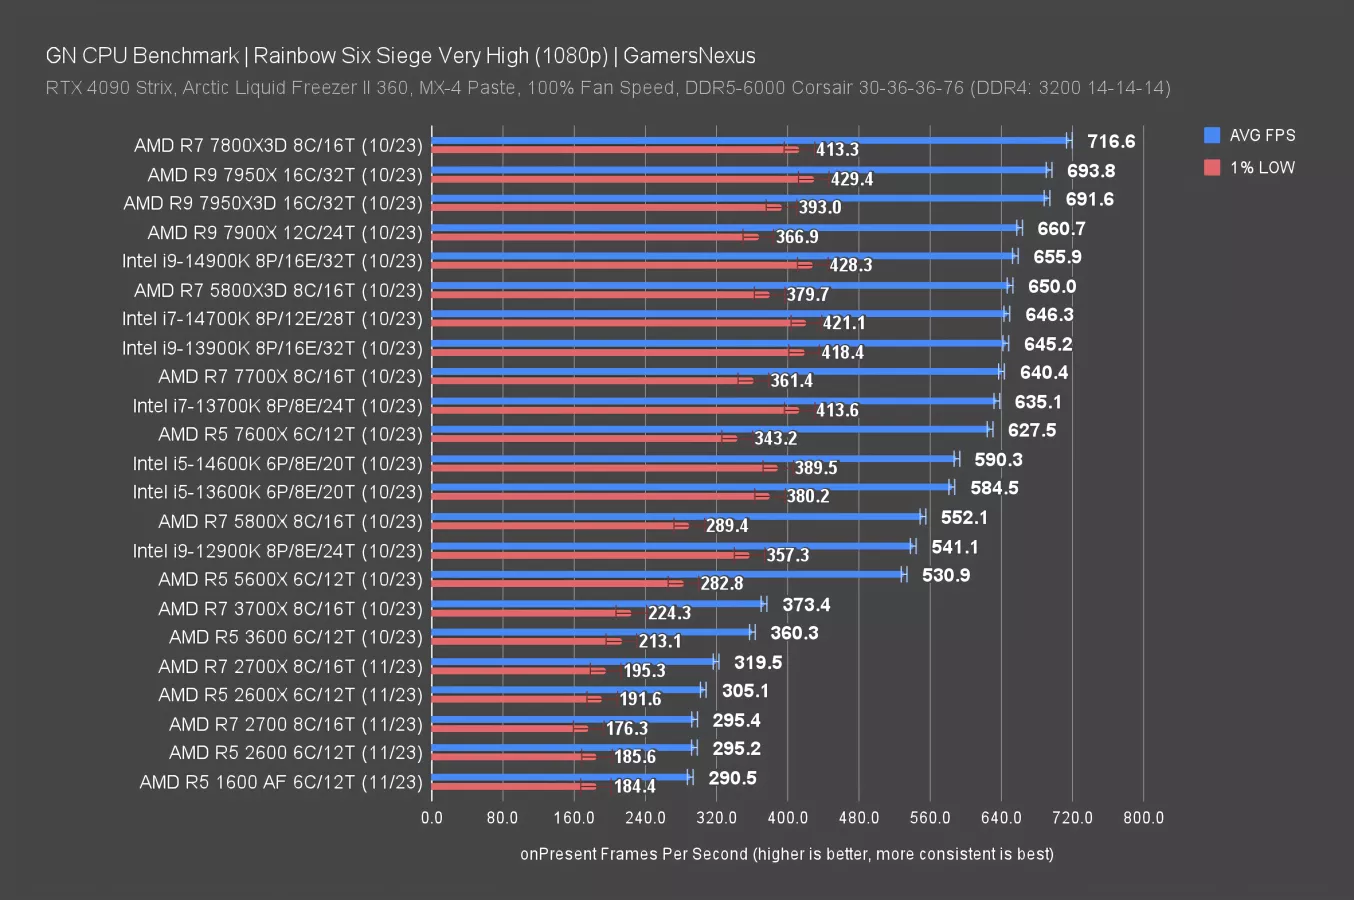
Our last game test is for Rainbow Six Siege: In this benchmark, the 3D cache scaling is huge. You can see that when jumping between the 5800X and 5800X3D (at 552FPS AVG to 650FPS AVG, or from the 7700X’s 640FPS to 717FPS AVG with the 7800X3D). The older 2000 series had the 2600 at 295 FPS, the 2600X at 305, and the 1600 AF at 291. The improvement to a 5800X3D is massive here, at 120% from the 2600. The jump to the 5600X is also a meaningful change. New builds with a 7800X3D would multiply in performance to 717FPS AVG, with the Intel 13600K mid-range option offering a step between the 5800X3D and 5600X.
The wild thing with this chart is just how clear the generational improvement is: If we draw a horizontal line between the 5600X and 3700X, there’s a clear gap that forms as a result of generational changes, particularly with clock speed.
Production Benchmarks: Blender, Premiere, Photoshop
AMD R5 2600 & 2600X Blender Benchmark
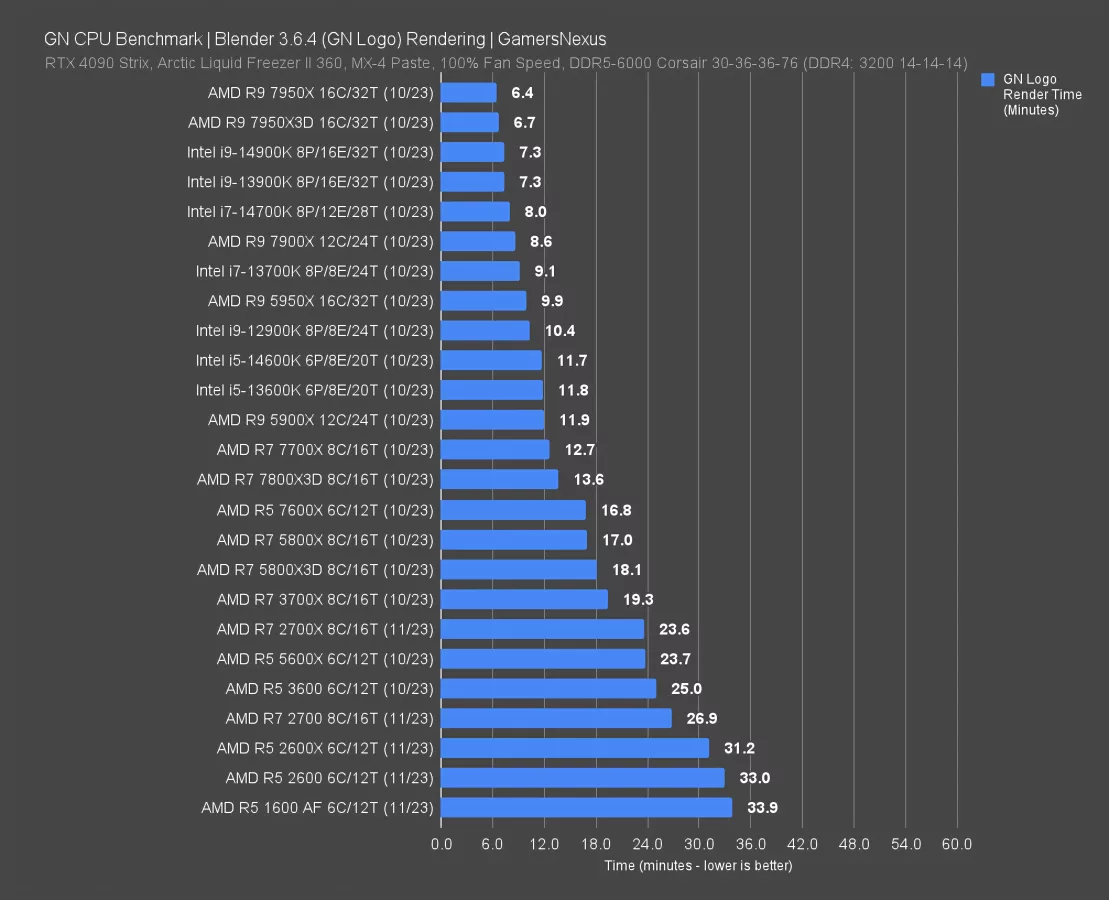
Now we’re moving on to production benchmarks, including Blender rendering -- which we should rename Blendering. For this, we’re adding the 5950X and 5900X to the charts, as they may be viable upgrade options for anyone who’s heavy in non-gaming workloads. In Blender, smaller bars are better, so we don’t invert the axis and turn it into a rate for this test but instead use the base metric of time. Some other tests conducted in suites, like Puget’s, invert the axis and use aggregate calculations for “bigger bar better” charts. But we keep it simple in Blender. Calculating improvement means % time reduced for CPUs that complete the single frame fixed unit of work in less time.
In this, the R5 2600 required 33 minutes to complete the render, allowing the 2600X to complete the work in 5% time reduced. The 2700 and 2700X show clear core (and with the latter, frequency) scaling in this work. Upgrade paths might include the 5800X at 17 minutes, or an improvement of 48% from the 2600 when calculating time reduced on a smaller-is-better axis with the base metric unchanged. The 5950X would offer an insane improvement if you went heavier on this kind of work, although the value against a brand new build would heavily depend on pricing. The jump to about 10 minutes render time is massive, or a 70% time reduction. The 13600K offers value as a balanced chip here, with its good overall gaming performance earlier and advantaged all-core performance against something like the 5800X3D. There’s a reason it won best balanced CPU from us.
AMD R5 2600 & 2600X 7-Zip Compression Benchmark
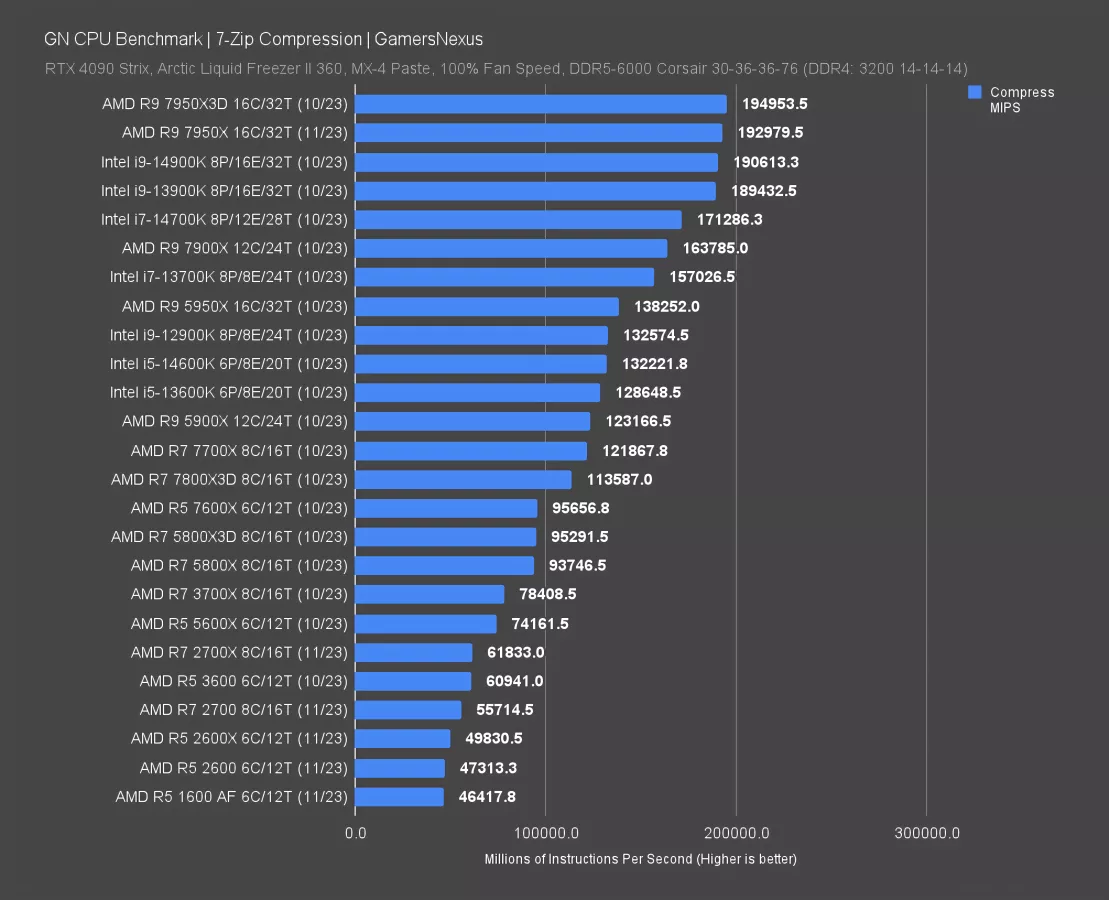
7-Zip compression is up now, back to “bigger-bar-better” for when “bigger number better.”
In this one, the 2600, the X, and the 1600 AF are all adjacent at the bottom of the updated chart. The 5600X would offer a meaningful uplift in file compression performance, with large gains coming from the 13600K or, if you can spend more, the 5950X. Newer CPUs like the 7900X or 7950X begin offering crazy performance improvements, but these would really only be worth paying for if you regularly run compression processes.
AMD R5 2600 & 2600X 7-Zip Decompression Benchmark
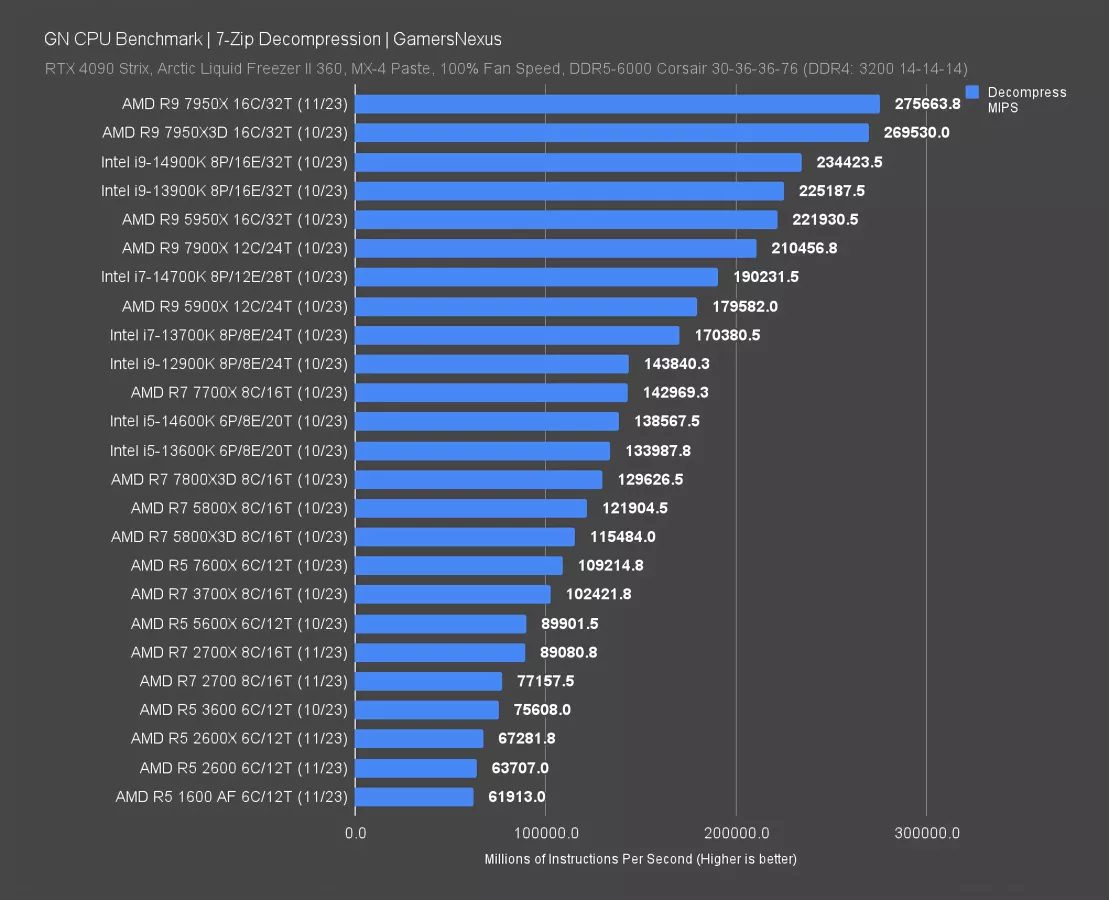
In file decompression, still measured in millions of instructions per second, the 2600X allowed the 5800X an improvement of 81% and the 5950X an improvement of 230%. The 13600K again provides a good balance, although the 5800X3D isn’t too distant if your focus is gaming first-and-foremost.
AMD R5 2600 & 2600X Adobe Premiere Benchmark
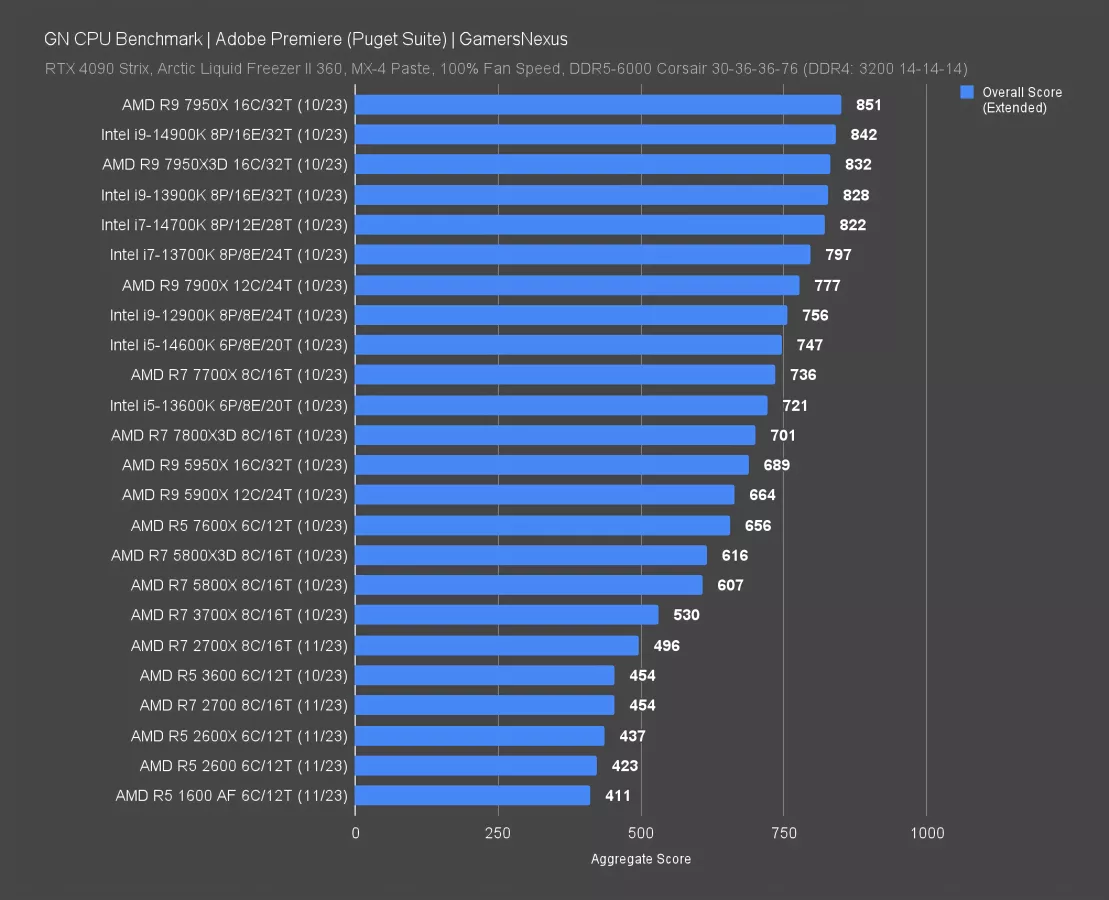
The next one is Adobe Premiere, tested with Puget’s bench where it aggregates multiple scores based on performance. Premiere can be measured in a number of ways depending on what’s done: Examples could include simple FPS for playback and scrubbing and time for rendering. Here, Puget converts various results to a single weighted points-based system.
The 2600 scored 423 points here, just ahead of the 1600 AF and predictably just behind the 2600X. The 5800X and X3D score around 607-616 points, or an uplift maximally of 46% over the 2600. The 7700X also posts large gains of 74% over the 2600 and would be a good, modern option. From Intel, the 13600K again illustrates a good balance of price, gaming performance, and non-gaming performance. The 14900K and 7950X are chart leaders here.
AMD R5 2600 & 2600X Adobe Photoshop Benchmark
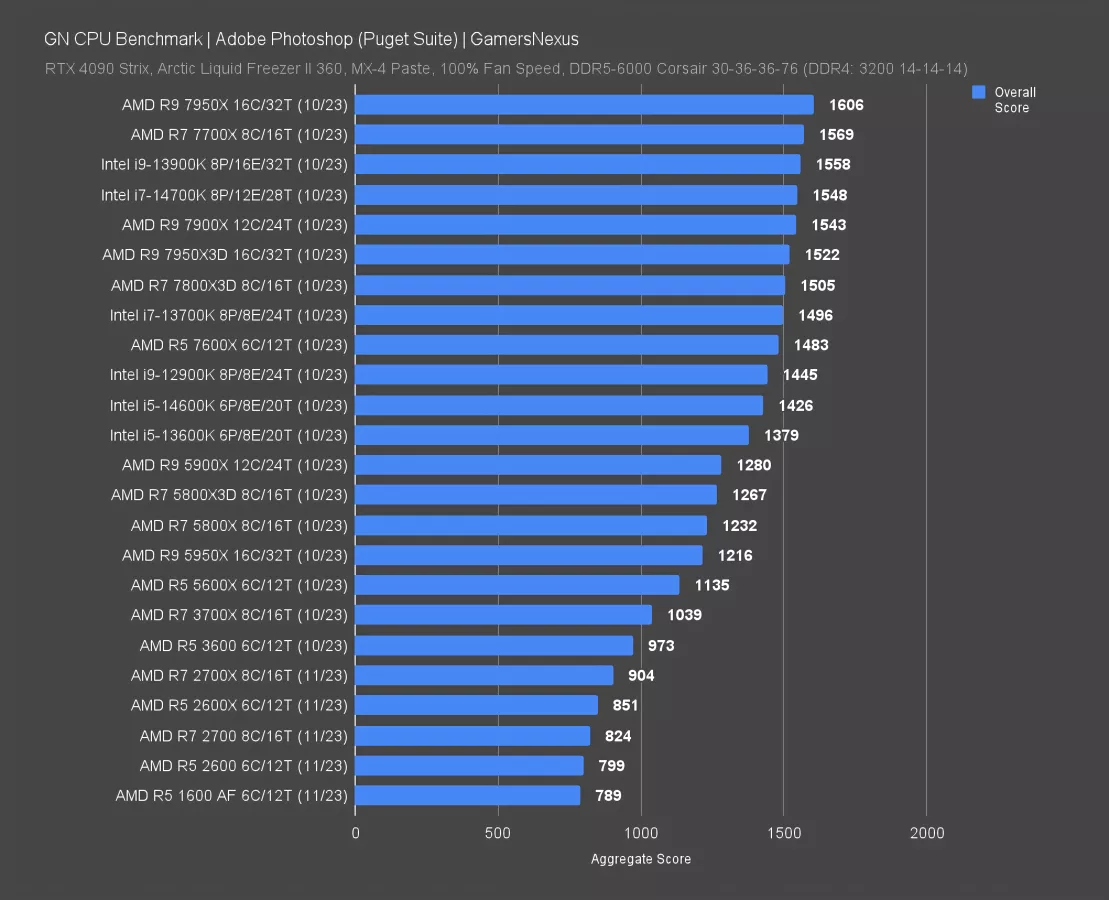
Adobe Photoshop still hates optimization, but it seems to hate it less than it used to.
In this one, the 2600, 2600X, and 1600 AF again establish the chart base. The 5600X posts a massive improvement from generational changes, marking a 33% boost over the 2600X. The 5950X sadly doesn’t benefit from its core count much here, with the 5900X establishing more of a so-called “sweet spot.”
The 7700X offers a great balance by leading the chart but remaining in a more affordable price class, with the 13600K doing the same but with more price focus at a sub-$300 price class these days.
AMD R5 2600 & 2600X Power Consumption Benchmark
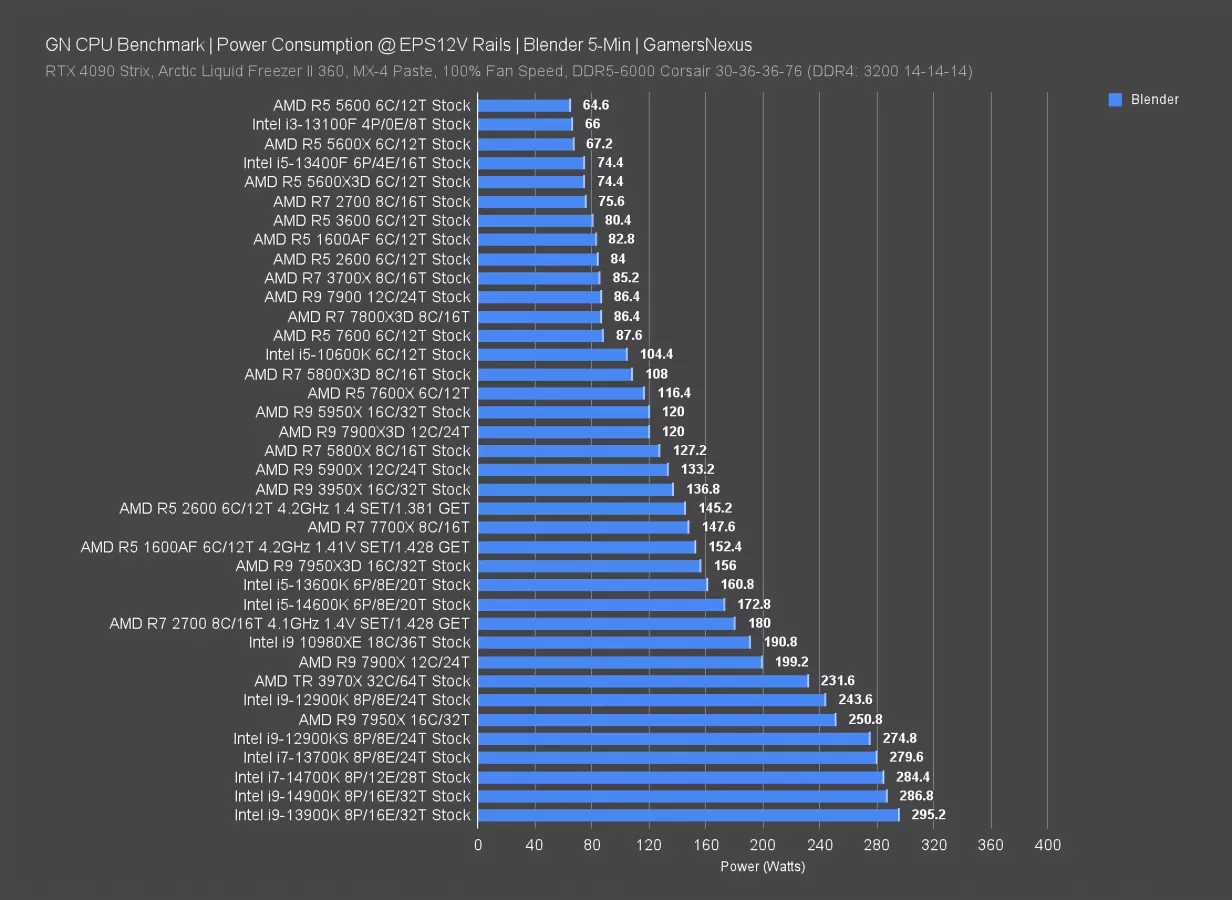
Here’s the power consumption chart. The R5 2600 originally was measured at about 84W when tested in the exact same conditions as our modern CPUs are tested. The X isn’t on this chart, but we did overclock the 2600 to 4.2GHz back in the day: For that test, we measured a 145W draw at the EPS12V cables, with the 1600 AF pulling 152W for its higher Vcore requirement to sustain 4.2GHz. The 1600 AF base model pulled 83W.
The non-overclocked numbers are easy to cool by today’s standards. The overclocked numbers, while super inefficient overall, still manage to be lower than a lot of today’s CPUs.
AMD R5 2600 & 2600X Energy Efficiency Benchmark
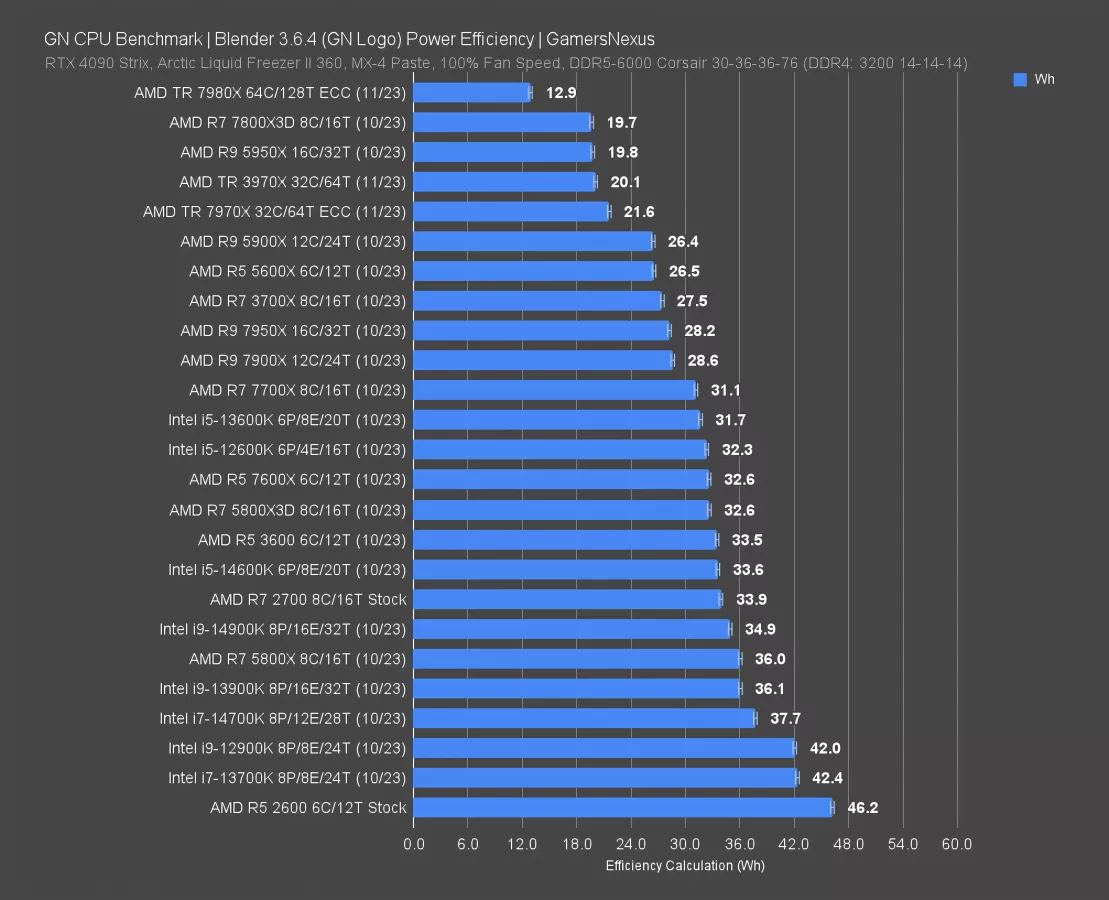
Here’s the efficiency chart, where we’re completing a single frame of work and monitoring the energy consumption. In this one, the 2600 ranked the lowest on the chart, at 46Whr. Although the 84W draw (in the previous chart) was relatively low in an absolute sense, the efficiency isn’t nearly as strong as modern AMD parts. Anyone upgrading from this generation will see huge improvements in efficiency, or the amount of work completed against the power. The 2700 pulled about 8-9W less power in Blender testing which, alongside its core count increase and therefore performance boost, made it much more efficient than the 2600.
This might be the real story: AMD’s efficiency has significantly improved generationally. Some of that is also in the BIOS improvements.
AMD R5 2600 and 2600X in 2024

The performance of the AMD R5 2600, just like the R7 2700, which we also recently revisited, is clearly still good for a lot of the games we tested. It becomes a question of if it’s good for the applications you’re running. If you’ve transitioned into more multithreaded applications and workloads, you’re probably starting to feel its age. While the R5s from that era were competitive at the time for their pricing, things have definitely changed when you factor in newer CPUs, which may make it a compelling reason to upgrade. You may also want to build a new computer or feel like you could get more framerate performance out of your games.
As a general reminder, these are still capable CPUs, so if the performance of your system isn’t bothering you then you don’t have to upgrade. If you did want to upgrade then the obvious choice would be the 5800X3D, which will get you the most out of AM4.
If you wanted to move to a new platform, the next obvious option from a budget-conscious and balanced-build perspective would be the 13600K, especially the KF SKU with its occasional price drops (assuming you don’t need the IGP).
If you want to stick with AMD but are still a little budget-conscious, the 7700X is a pretty good contender replacement for these R5s. If you want a truly high end CPU, then you might want to look at the 7800X3D for gaming. On Intel’s side, there are also the 14700K and 14900K for mixed workloads. It’s worth noting that Intel’s 13-series is mostly the same thing. These options are noticeably more expensive, however, which make the 5800X3D and 7700X options that are worth looking more into for what you do. For more gaming heavy scenarios, we would start looking at the X3D, for more mixed workloads and less of a focus on just gaming, then an i5, maybe an i7, or 7700X are all worth your consideration.