We interview Intel engineer Tom Petersen and talk about the advancements behind PresentMon 2.0
The Highlights
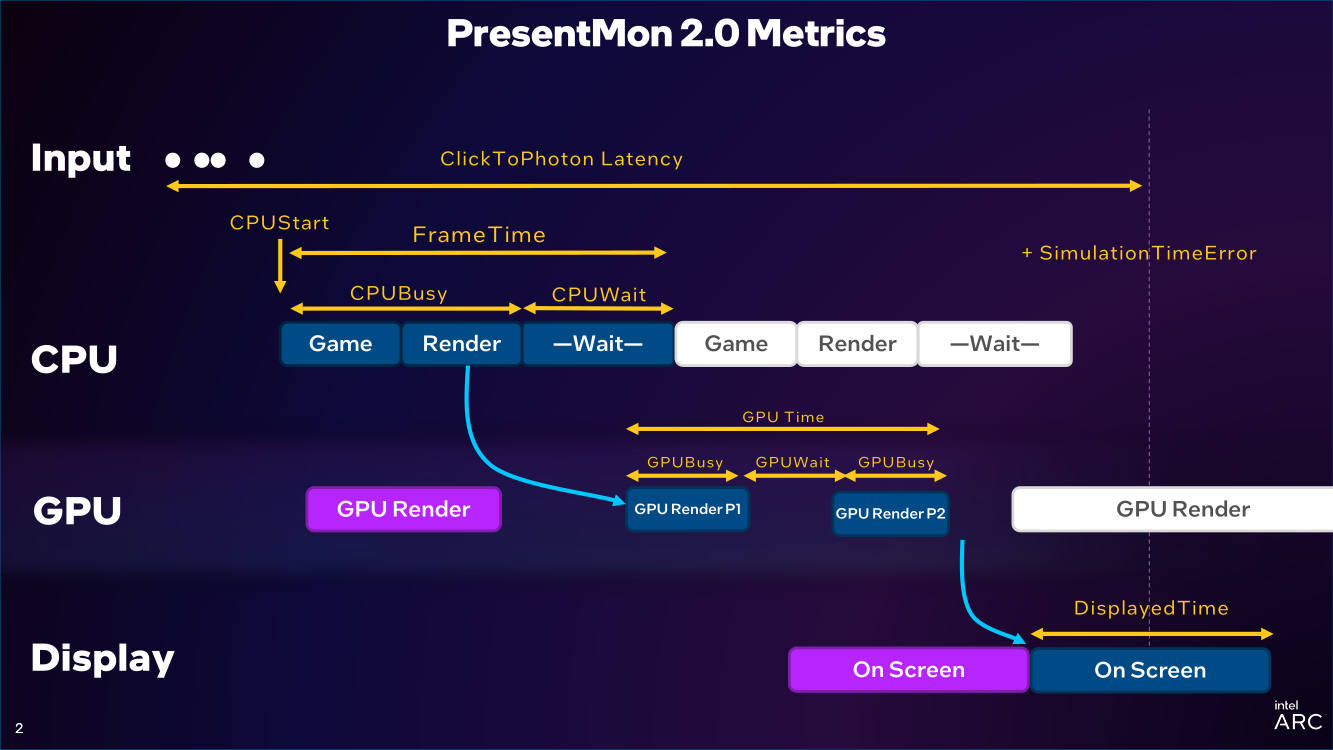
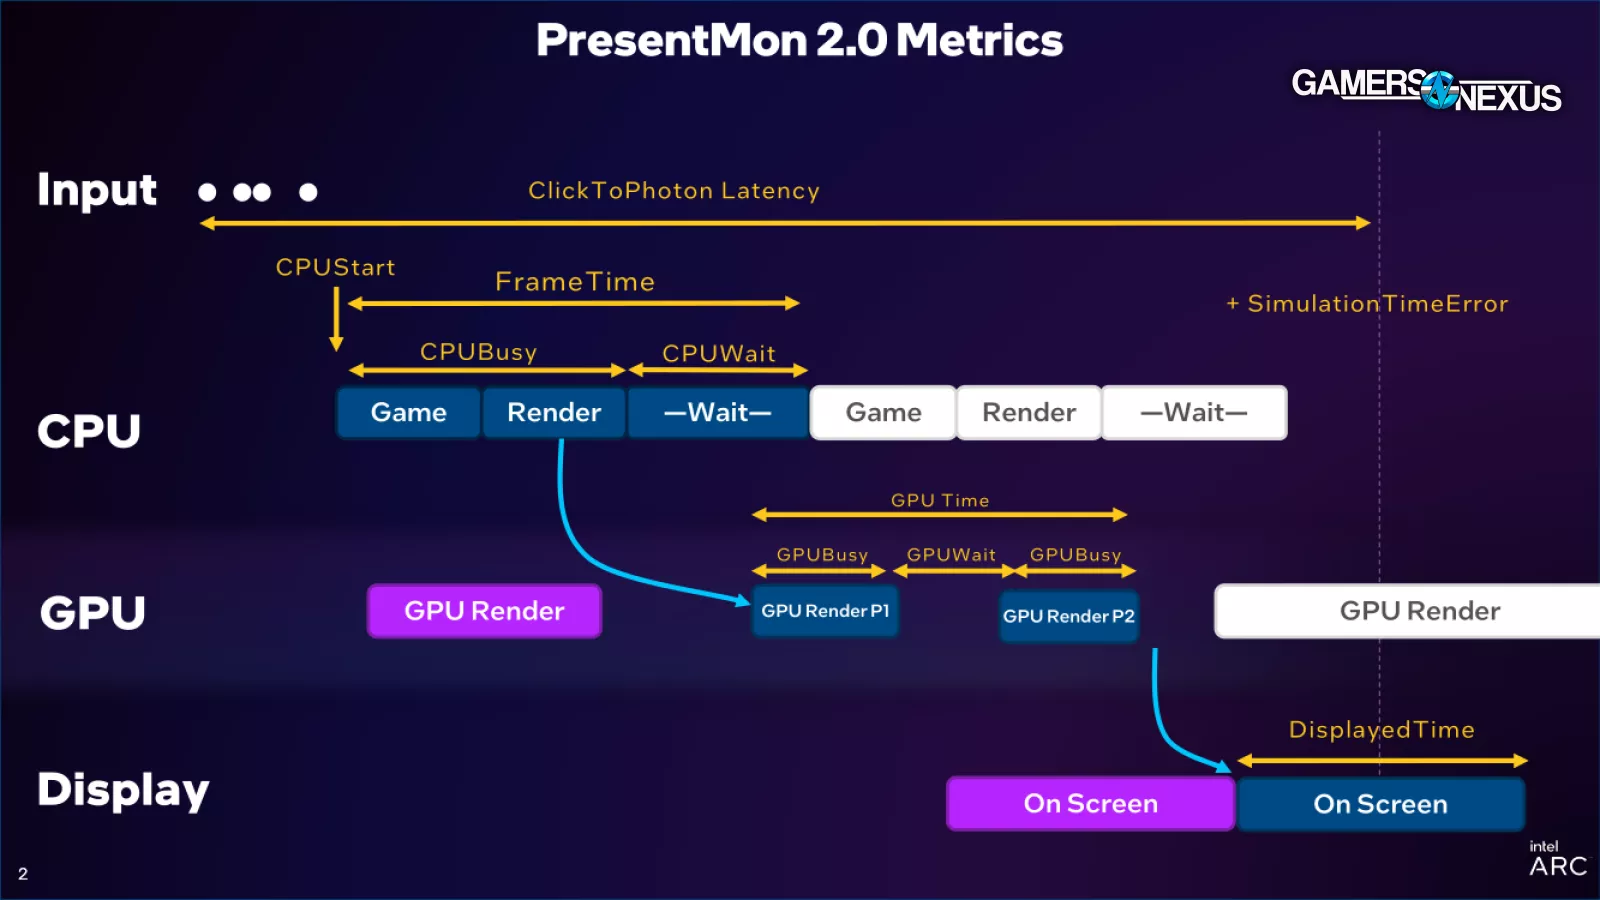
- PresentMon 2.0 will indicate GPU wait and busy times within the render time, which shows the interdependency between the GPU and CPU
- PresentMon 2.0 is currently in beta and currently doesn't have a public release date
- PresentMon 2.0 will highlight simulation time error, which aims to measure stuttering in a novel way

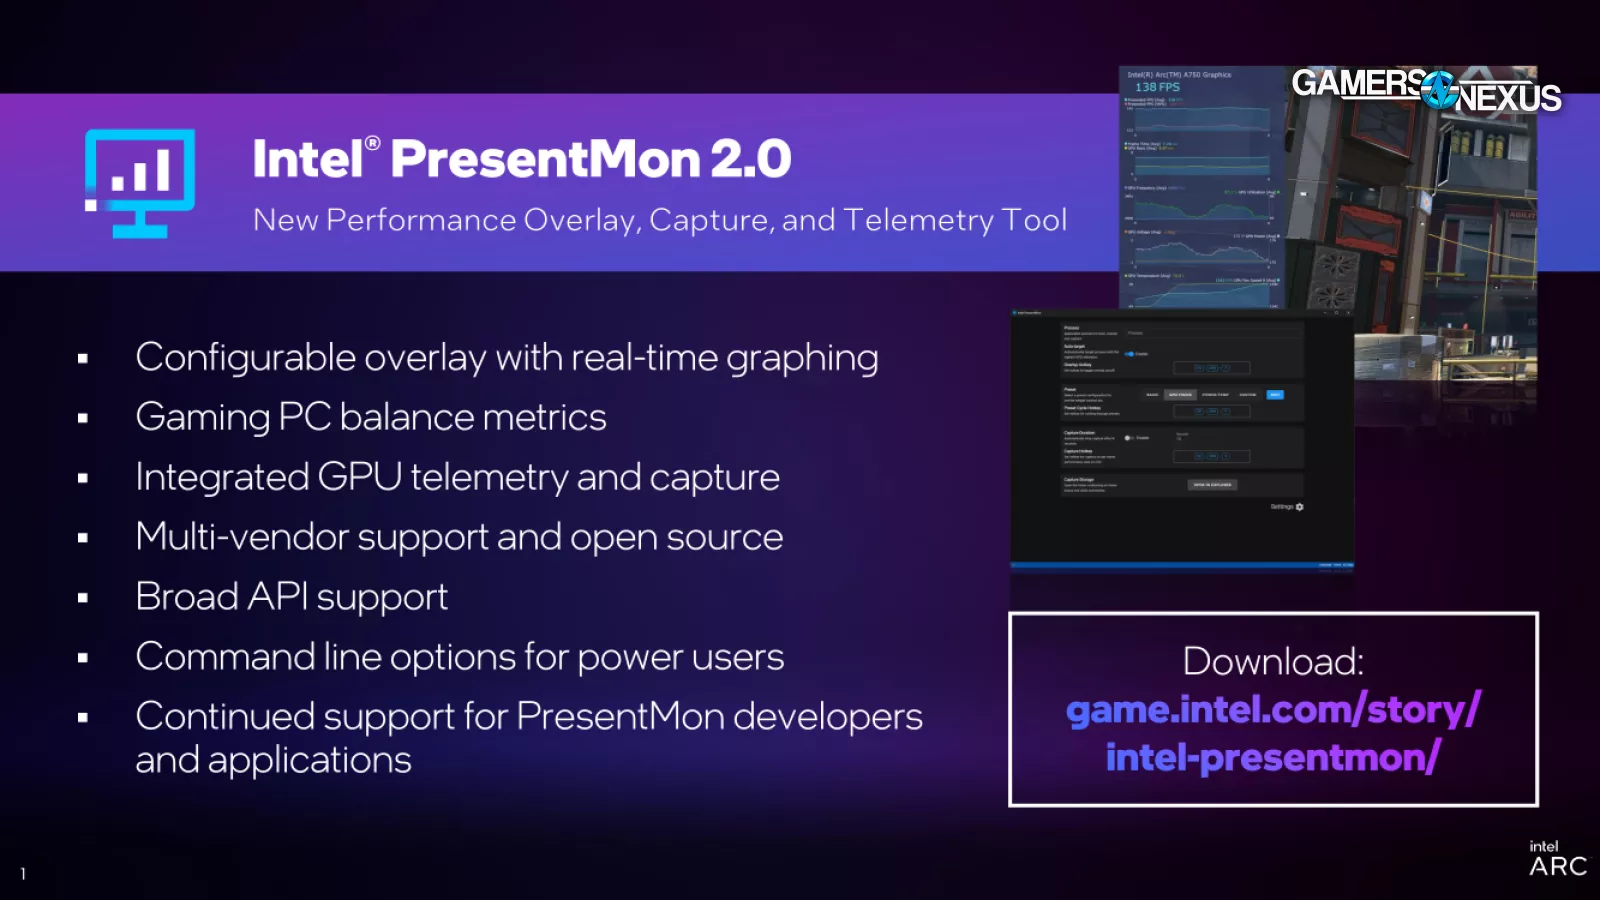
We recently had the chance to catch up with Intel engineer Tom Petersen, with whom we’ve spoken in the past about benchmarking concepts like GPU Busy. This time, we talked about the open source PresentMon 2.0, which is an update to an open-source tool from Intel that has long since supplanted FRAPS. We've been using PresentMon for around a decade at this point in our benchmarks, as have many other reviewers; however, the updates aim to bring new metrics into play to reveal bottlenecking more readily. We showcased some of these in our Dragon's Dogma 2 benchmarking recently.
In this discussion, we talk about the inadequacies of looking at just frametimes.
Editor's note: This was originally published on March 12, 2024 as a video. This content has been adapted to written format for this article and is otherwise unchanged from the original publication.
Credits
Host
Steve Burke
Video Editing, Camera
Vitalii Makhnovets
Video Editing
Tim Phetdara
Writing, Web Editing
Jimmy Thang
With PresentMon 2.0, which is currently in beta, the software will show GPU wait times within the render time, which shows the interdependency between the GPU and CPU. Previously, PresentMon introduced GPU Busy (msGPUActive), but GPU Wait allows us to see inside the GPU Busy metric to determine if the GPU (despite appearing "busy") is still waiting on the CPU in between its rendering operations.
PresentMon 2.0 will also show simulation time error, a representation of stuttering. Whereas frametime measures variations in the delivery interval for each frame, simulation time error directly measures errors or a mismatching of game animation / the game state and the frame being presented. In other words, when the game just sort of feels bad but doesn't necessarily have a direct latency problem or frametime problem. This might be an instance where the simulation is erroneously matched to the frame being presented, meaning you're viewing data which is effectively out of sync with the visual, despite a potentially good frametime itself.
According to Petersen, you ideally want the step between frame times to be uniform.
PresentMon 2.0 is still a work in progress but GamersNexus is experimenting with creating an error per second metric that will indicate, most likely, when a particular game is problematic. Dragon's Dogma 2 gave us a strong start to that.
In our discussion, Petersen also mentioned that Intel is also working on a software-based "click-to-photon" tester, which would start by looking at a USB event like a mouse or keyboard click (such as a Windows ETW marker). This can't truly be click-to-photon since there is no external capture of the "photon" part, but it may be a first step to giving 'normal' tools to end users without needing hardware. NVIDIA's FrameView also provides a PCL, or PC Latency, measurement that provides a level of evaluation for total system latency sans input and display out. Learn more about that in our recent latency engineering discussion.
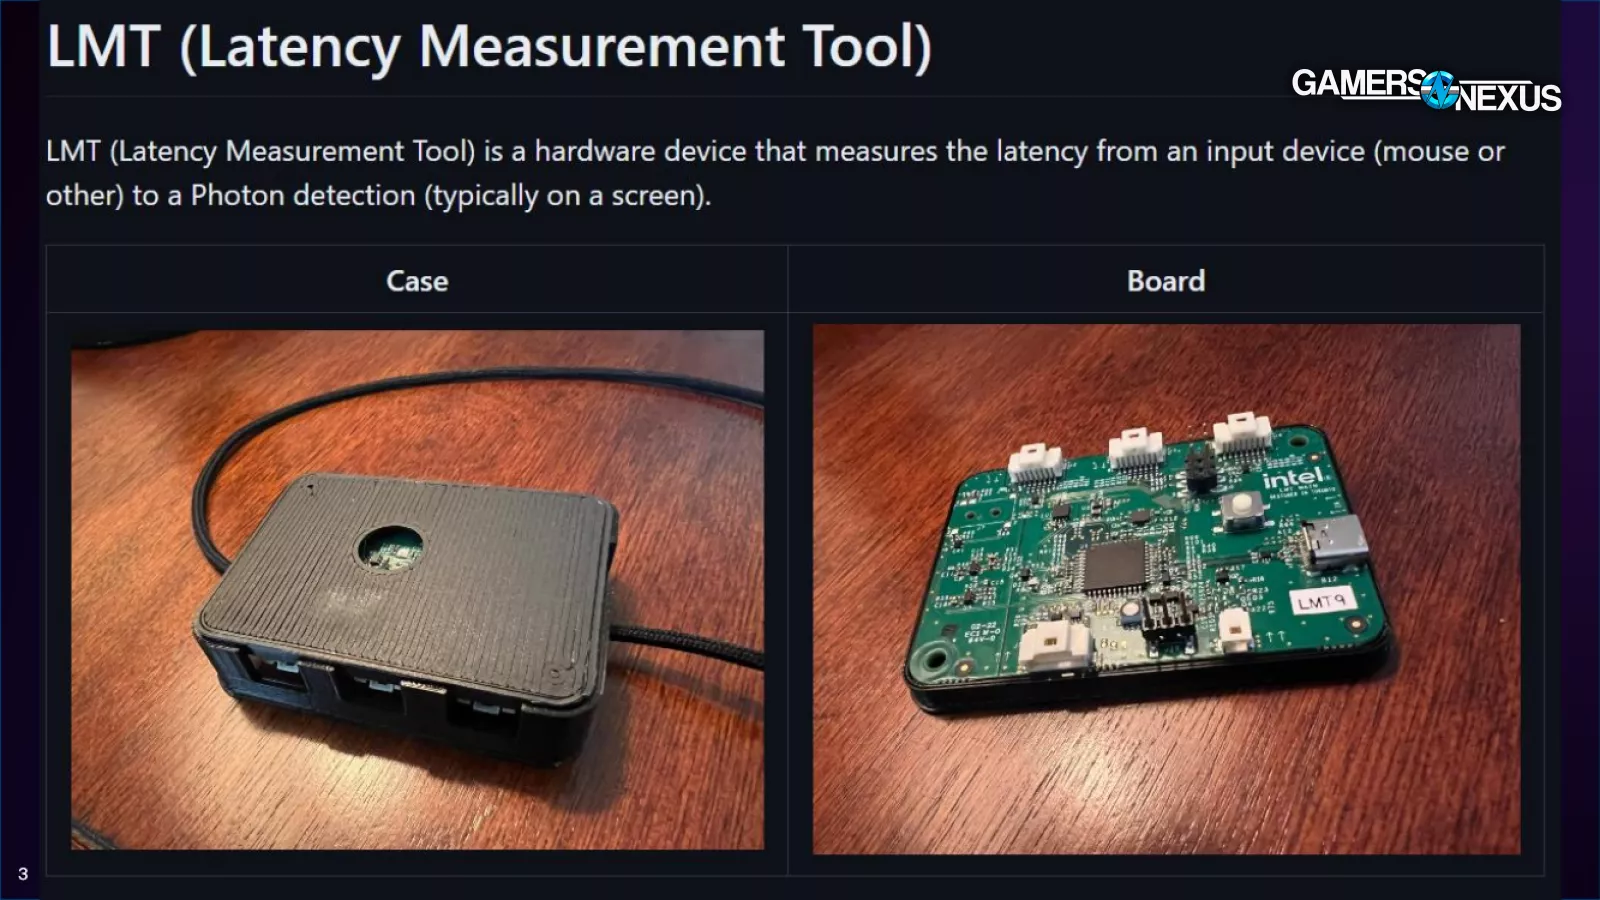
Since software latency measurements aren't perfect, Intel is also making a hardware solution called the "Latency Measurement Tool" (LMT). It’s still being refined, but Petersen says that it will eventually be integrated with PresentMon and will be completely open sourced, including PCB schematics, software, and hardware solutions. This would be an alternative to NVIDIA's LDAT. Conceptually, the devices do the same thing, but differences in openness and in capability set them apart. NVIDIA's has some more advanced functionality baked into the software, while Intel's will be (theoretically) wide open.
In the video embedded above, we take a look at PresentMon 2.0’s interface, which highlights how the software is able to examine CPU and GPU bottlenecks. The tool also has very robust histogram features.

Petersen says that PresentMon 2.0 will be out soon and we hope to see how it might impact our testing methodology moving forward.