CrossFire RX 480 Benchmark vs. GTX 1070, GTX 1080 – Power, Thermals, FPS
Posted on
AMD's panoply of RX 480 news announcements teased superior performance to the then-new GTX 1080 when paired in CrossFire. We decided to buy a second RX 480 8GB card for $240, put it into CrossFire with our sample that we reviewed, and validate those claims.
Multi-GPU configurations are tough to benchmark. We need to perform all the same thermal, noise, power, and FPS analysis as with other devices – but special attention must be paid to 1% and 0.1% low frame values, and more attention still paid toward plotting metrics versus time. Frequency, temperature, and fan RPM have some fluctuations that appear with multi-GPU configurations which are only truly visible when plotting versus time, rather than averaging a set of thousands of points of data.
In our performance review of CrossFire RX 480 8GB cards, we test FPS in Mirror's Edge, The Division, GTA V, and more, alongside temperature, noise, and power performance. We understand that thermals, noise, and power are sometimes less exciting to readers than raw FPS output, but would strongly recommend looking into our results for this benchmark – multi-GPU setups put greater emphasis on such testing. Some games show negative scaling, some positive, and some which are nearly unchanged. All of that below.
Previous AMD RX 480 Content
AMD RX 460, RX 470, & RX 480 Specs
| AMD RX 480 | AMD RX 470 | AMD RX 460 | |
| Architecture | Polaris 10 | Polaris 10 | Polaris 11 |
| Compute Units (CUs) | 36 | 32 | 14 |
| Stream Processors | 2304 | [Unverified] 2048? | [Unverified] 864? |
| Base / Boost Clock | 1120MHz / 1266MHz | ? / ? | ? / ? |
| COMPUTE Performance | >5 TFLOPS | >4 TFLOPS | >2 TFLOPS |
| Graphics Command Processor (GCP) | 1 | 1 | 1 |
| ACEs | 4 | ? | 2 |
| HWS | 2 | 2 (?) | 2 |
| TMUs | 144 | ? | 64 |
| Pixels Output / Clock | 32 | ? | 16 |
| Geometry Processors | 4 | ? | 2 |
| L2 Cache | 2MB | ? | 1MB |
| LSU | 576x32b | ? | 256x32b |
| VRAM Capacity | 4GB GDDR5 @ 7Gbps 8GB GDDR5 @ 8Gbps | 4GB GDDR5 | 2GB GDDR5 |
| Memory Interface | 256-bit | 256-bit | 128-bit |
| Memory Speed | 7Gbps (4GB model) 8Gbps (8GB model) | 7Gbps | 7Gbps |
| Memory Bandwidth | 224GB/s (4GB model) 256GB/s (8GB model) | ??? | ??? |
| TDP | 150W | 110W | 75W |
| Power Connectors | 6-pin | 6-pin | None (Slot only) |
| Display Port | 1.3 HBR / 1.4 HDR | 1.3/1.4 HDR | 1.3/1.4 HDR |
| Release Date | June 29 | Mid-July | End of July |
Polaris 10 vs. Polaris 11 Specs & Architecture
| Polaris 10 | Polaris 11 | |
| Compute Units (CUs) | 36 | 16 |
| COMPUTE Performance | “>5 TFLOPS” | “>2 TFLOPS” |
| Memory Interface | 256-bit | 128-bit |
| Architecture | Gen 4 GCN | Gen 4 GCN |
| Playback Support | 4K encode/decode | 4K encode/decode |
| Output Standard | DP1.3/1.4 HDR | DP1.3/1.4 HDR |
When Do Multiple GPUs Do Well? When Don't They?
Multi-GPU configurations come in two primary modes: LDA, or Linked Display Adapter, and MDA, or Multi-Display Adapter. LDA is more traditional and relies upon a bridge, while MDA (exposed best through new APIs) can enable non-same GPUs to be paired together, and uses the PCIe bus for communication between cards.
For the most part, modern games do not yet expose multiple non-same GPUs through their programming or through their APIs – which still see large representation by Dx11. Ashes of the Singularity is among the only games that can actually leverage MDA and see positive results, but it took a year or more of near-negative scaling to Dx12.
Multiple GPUs tend to do well in environments where frames are more independent; that is to say, when the GPU isn't instructed to perform temporal (frame-to-frame) analysis of the graphics it's rendering. Interdependent frames hurt the ability for AFR (Alternate Frame Rendering) to work properly, and can actually cause negative scaling in some instances. That'd be where you want to disable a GPU to make things work better, which is never a good feeling considering it turns into an expensive brick.
Interdependence during frame rendering is mostly caused by post processing effects, or Post FX. Post FX are well represented in Mirror's Edge Catalyst, which makes heavy use of high dynamic range rendering (HDR), bloom, lens flares and motion blur, ambient occlusion, and plenty of other effects (like crepuscular rays, or “godrays”). These are computationally intensive processes that don't play well with multi-GPU configurations and hog cycles, which (one frame to the next) can cause a slowdown on one or both of the GPUs in the system. If one card gets hit more heavily and slows on its frame delivery, we start seeing frame latency gaps that become noticeable and cause “stuttering” or apparent frame drops. This latency between frames is represented by 1% low and 0.1% low metrics in our benchmarks.
Mirror's Edge Catalyst also makes a lot of use of filtration effects and texture filtration, both drawing big on the VRAM pool. This is shown in our 4GB vs. 8GB RX 480 benchmark.
Games that don't rely quite as heavily on Post FX will run better with AFR than those that do. This is why we've had a history of stating that SLI and CrossFire are both still hit and miss, and that the efficacy of such a setup hinges upon the type of game played.
Game Test Methodology
We tested using our GPU test bench, detailed in the table below. Our thanks to supporting hardware vendors for supplying some of the test components.
The latest AMD drivers (16.6.2 RX 480 press) were used for testing. We used 16.7.1 for GTA V & for power draw. NVidia's 368.69 drivers were used for game (FPS) testing. Game settings were manually controlled for the DUT. All games were run at presets defined in their respective charts. We disable brand-supported technologies in games, like The Witcher 3's HairWorks and HBAO. All other game settings are defined in respective game benchmarks, which we publish separately from GPU reviews. Our test courses, in the event manual testing is executed, are also uploaded within that content. This allows others to replicate our results by studying our bench courses. In AMD Radeon Settings, we disable all AMD "optimization" of graphics settings, e.g. filtration, tessellation, and AA techniques. This is to ensure that games are compared as "apples to apples" graphics output. We leave the application in control of its graphics, rather than the IHV.
Windows 10-64 build 10586 was used for testing.
Each game was tested for 30 seconds in an identical scenario, then repeated three times for parity. Some games have multiple settings or APIs under test, leaving our test matrix to look something like this:Average FPS, 1% low, and 0.1% low times are measured. We do not measure maximum or minimum FPS results as we consider these numbers to be pure outliers. Instead, we take an average of the lowest 1% of results (1% low) to show real-world, noticeable dips; we then take an average of the lowest 0.1% of results for severe spikes.
| GN Test Bench 2015 | Name | Courtesy Of | Cost |
| Video Card | This is what we're testing! | - | - |
| CPU | Intel i7-5930K CPU | iBUYPOWER | $580 |
| Memory | Corsair Dominator 32GB 3200MHz | Corsair | $210 |
| Motherboard | EVGA X99 Classified | GamersNexus | $365 |
| Power Supply | NZXT 1200W HALE90 V2 | NZXT | $300 |
| SSD | HyperX Savage SSD | Kingston Tech. | $130 |
| Case | Top Deck Tech Station | GamersNexus | $250 |
| CPU Cooler | NZXT Kraken X41 CLC | NZXT | $110 |
For Dx12 and Vulkan API testing, we use built-in benchmark tools and rely upon log generation for our metrics. That data is reported at the engine level.
Video Cards Tested
- AMD RX 480 8GB ($240)
- NVIDIA GTX 1080 Founders Edition ($700)
- NVIDIA GTX 980 Ti Reference ($650)
- NVIDIA GTX 980 Reference ($460)
- NVIDIA GTX 980 2x SLI Reference ($920)
- AMD R9 Fury X 4GB HBM ($630)
- AMD MSI R9 390X 8GB ($460)
Thermal Test Methodology
We strongly believe that our thermal testing methodology is the best on this side of the tech-media industry. We've validated our testing methodology with thermal chambers and have proven near-perfect accuracy of results.
Conducting thermal tests requires careful measurement of temperatures in the surrounding environment. We control for ambient by constantly measuring temperatures with K-Type thermocouples and infrared readers. We then produce charts using a Delta T(emperature) over Ambient value. This value subtracts the thermo-logged ambient value from the measured diode temperatures, producing a delta report of thermals. AIDA64 is used for logging thermals of silicon components, including the GPU diode. We additionally log core utilization and frequencies to ensure all components are firing as expected. Voltage levels are measured in addition to fan speeds, frequencies, and thermals. GPU-Z is deployed for redundancy and validation against AIDA64.
All open bench fans are configured to their maximum speed and connected straight to the PSU. This ensures minimal variance when testing, as automatically controlled fan speeds will reduce reliability of benchmarking. The CPU fan is set to use a custom fan curve that was devised in-house after a series of testing. We use a custom-built open air bench that mounts the CPU radiator out of the way of the airflow channels influencing the GPU, so the CPU heat is dumped where it will have no measurable impact on GPU temperatures.
We use an AMPROBE multi-diode thermocouple reader to log ambient actively. This ambient measurement is used to monitor fluctuations and is subtracted from absolute GPU diode readings to produce a delta value. For these tests, we configured the thermocouple reader's logging interval to 1s, matching the logging interval of GPU-Z and AIDA64. Data is calculated using a custom, in-house spreadsheet and software solution.
Endurance tests are conducted for new architectures or devices of particular interest, like the GTX 1080, R9 Fury X, or GTX 980 Ti Hybrid from EVGA. These endurance tests report temperature versus frequency (sometimes versus FPS), providing a look at how cards interact in real-world gaming scenarios over extended periods of time. Because benchmarks do not inherently burn-in a card for a reasonable play period, we use this test method as a net to isolate and discover issues of thermal throttling or frequency tolerance to temperature.
Our test starts with a two-minute idle period to gauge non-gaming performance. A script automatically triggers the beginning of a GPU-intensive benchmark running MSI Kombustor – Titan Lakes for 1080s. Because we use an in-house script, we are able to perfectly execute and align our tests between passes.
Noise Testing Methodology
Our noise testing methodology is new and still being revised, but has been kept consistent across all tests contained herein. We test noise in a real-world environment and do not presently use an anechoic chamber. The results align with what consumers will encounter in their own rooms.
We use a REED logging dB meter mounted to a tripod, whose mic is positioned 20” from the face of the GPU (mounted in an open bench). The REED meter is approximately 6” above the bench. All open bench fans are disabled. The Kraken X41 CPU cooling fan is configured to its “silent” mode, minimizing its noise output to be effectively imperceptible.
A noise floor measurement is taken prior to each test's execution to determine ambient without any systems running in the room. We then take an idle measurement (GPU & CPU at idle). Our noise floor has a fluctuation of approximately +/-0.6dB.
Noise levels are logarithmic, and are therefore not as simple to perform delta calculations as thermals or framerates. Noise percent differences are calculated using dB=20*log(V2/V1) (where V is amplitude). You cannot perform a simple percent difference calculation to determine the delta. For an example, a 10dB range (50dB vs. 40dB) is not equal to a 22% delta.
After the noise floor is determined, we log idle fan dB, 50% speed dB, and 100% speed dB (configured in Afterburner). We also measure auto fan dB at an identical stepping for every test; we do this by running Kombustor for exactly 5 minutes prior to beginning dB logging, which is useful for fans which use two push fans. Some dual-push fan cards will only trigger the second fan if the VRM is under load.
Power Testing Methodology
Power consumption is measured at the system level. You can read a full power consumption guide and watt requirements here. When reading power consumption charts, do not read them as a GPU-specific requirements – this is a system-level power draw.
Power draw is measured during a FireStrike Extreme - GFX2 run. We are currently rebuilding our power benchmark.
For regular readers: We have begun the process of migrating off of our Z97 test platform for power. This means that the new power chart is scarcer, but on the same platform as everything else.
Continue to the next page for thermal benchmarks, noise, and power!
CrossFire RX 480 Thermal Benchmark – Temperatures vs. Single Card
Thermal benchmarking for CrossFire puts the cards through our normal bench, but we also research the “over time” metrics more heavily. Running two fans makes the RPM important, as we're now stacking noise to some effect. Heat build-up is also a real danger, especially in a case (which we don't test in – we use an open bench) where dissipation abilities may be minimized.
AMD's RX 480 reference card uses a standard radial blower fan for the cooler. The fan protrudes past the PCB itself, and uses a backplate that's got a cut-out exposing the rear of the blower fan. As shown in our RX 480 tear-down, the card uses a heat plate to cool the PCB and board components, with thermal pads and small aluminum fin protrusions for the VRM and VRAM. MOSFETs sit “behind” the GPU, on the left side of the card, and the blower fan pushes air through the GPU heatsink and over the VRM heat plate.
Note: Our cards were tested with two PCI-e slots between them. On the EVGA X99 Classified board, that'd be PCI-e #1 and PCI-e #4. This is the ideal configuration on our board. If you're working with a more cramped space (e.g. one slot spacing), expect worse thermals.
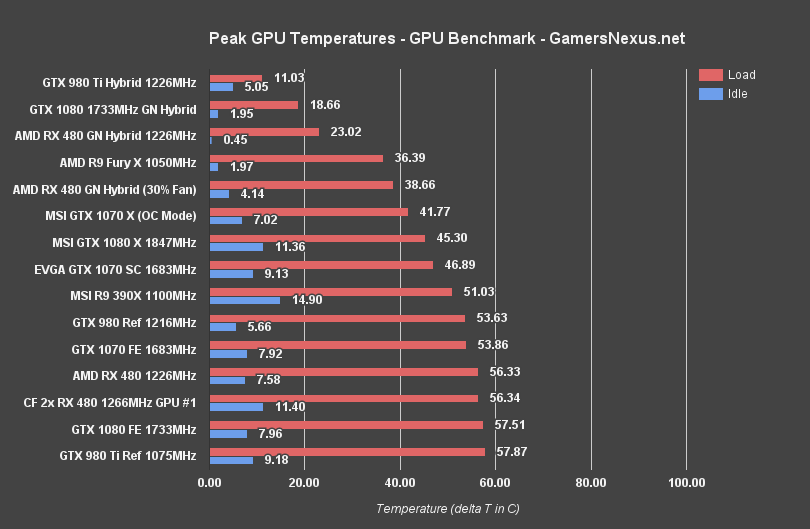
This is the “equilibrium” chart, as we loosely call it. You're looking at averaged peak thermal values for the cards under test. The idle temperatures most obviously increase with CrossFire RX 480 8GB GPUs, now sitting at 11.4C delta T over ambient versus 7.58C for the single card. We only see a slight increase in load thermals on our open bench. This is a result of AMD's default settings within Radeon Software, which configure a temperature target and vary fan speeds to match that target. The temperatures are effectively identical in an open air platform.
Trapping a multi-GPU configuration in a case may result in a worse thermal environment, but the temperatures will still be what we're seeing here. That's because the fan speed and clock-rate will both fluctuate based upon thermal needs, and the “auto” setting will define a strict 80C (up to 90C, if the user plays with settings) threshold point.
To see the actual effects of maintaining an ~80C load temperature, we need to look at frequency vs. time and the fan RPM.
CrossFire RX 480 Thermals Over Time
Here's a representation of the data as it opposes time:
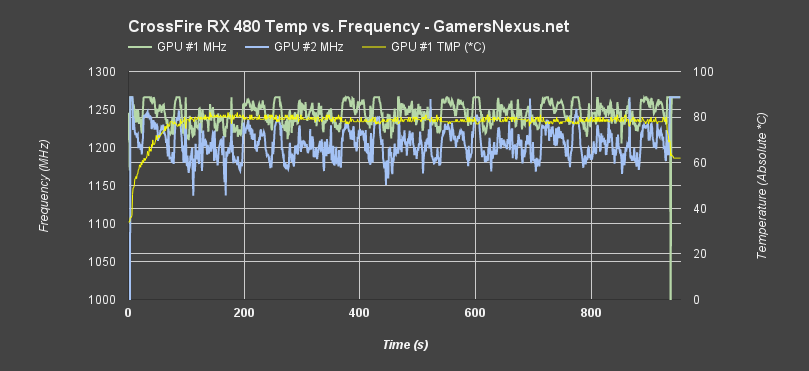
Not the easiest to read, so let's crop that chart to a 500s-800s range, and then change the temperature scale (0-100C above) to 70-90C. That'll give greater resolution to the changes.
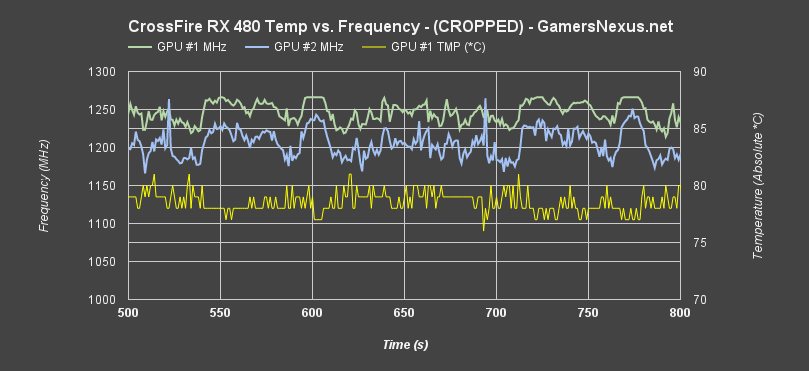
With the zoomed look at frequency and temperature versus time, we're seeing a clear tie between frequency and temperature. Each temperature spike =>80C is causing a subsequent frequency reduction, which then results in a following temperature reduction. This process repeats ad infinitum while gaming. The cards have a fluctuating frequency range of greater than 100MHz across the test, which results in occasional low frame times and FPS fluctuation. The impact is greater with multiple GPUs than with the single GPU, as we showed in our RX 480 (single card) review.
CrossFire RX 480 Fan RPMs (Auto)
Fan RPMs are directly responsible for the thermal performance. Here's what the auto output looks like:
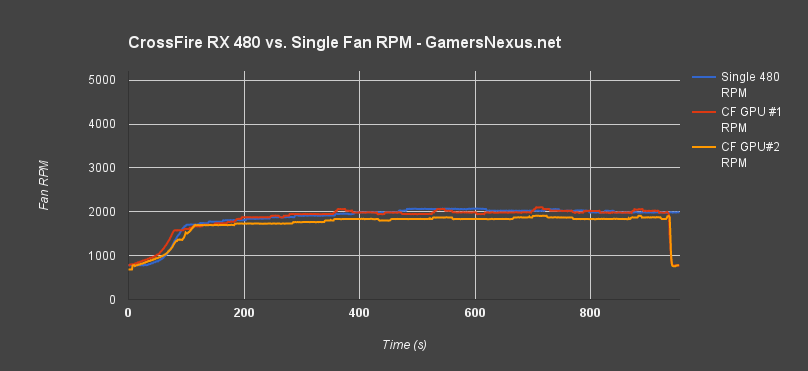
We're seeing similar fan RPMs for GPU #1 (slight overall increase), with slightly lower fan RPMs for GPU #2. Let's look at how running two fans at ~1800-2100RPM impacts noise levels.
CrossFire RX 480 Reference Noise Levels
The below formula is used to determine delta values with decibels:
![]()
Calculating dB deltas is not a simple subtraction; decibel addition and subtraction follows a logarithmic function. We extract the ambient noise (~25-27dB) from these system noise results to create linearly comparable dB readings. For more, our noise test methodology is explained on the Test Methodology page.
We're testing for Idle, Auto, 50% Fan, and 100% Fan noise levels. Idle is conducted at the desktop. For “Auto,” we run a burn-in test for 5 minutes and allow the card to ramp into its curve, then monitor fan noise and RPM from there on. AMD's RX 480 spins up to 5200RPM maximally, so 50% of that is a 2600RPM fan speed. All extra bench fans are disconnected.
Note that the below chart is representative of total system noise. As our PSU and CLC pump make some amount of fan / vibrational noise, the quietest operation will always hinge on those two devices. Even with a passive video card, we'd still be in the ~37.1dB range.
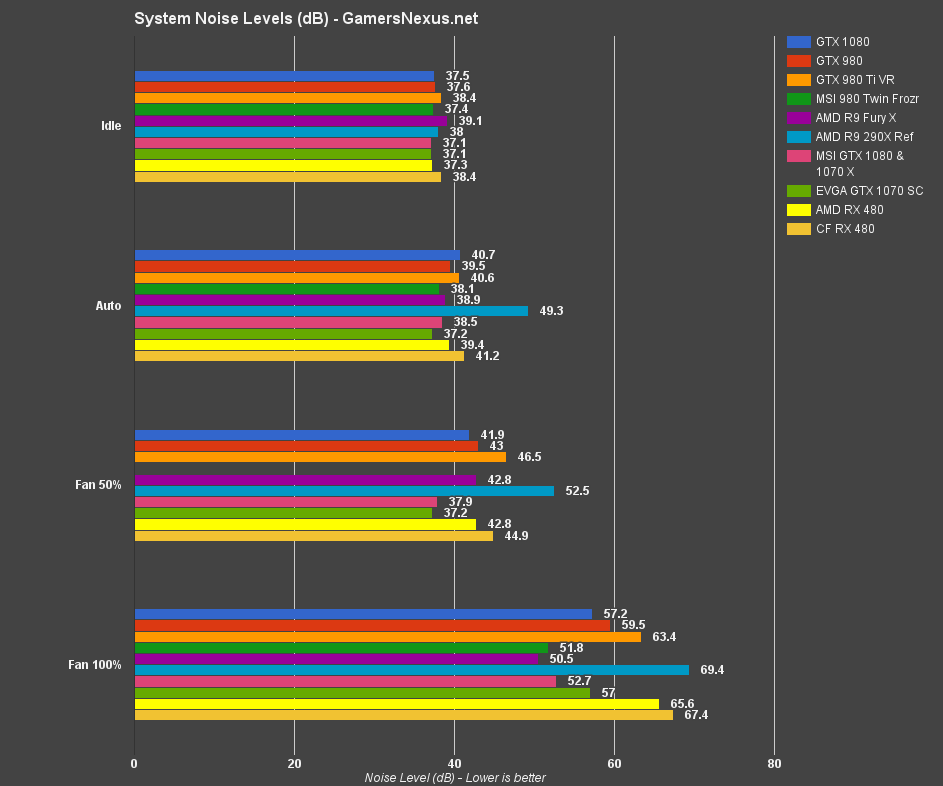
Idle has us at 38.4dB versus the 37.3dB output of a single card. Under “auto” settings, we're looking at a slightly larger dB increase, with CrossFire running at 41.2dB and the single card at 39.4dB. The noise increases of CrossFire continue through 50% fan speed, landing us now near the 980 Ti VR's (somewhat loud) fan. 100% speed, as with the RX 480 single card, is utterly unbearable.
But there's more to the noise than these charts show. A “simple” dB measurement doesn't take into account the type of noise, something for which we presently have no instruments. The CrossFire configuration amplifies the fan whine as RPM increases, and a vibration / turbulence develops with fan speeds nearing and exceeding 50% RPM.
CrossFire RX 480 Power Consumption & System VA Draw
We're measuring apparent power consumption with volt-amps. See below.
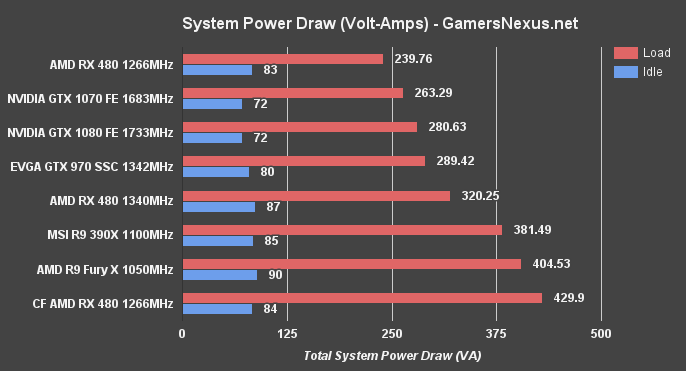
The CF RX 480s draw ~430VA under load, which is an increase of 190VA over the single card. Note that these tests were conducted with AMD's 16.7.1 driver (compatibility mode disabled). The power consumption of two RX 480s in CrossFire greatly exceeds the power consumption of a single GTX 1070 or GTX 1080, which is obviously expected with a multi-GPU setup. What matters is if that additional draw is accounted for in performance.
Continue to the next page for Dx12/Vulkan benchmarks compared versus Dx11. The CrossFire results are interesting.
Comparative Dx12 vs. Dx11 FPS in Ashes of Singularity – CrossFire RX 480 vs. GTX 1080, 1070
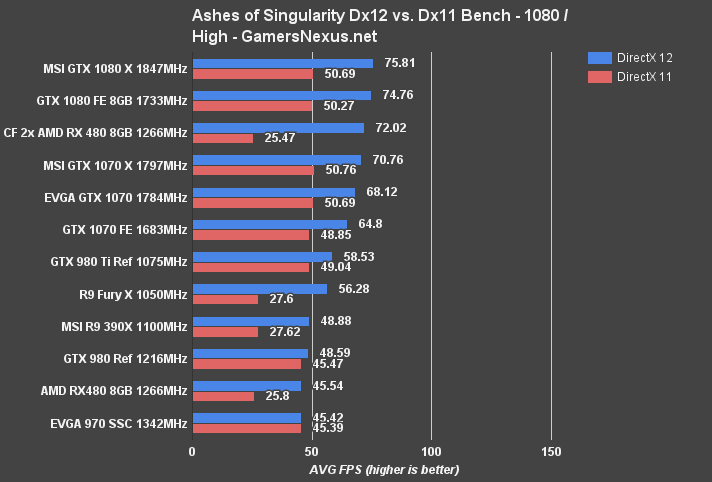
Ashes of Singularity is where AMD's RX 480s should be expected to perform well, considering the company's bombastic comparison versus the GTX 1080 at Computex. Ashes is capable of leveraging MDA through Dx12, and is optimized for multi-GPU benchmarking. That makes the game somewhat of a “best case” scenario for most multi-GPU tests in Dx12.
Looking purely at framerates, we're seeing the same poor Dx11 performance as we've observed on all of AMD's tested cards, including the Fury X, R9 390X, and RX 480, but that subsides as we switch over to Dx12. This inflates AMD's scaling numbers, given the poor Dx11 performance, but does help the CrossFire RX 480s outmatch a single GTX 1070 in AVG FPS at 1080/high (Dx12). The two RX 480 cards nearly achieve parity with the GTX 1080 single cards. Against a single RX 480, the CrossFire configuration runs a 45% difference.
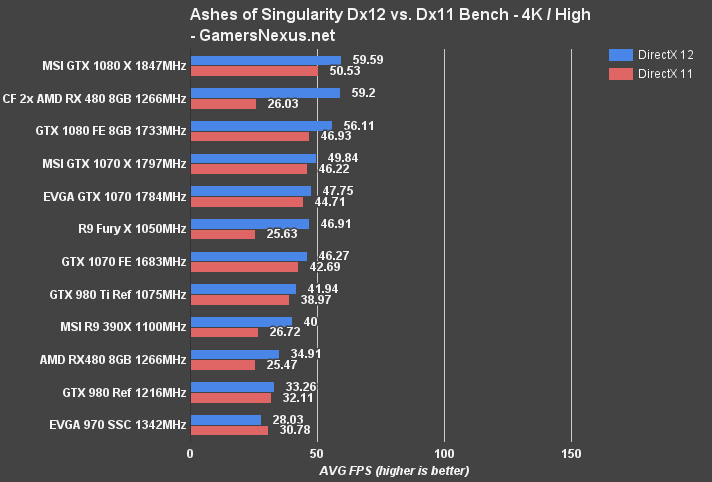
4K/High posts the CF RX 480s at 59.2FPS AVG for Dx12, or between the two GTX 1080 cards. We land above the GTX 1070 Gaming X, and CrossFire maintains a 51.6% difference when compared against a single RX 480 ($240).
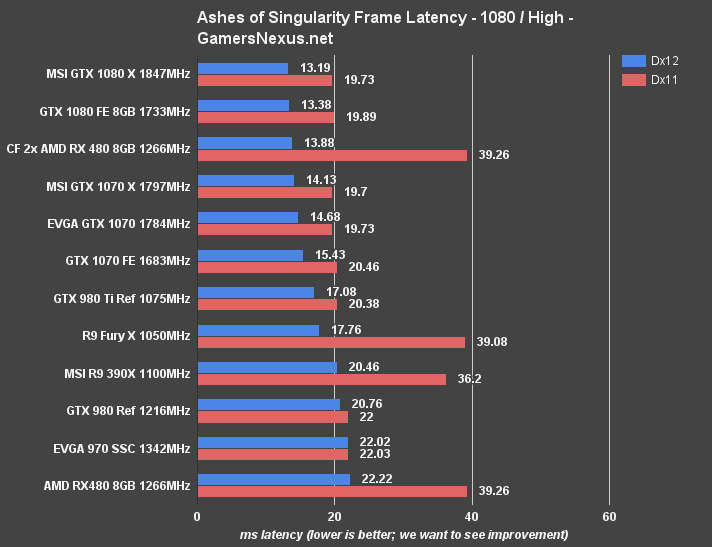
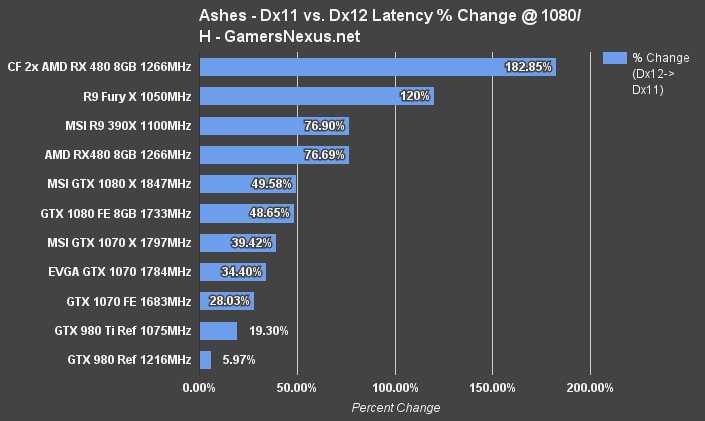
Frametimes are also important to look at. The average frame latency at 1080p/High has the RX 480s in Crossfire performing between the GTX 1080 and GTX 1070, and well above the single RX 480 when looking at Dx12 strictly. Dx11 doesn't look so good for the CrossFire setup, again stretching AMD's scaling metrics given poor Dx11 performance.
There is not a single metric for which the RX 480s beat the GTX 1080 in Ashes, though they do nearly achieve parity in some aspects of testing.
Comparative Vulkan vs. Dx11 in Talos Principle – CF RX 480 vs. 480, 1080, SLI 1070
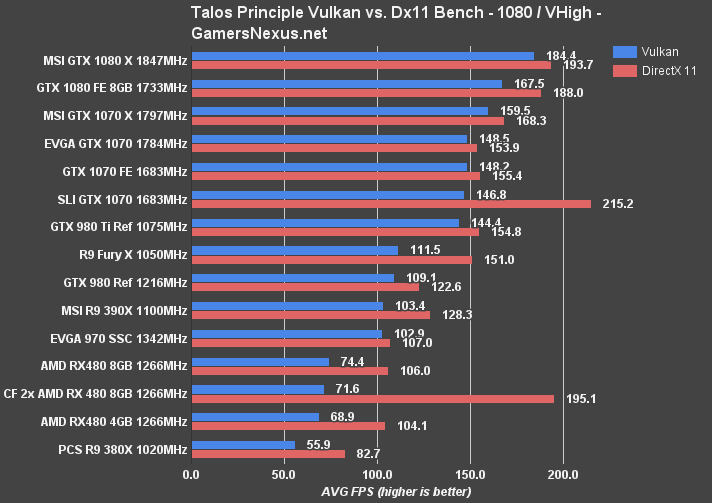
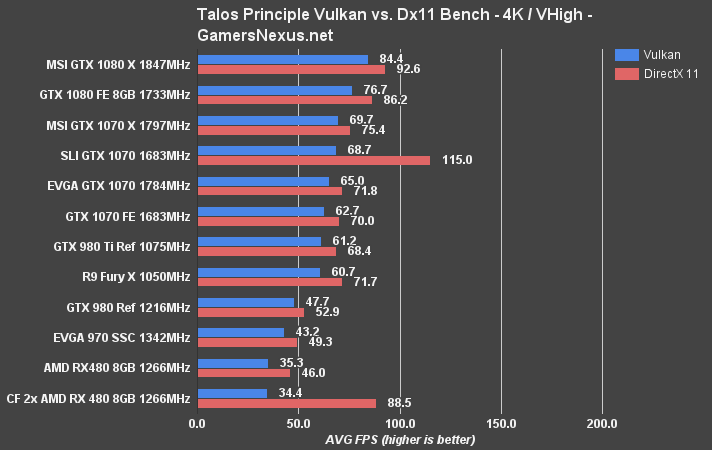
The Talos Principle offers both Dx11 and Vulkan API benchmarks. With DirectX 11, we're seeing clear scaling between the RX 480s in CrossFire versus the single card option. 1080p/Ultra posts a difference of 60.8%. For comparison, the much more expensive dual-1070 setup posted a performance difference (compared vs. single GTX 1070) of 24.5% – not that exciting.
The story changes as we look to Vulkan, though. CrossFire RX 480s actually post lower Vulkan performance than the single card. The output is 71.6FPS versus 74.4FPS, making the single card 3.8% faster at 1080p.
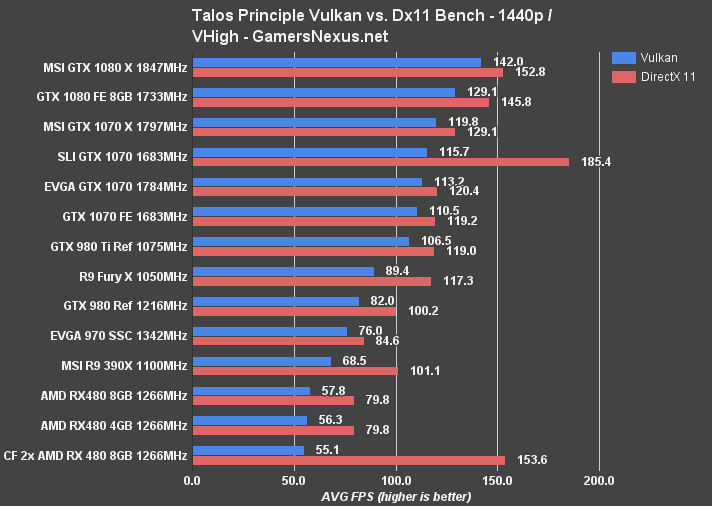
Moving to 1440p, we see similar results. The single RX 480 is actually about 2FPS faster than the dual RX 480s in Vulkan. Using Dx 11 instead, we see 153.6FPS on the CrossFire setup, as opposed to 79.8FPS for a single card.
Continue to the next page for Dx11 benchmarks, including Mirror's Edge, The Division, GTA V, and more.
GTA V Benchmark on CF RX 480 vs. GTX 1070, 1080, etc.
GTA V's severe frame stuttering issues were resolved with 16.7.1, which we began using for our 4GB vs. 8GB benchmarking. This test primarily used 16.6.2 (all testing was complete before the 16.7.1 release – though performance is similar), with the one exception of GTA V. Our below results use the 16.7.1 update, which largely resolved stutter and 0.1% low frametime issues with AMD's RX 480.
GTA V produces reliable benchmarks that are easily replicated. As we've done since we adopted the game for our GPU reviews, we're using the final scene (the jet) for the GTA V tests. If you're curious about GTA V's graphics options, head over to our optimization guide.
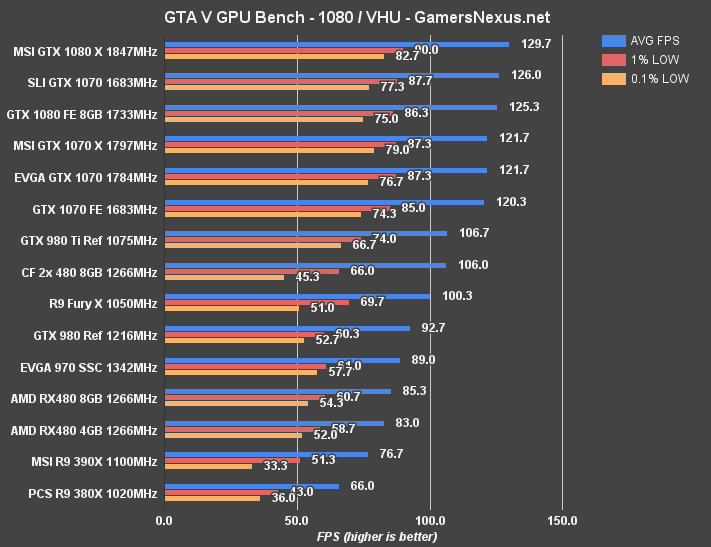
At 1080p with Very High and Ultra settings, we see the RX 480s in CrossFire performing at 106FPS average, with slightly lower 0.1% lows than the single RX 480 configuration. There's still positive scaling on the averages, demonstrated by the single 8GB card's residence at the 85.3FPS. That's a scaling difference of 21.6% – not impressive, but present. 0.1% low values are negatively scaled, with the single card performing 18% different.
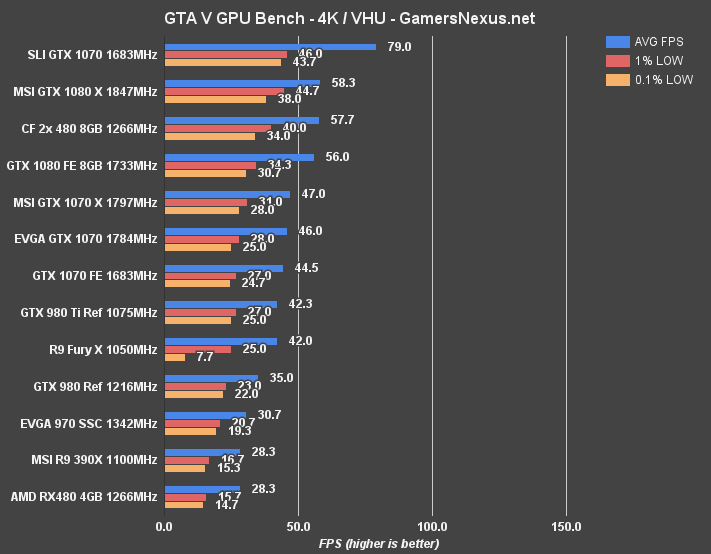
At 4K with GTA V, we're seeing the CrossFire RX 480s pull ahead in the charts and achieve parity with the stack of GTX 1080 GPUs. The CrossFire RX 480s are outpaced only by the AIB partner GTX 1080 from MSI and the SLI GTX 1070s.
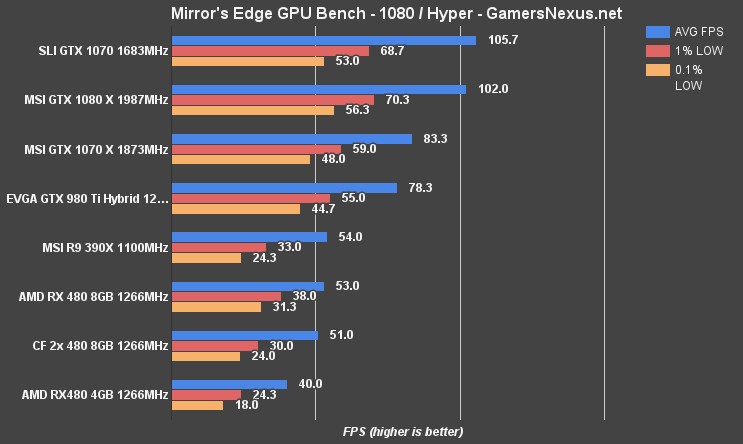
Mirror's Edge Catalyst Benchmark on CrossFire RX 480 vs. 1080, 1070, 970, etc.
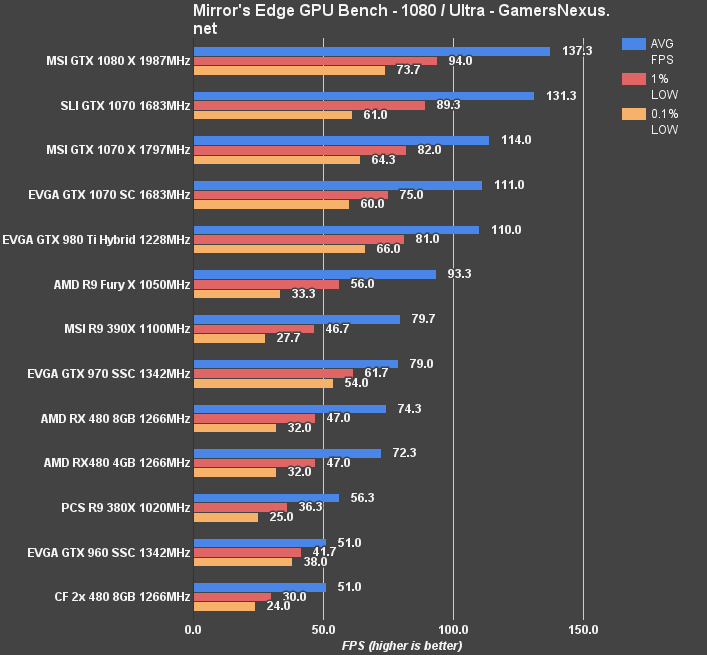
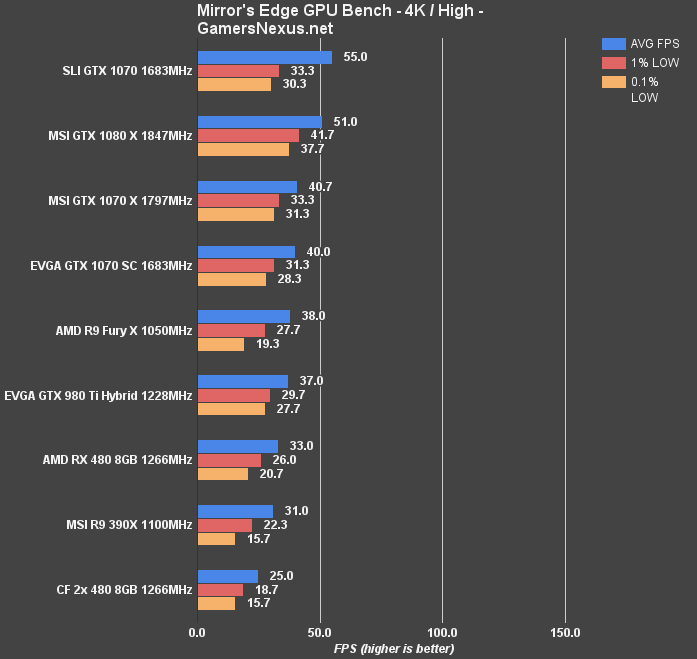
Mirror's Edge Catalyst uses a lot of post-processing, and that's not great for scalability on multi-GPU configurations. We're actually seeing negative scaling in Mirror's Edge Catalyst, with a single RX 480 at 1080p Ultra performing faster than the CrossFire cards.
At 4K High, we're seeing 25FPS AVG for dual RX 480s versus 33FPS AVG for a single card. Granted, the game's not playable on either – but scaling is still negative.
1080p/Hyper is also hindering 0.1% lows for the CF 480s, landing them at 24FPS (0.1%) and 30FPS (1% low) versus the single RX 480's 31.3FPS and 38FPS, respectively.
Metro: Last Light Benchmark – CF RX 480 vs. RX 480 Single, GTX 1070
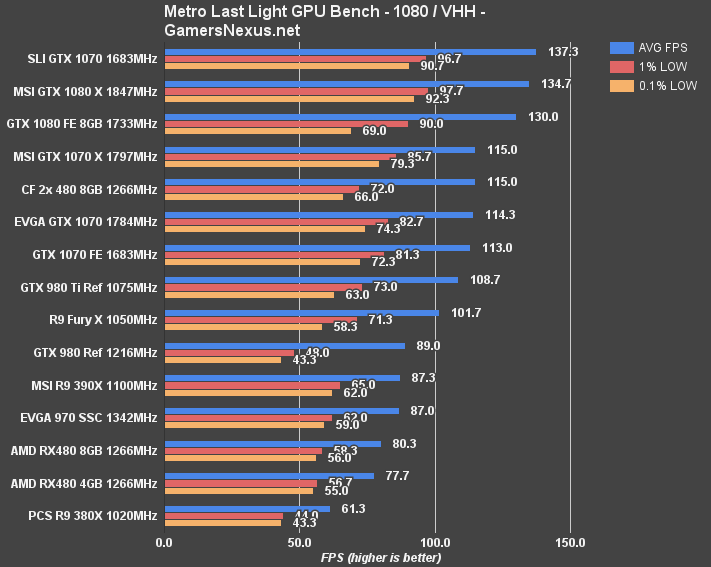
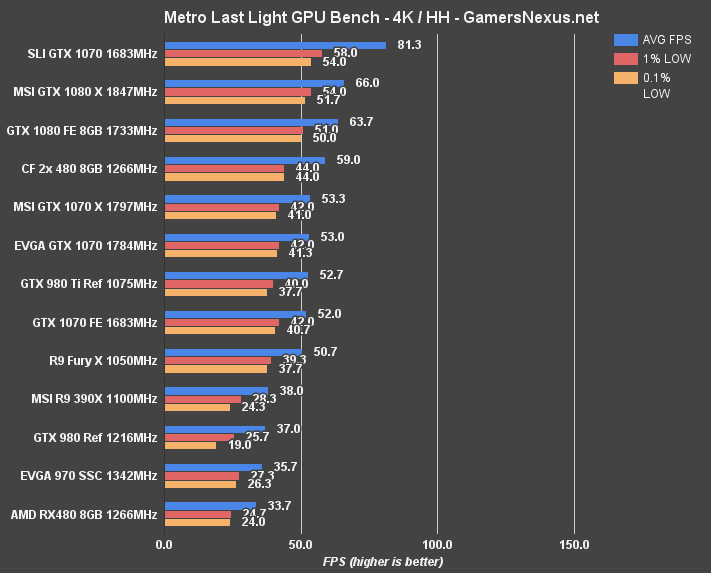
Metro: Last Light often creates best case scenarios for GPU benchmarks, especially because GPU manufacturers know of its popularity as a benchmark, and so drivers see more tuning than other games might receive. For CrossFire RX 480s, we're outputting 115FPS AVG at 1080/VHH (Very High quality, High tessellation), a reasonable growth over the 80.3FPS output with a single RX 480. The CrossFire cards appear matched with the GTX 1070 Gaming X when looking strictly at averages, but the 1070 Gaming X (and FE, for that matter) does outperform the two RX 480s in the lows.
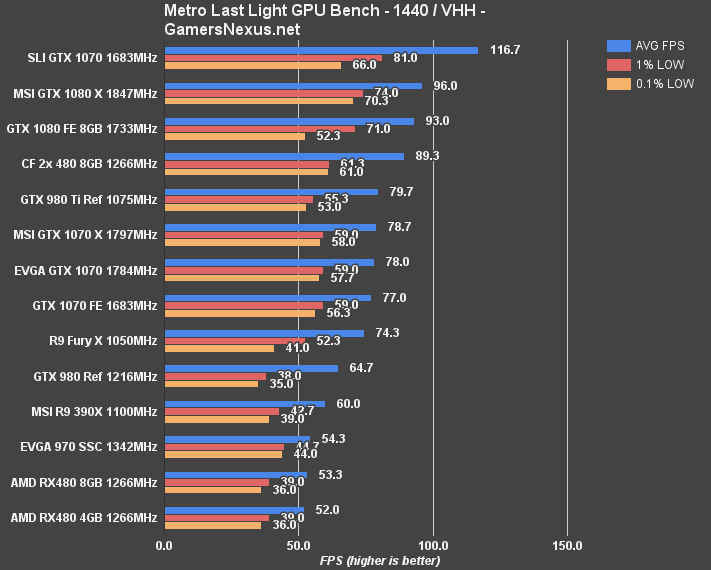
Moving to 1440p sees the RX 480s in CrossFire pull ahead of the 1070 Gaming X, but they're still sitting behind a single GTX 1080 – which is what AMD claimed to beat out with its fanfare.
4K/HH has the CF 480s holding at nearly 60FPS, making the 4K resolution officially playable using Polaris 10. A single RX 480 did not enable this and output 33.7FPS average, meaning we're seeing nearly 2x scaling with CrossFire. The 2x 480s maintain a lead over the 1070 Gaming X – which only led at 1080p – and are on the heels of a single GTX 1080, but still produce worse low values.
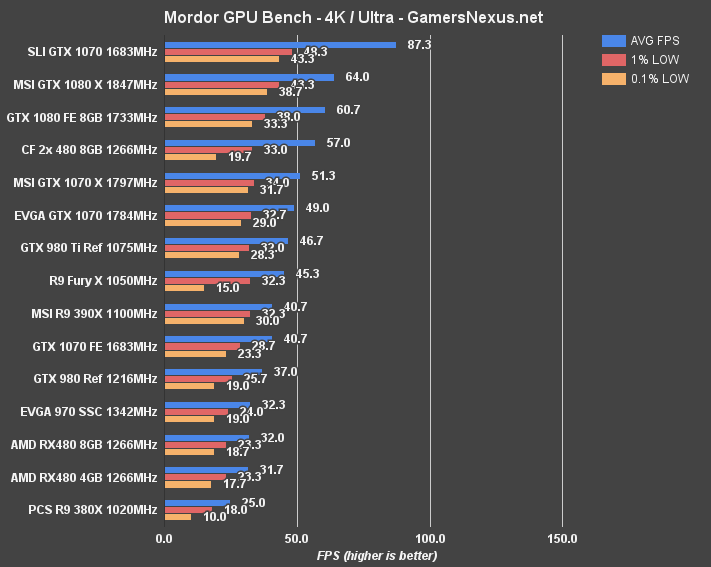
Shadow of Mordor Benchmark – CF RX 480 vs. RX 480 Single, GTX 1080, 1070
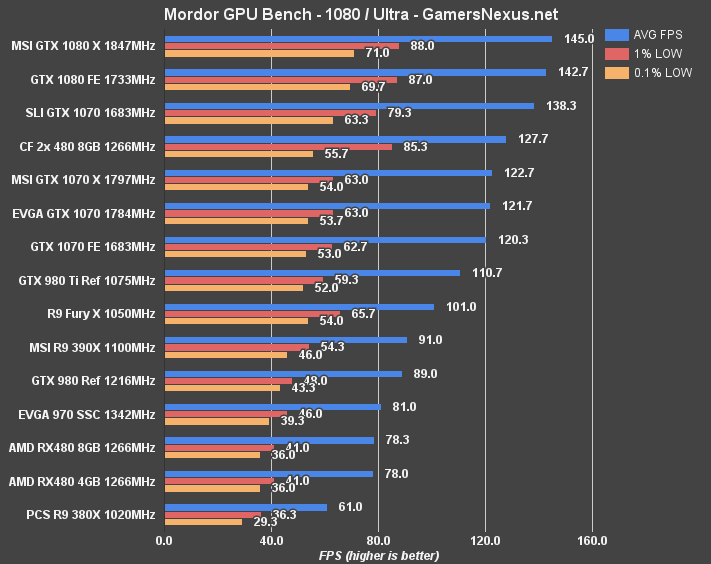
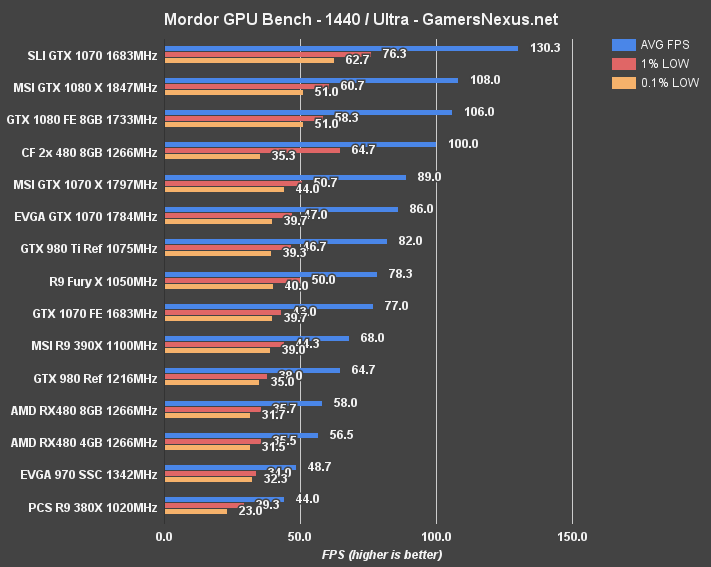
At 1440p, the poor 0.1% performance introduces some noticeable stutters or frame drops, but we've improved our averages over a single RX 480 and are seeing reasonable scaling (72% increase). Performance improvement is about 12.4% over the GTX 1070 Gaming X, or 11FPS average. That said, the GTX 1070 Gaming X sustains better 0.1% low performance.
4K pushes the cards closer together, with minimal AVG FPS gaps differentiating the GTX 1080 and RX 480s. The GTX 1070 runs at 51.3FPS, but keeps significantly better 0.1% low frametimes than the RX 480s in CF.
Call of Duty: Black Ops III Benchmark – CF RX 480 vs. GTX 1070, 1080
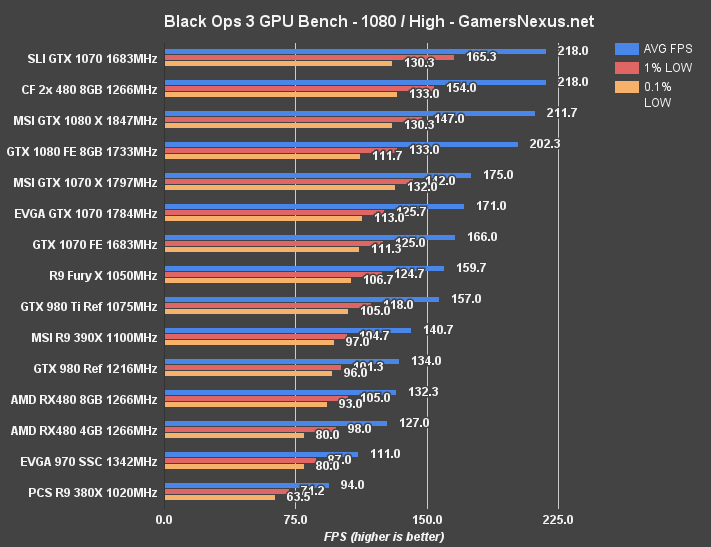
We're clearly hitting a throttle point at 1080p in Black Ops, with our top few cards hitting a wall around 218FPS. Black Ops III remains one of the better optimized games on the bench, and also has a history of posting better AMD performance than in some other titles. The CrossFire cards tie with the SLI GTX 1070s at 1080p, creating scaling of 39% over the single RX 480 8GB at 132.3FPS average.
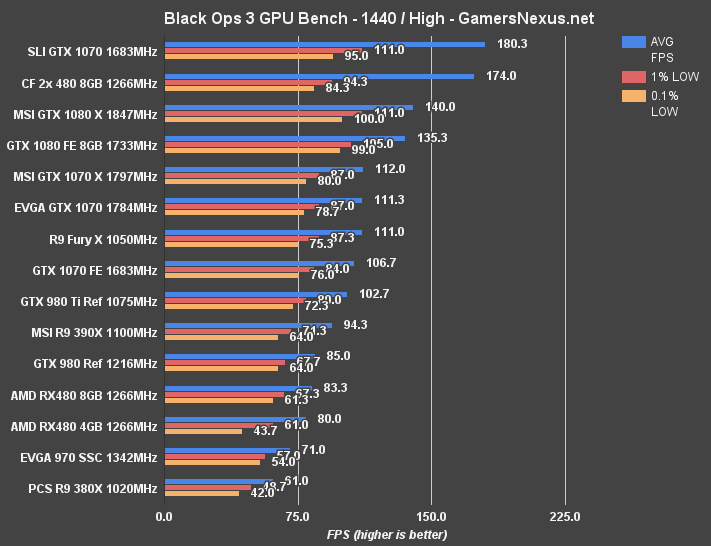
At 1440p, the SLI GTX 1070s lead the CrossFire RX 480s by 3.5%. CrossFire 1% and 0.1% low performance is acceptable, though clearly lower than the GTX 1070 and GTX 1080 cards, despite maintaining a strong average. The CrossFire configuration shows a change of 70.5% compared to the single RX 480 8GB card.
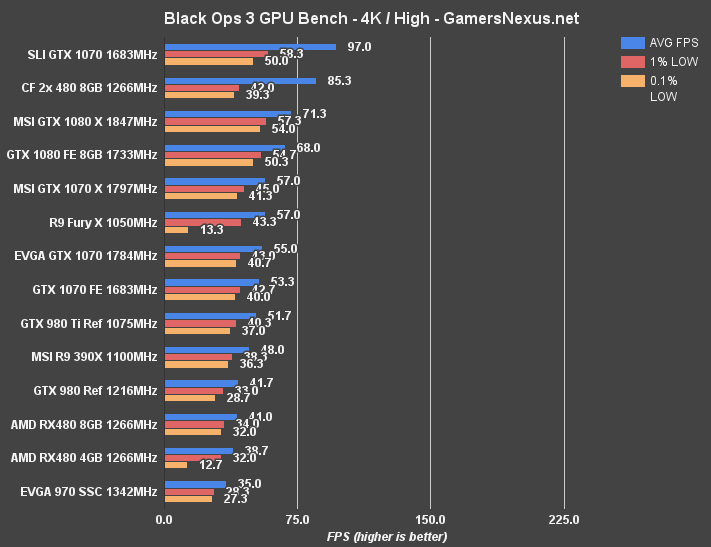
4K is actually playable on CrossFire RX 480s, though the 0.1% lows do dip low enough to occasionally produce visible stutter when playing – certainly not ideal, but the average is positioned between the GTX 1080 Gaming X and SLI GTX 1070s. AVG FPS performance is effectively doubled over the single RX 480 8GB, but 0.1% performance remains comparable.
The Division Benchmark – CF RX 480 vs. GTX 1080, 1070, 390X
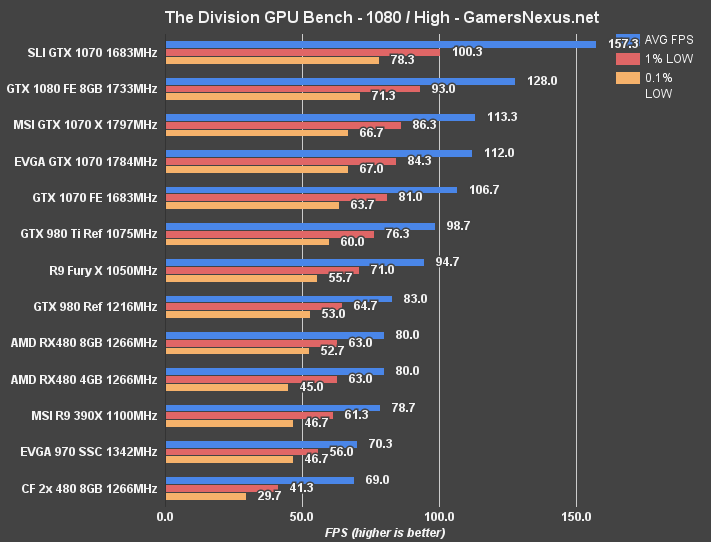
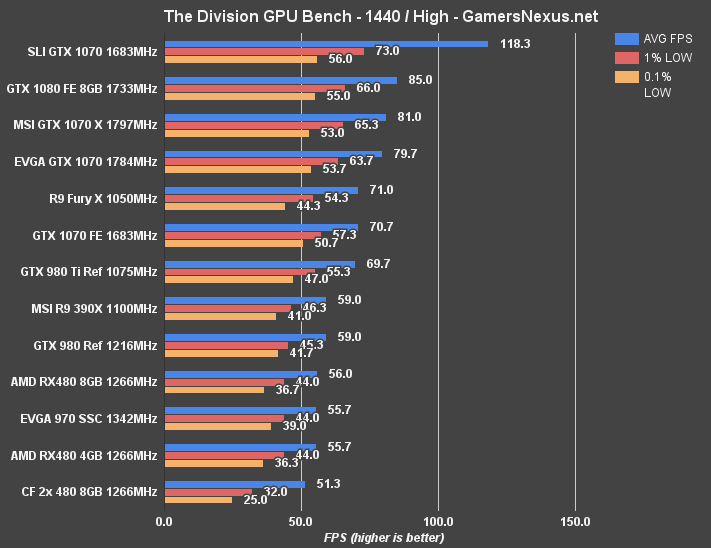
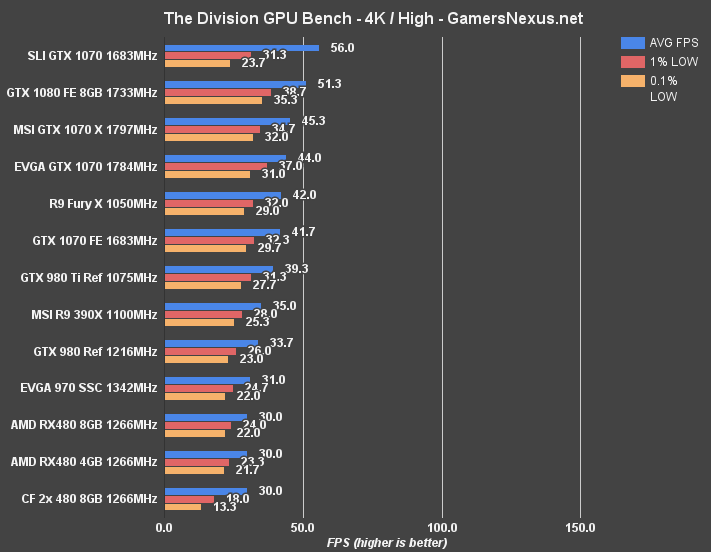
The Division is another game that shows negative CrossFire scaling. At 1080p/high, our tests are showing a performance difference of more than 10FPS average between the single card and dual cards, made worse by dismal 0.1% low values. That makes the single RX 480 faster in averages and faster in 0.1% lows.
1440p shows similar results, with the RX 480s in CrossFire dragging behind the single card setup, or 56FPS AVG versus 51.3FPS average, with a bigger gap in the lows.
Conclusion – Is CrossFire Worth It for the RX 480?
This is the same conclusion we seem to reach with almost all of our multi-GPU benchmarks. CrossFire, just like SLI in our recent hacked-together 1070 SLI benchmark, is entirely hit or miss. Some games post nearly 2x scalability and manage to maintain reasonable 1% low and 0.1% low frame metrics – Black Ops III is a good example – but about half of our test suite shows negative or near-0 scaling.
The negative scaling is the worst. You'd want to disable CrossFire in such cases, as having the second card actually diminishes the framerate performance. Mirror's Edge Catalyst, what with its heavy reliance on post processing effects, sees significant negative scaling with CrossFire (upwards of 31.4% performance degradation, in some cases). We also see negative scaling in The Division – upwards of 34% in the 0.1% lows, moving the game from reasonably playable to unplayably spikey.
Then, of course, some games perform OK. Ashes sees the CrossFire RX 480s nearly achieving parity with the GTX 1080 when in Dx12 (though they post dismal performance with Dx11). The cards don't “beat” the GTX 1080 in any single metric, but for the price, coming close is still respectable. We see OK scaling in Metro: Last Light, but nothing exciting. Shadow of Mordor posts decent scaling (78.3FPS AVG to 127.7FPS AVG, or 63%), but also suffers from poor 0.1% low increases over a single card.
Thermals are maintained at about the same level as the single card, resultant of AMD's “auto” setting in Radeon Software adjusting the fan speed and clock-rate dynamically. We see clock-rate swings greater than 100MHz during RX 480 CrossFire benchmarking, a bit more exaggerated than with a single card as a result of more frequent topping out on the ~80C cap. Frequency drops are regular, but do not always show consequence in all games. Games which are more frequency dependent will exhibit greater variability of 0.1% and 1% low values and show some stuttering. This is something that happens with both nVidia and AMD as the clock fluctuates with thermals, so we're not just knocking AMD here. In fact, the GTX 1080 showed some of the worst swings we've ever seen when overclocked with the stock cooler.
Noise levels increase a little bit when looking at raw dB values, but the “whine” and turbulence are more noticeable with CrossFire cards. If you had to operate with cards closer than ours were – we had a two-slot spacing – then you'd be looking at a lot more clock/fan fluctuation to account for the thermals. See Page 2 of this article for more info on all of that.
We're in the same place as we have been for multi-GPU configurations for years: Don't do it. Either get one RX 480 or get something more powerful. Unless you're playing a very specific game very heavily, and that game scales reasonably well, it's just not worth it. Granted, we're not looking at production tasks here. There may be a use case for OpenCL acceleration in production software for users who also game, but that's not really what we analyze. For gaming, CrossFire (and SLI, mind you) is still too variable in its performance to rely upon.
The power argument is also unfavorable toward multi-GPU configurations from any brand. We were seeing a ~430VA draw with the 2x CF RX 480s, as opposed to measurements in the 281VA range for the GTX 1080, 263VA range for a single GTX 1070, and 240VA range for a single RX 480.
The GTX 1070 is similar in gaming performance (trades with CF 480s) and similar in price, assuming they're ever in stock and certain retailers stop gouging opportunistically. We'd recommend that as a strong consideration, just wait until they're priced in their appropriate ~$380~$450 range. A single RX 480 is also reasonable. Vega may be something to look at for the high-end, but that's still some ways out.
Reminder: This test was conducted with 2x 8GB RX 480s. Performance results will be different – worse, in some use cases – for the 4GB cards in CF.
Editorial, Test Lead: Steve “Lelldorianx” Burke
Sr. Test Technician: Mike “Budekai?” Gaglione
Video Producer: Andrew “ColossalCake” Coleman
FPS Test Technician: Andie “Draguelian” Burke
Noise Test Technician: Patrick “Mocalcium” Stone