All the pyrotechnics in the world couldn't match the gasconade with which GPU & CPU vendors announce their new architectures. You'd halfway expect this promulgation of multipliers and gains and reductions (but only where smaller is better) to mark the end-times for humankind; surely, if some device were crafted to the standards by which it were announced, The Aliens would descend upon us.
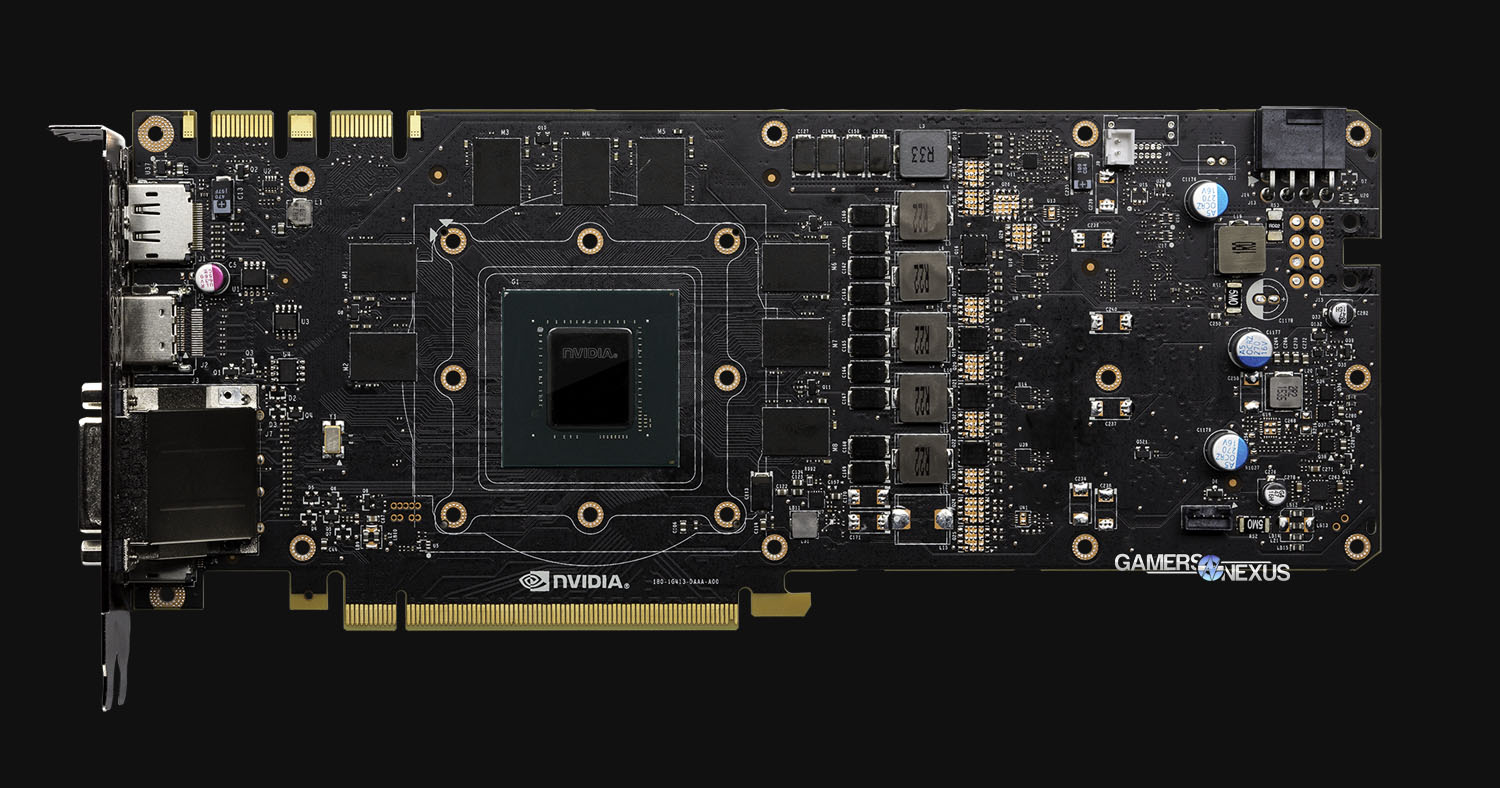
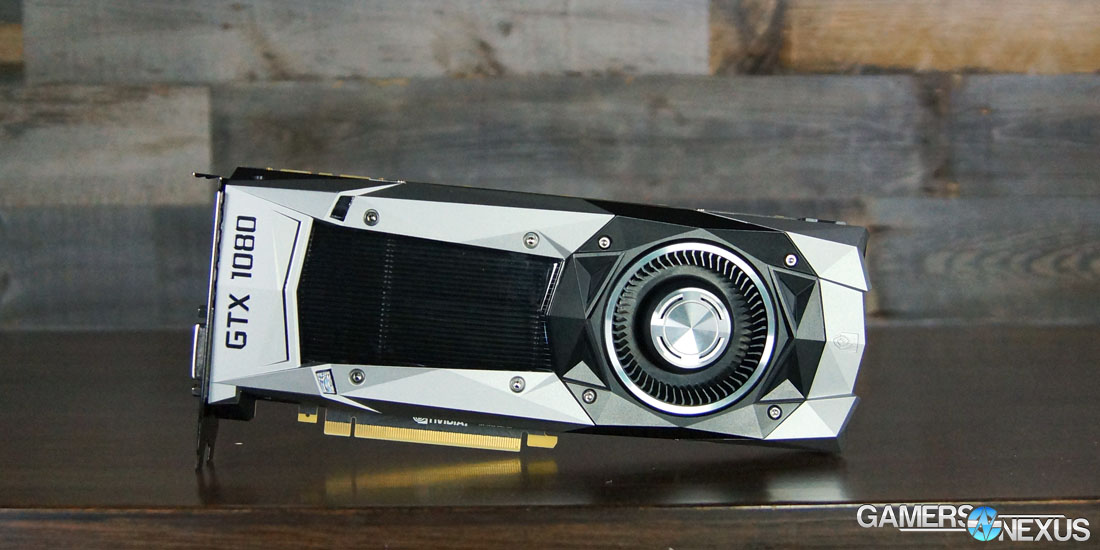
But, every now and then, those bombastic announcements have something behind them – there's substance there, and potential for an adequately exciting piece of technology. NVidia's debut of consumer-grade Pascal architecture initializes with GP104, the first of its non-Accelerator cards to host the new 16nm FinFET process node from TSMC. That GPU lands on the GTX 1080 Founders Edition video card first, later to be disseminated through AIB partners with custom cooling or PCB solutions. If the Founders Edition nomenclature confuses you, don't let it – it's a replacement for nVidia's old “Reference” card naming, as we described here.
Anticipation is high for GP104's improvements over Maxwell, particularly in the area of asynchronous compute and command queuing. As the industry pushes ever into DirectX 12 and Vulkan, compute preemption and dynamic task management become the gatekeepers to performance advancements in these new APIs. It also means that LDA & AFR start getting pushed out as frames become more interdependent with post-FX, and so suddenly there are implications for multi-card configurations that point toward increasingly less optimization support going forward.
Our nVidia GeForce GTX 1080 Founders Edition review benchmarks the card's FPS performance, thermals, noise levels, and overclocking vs. the 980 Ti, 980, Fury X, and 390X. This nearing-10,000-word review lays-out the architecture from an SM level, talks asynchronous compute changes in Pascal / GTX 1080, provides a quick “how to” primer for overclocking the GTX 1080, and talks simultaneous multi-projection. We've got thermal throttle analysis that's new, too, and we're excited to show it.
The Founders Edition version of the GTX 1080 costs $700, though MSRP for AIBs starts at $600. We expect to see that market fill-in over the next few months. Public availability begins on May 27.
First, the embedded video review and specs table:
NVIDIA GeForce GTX 1080 vs. GTX 980 Ti, GTX 980, & Fury X [Video]
NVIDIA GTX 1080 Specs, 1070 Specs, 980 & 980 Ti Specs
| NVIDIA Pascal vs. Maxwell Specs Comparison | ||||||
| Tesla P100 | GTX 1080 | GTX 1070 | GTX 980 Ti | GTX 980 | GTX 970 | |
| GPU | GP100 Cut-Down Pascal | GP104 Pascal | GP104 (?) | GM200 Maxwell | GM204 Maxwell | GM204 |
| Transistor Count | 15.3B | 7.2B | Unknown | 8B | 5.2B | 5.2B |
| Fab Process | 16nm FinFET | 16nm FinFET | 16nm FinFET | 28nm | 28nm | 28nm |
| CUDA Cores | 3584 | 2560 | Unknown | 2816 | 2048 | 1664 |
| GPCs | 6 | 4 | Unknown | 6 | 4 | 4 |
| SMs | 56 | 20 | Unknown | 22 | 16 | 13 |
| TPCs | 28 TPCs | 20 TPCs | Unknown | - | - | - |
| TMUs | 224 | 160 | Unknown | 176 | 128 | 104 |
| ROPs | 96 (?) | 64 | Unknown | 96 | 64 | 56 |
| Core Clock | 1328MHz | 1607MHz | Unknown | 1000MHz | 1126MHz | 1050MHz |
| Boost Clock | 1480MHz | 1733MHz | Unknown | 1075MHz | 1216MHz | 1178MHz |
| FP32 TFLOPs | 10.6TFLOPs | 9TFLOPs | 6.5TFLOPs | 5.63TFLOPs | 5TFLOPs | 3.9TFLOPs |
| Memory Type | HBM2 | GDDR5X | GDDR5 | GDDR5 | GDDR5 | GDDR5 |
| Memory Capacity | 16GB | 8GB | 8GB | 6GB | 4GB | 4GB |
| Memory Clock | ? | 10Gbps GDDR5X | Unknown | 7Gbps GDDR5 | 7Gbps GDDR5 | 7Gbps |
| Memory Interface | 4096-bit | 256-bit | Unknown | 384-bit | 256-bit | 256-bit |
| Memory Bandwidth | ? | 320.32GB/s | Unknown | 336GB/s | 224GB/s | 224GB/s |
| TDP | 300W | 180W | Unknown | 250W | 165W | 148W |
| Power Connectors | ? | 1x 8-pin | Unknown | 1x 8-pin 1x 6-pin | 2x 6-pin | 2x 6-pin |
| Release Date | 4Q16-1Q17 | 5/27/2016 | 6/10/2016 | 6/01/2015 | 9/18/2014 | 9/19/2014 |
| Release Price | TBD (Several thousand) | Reference: $700 MSRP: $600 | Reference: $450 MSRP: $380 | $650 | $550 | $330 |
Architecture – A Quick Primer on Pascal & GP100
GP100 is part of “Big Pascal,” and the Tesla P100 Accelerator card – not meant for gaming – used a truncated version of Big Pascal. GP100 hosts 15.3 billion transistors and is sized at 610mm^2, marking the chip as nVidia's largest ever produced. Performance is rated for a staggering 5.3TFLOPs FP64 (double-precision) COMPUTE, or 10.6TFLOPs of FP32 and 21.2TFLOPs of FP16 (viable for deep learning). The use cases for GP100 and the Tesla P100 Accelerator are entirely relegated to scientific computations, deep learning, data mining and analysis, and simulation demanding of double-precision accuracy.
The GP100 architecture looks like this:
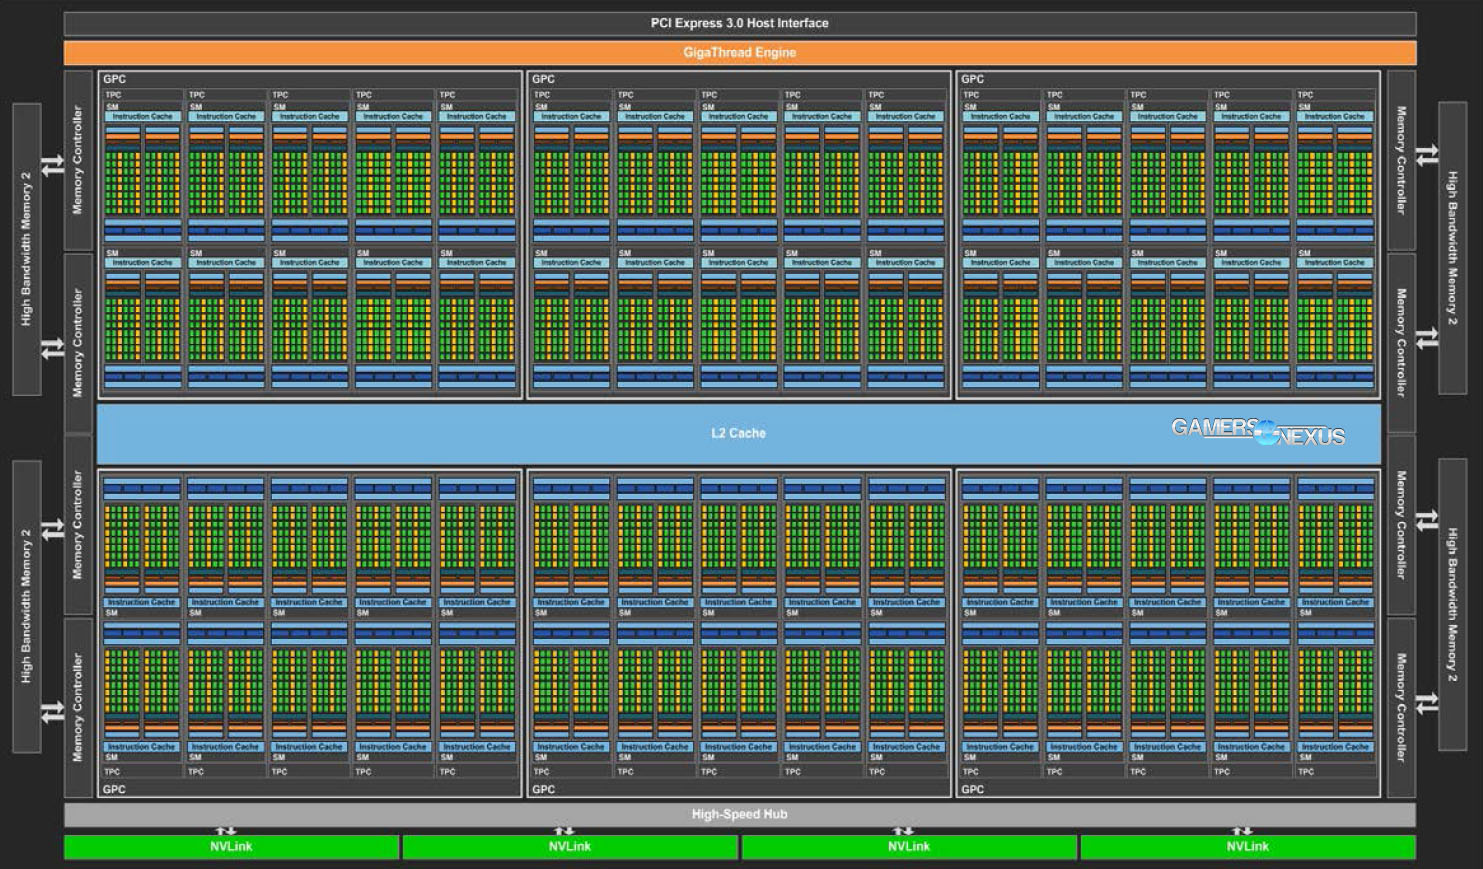
Before explaining GP104 for the GTX 1080, we'll recap some of our multi-page architecture deep-dive for GP100.
This GP100 GPU hosts 3584 FP32 CUDA cores (2:1 FP32:FP64) divided into six Graphics Processing Clusters (GPCs), each of which contains a set of ten Simultaneous Multiprocessors (SMs). Each set of two SMs shares a single Texture Processing Cluster (TPC).
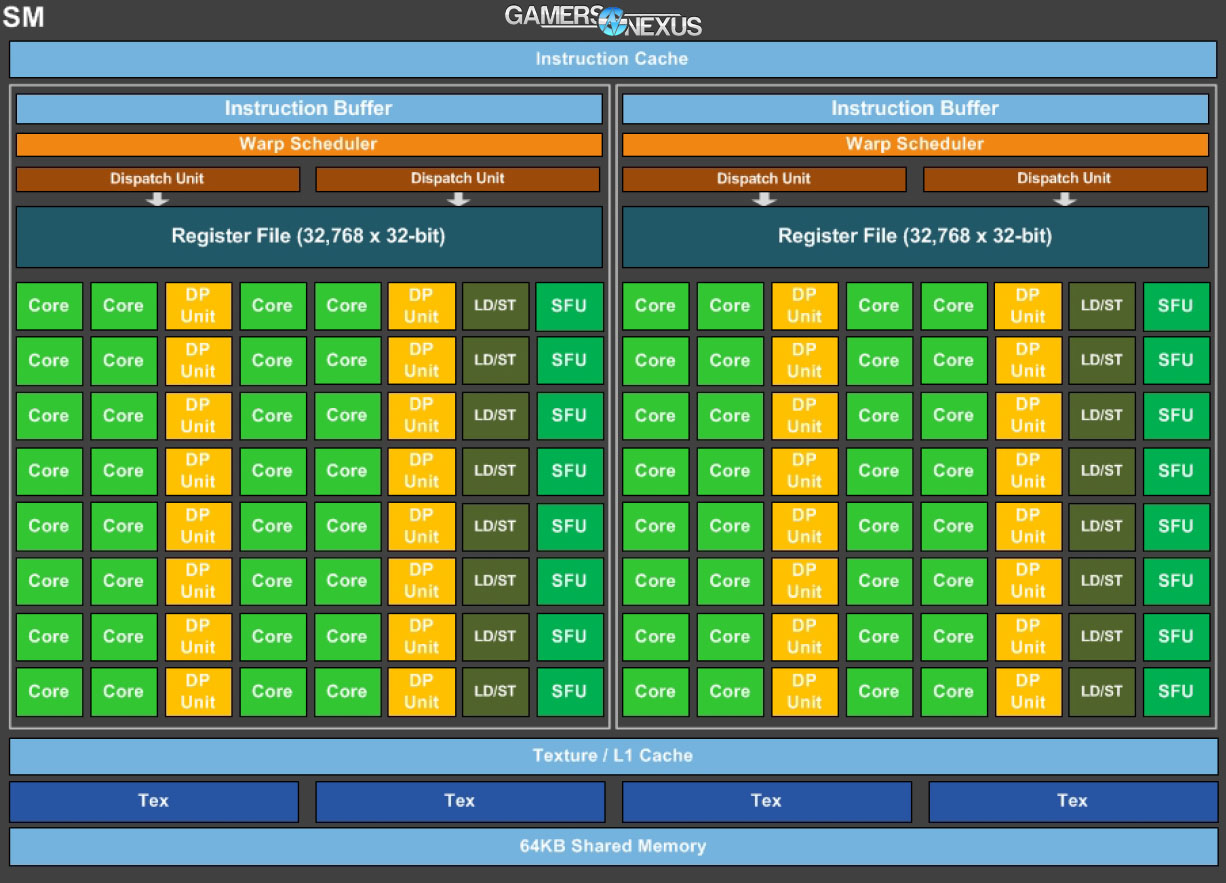
Drilling into SM architecture on GP100 reveals that each SM is partitioned into two blocks of 32 FP32 CUDA cores, which are independently allocated a dedicated warp scheduler and instruction buffer, two dedicated dispatch units, and a register file (32,768 x 32-bit size). The partitioned blocks total 64 FP32 CUDA cores on GP100, and share a single instruction cache. Interestingly, GP100's SM blocks also share a unified Texture / L1 Cache, filling a somewhat flexible role on the SM. GP100 hosts four TMUs per SM; multiply that by the P100's 56 SMs (of a total 60 for Big Pascal, if a full version should ever be released), that's 4*56=224 TMUs (full potential of 240 TMUs for the uncut GP100). This architecture largely carries over to GP104 and remains relevant, as you'll see momentarily.
Finally, each SM on GP100 hosts an independent 64KB Shared Memory block, indicated in the SM architecture diagram toward the bottom.
Pascal's debut architecture actually contains fewer FP32 CUDA cores per SM than the Maxwell GM200 architecture (128 FP32 CUDA cores per SM; Kepler ran 192 FP32 CUDA cores per SM), but still manages to increase overall CUDA core count across the die. The reduced CUDA core count per SM, with each SM being partitioned into two blocks of 32 cores, streamlines the datapath organization by granting an independent instruction buffer, warp scheduler, and dispatch units to each “partition” in the SM, with four total dispatch units per SM. This datapath optimization falls in-step with GP100's move to 16nm FinFET – also true for GP104 – and helps reduce inefficiency on a per-core level. Overall power consumption is reduced as a result, along with the somewhat “native” reduction offered by a smaller process with FinFET transistor architecture.
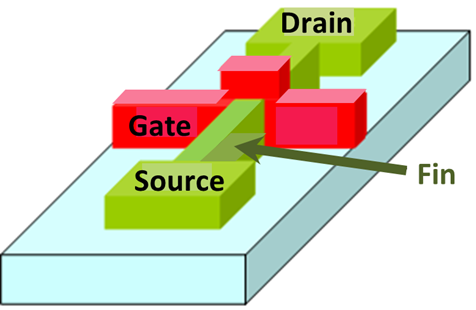
(Source: Wikimedia Commons)
FinFET transistors use a three-dimensional design that extrudes a fin to form the drain and source; the transistor's fins are encircled by the gate, reducing power leakage and improving overall energy efficiency per transistor. When scaled up to billions of transistors and coupled with optimized datapath organization (which now takes less physical die space), nVidia is able to create the 300W GP100 and ~180W TDP GP104 GTX 1080 GPU.
| GPU | Kepler GK110 | Maxwell GM200 | Pascal GP100 |
| Compute Capability | 3.5 | 5.2 | 6.0 |
| Threads / Warp | 32 | 32 | 32 |
| Max Warps / Multiprocessor | 64 | 64 | 64 |
| Max Threads / Multiprocessor | 2048 | 2048 | 2048 |
| Max Thread Blocks / Multiprocessor | 16 | 32 | 32 |
| Max 32-bit Registers / SM | 65536 | 65536 | 65536 |
| Max Registers / Block | 65536 | 32768 | 65536 |
| Max Registers / Thread | 255 | 255 | 255 |
| Max Thread Block Size | 1024 | 1024 | 1024 |
| Shared Memory Size / SM | 16KB / 32KB / 48KB | 96KB | 64KB |
Here's an excerpt from our GP100 architecture deep-dive:
“So, even though Pascal has half the cores-per-SM as Maxwell, it's got the same register size and comparable warp and thread count elements; the elements comprising the GPU are more independent in this regard, and better able to divvy workloads efficiently. GP100 is therefore capable of sustaining more active ('in-flight') threads, warps, and blocks, partially resultant of its increased register access presented to the threads.
The new architecture yields an overall greater core count (by nature of hosting more SMs) and also manages to increase its processing efficiency by changing the datapath configuration. The move to FinFET also greatly increases per-core performance-per-watt, a change consistent with previous fabrication changes.
Because the cores-per-SM have been halved and total SM count has increased (to 10, in this instance), the per-SM memory registers and warps improve efficiency of code execution. This gain in execution efficiency is also supported by increased aggregate shared memory bandwidth (an effective doubling) because the per-SM shared memory access increases.
Pascal's datapath structure requires less power for data transfer management. Pascal schedules tasks with greater efficiency (and less die space consumed by datapath organization) than Maxwell by dispatching two warp instructions per clock, with one warp scheduled per block (or 'partition,' as above).”
That primed, let's move to GP104 and explore its changes from GP100.
Architecture – GP104 Simultaneous Multiprocessors, GPCs, TPCs
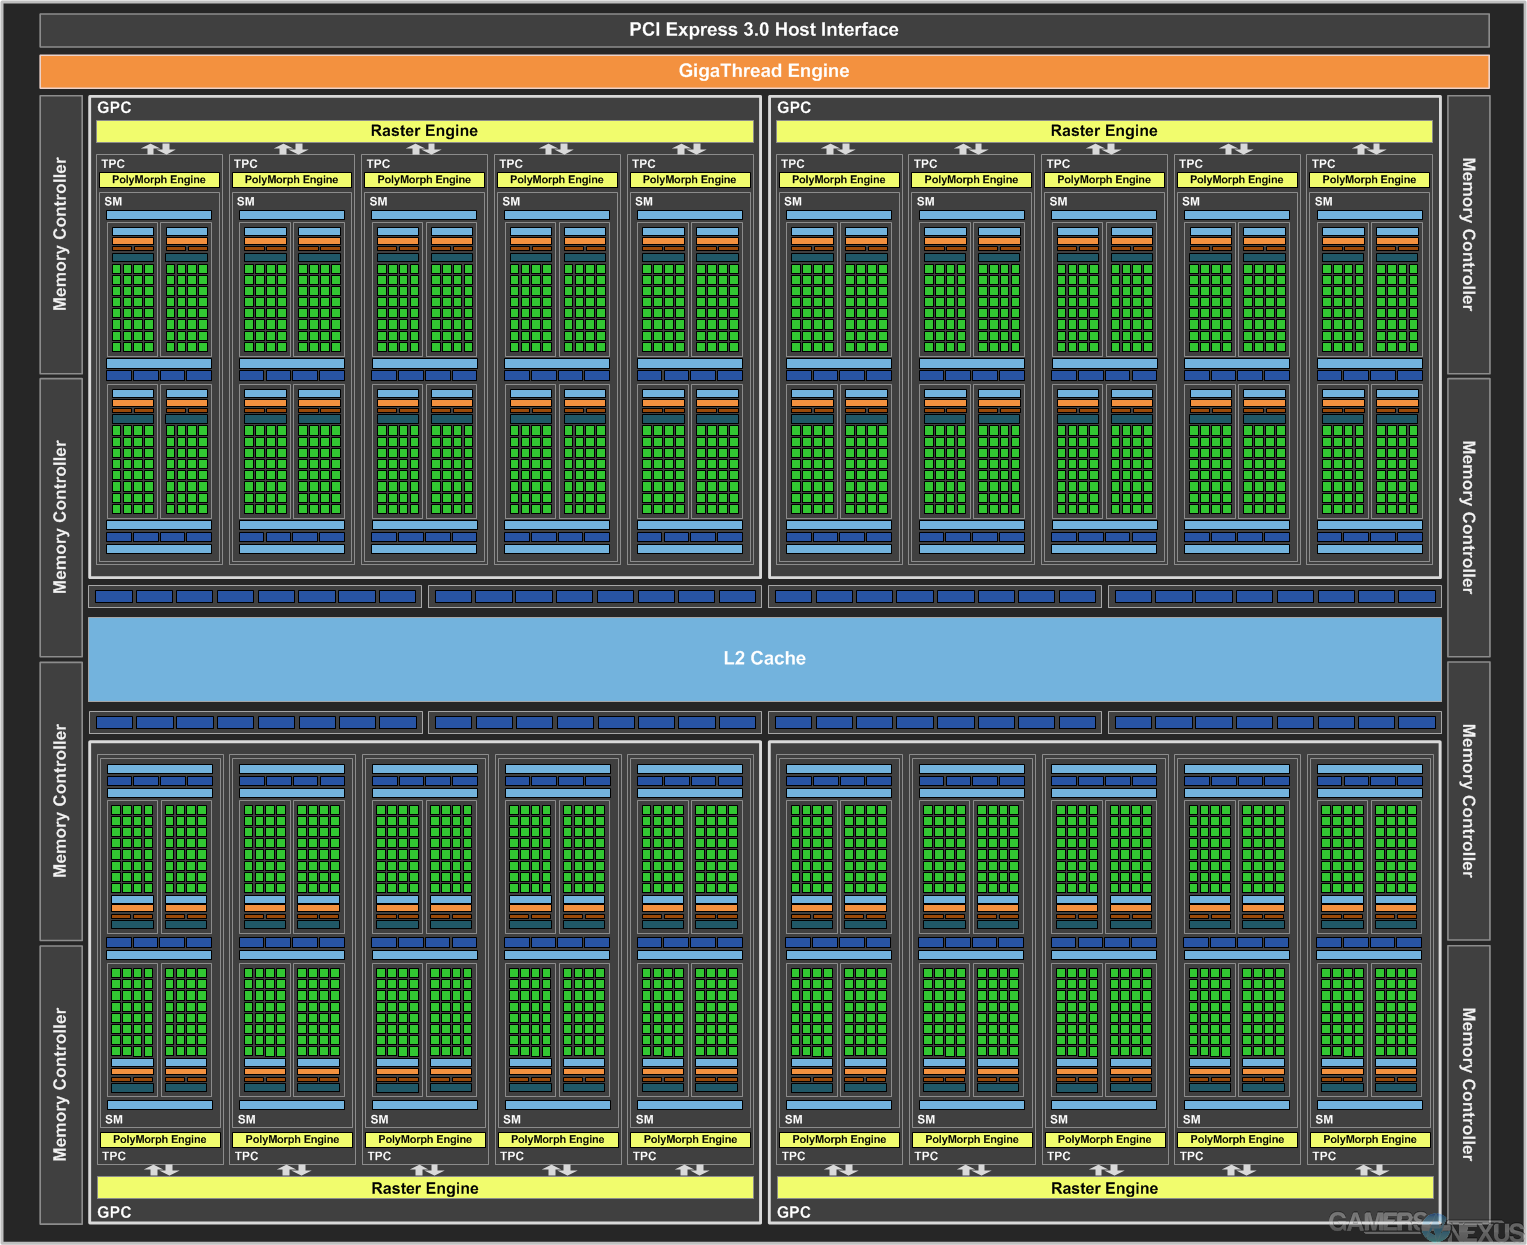
GP104 is a gaming-grade GPU with no real focus on some of the more scientific applications of GP100. GP104 (and its host GTX 1080) is outfitted with 7.2B transistors, a marked growth over the GTX 980's 5.2B transistors (though fewer than the GTX 980 Ti's 8B – but transistor count doesn't mean much as a standalone metric; architecture matters).
GP104 hosts 20SMs. SM architecture is familiar in some ways to GM204: An instruction cache is shared between two effective “partitions,” with each of those owning dedicated instruction buffers (one each), warp schedulers (one each), and dispatch units (two each). The register file is sized at 16,384 x 32-bit, one per “partition” of the SM. The new PolyMorph Engine 4.0 sits on top of this, but we'll talk about that more within the simultaneous multi-projection section.
Each GP104 SM hosts 128 CUDA cores – a stark contrast from the layout of the GP100, which accommodates for FP64 and FP16 where GP104 does not (because neither is particularly useful for gamers). In total, the 20 SMs and 128 core-per-SM count spits out a total of 2560 CUDA cores. GP104 contains 20 geometry units, 64 ROPs (depicted as horizontally flanking the L2 Cache), and 160 TMUs (20 SMs * 8 TMUs = 160 TMUs).
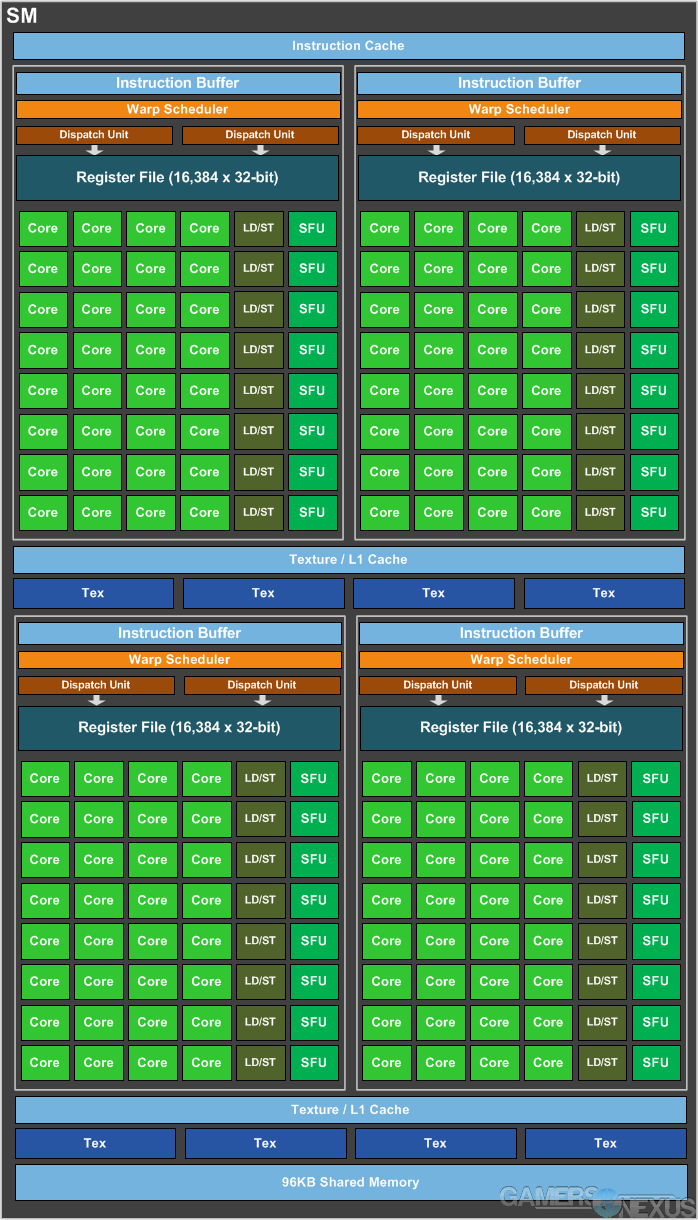
Further, SMs each possess 256KB of register file capacity, 1x 96KB shared memory unit, 48KB of L1 Cache, and the 8 TMUs we already discussed. There are four total dedicated raster engines on Pascal GP104 (one per GPC). There are 8 Special Function Units (SFUs) per SM partition – 16 total per SM – and 8 Load/Store (LD/ST) units per SM partition. SFUs are utilized for low-level execution of mathematical instruction, e.g. trigonometric sin/cos math. LD/ST units transact data between cache and DRAM.
The new PolyMorph Engine 4.0 (PME - originating on Fermi) has been updated to support a new Simultaneous Multi-Projection (SMP) function, which we'll explain in greater depth below. On an architecture level, each TPC contains one SM and one PolyMorph Engine (10 total PolyMorph engines); drilling down further, each PME contains a unit specifically dedicated to SMP tasks.
GP104 has a native operating frequency of 1.61GHz (~1607MHz), deploying the new GPU Boost 3.0 to reach 1.73GHz frequencies (1733MHz) on the Founders Edition card. AIB partner cards will, as usual, offer a full range of pre-overclocks or user-accessible overclocks. NVidia successfully demonstrated a 2114MHz clock-rate (that's an overclock of ~381MHz over Boost) on its demo rig, though we've validated overclocking with our own testing on a later page. NVidia noted that overclocks should routinely be capable of exceeding 2GHz (2000MHz).
Architecture – GP104 Pascal Asynchronous Compute & Preemption
Asynchronous Compute paves the way for leveraging low-level APIs. Asynchronous command queuing allows GPU resources to be allocated between non-dependent tasks, and can be thought of similarly to modern asynchronous loading for website resources: If the client calls for Javascript that isn't necessary for the page to load, that .js file will process in the background while other tasks complete asynchronously (as opposed to synchronously – where everything would bottleneck at the .js file and wait for it to complete loading).
NVidia's vision for asynchronous compute in Pascal is dead-set on advancing physics, post-processing, and VR applications. In gaming workloads, asynchronous command queuing allows overlapping tasks for improved game performance (particularly with Dx12 and Vulkan). In VR, timewarps and spatial audio processing are aided by asynchronous processing.
There are three major changes to asynchronous compute in Pascal, affecting these items: Overlapping workloads, real-time workloads, and compute preemption.
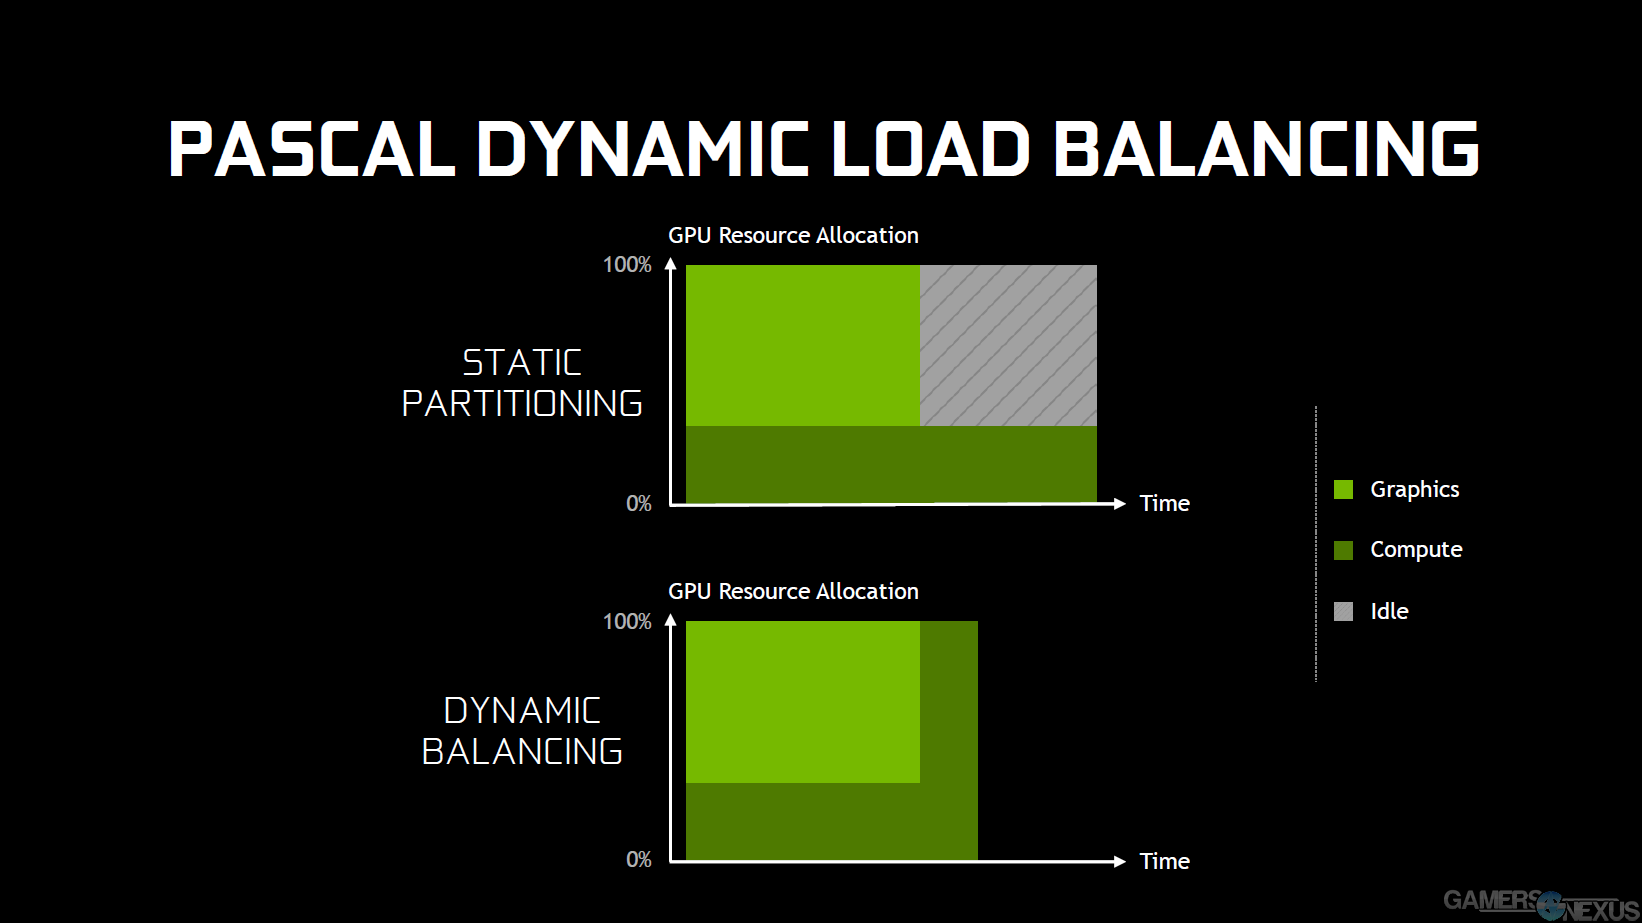
For gaming, GPU resources are often split into graphics and compute segments – e.g. a selection of the cores, cache, and other elements are assigned to graphics, while the remainder is assigned to compute. With the resources partitioned to, for example, rendering and post-FX, it may be the case that one of those “partitioned” clusters of resources completes its workload prior to its partner. That compute allocation might still be crunching a particularly complex problem when the render allocation completes its job, leaving the units allocated to rendering idle – that's wasted resources.
Asynchronous command structures allow for resource adjustments on-the-fly, enabling more concurrent, in-flight jobs to reach completion. As enabled by modern, low-level APIs that are “closer to the metal,” as they say, asynchronous compute reduces dead idles and keeps all resources tasked even when waiting for other tasks to complete. Not everything can be calculated asynchronously – there are always dependencies to some level – but gaming tasks do benefit heavily from asynchronous compute. If a selection of cores has completed its graphics tasks, but physics processing is ongoing in a neighboring selection, the render resources can be reallocated until that process concludes.
This is called “Dynamic Load Balancing,” and allows workloads to scale as resources become available or busy. Maybe 50% of resources are allocated to compute, the other 50% to rendering; if one job completes, the other job can consume idle resources to speed-up completion and reduce latency between frames. The counter is “Static Load Balancing,” where fixed resources are assigned to tasks and left idle when jobs are completed out-of-step.
Compute Preemption is a major feature of GP100 “Big Pascal.” For gaming applications, GP104's Compute Preemption has a major impact on fluidity of VR playback and promises prioritization of timewarp operations appropriately; this reduces the chance of frame drops and sudden motion sickness or “vertigo” of the wearer. It's not all VR benefit, though. Pascal works at the pixel level to preempt and prioritize tasks deemed more critical to avoiding a potential frame delay or increased latency event (see: frametimes).
NVidia has provided some images that make this easier to explain in a visual fashion:
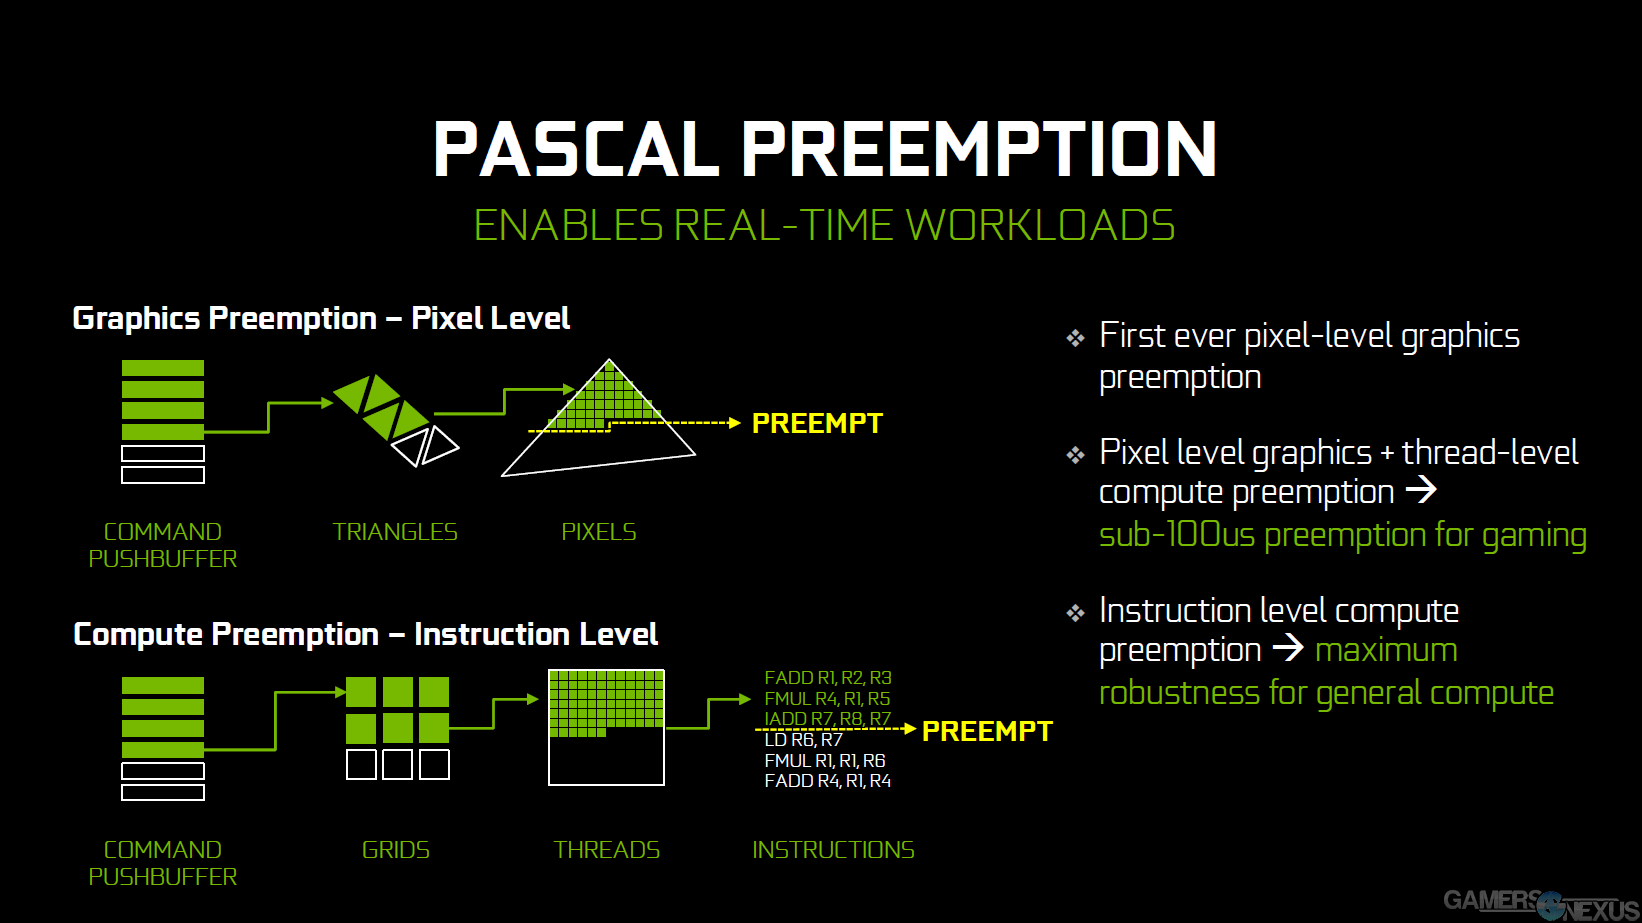
In the above image, the command pushbuffer is responsible for storing triangle and pixel data, and queues work to produce thousands of triangles and pixels as its routine operation. This graphic shows the command pushbuffer as having completed three draw calls and as working on its fourth. A draw call, as many of you know, is the process of creating triangles for use in geometry. The fourth draw call is about half-way through completion when a task with greater priority steps-in and demands resources – like commandeering a vehicle. Because of pixel-level preemption, the GPU is able to store its progress on that triangle, pause the draw call, and assign its now-free resources to the more important task.
A more important task might be that timewarp calculation, because we know that missing a timewarp operation can cause a VR user to become physically ill (this, obviously, takes priority over everything else in the system).
Once that timewarp (or other) operation is complete, the resource is released and may load its progress, then continue crunching. All the way down to a single pixel, that progress is stored and may be picked-up where left off; the draw call does not have to start over. Rasterization and pixel shading have already been completed on these pixels, so the only “loss” is the time for switching tasks, not the work itself.
The pixel shading work completes and allows the resources to be switched to the more demanding workload.
Task switching takes approximately 100 microseconds, from what we're told.
DirectX 12 benefits from another version of Compute Preemption, called “thread-level compute preemption.” This is also on Pascal GP104.
Threads are grouped into grids of thread blocks. Let's re-use our same example: A higher-priority command comes down the pipe and demands resources, instantiating the preemption request. Threads which are in-flight on the engaged SMs will complete their run, future threads and in-progress threads are saved, and the GPU switches tasks. As with pixel-level preemption, the switching time is less than 100 microseconds.
This approach to asynchronous compute also means that there's no more risk to over-filling the graphics queue and blocking real-time items from emergency entrance. Preemption is exposable through the DirectX API and will benefit GP104 in Dx12 titles. Pascal can also perform low, instruction-level compute for general compute workloads. This would help, as an example, GPU-bound production programs by freeing resources for brief moments when a user may need them elsewhere – like video playback or window dragging (eliminate that 'window lag' when moving windows during GPU-heavy renders).
That is the heart of compute preemption on GP104, and fuels future performance gains in Dx12 and Vulkan APIs.
Architecture – GP104 Pascal Memory Subsystem
The most immediate change to GP104 is its introduction of Micron's new GDDR5X memory, which nVidia has taken to calling “G5X.” We will stick with the traditional nomenclature – GDDR5X is the new memory, and GDDR5 is the “old” on-card DRAM.
The GTX 1080 is the first video card to host GDDR5X memory. GP100 hosts HBM2, Fiji hosts HBM, and previous Maxwell, Kepler, and effectively all other cards made within the last several generations – that's all GDDR5.
GDDR5X offers a theoretical throughput of 10-14Gbps (Micron will continue optimizing its design and process), significantly bolstering memory bandwidth over the ~8Gbps limitation of GDDR5. This is, of course, exceptionally slower than HBM2 – but HBM2 yields aren't here yet, and the memory is so expensive and process-refined as to be poor value for gamers today. That may change in a year, but we're really not sure what the roadmap looks like right now. AMD is slated to ship HBM2 on Vega. Fiji remains the only active architecture with any form of consumer-available high-bandwidth memory.
High-bandwidth memory on GP100 is architected as a collection of HBM dies atop an interposer, which sits on the same substrate that hosts the GPU proper. Each stack is a composite of five dies (4-high HBM2 stack atop a base die, atop the interposer and substrate). Here is a look at HBM2 on GP100:
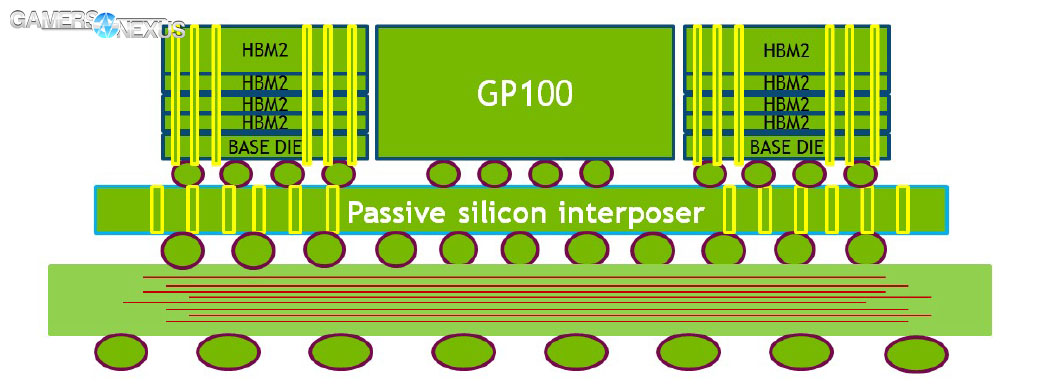
The HBM2 accompanying GP100 has an 8Gb DRAM density (versus 2Gb density of HBM1), can be stacked up to 8 dies (per stack), and operates at a 180GB/s bandwidth (versus 125GB/s of HBM1). This is enormously faster than the ~28GB/s/chip of GDDR5.
Micron's GDDR5X is found on GP104 and operates at 10Gbps (an effective 10GHz memory clock). Keeping with tradition, the new memory architecture improves performance-per-watt while still managing a speed increase, mostly by designing a new IO circuit architecture and reducing voltage demands from GDDR5 – GDDR5X eats 1.35v pre-overclock.
NVidia engineered the bus for signal integrity, performing path analysis to look for impedance/cross-talk (z). Each path was traced from the GPU to the DRAM pads, then analyzed for signal integrity. Light travels approximately one inch in the 10GHz signal time of GDDR5X, leaving a half-inch of “light opportunity” to grab each transferred bit before it's lost. With PCIe buses, differential signaling is used to check for the bit – effectively the transmission of two opposing signals (the source signal and its opposite), which assists in isolating bits that might otherwise look like noise. GDDR5X does not take this differential signaling approach and instead sends a single signal down the wire, moving from the chip, through a via, to the DRAM.
As for other components of the memory subsystem, the GTX 1080 hosts eight memory controllers comprising its 256-bit wide memory interface (32-bit controllers * 8 = 256-bit interface); each controller manages eight ROPs – 64 total – and hosts 256KB L2 Cache. There is a total of 2048KB L2 Cache.
Memory compression has also been advanced from its third generation into a new, (surprise!) fourth generation. Fourth Generation Delta Color Compression is an extension on its predecessor, which we described in-depth in the GTX 980 review. The fourth generation of delta color compression reduces the total amount of data written to memory and improves TMU and L2 cache efficiency.
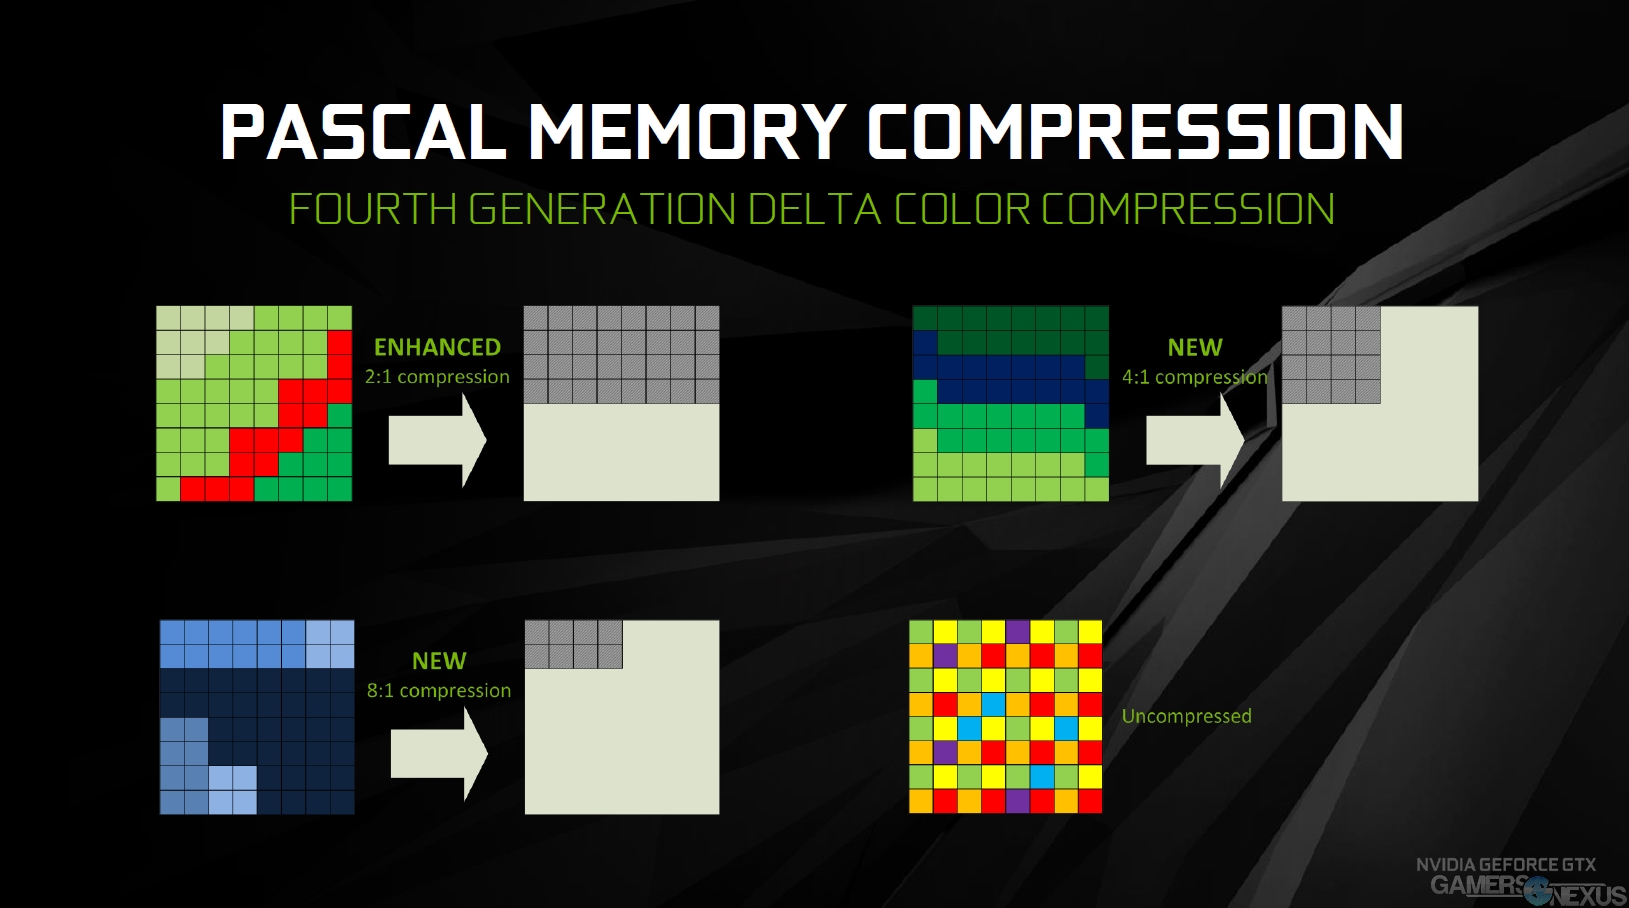
GP104 compresses colors (eventually drawn to screen) on the chip, further reducing power consumption by eliminating a need to perform remote compression. Delta color compression works by analyzing similar colors and compressing them into a single value. On a frame-by-frame basis, all colors “painted” to the screen are reduced with a 8:1 compression ratio; the GPU locates comparable colors (values which are near enough to be stored into a single color block – e.g. green, dark red, yellow, etc. – then recalled later). The compression is performed on-chip and reduces bandwidth saturation, then later unpacked for delivery to the user.
The compression ratio is the most impressive aspect of this – 8:1. If you've got 8 different shades of yellow in a frame – maybe a car hood that's got some light gradient going on – those 8 shades can be compressed into a single “yellow composite,” dispatched to wherever it's going, and unpacked later. The 2:1 compression is still available for instances where 8:1 is too aggressive, and data can be delivered with no compression (though delta color compression is lossless, not all scenes are fully compressible).
Here is an example of Third Generation Delta Color Compression, which debuted on Maxwell:
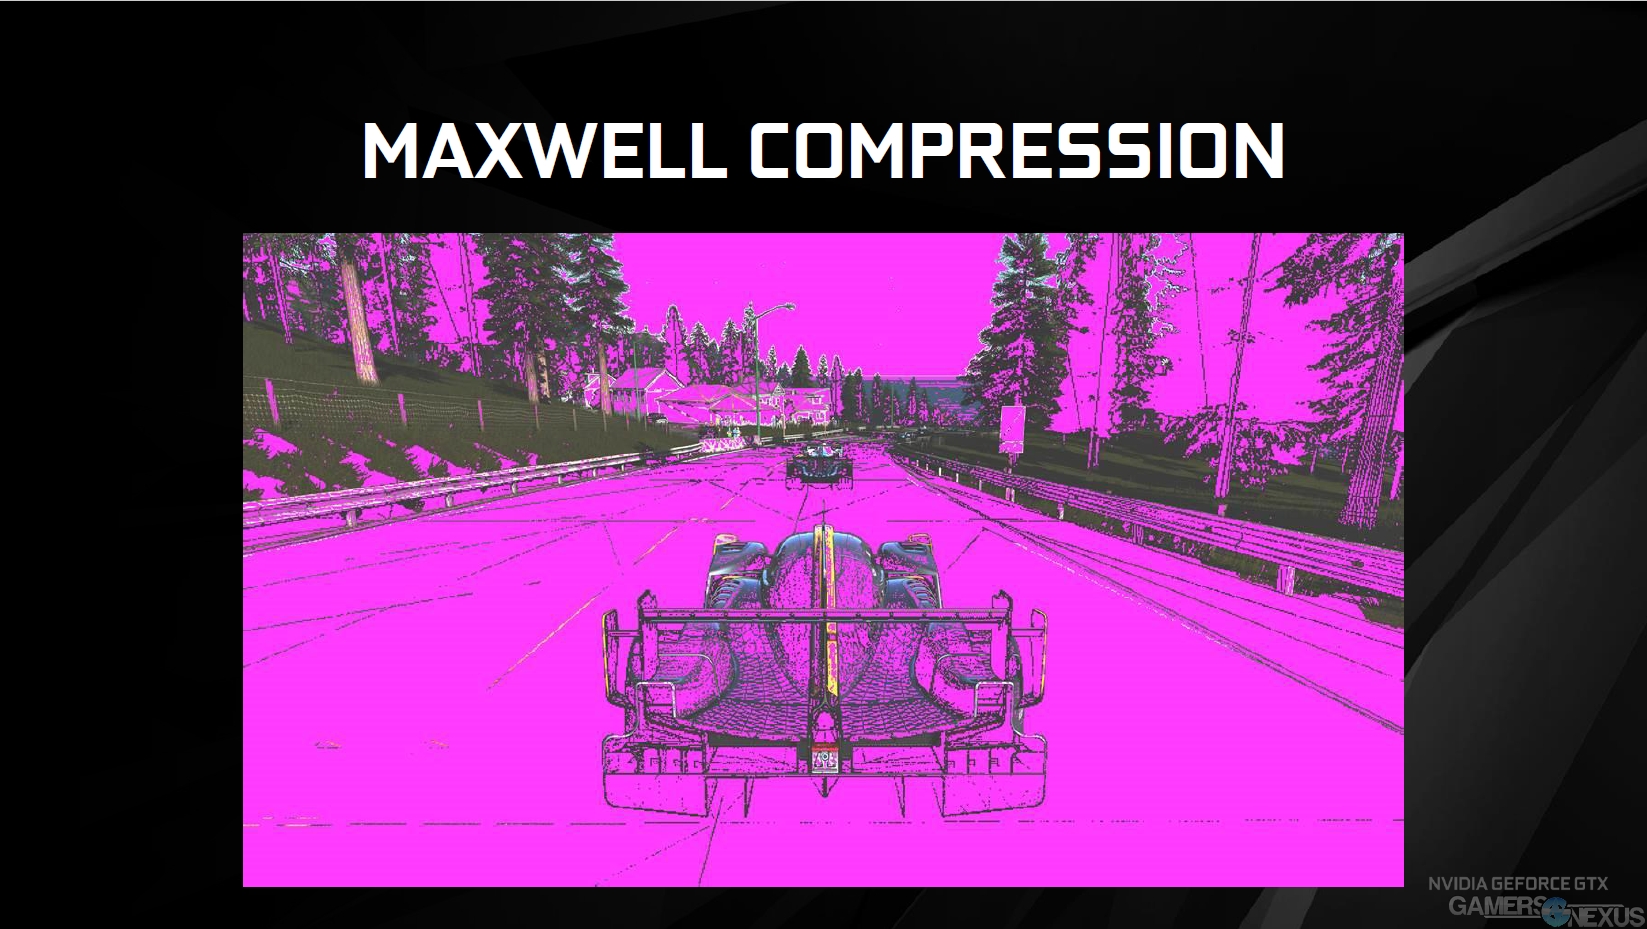
The pink coloration represents color data which was compressed; that is, every spot of pink is comparable to another color in the scene, and will use a delta value to reach that color rather than an absolute value. This significantly speeds-up transactions occurring in memory by lessening the amount of data traveling down the bus, but still retains color quality and accuracy. The more pink in the image, the more compression is going on – that's good, as the total memory bandwidth consumption is reduced. We want lossless compression wherever possible.
The above is a 2:1 compression. Let's simplify this by imagining just two colors, though: Blue and light blue. The algorithm will analyze the colors, select a neutral value between the two of them, and then store the difference (hence, delta color compression) for later recall. Instead of storing 32 bits of color information to memory per color – 64 total bits, in this case – the GPU can store just one 32-bit color value, then the marginal details for the delta.
Sticking with our example of blue colors, but expanding to Pascal's 8:1 color compression capabilities, immediate gains can be seen within the skybox of a game. Look up in Just Cause 3, for instance, and you'll be met with wide-open, blue skies. Other than some clouds, almost the entire palette is blue – and it's all similar mixes of light and dark blues. Without compression, 8 color samples would demand a full 256-bits of storage alone. With the compression, because a neutral value can be stored with the difference values separating the blues, that 256-bit requirement is reduced to just ~32 bits. Major savings.
Let's revisit those Maxwell compression shots, but add Pascal to the mix. The order of images is: Final frame (presented to the user), then Maxwell 2:1 DCCv3, then Pascal DCCv4.
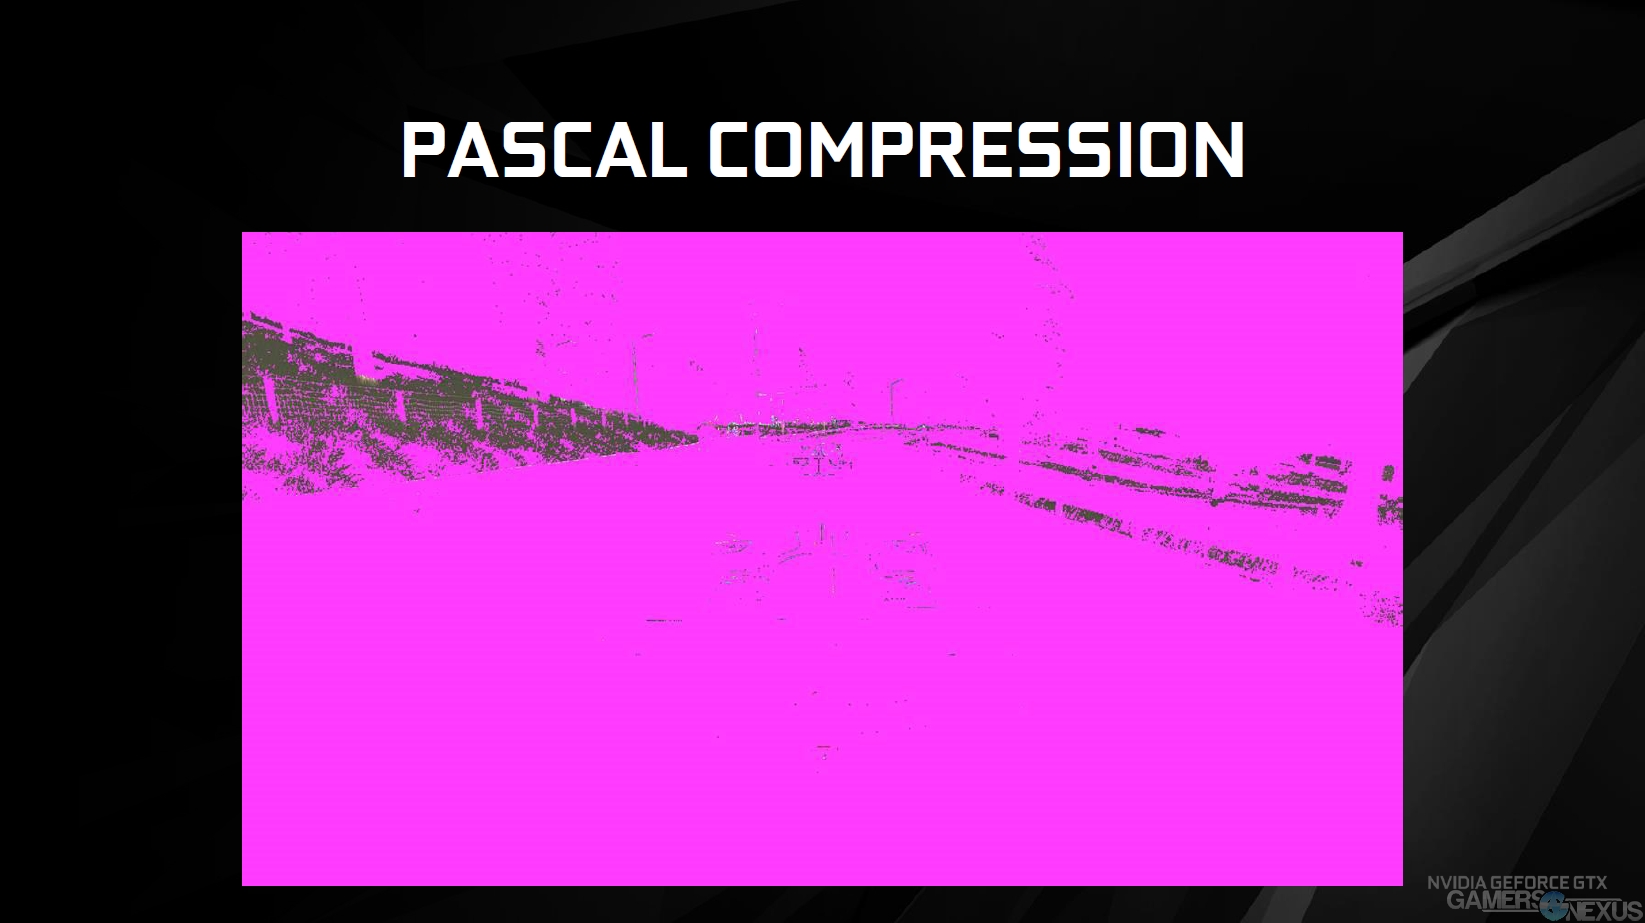
Pascal has compressed almost the entire scene, sans a few colors that are too specific and escape the compression algorithm's sweep. These triangles may have too much variation, as is the case in the greens for Maxwell's DCCv3. For reference, Maxwell's DCC is capable of reducing bandwidth saturation by 17-18% on average, freeing up memory bandwidth for other tasks.
The GTX 1080 can run 2:1, 4:1, and 8:1 compression algorithms, where the 8:1 compression mode combines 4:1 color compression of 2x2 pixel blocks, followed by a 2:1 compression of the deltas between the blocks.
Pascal's memory compression and GDDR5X bandwidth work together to grant a ~1.7x effective memory bandwidth increase over the GTX 980. Some games benefit more heavily. In Assassin's Creed: Syndicate, for instance, the GTX 1080 sees a 28% bandwidth reduction versus the GTX 980. In Star Wars: Battlefront, that reduction is only 11%. The mean seems to rest around ~20%.
Changes to SLI Bridges & Retirement of 3- & 4-Way SLI
The new SLI bridges (HB Bridge) only run two slot configurations maximally, rather than three or four of previous SLI bridges. It is possible to unlock 3-way or 4-way SLI, but we'll talk about that momentarily.
The high-bandwidth SLI bridges allow for faster copies that dramatically increase available bandwidth for interleaved transfers – e.g. VR positional sound and multi-projection. The bridge is comprised of two lanes that connect dual-graphics SLI configurations. Pascal's MIO display bridge has faster IO and reduces latency and micro-stutter in SLI, reflected in this frametime graph:
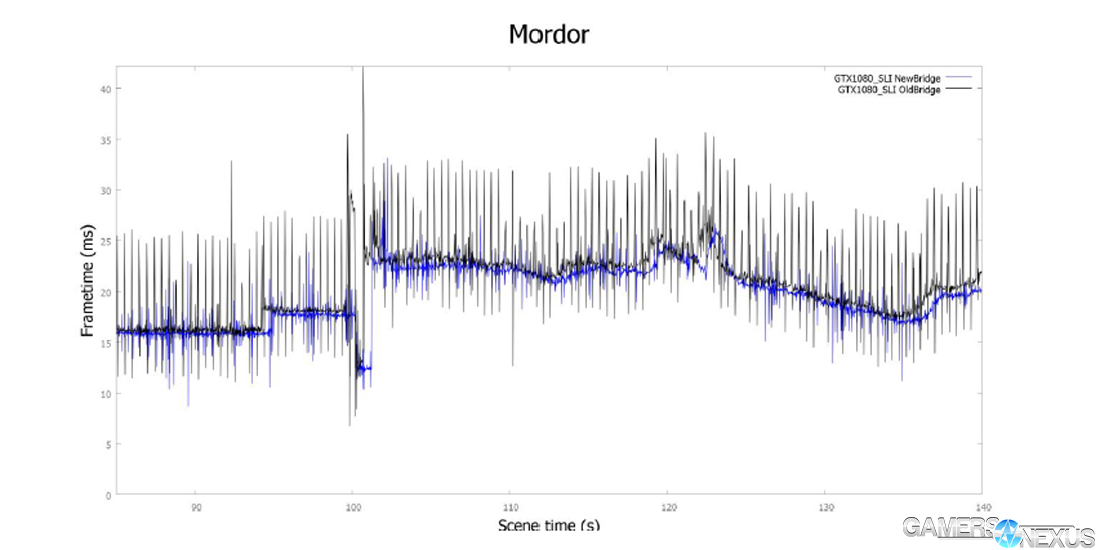
Above, blue represents the HB bridge with 2x GTX 1080s vs. an old bridge with 2x GTX 1080. Latency is more controlled versus the black line (old bridge).
NVidia describes its move away from 3-way SLI as a composite of game developer support and Microsoft decisions. A move to MDA (as in Dx12, which we tested and explained here) shifts responsibility for performance to the application as GPUs act more independently. The bridge is not exposed in MDA mode, and so goes unused. LDA (Linked Display Adapter) couples GPUs together, but is being moved away from by Microsoft and DirectX. The driver is relied upon to present abstractions to the application for LDA mode, and so the implication is that nVidia and AMD are more in control of their performance (though game-level optimizations must still be made).
Games are now more interdependent with their frame output. Heavy post-processing (play any game which is intensely post processed – like Doom, ACS, or Just Cause 3) lends itself to greater interdependence from frame-to-frame, which also means that AFR (alternate frame rendering) loses some of its efficacy. That's why we saw such abysmal multi-GPU performance in Just Cause 3 and ACS.
This in mind, nVidia is moving away from multi-GPU above 2-way SLI. NVidia informed the press that they're planning to allow 3-way (or more?) SLI for users who specifically demand the function. A special “key” will be provided – likely a digital key – to unlock > 2-way SLI capabilities, and must be requested manually from the manufacturer.
Continue to the next page for our testing methodology and the lead-in to our FPS, thermal, noise, & power benchmarks.
Game Test Methodology
We tested using our GPU test bench, detailed in the table below. Our thanks to supporting hardware vendors for supplying some of the test components.
The latest AMD drivers (16.15.2 Doom-ready) were used for testing. NVidia's unreleased 368.14 drivers were used for game (FPS) testing, with 386.12 (no performance change – just unlocked for the beta Precision build) being used for overclocking. Game settings were manually controlled for the DUT. All games were run at presets defined in their respective charts. We disable brand-supported technologies in games, like The Witcher 3's HairWorks and HBAO. All other game settings are defined in respective game benchmarks, which we publish separately from GPU reviews. Our test courses, in the event manual testing is executed, are also uploaded within that content. This allows others to replicate our results by studying our bench courses.
Windows 10-64 build 10586 was used for testing.
Each game was tested for 30 seconds in an identical scenario, then repeated three times for parity. Some games have multiple settings or APIs under test, leaving our test matrix to look something like this:
| Ashes | Talos | Tomb Raider | Division | GTA V | MLL | Mordor | BLOPS3 | Thermal | Power | Noise | |
| NVIDIA CARDS | |||||||||||
| GTX 1080 | 4K Crazy 4K High 1080 High Dx12 & Dx11 | 4K Ultra 1440p Ultra 1080p UltraVulkan & Dx11 | 4K VH 1440p VH 1080p VHDx12 & Dx11 | 4K High 1440p High 1080p High | 4K VHU 1080 VHU | 4K HH 1440p VHH 1080p VHH | 4K Ultra 1440p Ultra 1080p Ultra | 4K High 1440p High 1080p High | Yes | Yes | Yes |
| GTX 980 Ti | 4K Crazy 4K High 1080 High Dx12 & Dx11 | 4K Ultra 1440p Ultra 1080p UltraVulkan & Dx11 | 4K VH 1440p VH 1080p VHDx12 & Dx11 | 4K High 1440p High 1080p High | 4K VHU 1080 VHU | 4K HH 1440p VHH 1080p VHH | 4K Ultra 1440p Ultra 1080p Ultra | 4K High 1440p High 1080p High | Yes | Yes | Yes |
| GTX 980 | 4K Crazy 4K High 1080 High Dx12 & Dx11 | 4K Ultra 1440p Ultra 1080p UltraVulkan & Dx11 | 4K VH 1440p VH 1080p VHDx12 & Dx11 | 4K High 1440p High 1080p High | 4K VHU 1080 VHU | 4K HH 1440p VHH 1080p VHH | 4K Ultra 1440p Ultra 1080p Ultra | 4K High 1440p High 1080p High | Yes | Yes | Yes |
| AMD CARDS | |||||||||||
| AMD R9 390X | 4K Crazy 4K High 1080 High Dx12 & Dx11 | 4K Ultra 1440p Ultra 1080p UltraVulkan & Dx11 | 4K VH 1440p VH 1080p VHDx12 & Dx11 | 4K High 1440p High 1080p High | 4K VHU 1080 VHU | 4K HH 1440p VHH 1080p VHH | 4K Ultra 1440p Ultra 1080p Ultra | 4K High 1440p High 1080p High | Yes | Yes | No |
| AMD Fury X | 4K Crazy 4K High 1080 High Dx12 & Dx11 | 4K Ultra 1440p Ultra 1080p UltraVulkan & Dx11 | 4K VH 1440p VH 1080p VHDx12 & Dx11 | 4K High 1440p High 1080p High | 4K VHU 1080 VHU | 4K HH 1440p VHH 1080p VHH | 4K Ultra 1440p Ultra 1080p Ultra | 4K High 1440p High 1080p High | Yes | Yes | Yes |
Average FPS, 1% low, and 0.1% low times are measured. We do not measure maximum or minimum FPS results as we consider these numbers to be pure outliers. Instead, we take an average of the lowest 1% of results (1% low) to show real-world, noticeable dips; we then take an average of the lowest 0.1% of results for severe spikes.
| GN Test Bench 2015 | Name | Courtesy Of | Cost |
| Video Card | This is what we're testing! | - | - |
| CPU | Intel i7-5930K CPU | iBUYPOWER | $580 |
| Memory | Corsair Dominator 32GB 3200MHz | Corsair | $210 |
| Motherboard | EVGA X99 Classified | GamersNexus | $365 |
| Power Supply | NZXT 1200W HALE90 V2 | NZXT | $300 |
| SSD | HyperX Savage SSD | Kingston Tech. | $130 |
| Case | Top Deck Tech Station | GamersNexus | $250 |
| CPU Cooler | NZXT Kraken X41 CLC | NZXT | $110 |
For Dx12 and Vulkan API testing, we use built-in benchmark tools and rely upon log generation for our metrics. That data is reported at the engine level.
Video Cards Tested
- NVIDIA GTX 1080 Founders Edition ($700)
- NVIDIA GTX 980 Ti Reference ($650)
- NVIDIA GTX 980 Reference ($460)
- NVIDIA GTX 980 2x SLI Reference ($920)
- AMD R9 Fury X 4GB HBM ($630)
- AMD MSI R9 390X 8GB ($460)
Thermal Test Methodology
We strongly believe that our thermal testing methodology is the best on this side of the tech-media industry. We've validated our testing methodology with thermal chambers and have proven near-perfect accuracy of results.
Conducting thermal tests requires careful measurement of temperatures in the surrounding environment. We control for ambient by constantly measuring temperatures with K-Type thermocouples and infrared readers. We then produce charts using a Delta T(emperature) over Ambient value. This value subtracts the thermo-logged ambient value from the measured diode temperatures, producing a delta report of thermals. AIDA64 is used for logging thermals of silicon components, including the GPU diode. We additionally log core utilization and frequencies to ensure all components are firing as expected. Voltage levels are measured in addition to fan speeds, frequencies, and thermals. GPU-Z is deployed for redundancy and validation against AIDA64.
All open bench fans are configured to their maximum speed and connected straight to the PSU. This ensures minimal variance when testing, as automatically controlled fan speeds will reduce reliability of benchmarking. The CPU fan is set to use a custom fan curve that was devised in-house after a series of testing. We use a custom-built open air bench that mounts the CPU radiator out of the way of the airflow channels influencing the GPU, so the CPU heat is dumped where it will have no measurable impact on GPU temperatures.
We use an AMPROBE multi-diode thermocouple reader to log ambient actively. This ambient measurement is used to monitor fluctuations and is subtracted from absolute GPU diode readings to produce a delta value. For these tests, we configured the thermocouple reader's logging interval to 1s, matching the logging interval of GPU-Z and AIDA64. Data is calculated using a custom, in-house spreadsheet and software solution.
Endurance tests are conducted for new architectures or devices of particular interest, like the GTX 1080, R9 Fury X, or GTX 980 Ti Hybrid from EVGA. These endurance tests report temperature versus frequency (sometimes versus FPS), providing a look at how cards interact in real-world gaming scenarios over extended periods of time. Because benchmarks do not inherently burn-in a card for a reasonable play period, we use this test method as a net to isolate and discover issues of thermal throttling or frequency tolerance to temperature.
Our test starts with a two-minute idle period to gauge non-gaming performance. A script automatically triggers the beginning of a GPU-intensive benchmark running MSI Kombustor – Titan Lakes for 1080s. Because we use an in-house script, we are able to perfectly execute and align our tests between passes.
Noise Testing Methodology
Our noise testing methodology is new and still being revised, but has been kept consistent across all tests contained herein. We test noise in a real-world environment and do not presently use an anechoic chamber. The results align with what consumers will encounter in their own rooms.
We use a REED logging dB meter mounted to a tripod, whose mic is positioned 20” from the face of the GPU (mounted in an open bench). The REED meter is approximately 6” above the bench. All open bench fans are disabled. The Kraken X41 CPU cooling fan is configured to its “silent” mode, minimizing its noise output to be effectively imperceptible.
A noise floor measurement is taken prior to each test's execution to determine ambient without any systems running in the room. We then take an idle measurement (GPU & CPU at idle). Our noise floor has a fluctuation of approximately +/-0.6dB.
Noise levels are logarithmic, and are therefore not as simple to perform delta calculations as thermals or framerates. Noise percent differences are calculated using dB=20*log(V2/V1) (where V is amplitude). You cannot perform a simple percent difference calculation to determine the delta. For an example, a 10dB range (50dB vs. 40dB) is not equal to a 22% delta.
After the noise floor is determined, we log idle fan dB, 50% speed dB, and 100% speed dB (configured in Afterburner). We also measure auto fan dB at an identical stepping for every test; we do this by running Kombustor for exactly 5 minutes prior to beginning dB logging, which is useful for fans which use two push fans. Some dual-push fan cards will only trigger the second fan if the VRM is under load.
Power Testing Methodology
Power consumption is measured at the system level. You can read a full power consumption guide and watt requirements here. When reading power consumption charts, do not read them as a GPU-specific requirements – this is a system-level power draw.
Power draw is measured during the thermal burn-in. We use a logging wall meter that sits between the PSU and the system and logs power consumption over the test period. We select the final 200s of data and average the data points.
We use a different bench platform for power measurements; see below:
| GN Z97 Bench | Name | Courtesy Of | Cost |
| Video Card | This is what we're measuring! | - | - |
| CPU | Intel i7-4790K CPU | CyberPower | $340 |
| Memory | 32GB 2133MHz HyperX Savage RAM | Kingston Tech. | $300 |
| Motherboard | Gigabyte Z97X Gaming G1 | GamersNexus | $285 |
| Power Supply | Enermax Platimax 1350W | Enermax | $272 |
| SSD | HyperX Predator PCI-e SSD Samsung 850 Pro 1TB | Kingston Tech. Samsung | |
| Case | Top Deck Tech Station | GamersNexus | $250 |
| CPU Cooler | Be Quiet! Dark Rock 3 | Be Quiet! | ~$60 |
Continue to the next page for thermal benchmarks, noise, and power!
GTX 1080 Thermal Benchmark – Founders Edition / Reference Temperatures
Our specialty – thermals – begins the objective analysis of nVidia's new GeForce GTX 1080 graphics card. This test looks at temperatures over time for the new GTX 1080 Founders Edition, which uses an nVidia-made heatsink that effectively replaces the old “Reference” nomenclature. From a product standpoint, the Founders Edition is basically the reference card. FE replaces reference. Keep that in mind.
We decided to primarily focus on testing other reference designs to plot nVidia's performance change over their own cards. Other devices, like MSI's Twin Frozr cards or EVGA's GTX 980 Ti Hybrid (which uses Asetek liquid cooling), are also included in this bench.
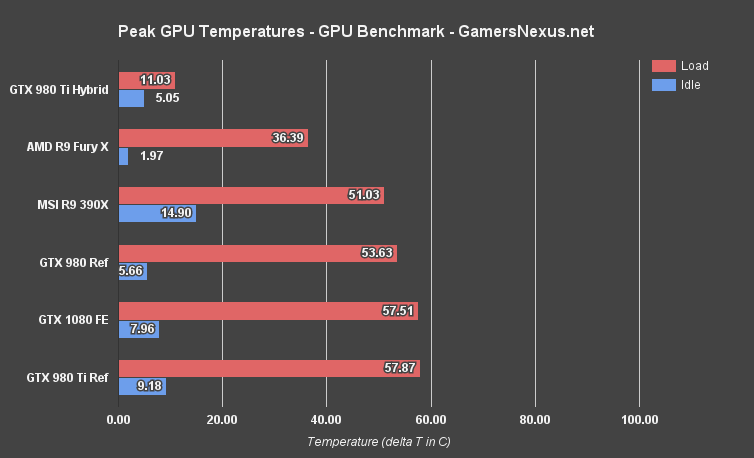
(Note: Our test methodology has changed since our 980 Ti Hybrid review; the card performs cooler in our new bench configuration. Old thermal data is NOT comparable.)
This chart represents a data set that we loosely call our “equilibrium” measurements, meaning the averaged temperature output after the GPUs have been fully loaded and cease temperature/fan RPM fluctuations. All values above are delta T over ambient. Lower is, obviously, better (to an extent, anyway).
The GTX 1080 operates at 57.5C under load and 7.96C idle. Comparatively, that's roughly 49% warmer than the Fury X (36.39C) and is effectively identical to the GTX 980 Ti. The Founders Edition cooler, in conjunction with thermal and power management improvements on the silicon, is able to keep the more powerful GTX 1080 at about the same temperature as the GTX 980 Ti's reference cooler does for the GM200 chip.
GTX 1080 Thermals Over Time
This next chart represents the full thermal data, what we call “Thermals over Time.”
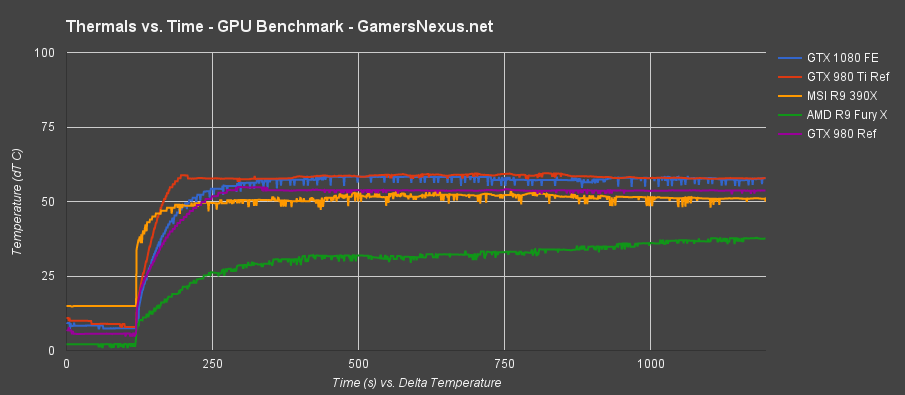
As shown here, the thermal torture commences at the same time across all tested devices. We're only showing the most immediately relevant contenders or comparable coolers above. The only card producing a smoother thermal output is the GTX 980 Ti reference, though the rest are all reasonable. There are no major fluctuations and fan speeds remain consistent across the board (on the auto setting), ensuring that there are no major, sudden pitch changes to the user. This is most important when worrying about noise levels, as sudden changes are more noticeable than sustained noise.
Thermally, the GTX 1080 FE performs about identically to the GTX 980 Ti. After adding ambient back in, we see that thermals hit ~80C and stay there – the fan will adjust itself accordingly to maintain this thermal level. It has been traditional of nVidia reference cards to throttle the clock-rate once the card hits 80C, useful as a means of keeping thermals under control. We'll explore that in a moment.
The averaged load temperatures are reflected in the previous chart (same data-set for both).
GTX 1080 Thermals versus Frequency (And Thermal Throttling)
This test was conducted over a 2-hour period (~8000 seconds). Rather than Kombustor, we used a real-world game to analyze performance and throttles in gaming scenarios. DiRT Rally was used at its maxed-out settings (4K, 8-tap MSAA, advanced blending, Ultra settings) to torture the card. To further amplify the thermal torture and create somewhat of a worst-case scenario, we also disabled all three front intake fans. This left the GPU entirely to its own devices – mostly the VRM blower fan and alloy heatsink / vapor chambers – to cool itself.
This data is absolute temperature, not the delta. We changed our data presentation for this chart to more clearly illustrate the point of throttling, without the necessity of simple math to add in ambient. This is an absolute temperature.
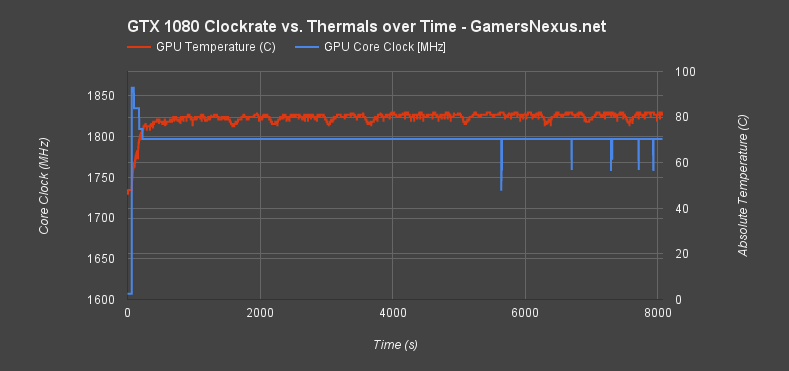
The frequency is fairly stable here, but shows dips in frequency which grow in consistency as the test continues. Let's zoom in on that data; the scale is a little wide to properly see what's going on. Here's a blown-up version of those spikes, truncating the data from ~5500s to ~7500s:
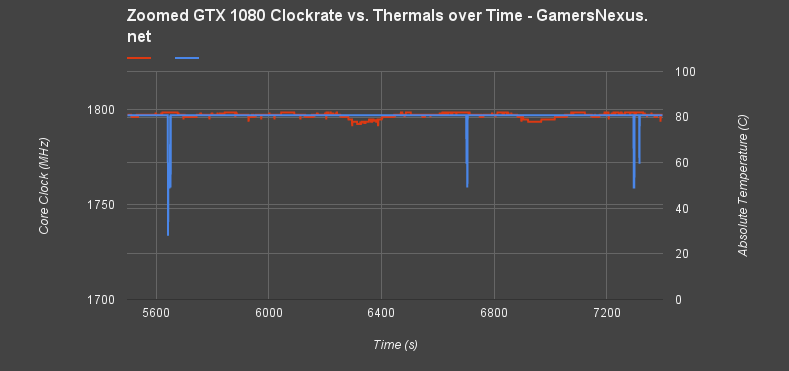
Frequency fluctuations show a range of approximately ~60MHz each time the GPU diode hits ~82C absolute. This can trigger a slight latency increase or framerate fluctuation at the exact moment of frequency fluctuation, but is basically imperceptible.
Here's a look at the most exaggerated spike:
| Time (s) | Core MHz | Abs. T. (C) |
| 5636 | 1797 | 82 |
| 5637 | 1797 | 82 |
| 5638 | 1797 | 82 |
| 5639 | 1797 | 82 |
| 5640 | 1797 | 82 |
| 5641 | 1797 | 82 |
| 5642 | 1733.5 | 82 |
| 5643 | 1759 | 82 |
| 5644 | 1771.5 | 82 |
| 5645 | 1759 | 82 |
| 5646 | 1759 | 82 |
| 5647 | 1759 | 82 |
| 5648 | 1771.5 | 82 |
| 5649 | 1771.5 | 82 |
| 5650 | 1797 | 82 |
A few hits later, the temperature falls pursuant to this frequency throttle (which is the point of the momentarily throttle):
| Time (s) | Core MHz | Abs. T. (C) |
| 5677 | 1797 | 81 |
| 5678 | 1797 | 81 |
| 5679 | 1797 | 82 |
| 5680 | 1797 | 81 |
| 5681 | 1797 | 81 |
| 5682 | 1797 | 81 |
| 5683 | 1797 | 81 |
| 5684 | 1797 | 81 |
| 5685 | 1797 | 81 |
| 5686 | 1797 | 81 |
| 5687 | 1797 | 81 |
| 5688 | 1797 | 81 |
| 5689 | 1797 | 81 |
| 5690 | 1797 | 81 |
| 5691 | 1797 | 81 |
| 5692 | 1797 | 81 |
| 5693 | 1797 | 81 |
| 5694 | 1797 | 81 |
| 5695 | 1797 | 81 |
| 5696 | 1797 | 81 |
| 5697 | 1797 | 79 |
With the frequency restored and the game continuing to crunch numbers and graphics, temperatures eventually return to 82C and drop again.
This dance occurs five times in a span of 42 minutes. To this end, the metric is important to measure, but can be ignored as an end user. You will not perceive these hits, and the frequency throttle is so minimal as to be imperceptible on framerate in the greater scheme of a 2-hour play session.
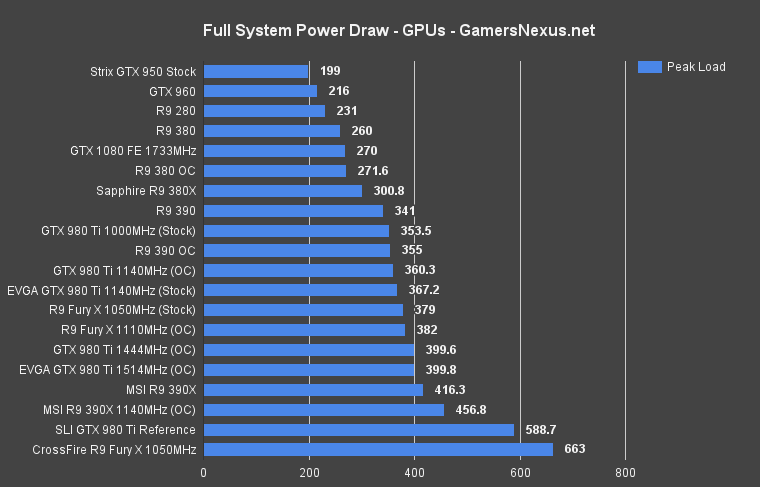
NVIDIA GTX 1080 Power Consumption & Watt Draw
Power consumption is a pretty simple test. After analyzing data from our logging wall meter, we found peak system power consumption (in the final 200s of our 1080s thermal burn-in) to post as below:
NVIDIA GTX 1080 Founders Edition Noise Levels / Decibel Output
The below chart shows our noise level analysis, using the methodology defined on the previous page.
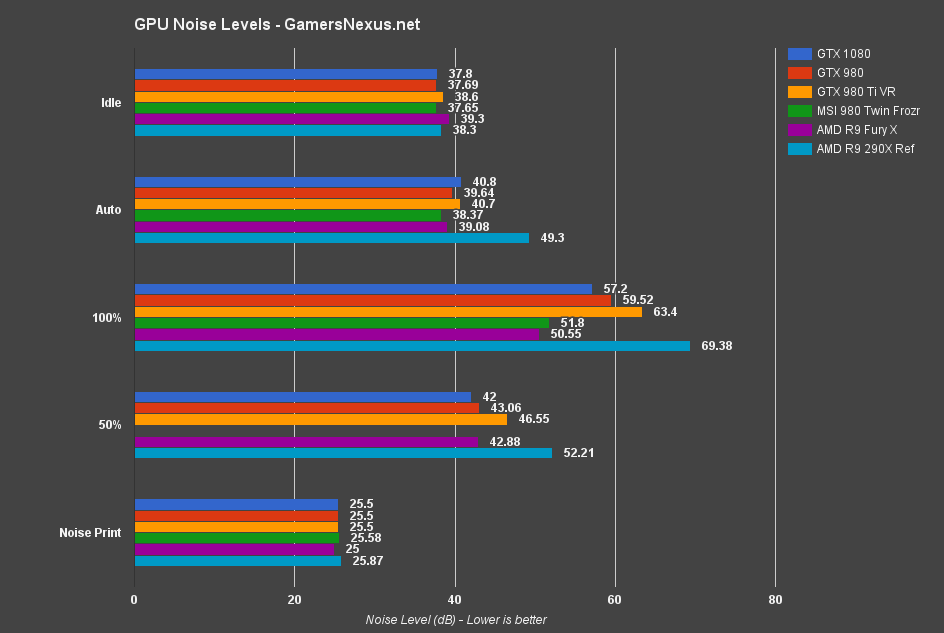
Idle noise levels are more or less imperceptibly varied between all cards tested. After the five-minute GPU load period (auto), the R9 290X pushes the loudest dB output (49.3dB) and would be perceptible even from within an enclosure. The R9 Fury X may only be 39.08dB, but produces the same high-pitched pump whine that we wrote about ages ago. The MSI Twin Frozr card keeps the lowest dB level at 38.37, aided by its dual-fan push setup and massive alloy heatsink (reducing the need to run higher RPMs). The GTX 980 Ti VR edition operates at 40.7dB; the GTX 1080 runs at 40.8dB, but the difference is within margin of error and the cards sound identical.
Almost no card will run at 100% fan RPMs, but we test them for an absolute and reliable measurement. Most auto settings seem to peak around 50-55%. At 100%, the R9 290X reference design hits 70dB, which is louder than most conversational speech (~65dB, though that's obviously dependent on the speaker). You'd have to raise your voice to compete with the 290X at full bore. The GTX 1080's 100% setting operates at only 57.2dB, the 980 Ti at a noticeably louder 63.4dB, and the 980 at 59.52dB. It isn't until the Fury X and Twin Frozr cards that we get more manageable ~50-52dB outputs.
Note that the MSI Twin Frozr card did not run the 50% test, as it is impossible to get both fans operating at 50% through a forced MSI Afterburner setting. Refer to the Auto mode for this data (runs close to 50% and with slight variance).
Continue to the next page for DirectX 12, Vulkan, & DirectX 11 gaming on the GTX 1080.
NVIDIA GTX 1080 FPS Benchmarks – Dx12 & Vulkan (& OpenGL) vs. Dx11
This page initiates our game benchmarking for the GTX 1080. We do not include any Dx11-only games on this page, but we do provide comparative data between Dx11, Dx12, and Vulkan (where present) for tested games. Some of this data is presented as a percent change value or other unique values, like ms latency. These charts provide insight as to async compute performance and overall acceptance of new APIs by the hardware.
OpenGL is also included through DOOM, freshly-launched. Note that, since our tests were performed, AMD released a hotfix driver that reportedly resolves some R9 390 & R9 390X performance issues we experienced.
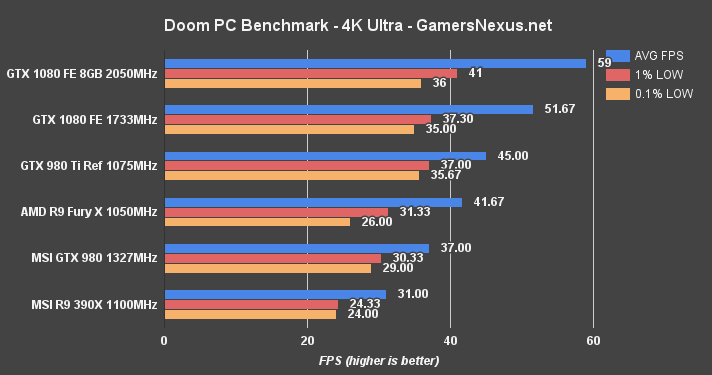
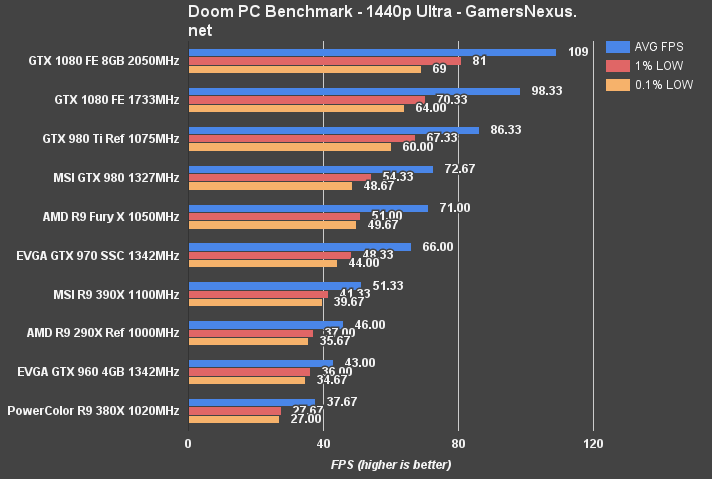
OpenGL DOOM – GTX 1080 vs. GTX 980 Ti, Fury X, & 980
We posted a DOOM benchmark almost immediately upon the game's launch. Absent from those charts were our already-conducted GTX 1080 performance tests – you'll find those below.
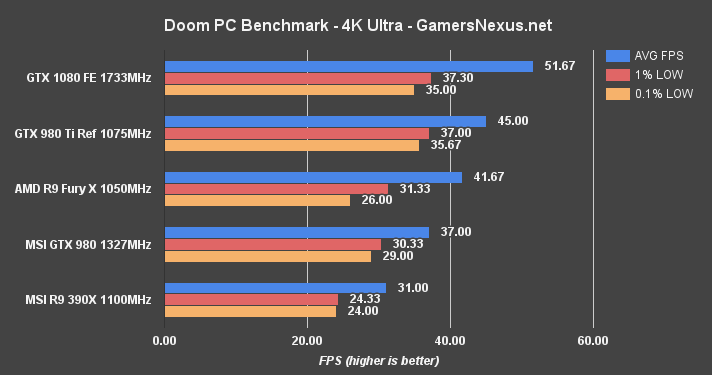
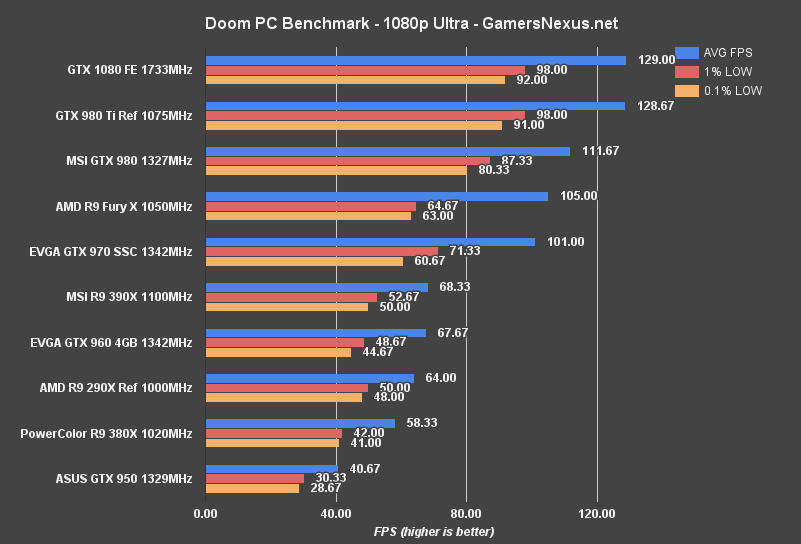
The GTX 1080 runs close to 60FPS at 4K resolution. Some lightweight graphics tuning would push the card into 60FPS range – mostly by dropping shadows or other post FX settings by one rung. The GTX 1080 Founders Edition (stock clock) outperforms the stock GTX 980 Ti by 13.8%. The Fury X is outperformed by 21.4% in this OpenGL title. Real-world differences, when looking at raw framerates and frametimes, are largely unnoticeable at this resolution – but the 1080 is off to a good start considering its value proposition versus these two similarly-priced cards.
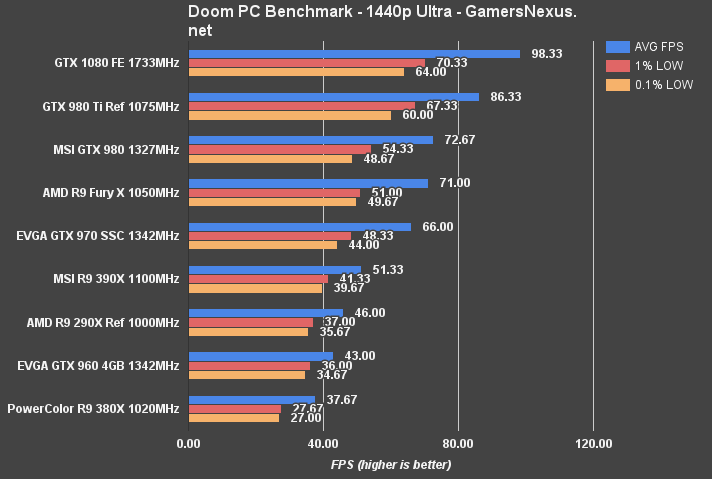
At 1440p, the GTX 1080's performance lead plants it at 98.3FPS, aided by the best low frametimes on our bench. The GTX 1080 is the most tightly timed card for frame delivery that we've ever tested. Against the predecessor GTX 980 non-Ti, performance gains are 30%. Against the 980 Ti, the performance difference is 13% again.
1080p produces a CPU (or other hardware) bottleneck, with the GTX 1080 and GTX 980 Ti being capped around 128-129FPS average. To be fair, you're probably not playing at 1080p with one of these cards, anyway; at least, not unless you're trying to hit 144Hz – in which case that looks like a reasonable use case.
Comparative Dx12 vs. Dx11 FPS in Ashes of Singularity – GTX 1080 vs. 980 Ti, Fury X
Ashes of the Singularity offers some of the most reliable and accurate testing data out of all our Dx12 API games. Ashes easily reproduces comparable metrics and provides data down to the number of batches being pushed through the pipe.
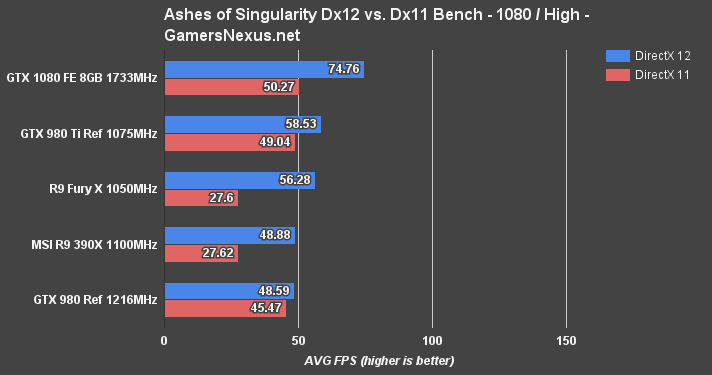
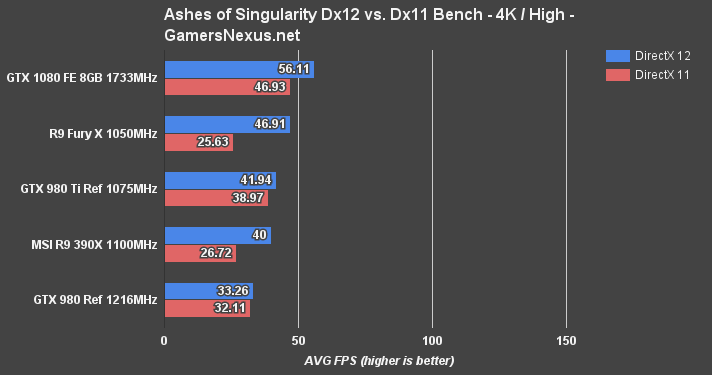
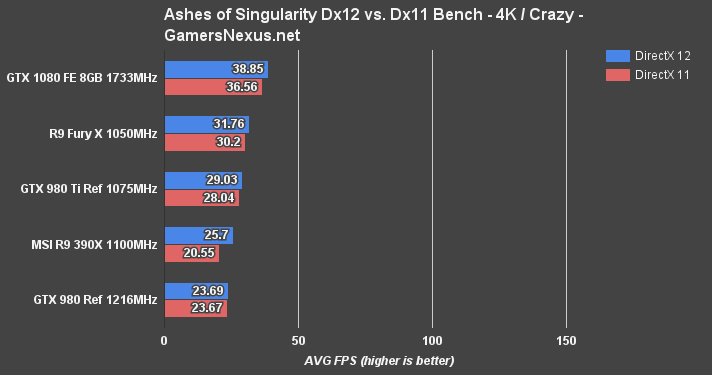
We rip the Satellite Shot 2 data from Ashes, which shoves large batches down the pipe and chokes components. This is somewhat of a worst case scenario for the GPU. The above chart represents raw FPS output (averaged) for Dx11 vs. Dx12 on each card, the below chart shows the millisecond latency (frametimes) on each API, and the next one shows the percent change from Dx11 to Dx12 when it comes to frametimes.
At 1080p/high, the GTX 1080 crushes the other cards underfoot. NVidia's asynchronous compute advancements have clearly worked out (at least, in Ashes) and are producing gap-widening gains versus when compared against the previous architecture. AMD's Fury X and R9 390X are still the most impressive when it comes to gains, though. These two cards are choking on some sort of Dx11 optimization issue – something that nVidia's good at, when it comes to circumventing bottlenecks with drivers – and are limited by Dx11 in the Satellite Shot 2 heavy benchmark. With Dx12, the cards can unleash their full potential and nearly double framerates – but they're still behind the GTX 1080.
In contrast to this, the GTX 980 Maxwell card ranked high among Dx11 performers, but falls to the bottom of the chart for Dx12.
The GTX 1080 has made obvious improvements to Dx12 optimization and framerate.
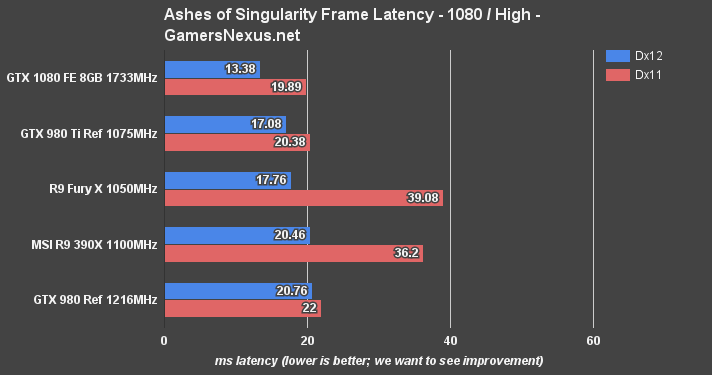
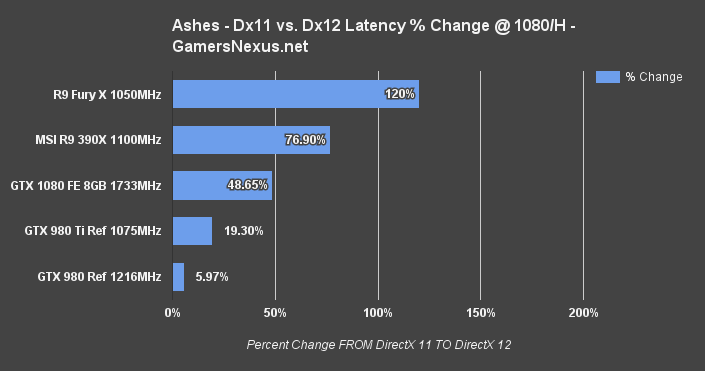
Here's the frametime chart with 1080p on High. Lower is better. AMD's crux is its Dx11 frame latency, which creates the stuttering seen in Dx11. The GTX 1080 has an unprecedentedly low 13.38ms average frametime.
The Fury X sees a ~120% latency reduction, the 390X sees a 76.9% latency reduction – both a reward to AMD's investment in asynchronous compute – while the older GM204 Maxwell architecture struggles to stay positive. GTX 1080 and GP104, however, combine brute force COMPUTE with Async improvements to generate a 48.65% jaunt in Dx12. That's big news for nVidia, and shows that all this asynchronous talk isn't just sabre rattling.
Comparative Vulkan vs. Dx11 in Talos Principle – GTX 1080 vs. Fury X, 980 Ti, 980
The Talos Principle was our initial Vulkan benchmark a few months ago. The game's advanced reasonably within that time, but still exhibits poorer Vulkan performance than DirectX 11 performance. CroTeam, the developers, expect to see a switch-over point where Vulkan surpasses Dx11 performance in The Talos Principle.
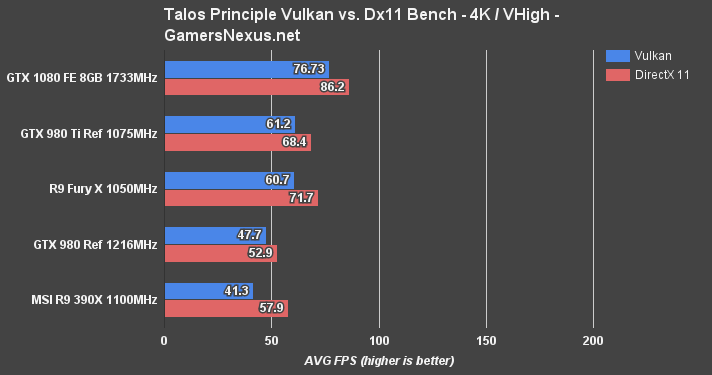
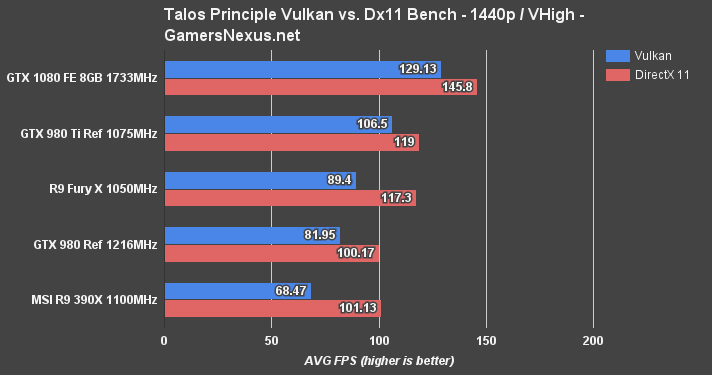
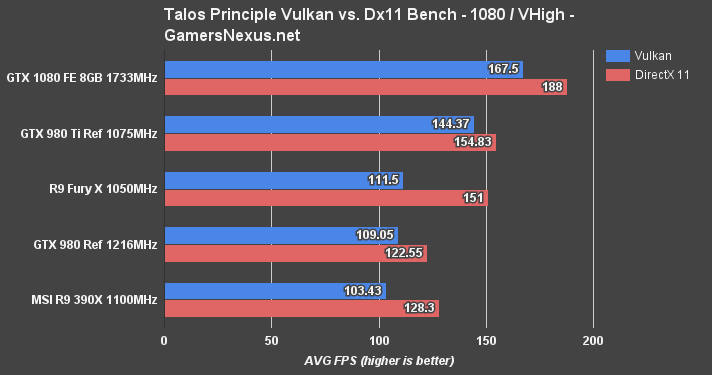
Our tests show the GTX 1080 leading the charge for Vulkan performance. There's about an 11% difference favoring Dx11 across the GTX 1080's comparative benchmarks.
Comparative Gains in Tomb Raider – Dx11 vs. Dx12 Performance on GTX 1080
Tomb Raider is a little wonky as a title – it's got some funny optimization in spots, and AMD tends to do best with Dx11 as a result (whereas nVidia sees tiny, but consistent gains with Dx12).
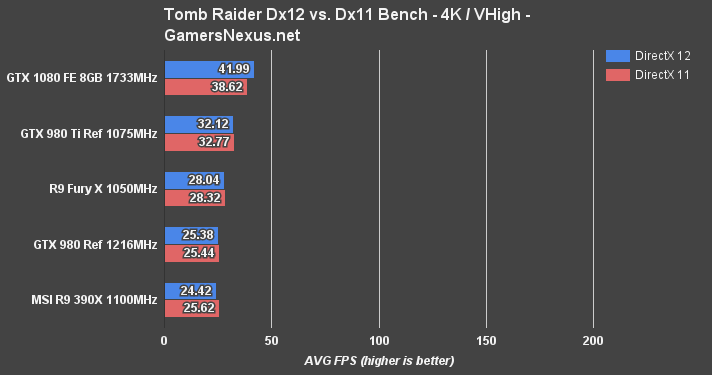
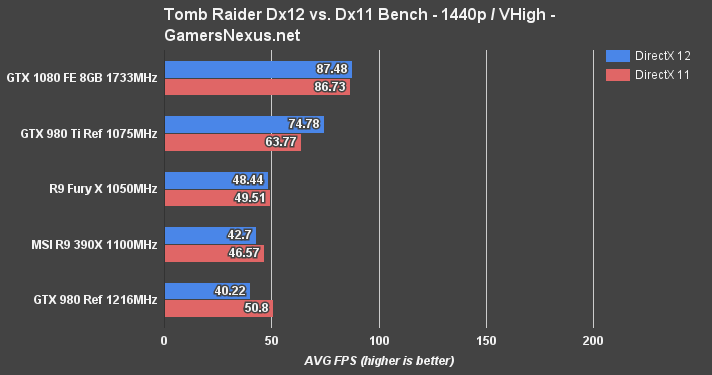
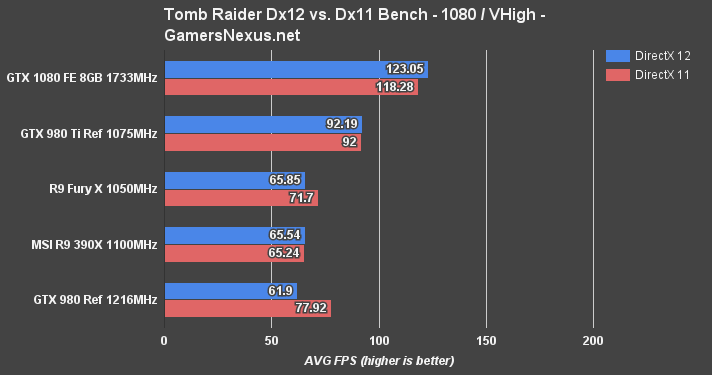
AMD doesn't come off of Tomb Raider looking too hot. The delta between the GTX 1080 Founders Edition and GTX 980 Ti Reference, in order of 1080p, 1440p, and 4K, is 28.7%, 15.7%, and 26.6%.
Let's move on to DirectX 11 benchmarking for some tried-and-true metrics, including our 1% and 0.1% low frametime analysis. Hit the Next page button for that.
The Division Benchmark – GTX 1080 vs. 980 Ti, Fury X at 4K, 1440, & 1080
The Division is brand new in its addition to our bench. We had the fun of encountering some game timing bugs when exceeding 120FPS, a non-issue with the older generation cards.
For the GTX 1080, framerates in excess of 120FPS aren't difficult at 1080p; that obviously changes with the higher resolutions, but it was a worthwhile and fun(ny) test. Snow seems to go from “gentle dusting” to “Europa on a good day” in a matter of seconds.
Here's the first set of Dx11 charts:
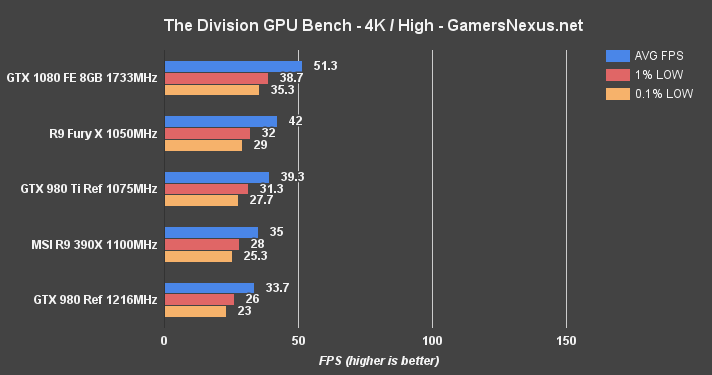
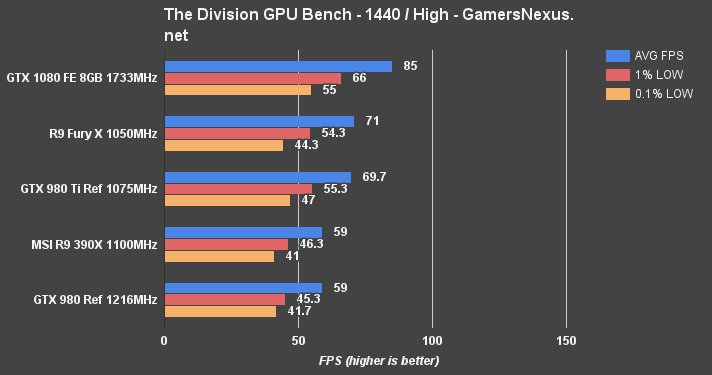
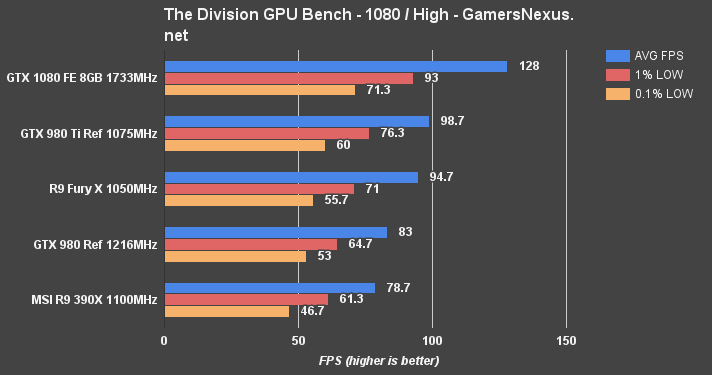
Although the Fury X (which previously topped the charts) and GTX 1080 don't quite hit that 60FPS mark under the intense load of 4K at High, the GTX 1080 remains more-or-less “playable” for this particular shooter. We'd recommend a settings reduction, of course. It's more realistic to play 4K on lower settings with this game (and these cards), but 1440p is easily afforded (~85FPS average).
Black Ops 3 Benchmark – GTX 1080 vs. 980 Ti, Fury X at 4K, 1440, & 1080
Call of Duty: Black Ops 3 is almost comically fast on the GTX 1080; here – have a look:
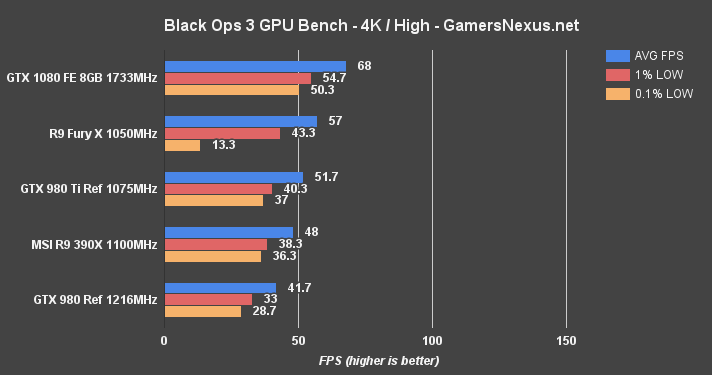
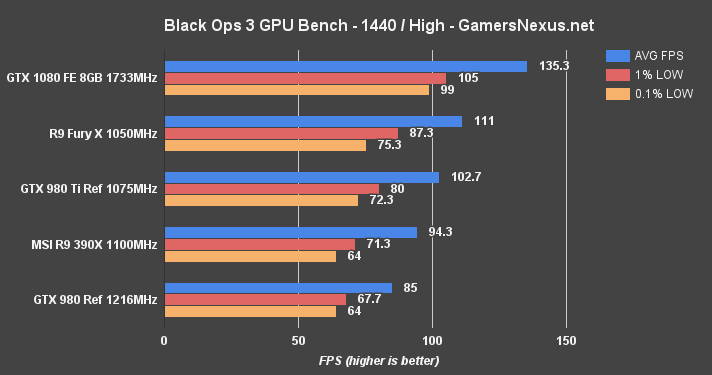
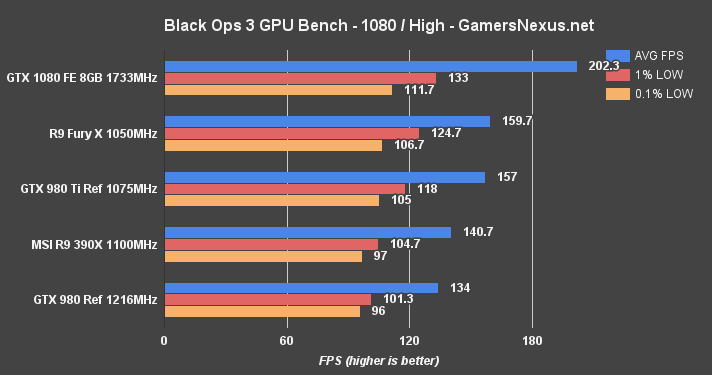
We had to adjust the scale of our charts for this one (usually 160 – now 200FPS). The GTX 1080 outranks AMD's Fury X, the previous frontrunner for Black Ops III framerates, and does so by disgusting margins. The GTX 1080 outputs an average framerate that'd satisfy a 200Hz display, leading AMD's Fury X by 21.1%. The low frametimes are tightly positioned for both the Fury X and GTX 1080. The GTX 980 Ti is outpaced by 22.4% against the GTX 1080. The GTX 980 GM204 card is fully 33.4% slower than its replacement.
The gaps decrease towards 4K, with only the Fury X and GTX 1080 sustaining near-60FPS framerates for ideal performance. The Fury X hits its 4GB VRAM limitation, though, and suffers for it. 0.1% low frametimes get knocked down to just 13.3FPS, creating visibly frame “drops” when playing. This is worse than AMD's own R9 390X, leveraging its 8GB GDDR5 to keep above board.
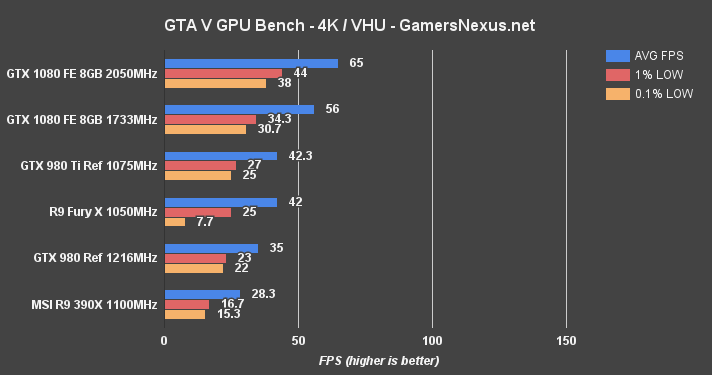
GTA V Benchmark – GTX 1080 vs. 980 Ti, Fury X, 980 at 4K & 1080
GTA V is one of the mainstays of our bench, given its accuracy and our deep understanding of its graphics settings.
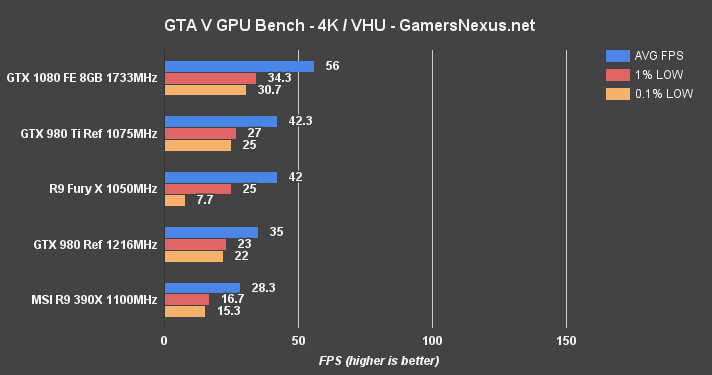
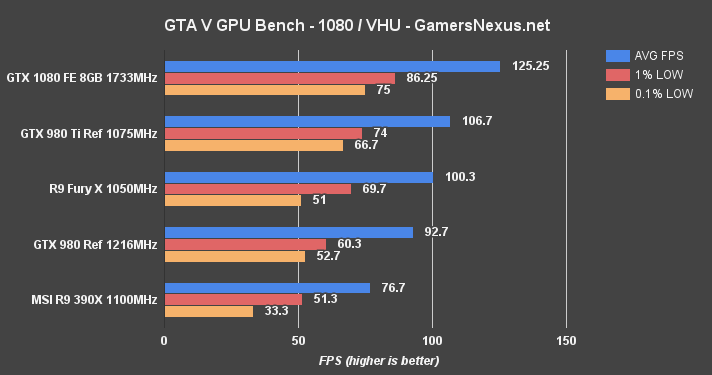
At 4K – Very High / Ultra, GTA V again reveals the Fury X's capacity limitations by knocking the 0.1% low performance to half the R9 390X (which is also not great). The GTX 1080 card maintains a 56FPS average, creating a large gap of 24.5% between the FE and 980 Ti devices. At 1080p, the GTX 1080 exceeds 125FPS in GTA V. The Fury X is absolved of its low capacity sins, as VRAM consumption sees a reduction at 1080p and eliminates the limitation.
Metro: Last Light Benchmark – GTX 1080 vs. 980 Ti, Fury X at 4K, 1440, & 1080
Metro: Last Light has grown long in the tooth, but remains the most reproducible benchmark we've ever worked with. Every test is executed with almost perfect accuracy to the previous run (though we still perform 3 passes for parity).
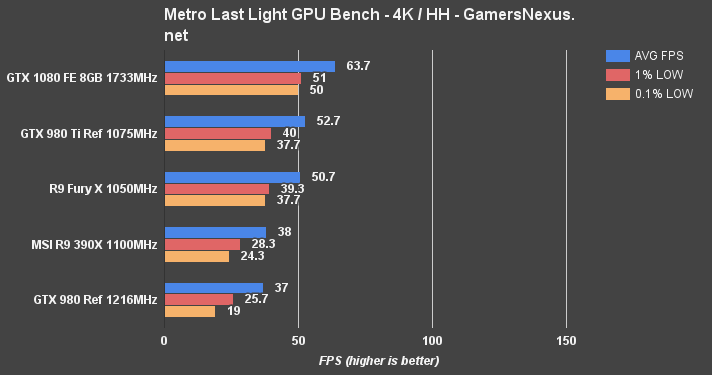
4K at high quality with high tessellation (“HH”) yields 63.7FPS for the GTX 1080, with exceedingly tight timings on the 1% and 0.1% lows, sitting at 50 and 51FPS, respectively. The GTX 980 Ti is next in line, at 52.7FPS AVG and 40/37.7FPS 1%/0.1% lows. The Fury X isn't far behind (-3.8% vs. 980 Ti, but -20.4% vs. GTX 1080). AMD's Fiji card does not suffer any issues with VRAM in Metro.
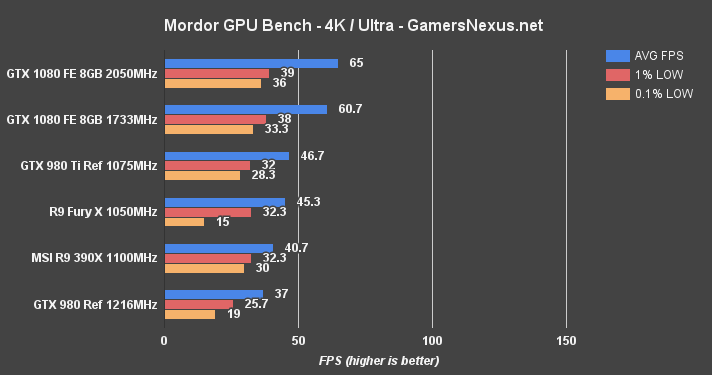
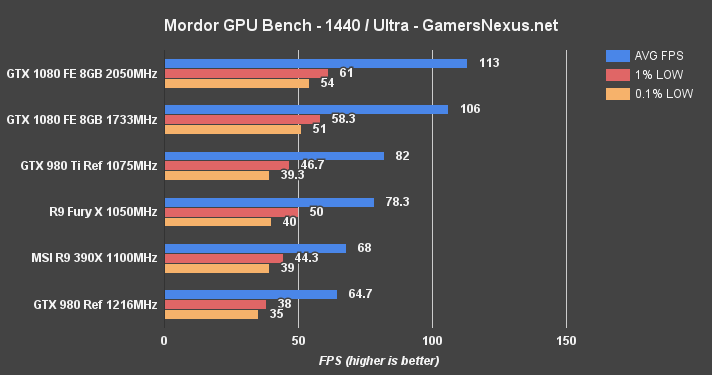
Shadow of Mordor Benchmark – GTX 1080 vs. 980 Ti, Fury X at 4K, 1440, & 1080
Shadow of Mordor is another VRAM-intensive game, and was one of the most VRAM-hungry titles ever shipped when it first launched.
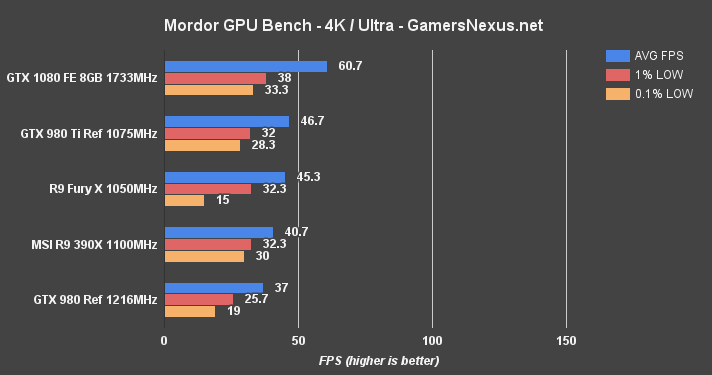
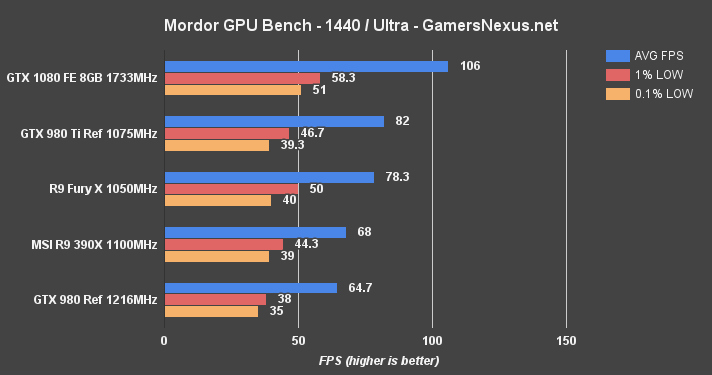
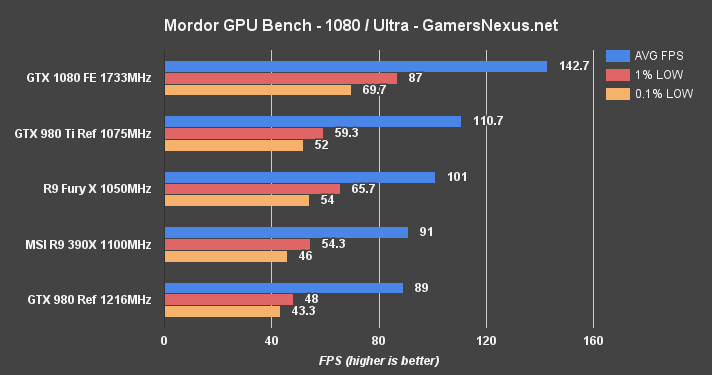
At 4K, the GTX 1080 is again the only card capable of producing 60FPS without graphics settings compromise. Its lead is a formidable 23.1% over the 980 Ti. 1440p allows for ~106FPS average and creates a gap of ~22.3% over the 980 Ti reference, or 38.9% over the GTX 980.
How to Overclock the GTX 1080, Pascal GP104, & GTX 1070
While at the nVidia GTX 1080 & 1070 unveil, we had the opportunity to interview nVidia Director of Technical Marketing Tom Petersen, who spoke to overclocking changes:
Simultaneous Multi-Projection (SMP) is also discussed in the above video.
GTX 1080 overclocking is revised heavily from previous generations. The GTX 1080 and GP104 move nVidia from GPU Boost 2.0 to GPU Boost 3.0. GPU Boost 3.0 and supporting applications from AIB partners will allow for frequency-voltage curve creation that fine-tunes voltages against various frequencies. Rather than functioning on a single slider for frequency, applications like Precision and Afterburner will now create a curve that fits your card's particular silicon.
Anyone who's overclocked knows that a high frequency may be sustainable in most games or for long stretches of time, but that some specific applications or use cases will crash the drivers resultant of the overclock. The obvious solution is to step-down the OC globally until something is stable across the board, but then we're losing OC room in the use cases that didn't originally trigger faults.
GPU Boost 3.0 supports scanners, which figure out the optimal frequency for each individual voltage point. If a particular voltage point is less stable, the frequency offset can be adjusted by the tool or by manual control. In EVGA Precision, a ScanOC tool finds the optimal setup and provides a baseline that allows enthusiasts to further tune their setup. Vendors can determine parameters for voltage-frequency curve determination by the OC scanner.
Three modes exist for the new GPU Boost 3.0 overclocking tools:
- Basic – A standard slider input.
- Linear – The line can be tilted to demand more power toward one end of the curve.
- Manual – Dial-in every voltage-frequency curve point, mostly what the scanner generates.
The GTX 1070 will take the same approach.
GTX 1080 Overclocking Results
We couldn't get the “ScanOC” tool to function for this review, and ended up giving up on it (for nonstop crashing) to go the old by-hand route. Here's our progression:
| Core Clock (MHz) | Core Offset (MHz) | Mem CLK (MHz) | Mem Offset (MHz) | Power Target (%) | 5m Test | 60m Burn-in |
| 1733 | 0 | 5005 | 0 | 100 | Pass | Pass |
| 1880 | 150 | 5305 | 300 | 120 | Pass | - |
| 1974 | 171 | 5305 | 300 | 120 | Pass | - |
| 1987 | 190 | 5305 | 300 | 120 | Pass | - |
| 2025 | 210 | 5305 | 300 | 120 | Pass | - |
| 2050 | 230 | 5305 | 300 | 120 | Fail Driver Crash | |
| ~2030 | 220 | 5400 | 400 | 120 | Pass | Pass |
GTX 1080 Overclocked FPS vs. Stock Founders Edition, 980 Ti
And here's the output:
Continue to the final page for the conclusion.
NVIDIA GeForce GTX 1080 Review Conclusion
The conclusion isn't too hard to make – but that's only because we've got mountains of data from dozens of spreadsheets. Outside of VR, which we'll eventually figure out how to benchmark, we've tested most of the pertinent aspects of the GTX 1080.
NVidia's GTX 1080 is the best-performing video card we've ever tested, replacing the GTX 980 Ti Sea Hawk as the Best of Bench winner. The GTX 1080's frametimes are tightly positioned (in most games) and ensure smooth framerate playback befitting of even high-refresh displays. As a resolution, 1080p is almost an insult to this card (unless you did want 144-200Hz playback in Black Ops 3, for instance); the GTX 1080 crushes 1440p tests without issue, and it's able to hit the 60FPS mark (or lands in striking range, with small tweaks) of 4K.
Generally, as shown heavily in charts on preceding pages, the GTX 1080 outperforms the stock GTX 980 Ti by between 13 and ~24%, depending on title and API. The Fury X trails by about 20-30% on average, with the GTX 980 (non-Ti) in the same ~30% trail. Some of the leads over the GTX 980 Ti could be attributed largely to the clock-rate increase, as the architecture doesn't make many changes in the way of Dx11 advancements (other than more raw power).

Asynchronous compute, however, sees major gains. Some of our titles reported a frametime performance improvement from Dx11 to Dx12 approaching 50%, where previous cards (like the GTX 980) struggled to reach even 5% improvement (Dx11->Dx12). AMD's Fury X and R9 390X deserve mention for their 120% and 79% low frametime improvements with asynchronous command queuing in Dx12, but that doesn't change the fact that the Fury X still pushes lower overall framerate than the GTX 1080. We're curious to see if AMD can leverage its architecture to propel future process-shrunken Polaris and Vega chips into a potential lead with Dx12 or Vulkan. That's still some ways out, though.
(The GTX 1080 is awarded with our "Best of Bench" award for topping all FPS benchmark charts.)
NVidia's move to 8GB VRAM is welcomed, as a few tests show just how much impact the extra VRAM has on 1% and 0.1% low frametimes.
Overclocking headroom is ample and allows for play. That said, the $700 price-point and thermal limitations for overclocking mean that we'd recommend waiting on AIB cards and buying something (hopefully) slightly cheaper and with a dual-push fan cooler.
The GeForce GTX 1080 Founders Edition is presently the highest-performing video card we have ever tested, with regard to framerates and frametimes. Thermals are reasonable for a reference – sorry, Founders Edition – card, landing around where the GTX 980 Ti reference cooler placed GM204. There's a lot of room for play with the GTX 1080, and that's going to be more exaggerated with the AIB versions. We look forward to the card's continued push into market.
If you liked this content, please consider supporting us on Patreon. Or just tweet at us – because that's always fun.
Editorial, Test Lead: Steve “Lelldorianx” Burke
Sr. Test Technician (FPS): Mike “Budekai?” Gaglione
Test Technician (Noise): Patrick “Mocalcium” Stone
Test Technician (FPS): Andie “Draguelian” Burke
Video Producer: Andrew “ColossalCake” Coleman
Video Producer: Keegan “HornetSting” Gallick