
The cheaper Ally has arrived, but the discount may not be worth the downgrade
The Highlights
- The RC71L-ALLY.Z1-512 uses AMD's new Z1 (non-Extreme) APU
- The new SKU drops 8 of the original's 12 RDNA3 CUs
- Limited by battery power, the non-Extreme still has a chance to compete
- Original MSRP: $600
- Release Date: September 17, 2023

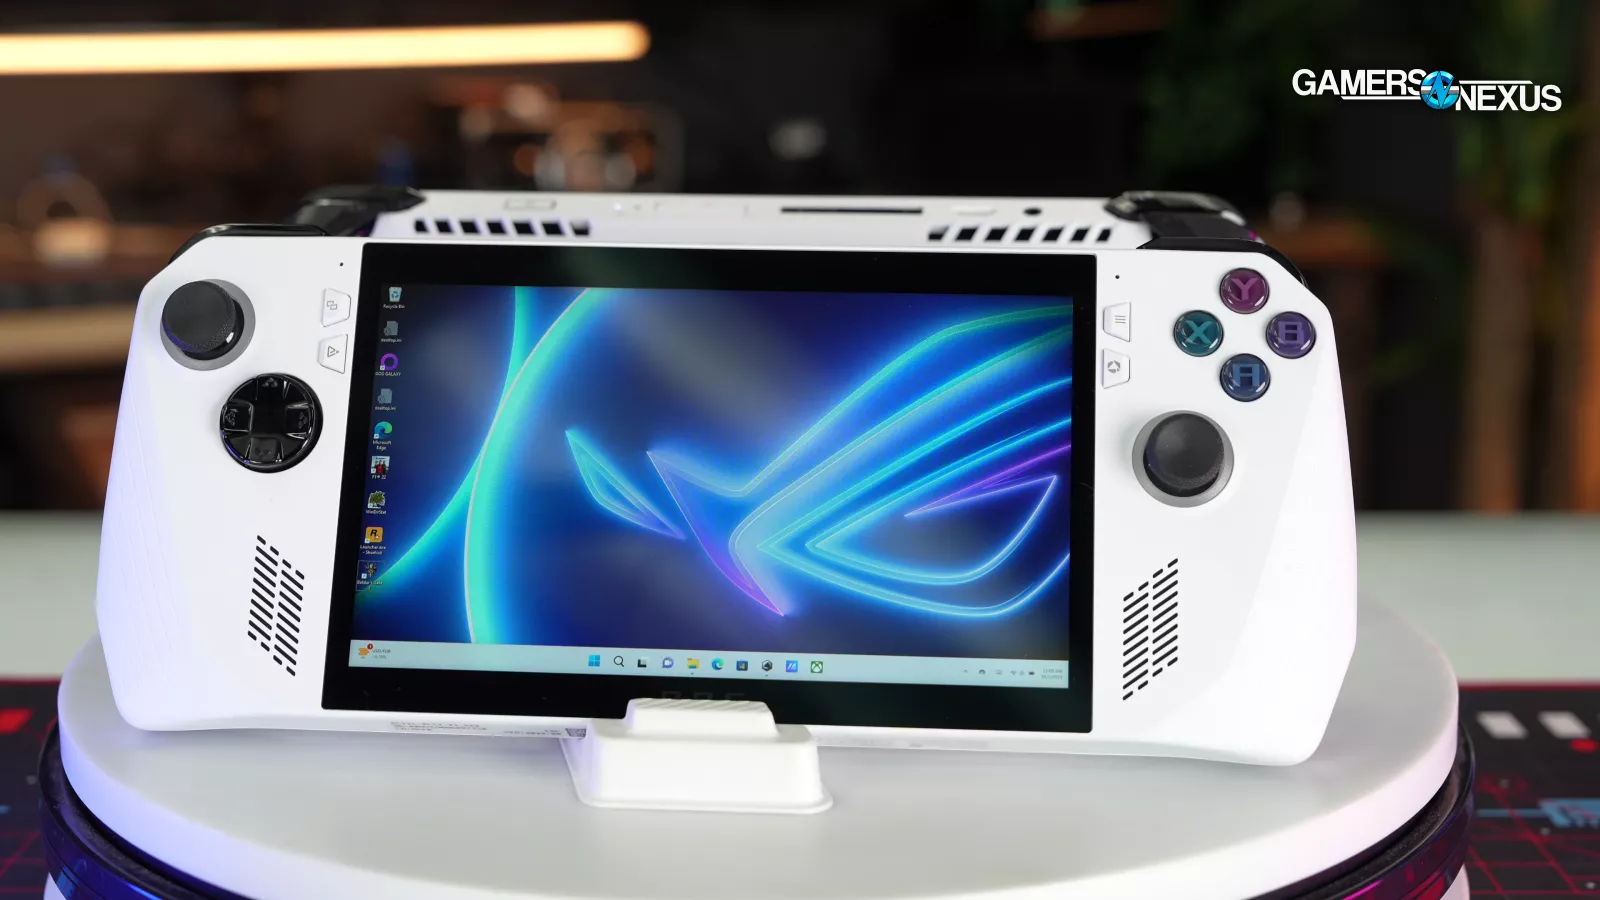
We recently bought and reviewed the ASUS ROG RC71L-Ally.Z1X_512, also known as the ROG Ally. It's a handheld from ASUS with a custom AMD 7840U-ish APU known as the Z1 Extreme. We also just bought the ASUS ROG RC71L-Ally.Z1_512, also known as the ROG Ally. Confusingly, these are very different devices. We're testing the lower-end one today: there's a $100 difference between the models, $700 for the Extreme versus $600 for the non-Extreme, and the question we seek to answer is whether or not the performance loss is worth it.
This review should be interesting even if you don't intend to buy one of these devices, because we can use the new "GPU busy" metric to determine how well balanced they are, and if AMD and ASUS have paired the right CPU and GPU.
Credits
Host, Writing
Steve Burke
Testing, Writing, Research, Web Editing
Patrick Lathan
Video Production
Vitalii Makhnovets
On paper, there's a large difference between non-Extreme and Extreme: there are fewer CPU cores and threads at 6C/12T versus 8C/16T, lower CPU boost clocks at 4.9GHz versus 5.1GHz, and most significantly fewer Radeon 3 CUs at 4 versus 12. The lower-end Z1 runs 4 CUs at only 2.5GHz advertised clock speed instead of 2.7.
ROG Ally Z1 versus ROG Ally Z1 Extreme Specs
| ROG Ally (2023) RC71L-ALLY.Z1_512 | ROG Ally (2023) RC71L-ALLY.Z1X_512 | |
| Operating System | Windows 11 Home | Windows 11 Home |
| Processor | CPU: AMD Ryzen™ Z1 Processor ("Zen4" architecture with 4nm process, 6-core /12-threads, 22MB total cache, up to 4.90 Ghz boost) GPU: AMD Radeon™ Graphics (AMD RDNA™ 3, 4 CUs, up to 2.5 GHz, up to 2.8 Teraflops) TDP: 9-30W | CPU: AMD Ryzen™ Z1 Extreme Processor ("Zen4" architecture with 4nm process, 8-core /16-threads, 24MB total cache, up to 5.10 Ghz boost) GPU: AMD Radeon™ Graphics (AMD RDNA™ 3, 12 CUs, up to 2.7 GHz, up to 8.6 Teraflops) TDP: 9-30W |
| Display | 7-inch FHD (1920 x 1080) 16:9 IPS-level glossy display sRGB: 100% Adobe: 75.35% Gorilla® Glass DXC Gorilla® Glass Victus™ Touch Screen (10-point multi-touch) Refresh Rate: 120Hz Response Time: 7ms Brightness: 500nits FreeSync Premium | 7-inch FHD (1920 x 1080) 16:9 IPS-level glossy display sRGB: 100% Adobe: 75.35% Gorilla® Glass DXC Gorilla® Glass Victus™ Touch Screen (10-point multi-touch) Refresh Rate: 120Hz Response Time: 7ms Brightness: 500nits FreeSync Premium |
| Memory | 16GB LPDDR5 on board (6400MT/s dual channel) | 16GB LPDDR5 on board (6400MT/s dual channel) |
| Storage | 512GB PCIe® 4.0 NVMe™ M.2 SSD (2230) | 512GB PCIe® 4.0 NVMe™ M.2 SSD (2230) |
| I/O Ports | 1x 3.5mm Combo Audio Jack 1x ROG XG Mobile Interface and USB Type-C combo port (with USB 3.2 Gen2, support DisplayPort™ 1.4) 1x UHS-II microSD card reader (supports SD, SDXC and SDHC) | 1x 3.5mm Combo Audio Jack 1x ROG XG Mobile Interface and USB Type-C combo port (with USB 3.2 Gen2, support DisplayPort™ 1.4) 1x UHS-II microSD card reader (supports SD, SDXC and SDHC) |
| Control and Input | A B X Y buttons D-pad L & R Hall Effect analog triggers L & R bumpers View button Menu button Command Center button Armoury Crate button 2 x assignable grip buttons Thumbsticks: 2 x full-size analog sticks Haptics: HD haptics Gyro: 6-Axis IMU | A B X Y buttons D-pad L & R Hall Effect analog triggers L & R bumpers View button Menu button Command Center button Armoury Crate button 2 x assignable grip buttons Thumbsticks: 2 x full-size analog sticks Haptics: HD haptics Gyro: 6-Axis IMU |
| Audio | AI noise-canceling technology Hi-Res certification Dolby Atmos Built-in array microphone 2-speaker system with Smart Amplifier Technology | AI noise-canceling technology Hi-Res certification Dolby Atmos Built-in array microphone 2-speaker system with Smart Amplifier Technology |
| Network and Communication | Wi-Fi 6E(802.11ax) (Triple band) 2*2 + Bluetooth® 5.2 (*Bluetooth® version may change with OS version different.) | Wi-Fi 6E(802.11ax) (Triple band) 2*2 + Bluetooth® 5.2 (*Bluetooth® version may change with OS version different.) |
| Battery | 40WHrs, 4S1P, 4-cell Li-ion | 40WHrs, 4S1P, 4-cell Li-ion |
| Power Supply | TYPE-C, 65W AC Adapter, Output: 20V DC, 3.25A, 65W, Input: 100~240V AC 50/60Hz universal | TYPE-C, 65W AC Adapter, Output: 20V DC, 3.25A, 65W, Input: 100~240V AC 50/60Hz universal |
| AURA SYNC | Yes | Yes |
| Weight | 608 g | 608 g |
| Dimensions (W x D x H) | 28.0 x 11.1 x 2.12 ~ 3.24 cm (11.02" x 4.37" x 0.83" ~ 1.28") | 28.0 x 11.1 x 2.12 ~ 3.24 cm (11.02" x 4.37" x 0.83" ~ 1.28") |
Game Tests
We're going to skip all the mechanical features shared with the Ally Z1 Extreme, which we already reviewed, and focus on head-to-head gaming performance on the two Ally SKUs. The testing here is not directly comparable to the testing we did for the Z1 Extreme review because of game updates, BIOS updates, and changes to game settings.
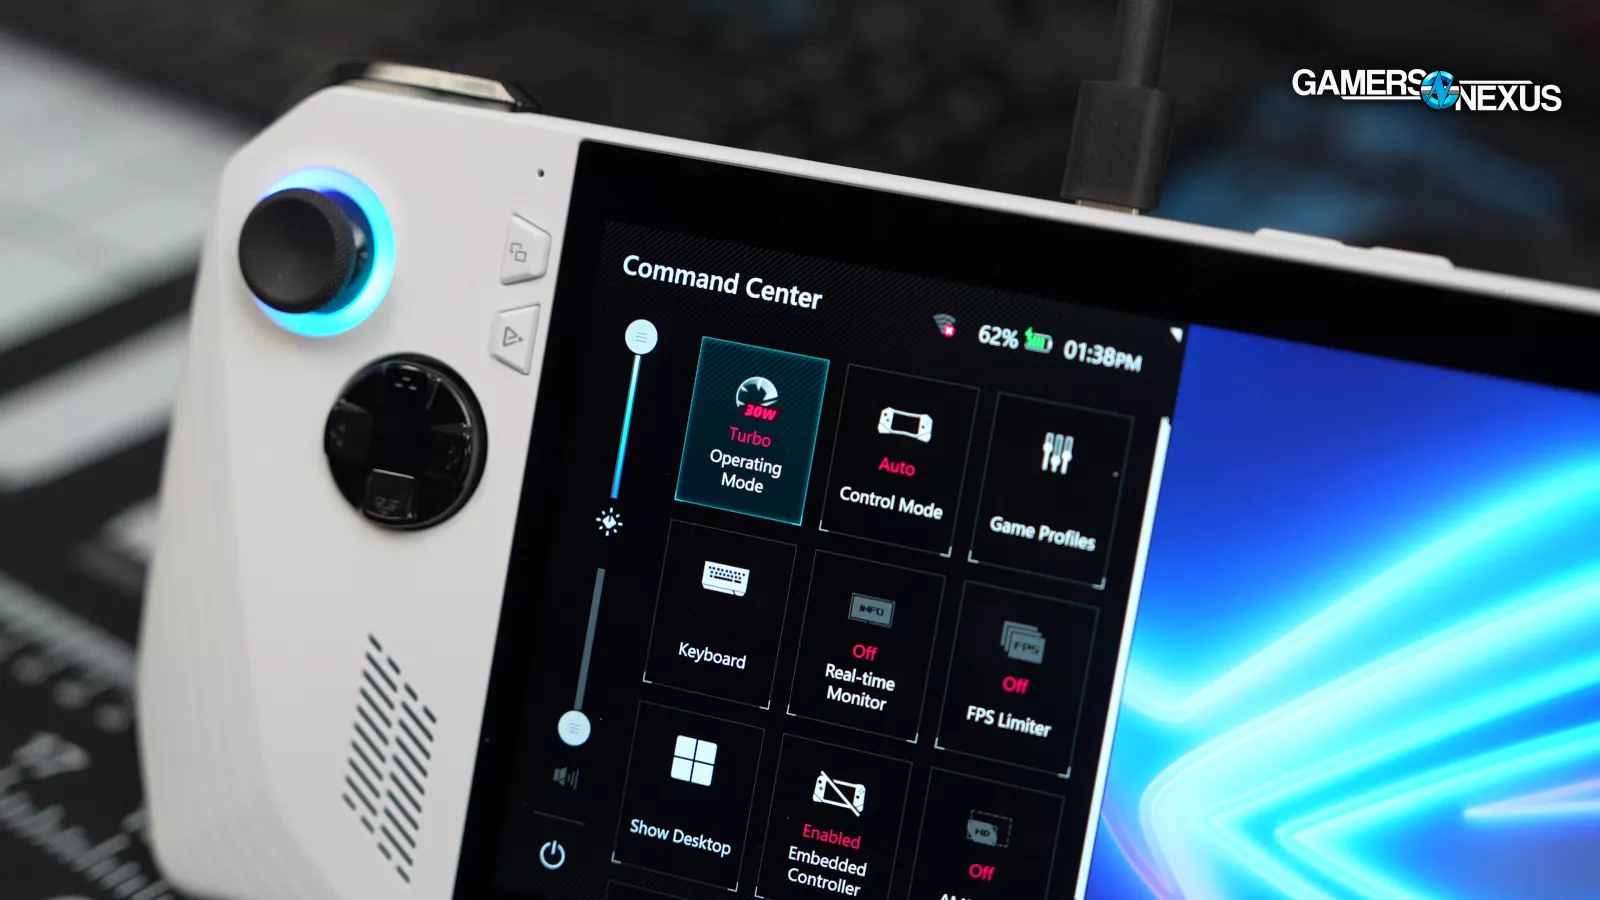
The Z1's potential advantage here is that both systems share the same power profiles, or at least the same TDP labels on those power profiles, so the hardware specs may not come into play. To recap, there's Silent/10W, Performance/15W, and Turbo/25W or 30W. By default, Performance mode is applied on battery power, and Turbo 30W is applied when connected to a 65W charger, so these are the modes we'll use for comparison. The wattages used to label these power profiles don't equal real-world power draw, and we wouldn't compare them between devices if the devices in question weren't two SKUs of the same model.
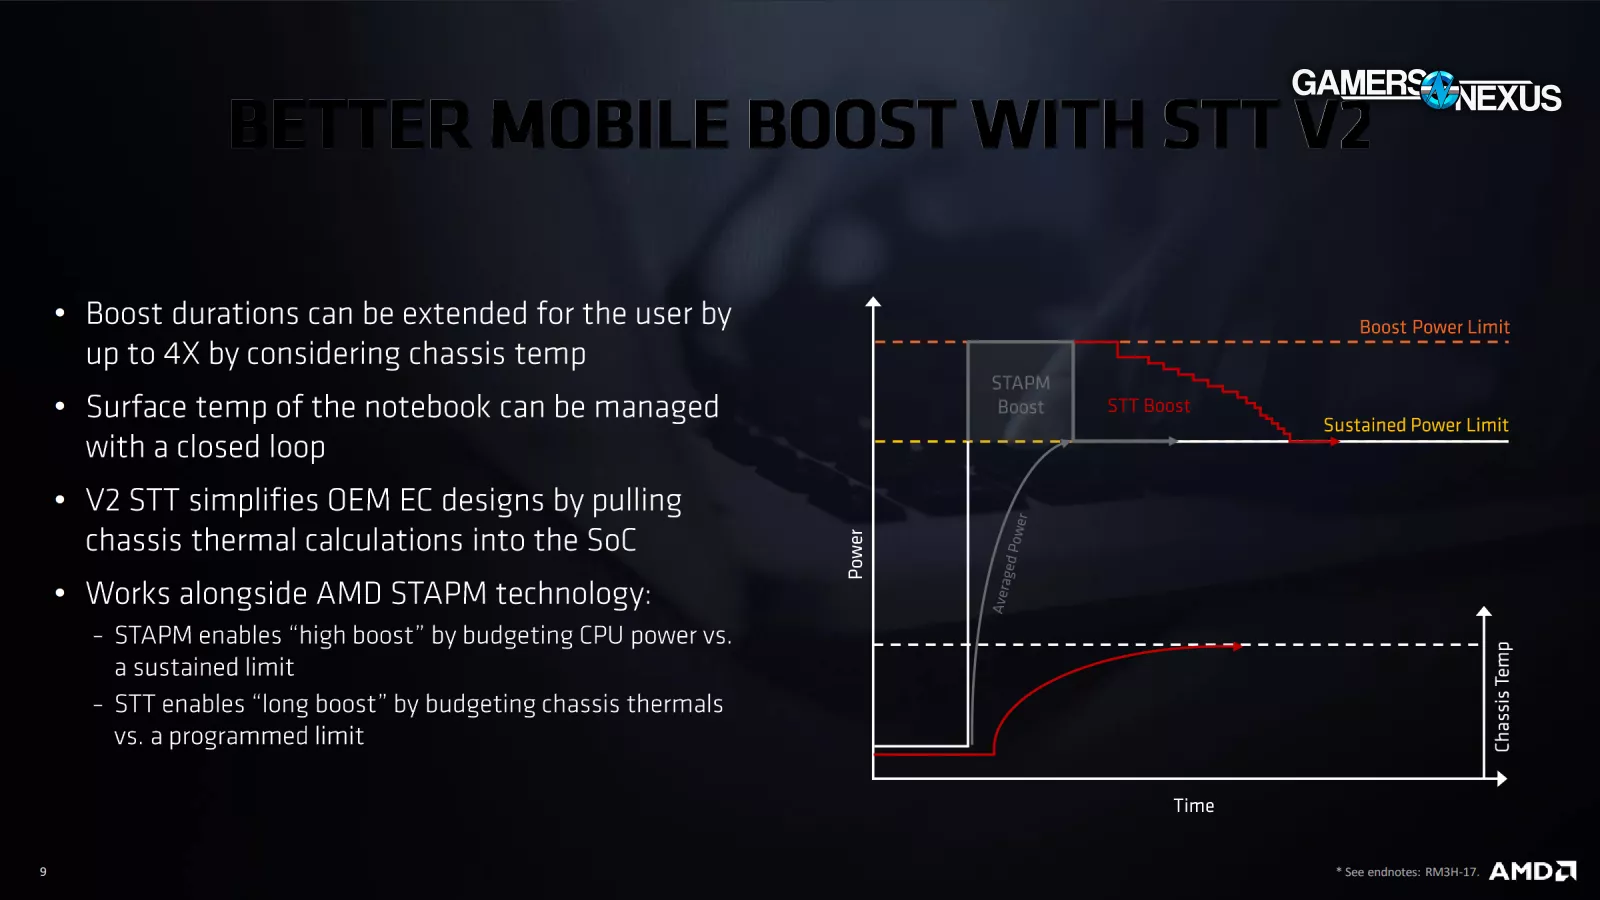
STAPM (Skin Temperature Aware Power Management) is a limiting factor that affects clock boosting. We'll discuss this more as we continue, but it affects some games, so we logged results at steady state as well. After a couple of minutes of use, depending on the workload, the STAPM limit may kick in and stop boosting. Because gaming is mostly done for periods longer than that, we did the majority of our testing at steady state, after those limits applied. We also have some tests that include passes done before the limit kicks in, and the charts are marked accordingly.
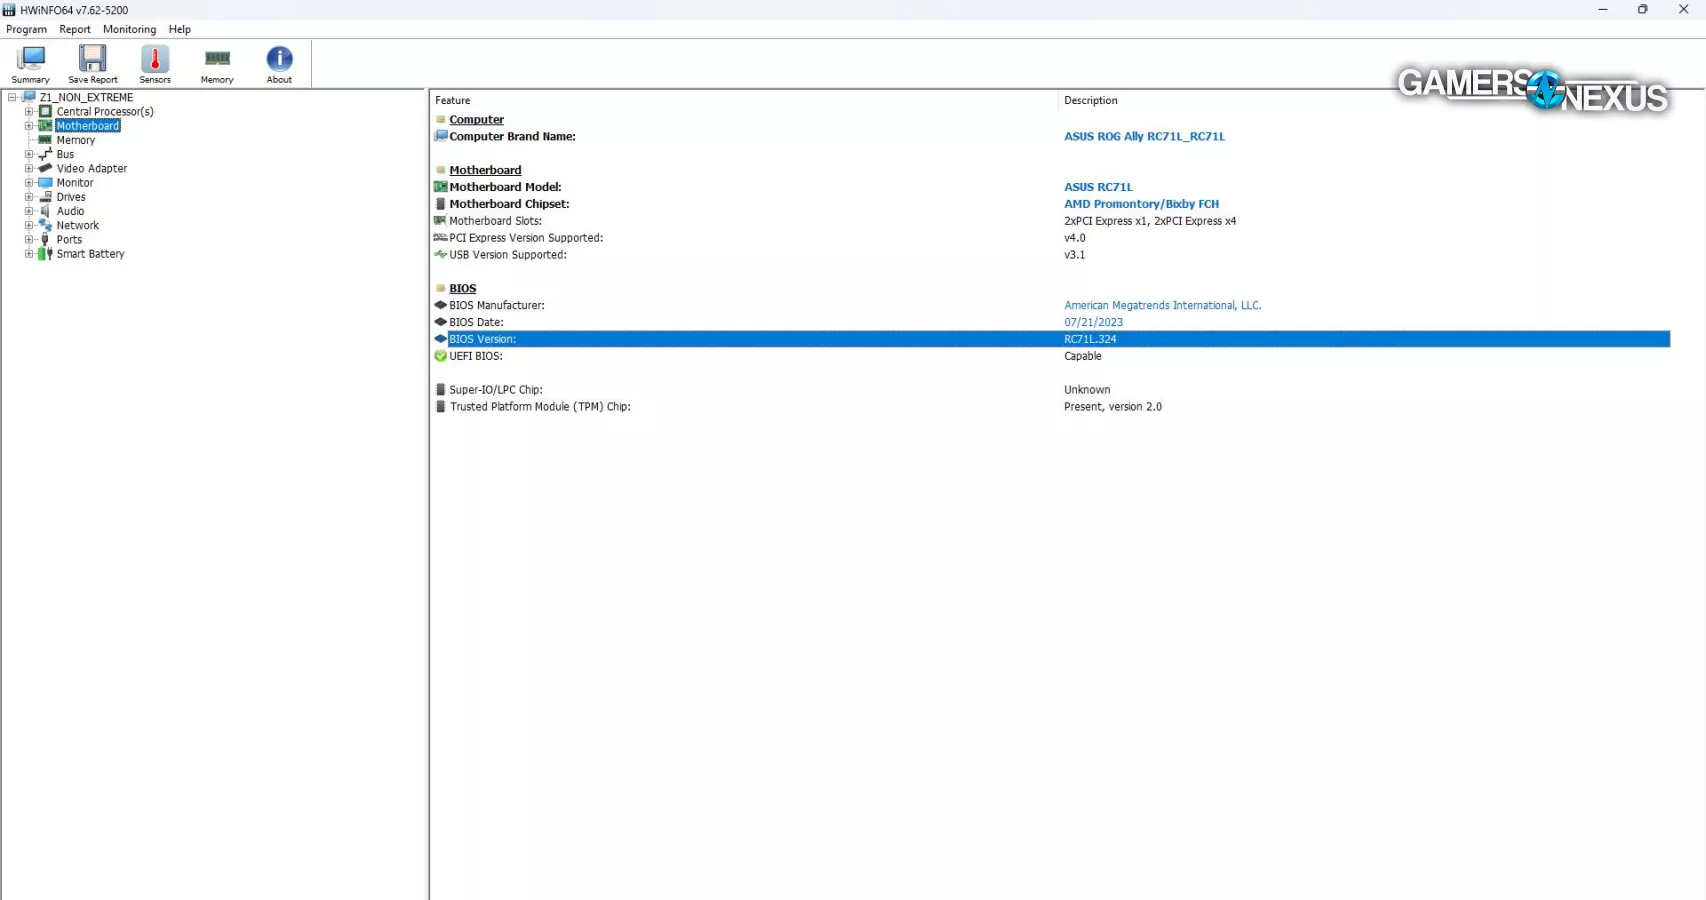
Both systems used the latest BIOS and updates that had shipped as of September 26th, applied through Armoury Crate, MyASUS, and Windows Update, including the latest public BIOS version 323. The non-Extreme reported that BIOS was updated to 323 through both Windows Update and MyASUS, but HWiNFO reports BIOS version 324, which isn't a version available through the ASUS site or mentioned anywhere at time of writing.
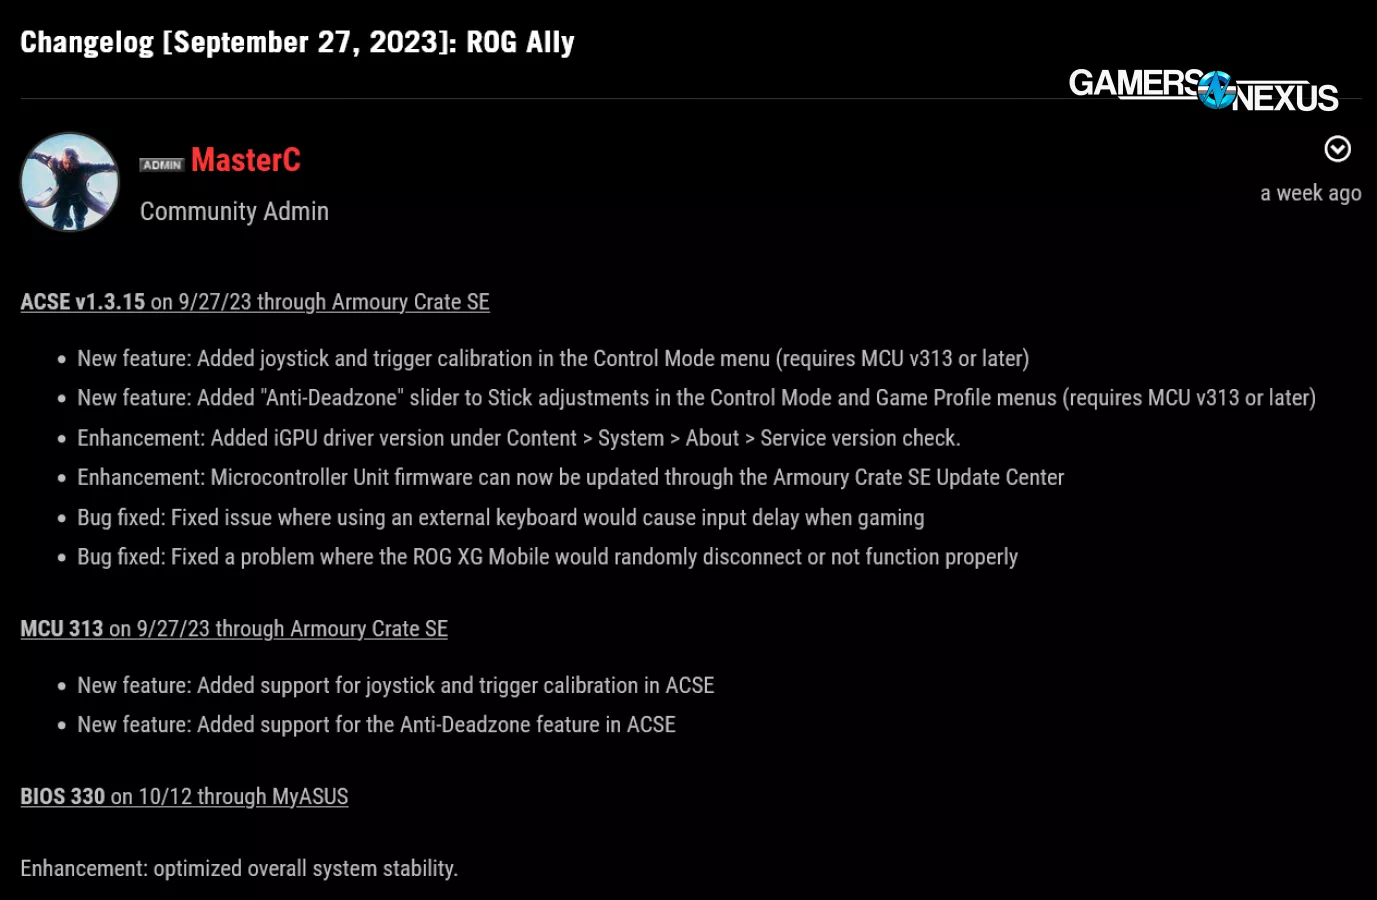
The next BIOS version is 330. Separately from this, our understanding is that ASUS is currently working on some tuning to address the frame pacing issues that we saw in our first review.
The FPS numbers we're going to discuss here are lower than we'd see in a CPU or GPU review, so pay close attention to the percentages–at this performance level, changes that appear small in terms of FPS can be large in terms of percent difference.

F1 22
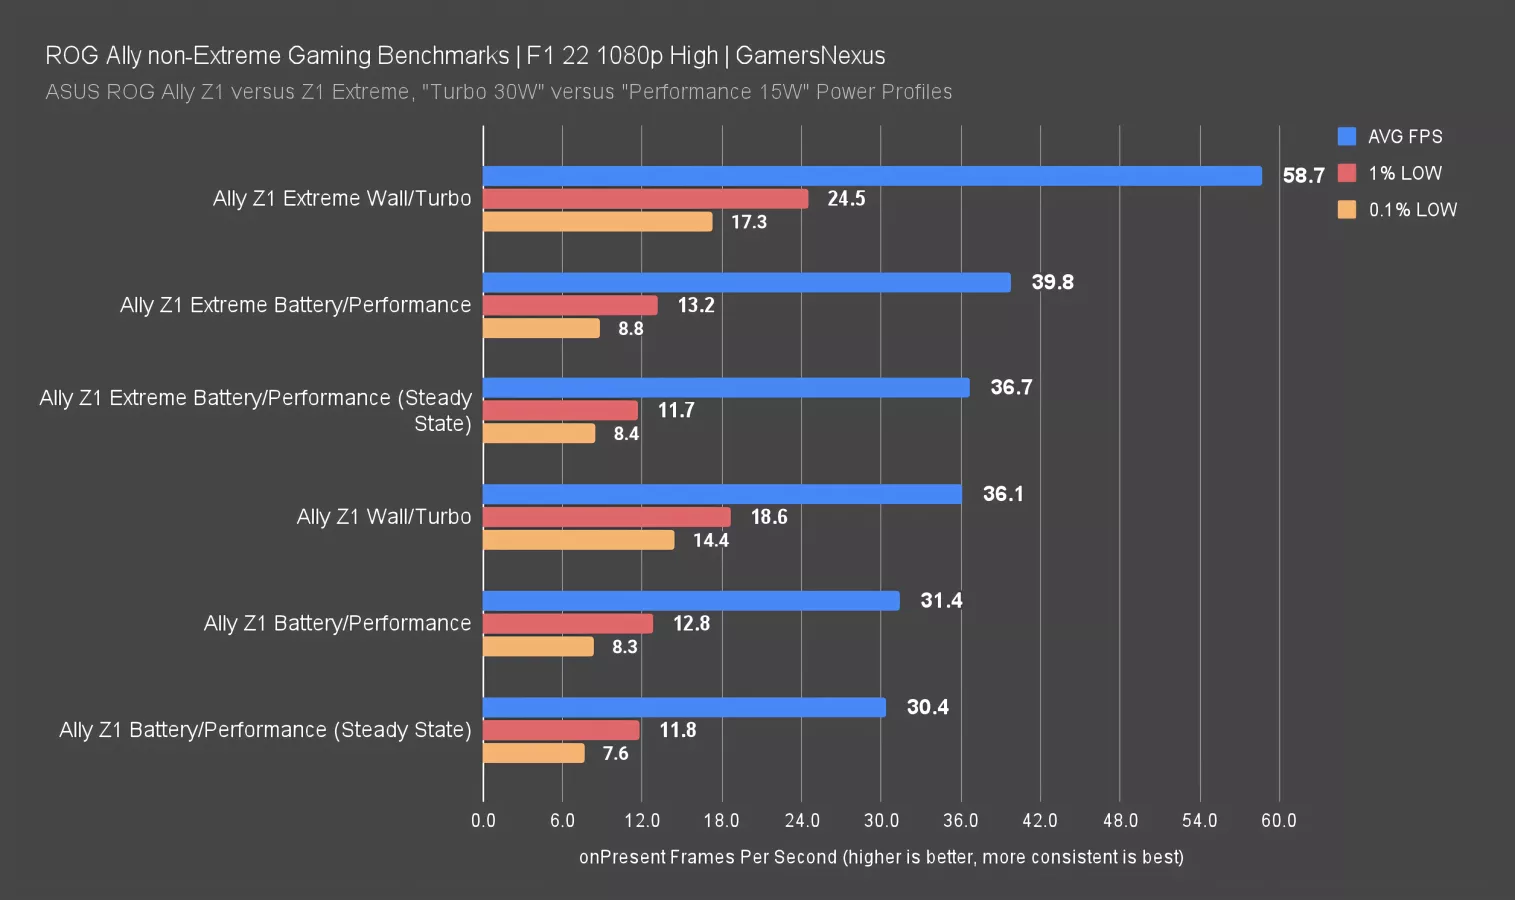
Starting with F1 22 using the High preset, the Z1 non-Extreme on battery averaged 31FPS with disappointingly bad 0.1% lows. Maybe AMD’s rumored Z1 updates will help resolve this, but the latest BIOS didn’t fix anything. That Non-Extreme average increased to 36FPS with wall power, a 15% uplift. Looking purely at averages, the Z1 Extreme has a 27% advantage on battery and a 63% advantage on wall power, but we also confirmed across multiple runs that the Z1 Extreme's performance drops after the first one or two passes on battery power due to hitting STAPM limits. Still, even isolating our comparison to the steady-state FPS passes on battery power gives the Extreme a 21% advantage. Lows were better on both handhelds when connected to wall power, but still bad as compared to desktop proportional scaling.
On the Z1 Extreme, averaging all of our test passes results in 39.8FPS AVG, about 8.4% higher than the 36.7FPS number we get by averaging only the later limited passes. The Z1 only moved from 31.4 to 30.4, or about a 3% uplift when including the pre-limit results in the average.


Battery Life
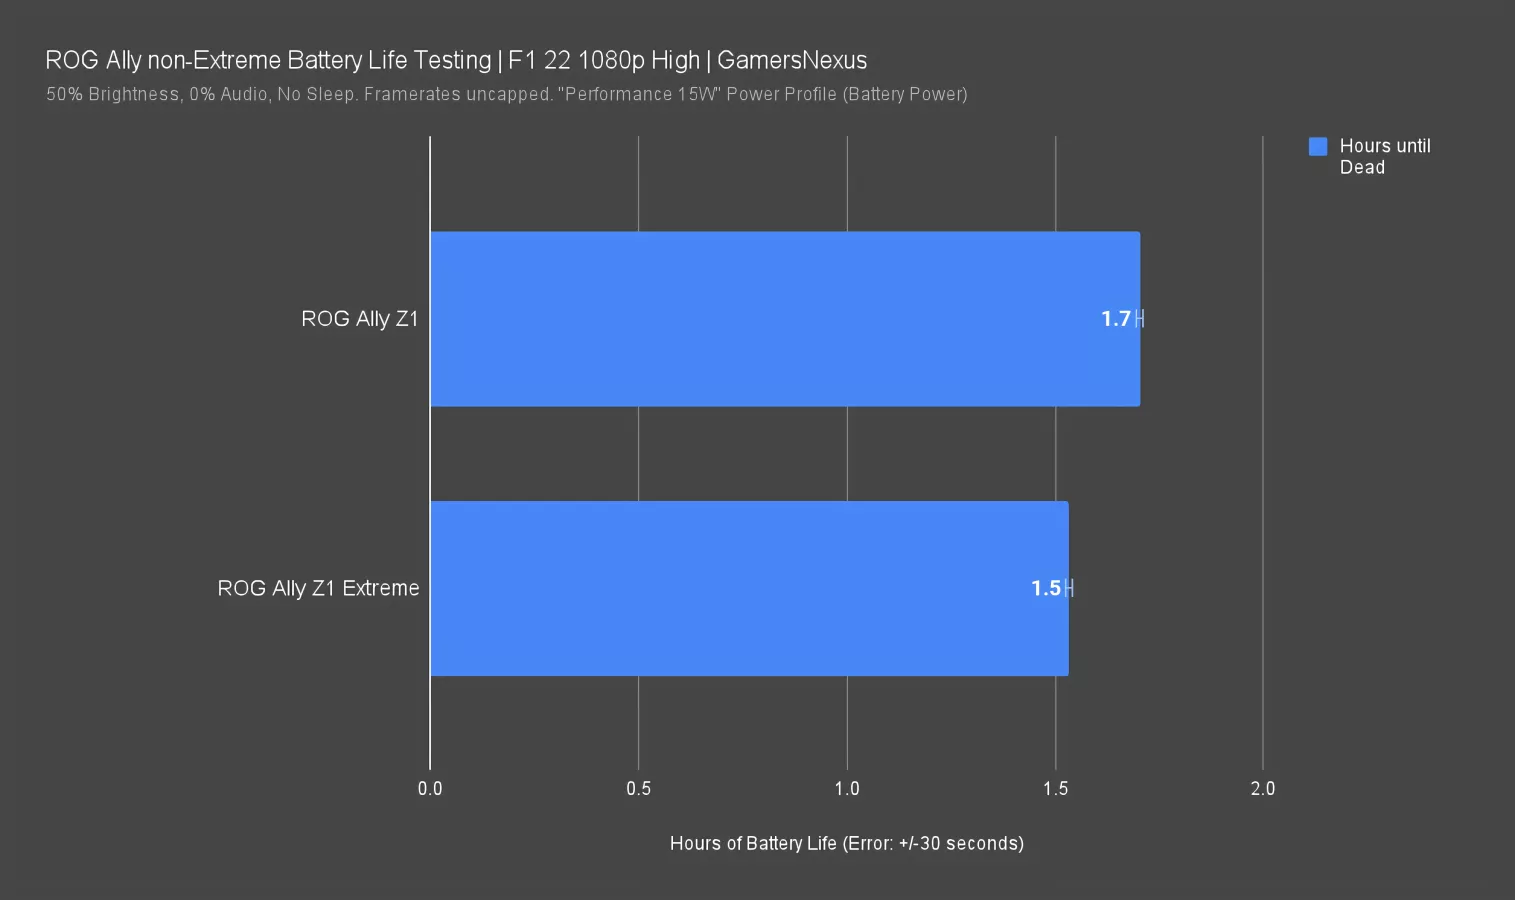
While testing F1, we took the opportunity to do a quick battery life comparison between the Z1 and Z1 Extreme. We looped the in-game benchmark with the same settings we used for the performance test. We're not worried about maximizing battery life here, we're just comparing the two systems. Both systems used the default Performance power profile labeled 15W, and both systems have identical listed battery capacities.
Under these conditions the Z1 Extreme lasted 92 minutes and the Z1 lasted 102, an 11% extension in battery life under load for the less powerful processor.
Red Dead Redemption 2 (Vulkan)
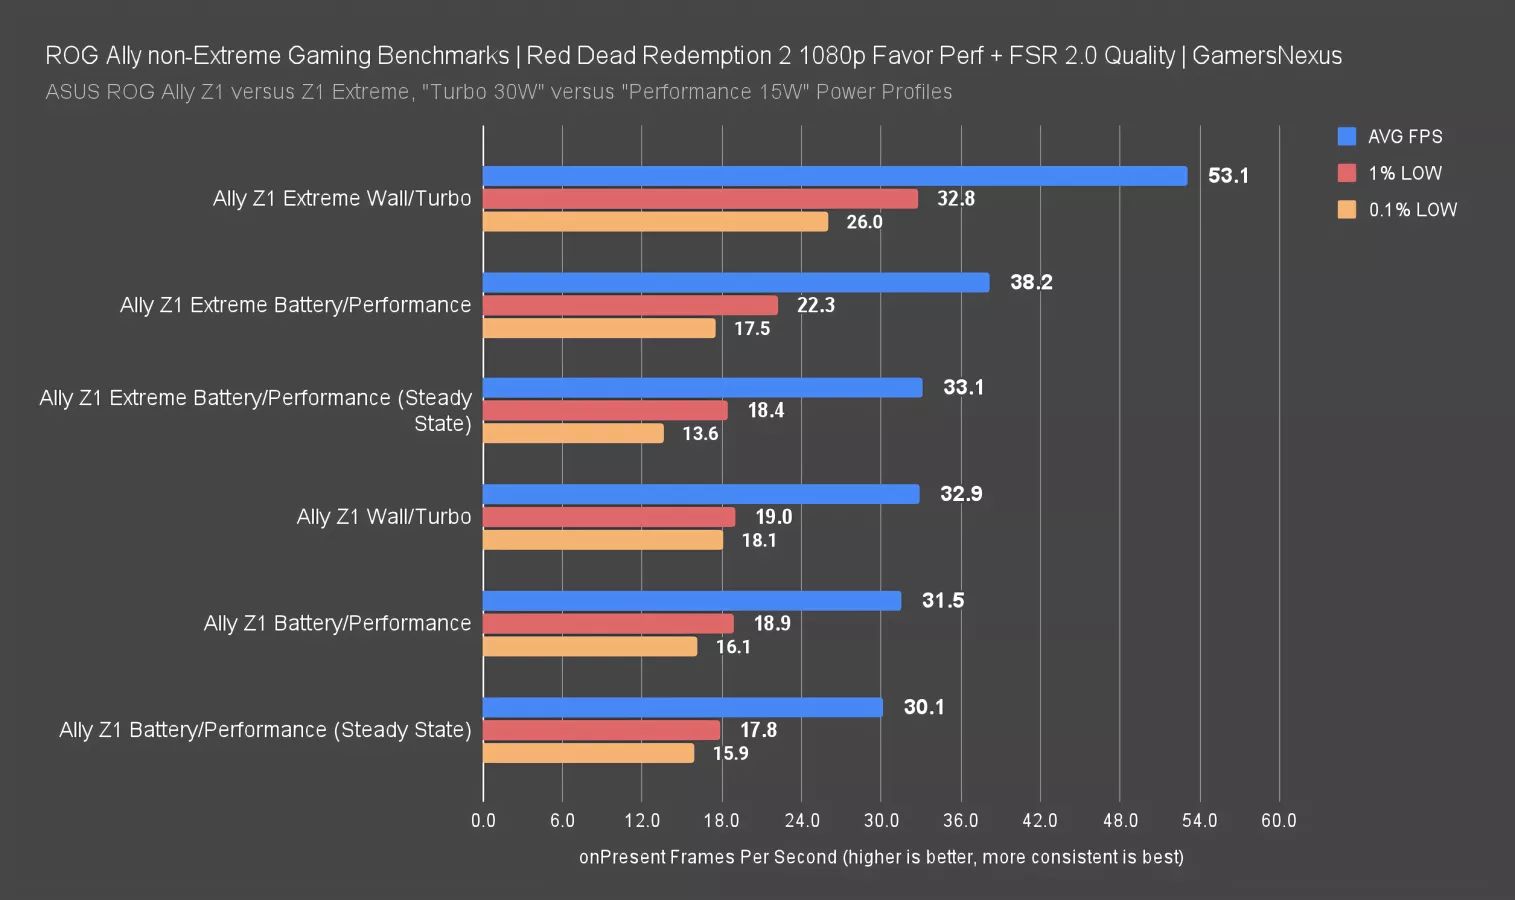
Red Dead Redemption 2's presets take the form of a slider: we maxed-out the lowest Favor Performance tier and applied FSR 2.0 Quality–that's a source resolution of 720p upscaled to the 1080p native resolution of the Ally's display. The regular Z1 averaged 32FPS on battery power, but showed little improvement on wall power, giving the Extreme’s 38.2 FPS AVG a 21% advantage on battery and 61% on wall power, where it ran at 53FPS AVG; however, this is the second of two titles we tested (along with F1 22) where we saw significant performance degradation on the Extreme after sustained testing. At steady state, the Extreme's advantage drops to only 10% over the non-Extreme, at 33.1FPS AVG from 38.2FPS AVG.
Including the pre-limit results may only change the average by 5FPS, but that's a 15% uplift over the more realistic average of just steady-state STAPM-limited passes.
Cyberpunk 2077: Phantom Liberty
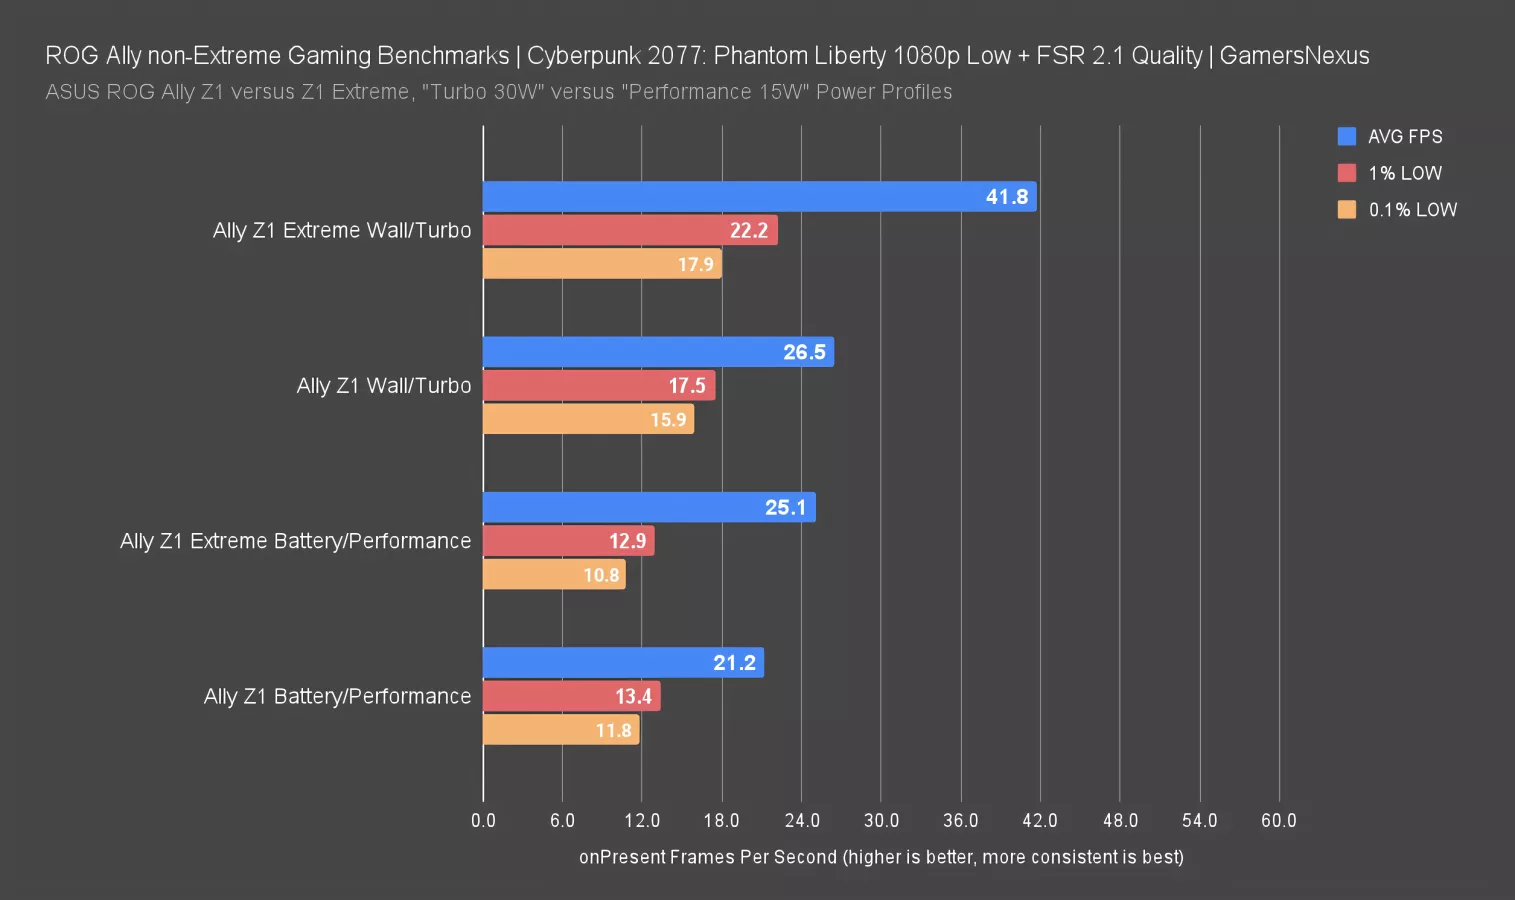
Our Phantom Liberty benchmark measures performance on a busy street in Dogtown. We used the Low non-ray-tracing preset with FSR 2.1 enabled and manually set to Quality: again, with the 1080p native resolution of the Ally, Quality FSR means a 720p source resolution. There is a Steam Deck preset available for Cyberpunk as well, but it raises several settings above the Low preset and pushes FSR to auto.
With our settings, the Z1 averaged 21FPS on battery power, which climbed 25% to 27FPS on wall power. Again, the Extreme is ahead in both scenarios, by 18% on battery and 58% on wall power.
This testing was done at STAPM steady state, meaning we were already at the STAPM limit for the most realistic use case: A user would not play a game for only a few minutes, so the tests reflect the more likely longer-term use.
Skin Temperature Aware Power Management
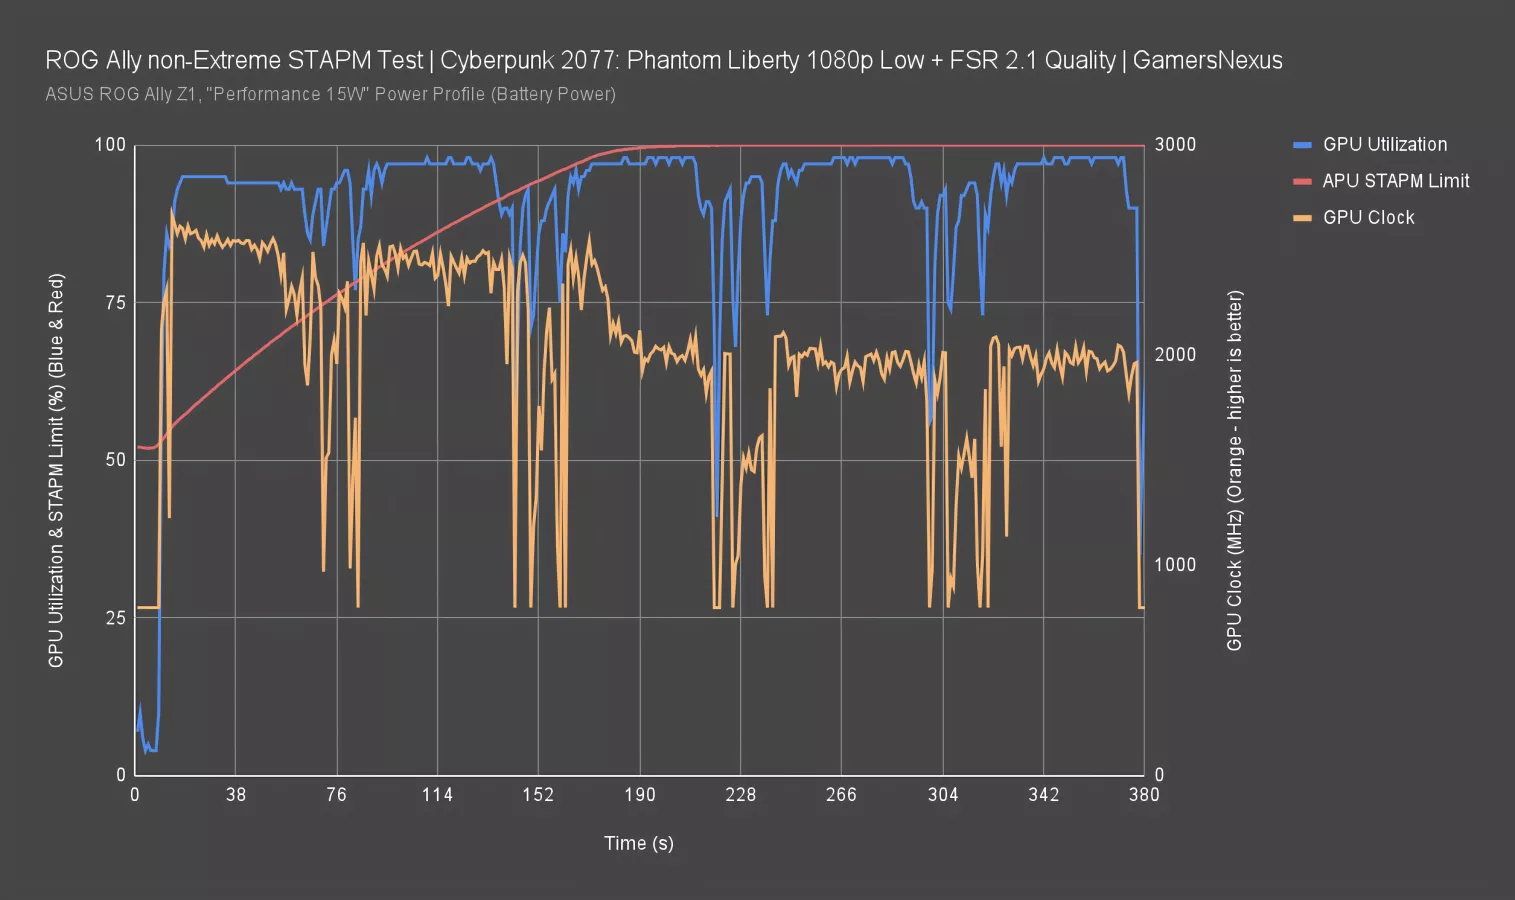
Here’s a look at the STAPM limit in Cyberpunk.
There was no significant performance degradation over the course of Cyberpunk testing for either device in our logged test passes, but it is possible to create that situation. This chart shows a cold launch of Cyberpunk 2077 followed by four passes of our Phantom Liberty benchmark done as quickly as possible (indicated by the latter four bumps in GPU utilization). The STAPM limit isn't fully reached until partway through the second run. Clocks boost up above 2.5GHz on the GPU initially, then drop abruptly when the limit is hit approximately three minutes after launching the game. The FPS logs of these particular test passes (not the ones used for the bar chart) reflect that performance loss. We're plotting against GPU frequency, since that's the most obvious loss, but CPU speed is reduced as well.
For the benchmarks shown here other than F1 and Red Dead, all results represent steady state performance.
Baldur's Gate 3 DX11
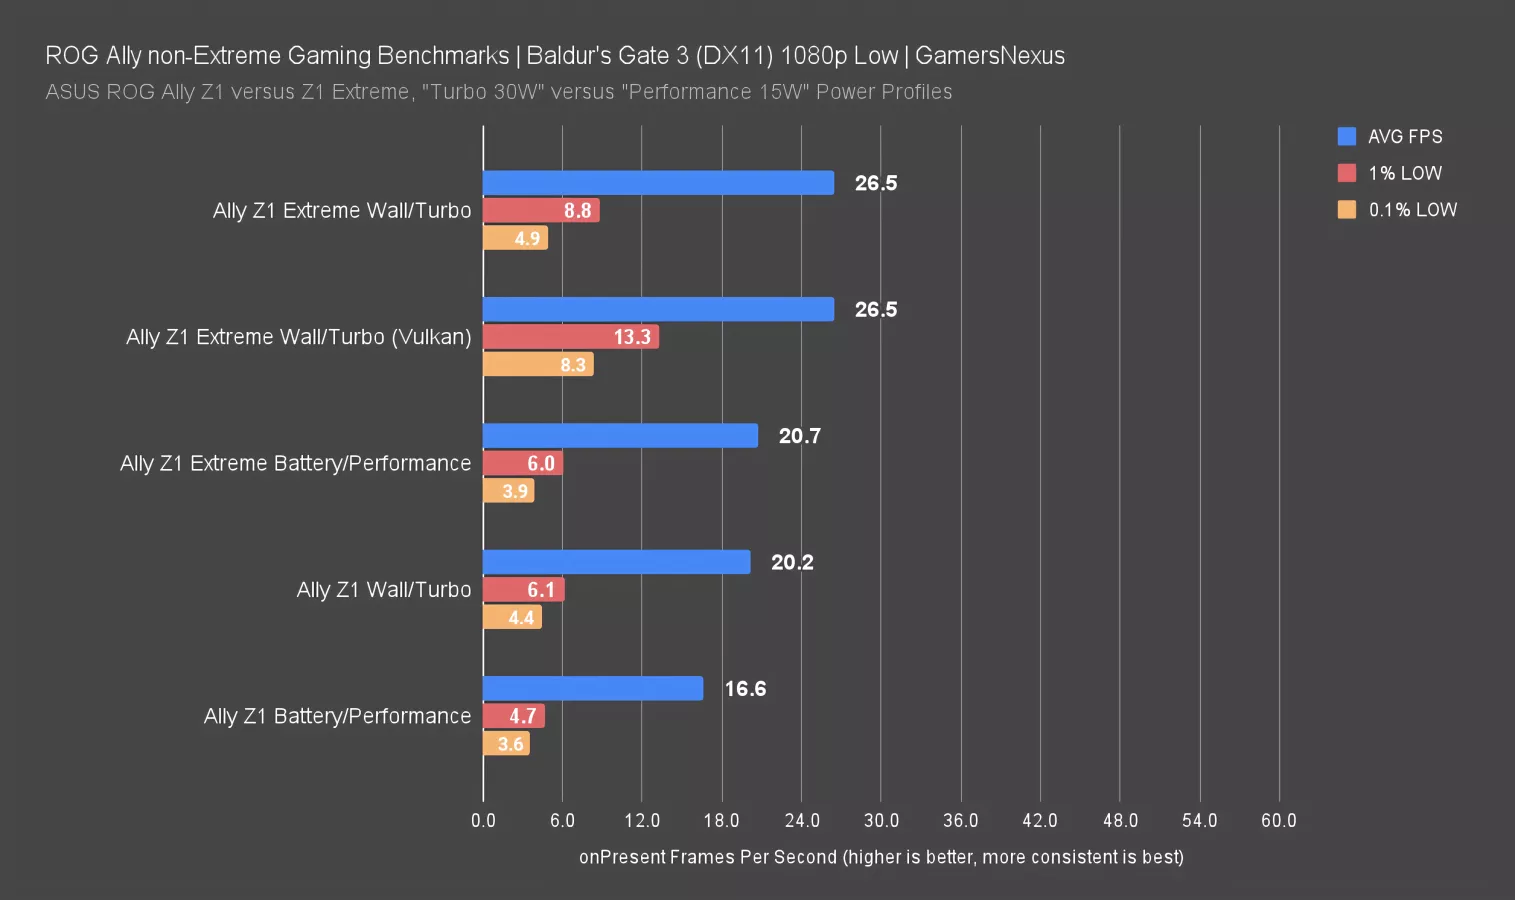
We had high hopes for Baldur's Gate 3 on the Ally given how well it performed on 7-year-old GPUs like the GTX 1060. Unfortunately, even at 1080p and using the Low preset, we saw extreme hitching in our test area. The Z1 Extreme has its usual advantage over the non-Extreme here, but the frametime spikes are terrible across the board. Switching to Vulkan on the Extreme didn't change average performance, but it appeared to mildly reduce hitching on some individual passes. We know that Baldur's Gate 3 can be made to be playable on these handheld devices, and we'll look at it separately for future handheld reviews.
We've heard that AMD updates should improve this behavior, but we don’t know when they’ll arrive. If they’re promising enough, we may revisit this in a standalone piece.
Baldur's Gate 3 Vulkan
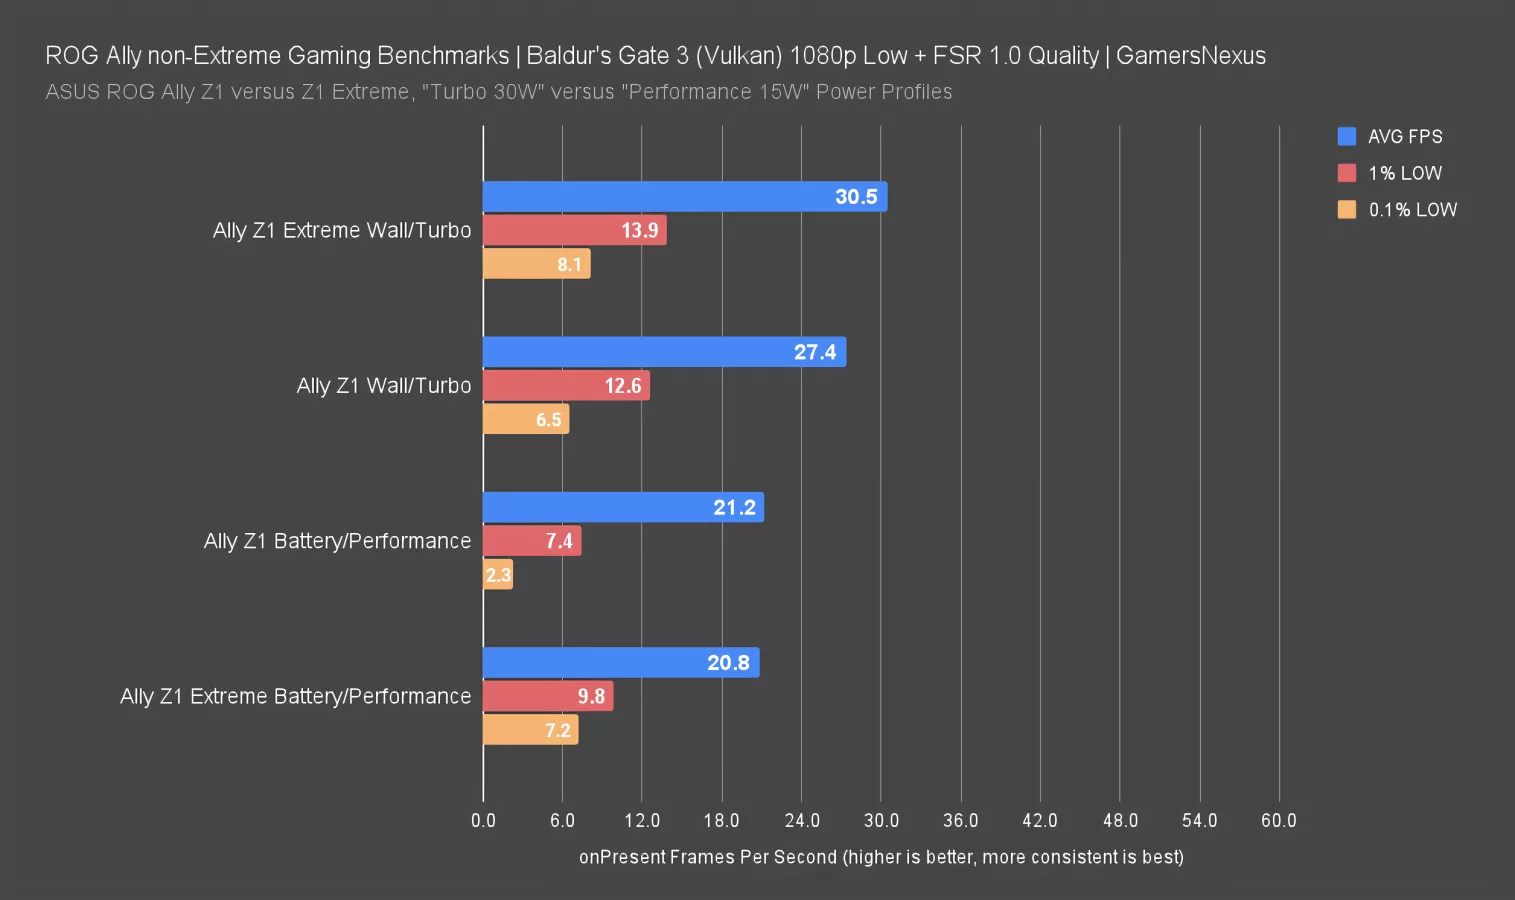
With that in mind, we reran our Baldur's Gate tests at the same Low preset, but with Vulkan and FSR 1.0 Quality enabled (Baldur's Gate 3 lacks FSR 2). The Extreme's heavily power-limited performance on battery didn't change at all versus the 1080p DX11 test other than a slight improvement in 0.1% lows. The Z1 did improve, though, and this is the one instance where we saw it tie the Extreme. The lows are worse on the non-Extreme, but only on average: both had some individually bad passes. The gap was also smaller than usual on wall power, with the Extreme only 11% ahead.
Frametimes & GPU Busy
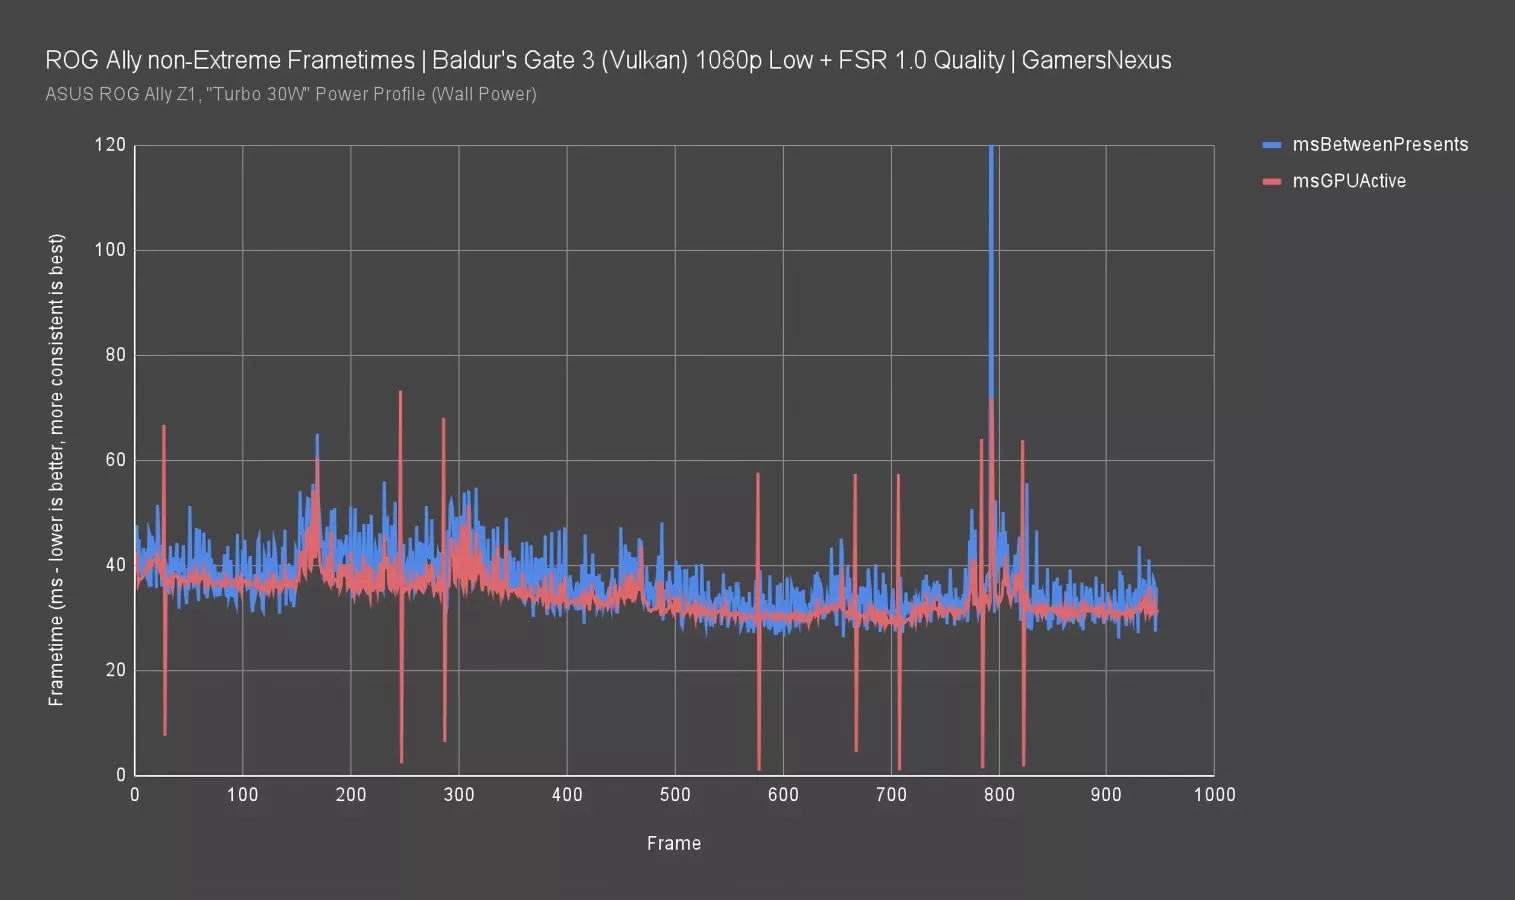
Let's look at some frametime data and our newly introduced "GPU Busy" metric. We've explained the metric a few times now, but our most detailed look was in an interview with Tom Petersen; you can check that out on the channel if you're not familiar with it.
Starting with the Z1 non-Extreme, we can see in this particular test pass there was one exceptionally bad frame beyond the scale of this chart that hit 322ms. That's the one that blew out the average. In Counter-Strike 2, 322ms with any measure of repeatability would be game-ruining. That’s a third of a second that you’re staring at an old frame. In Baldur’s Gate 3, it’s annoying, but it won’t cause you to miss a shot between doors on mid. GPU active time spiked in tandem, but only to 72ms (or 22% of the total frametime), indicating a bind elsewhere. This is in contrast to several other spikes where the GPU is active for the majority of the frametime, indicating a direct GPU bind. The worst of the frametimes seem to be related to something other than the GPU–the CPU, or memory, or cache–while on average the GPU is fully leveraged.
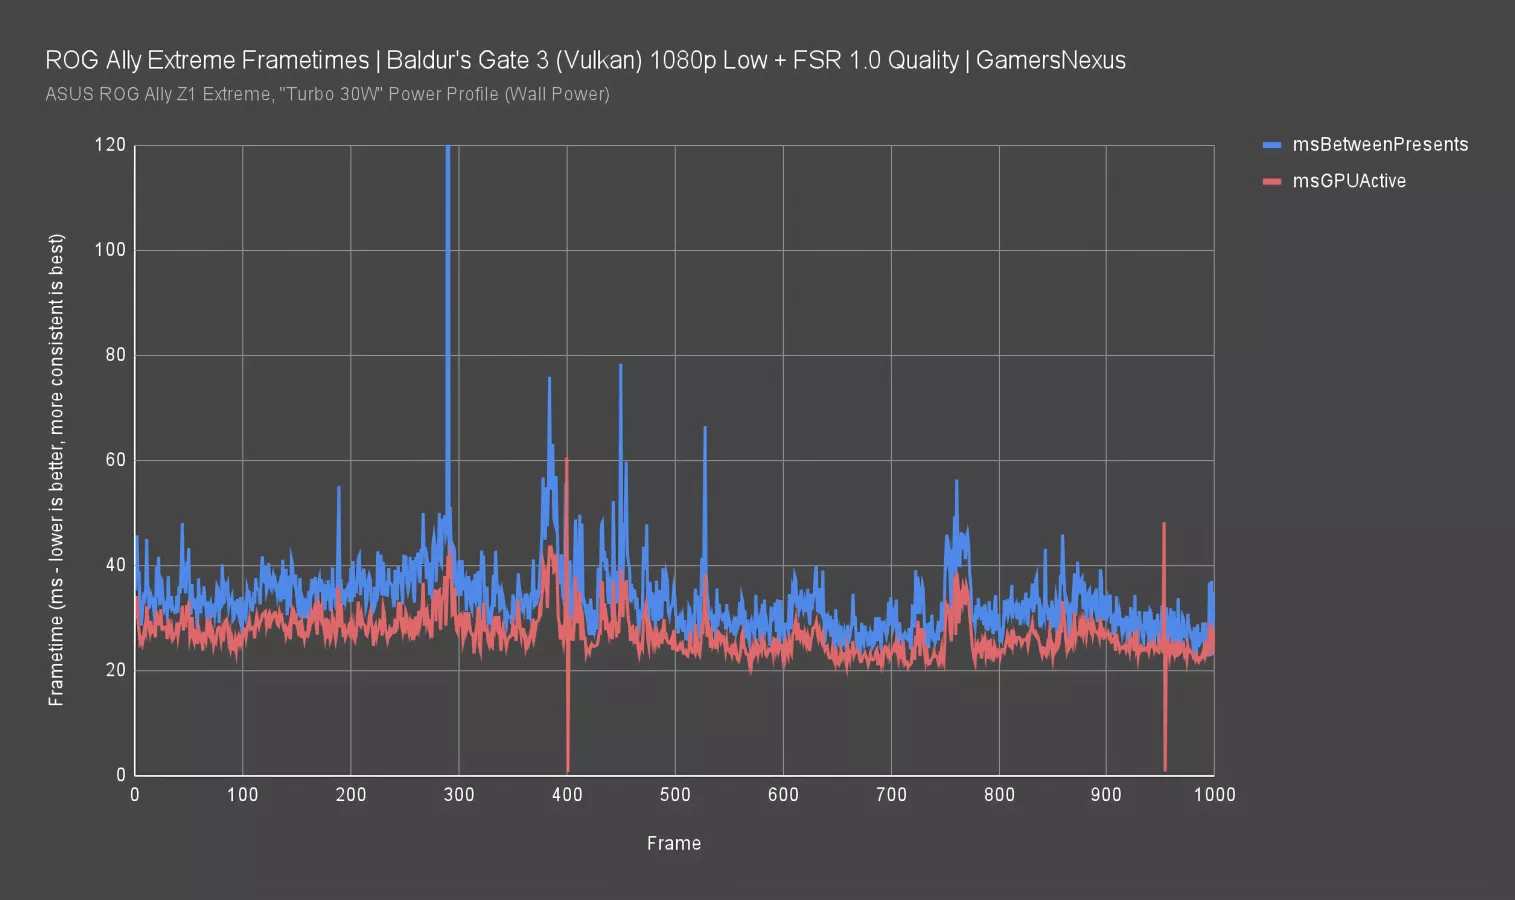
Here’s the Extreme’s plot. The test pass we selected for the Extreme isn't much different in terms of average, 1%, and 0.1%, but the raw frametime plot is. Notice that the GPU active line is more distant from the overall frametime line, indicating a shift towards a non-GPU bind. This could be why the delta between these two devices isn't larger in this game: the difference in specs matters more when fully GPU-bound.
This is exactly where GPU Busy is best used. In a complete system, we need to know how well a company balanced its part choices. GPU Busy answers that question. Every system will be bottlenecked on something, but the balance is what matters. The Z1 Extreme is under-utilizing its GPU for Baldur's Gate 3 with these settings, meaning there is a bind on the CPU component. They’re not far off, though; this is balanced, but implies that the extra performance of the more expensive version is wasted in this instance.
Dying Light 2 Stay Human
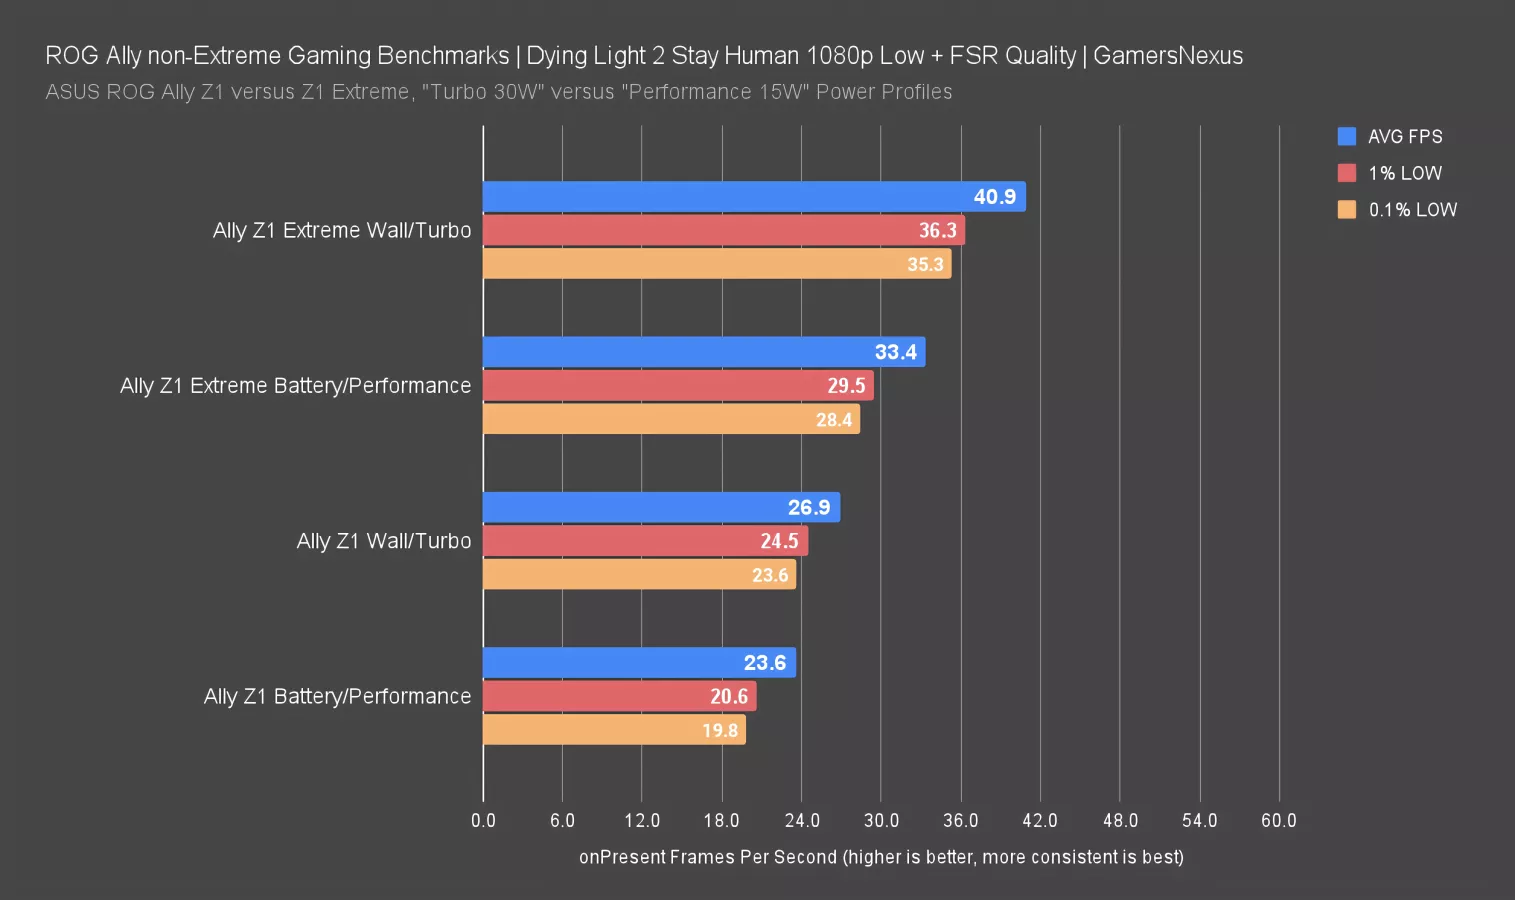
In Dying Light 2, we used the Low preset with FSR Quality upscaling. The non-extreme started with a 24FPS average on battery, up 14% to 27FPS on wall power, while the Extreme showed a 42% advantage on battery (at 33.4FPS AVG, a huge jump) and 52% on wall power. Even with the relatively strict power limits imposed when running on battery, the Extreme has a huge advantage in the capability of its IGP in the majority of titles we tested.
Resident Evil 4 (2023)
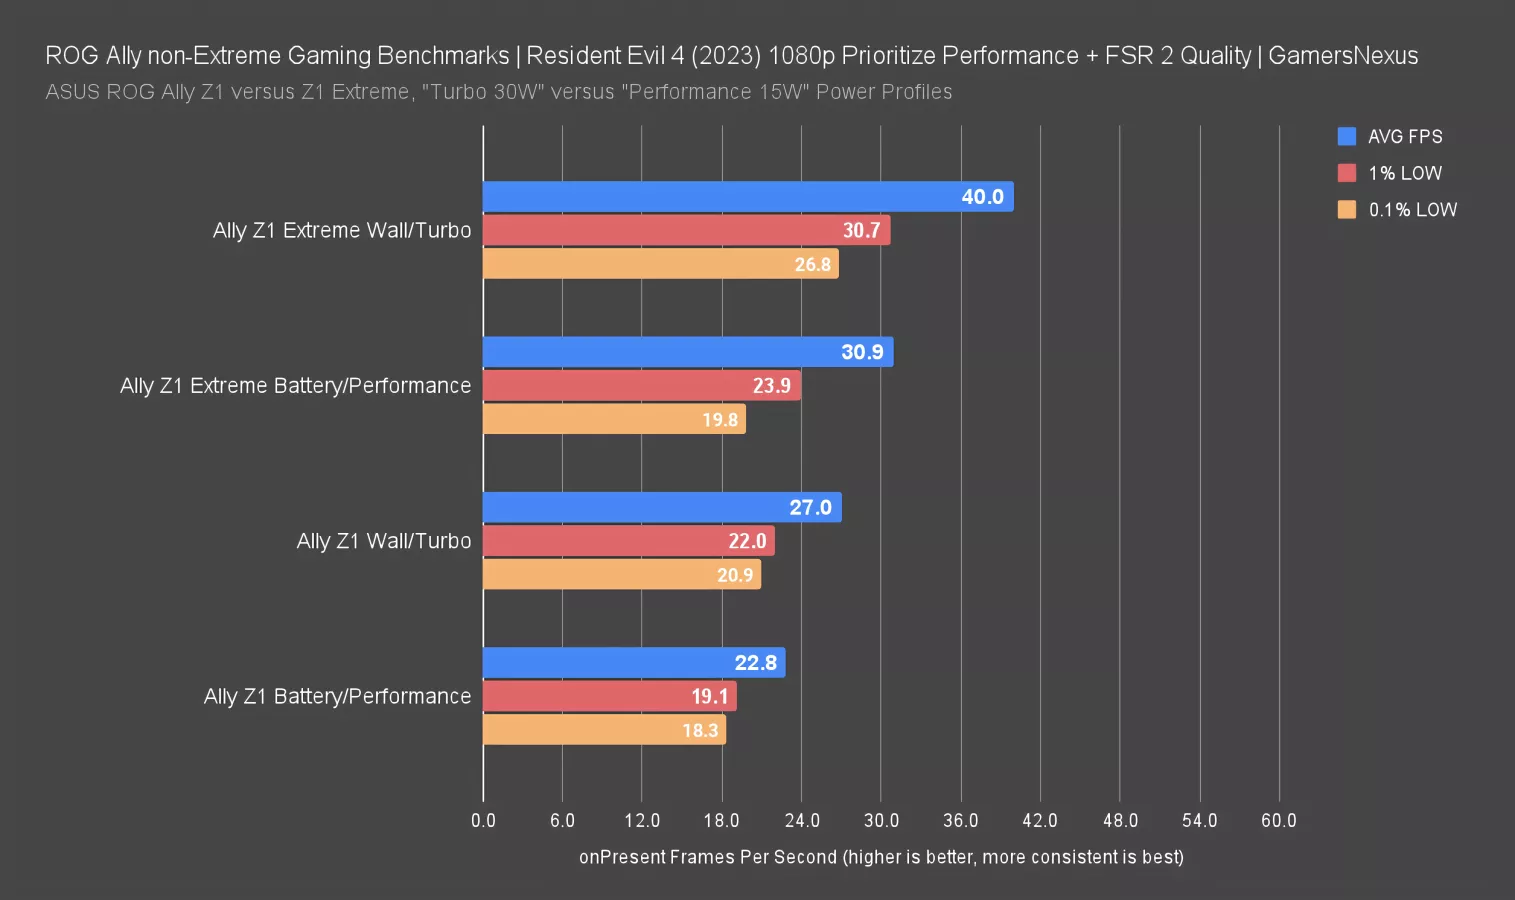
Our original review of the Ally used the "Prioritize Graphics" preset for Resident Evil 4, but that turned out to be overly ambitious, so we downgraded to the minimum "Prioritize Performance" preset with FSR 2 Quality for this batch of tests.
With those settings, the Z1 on battery starts at 23FPS, up 18% to 27FPS on wall power. As we've established thoroughly by now, the Extreme has an advantage even on battery power, 36% over the non-Extreme with a 30.9FPS AVG. As usual, the gap grows when connected to wall power with the Z1 Extreme 48% ahead. That’s another huge gap. It's hard to excuse the performance drop for just a $100 cut.
Final Fantasy XIV: Endwalker Standalone Benchmark
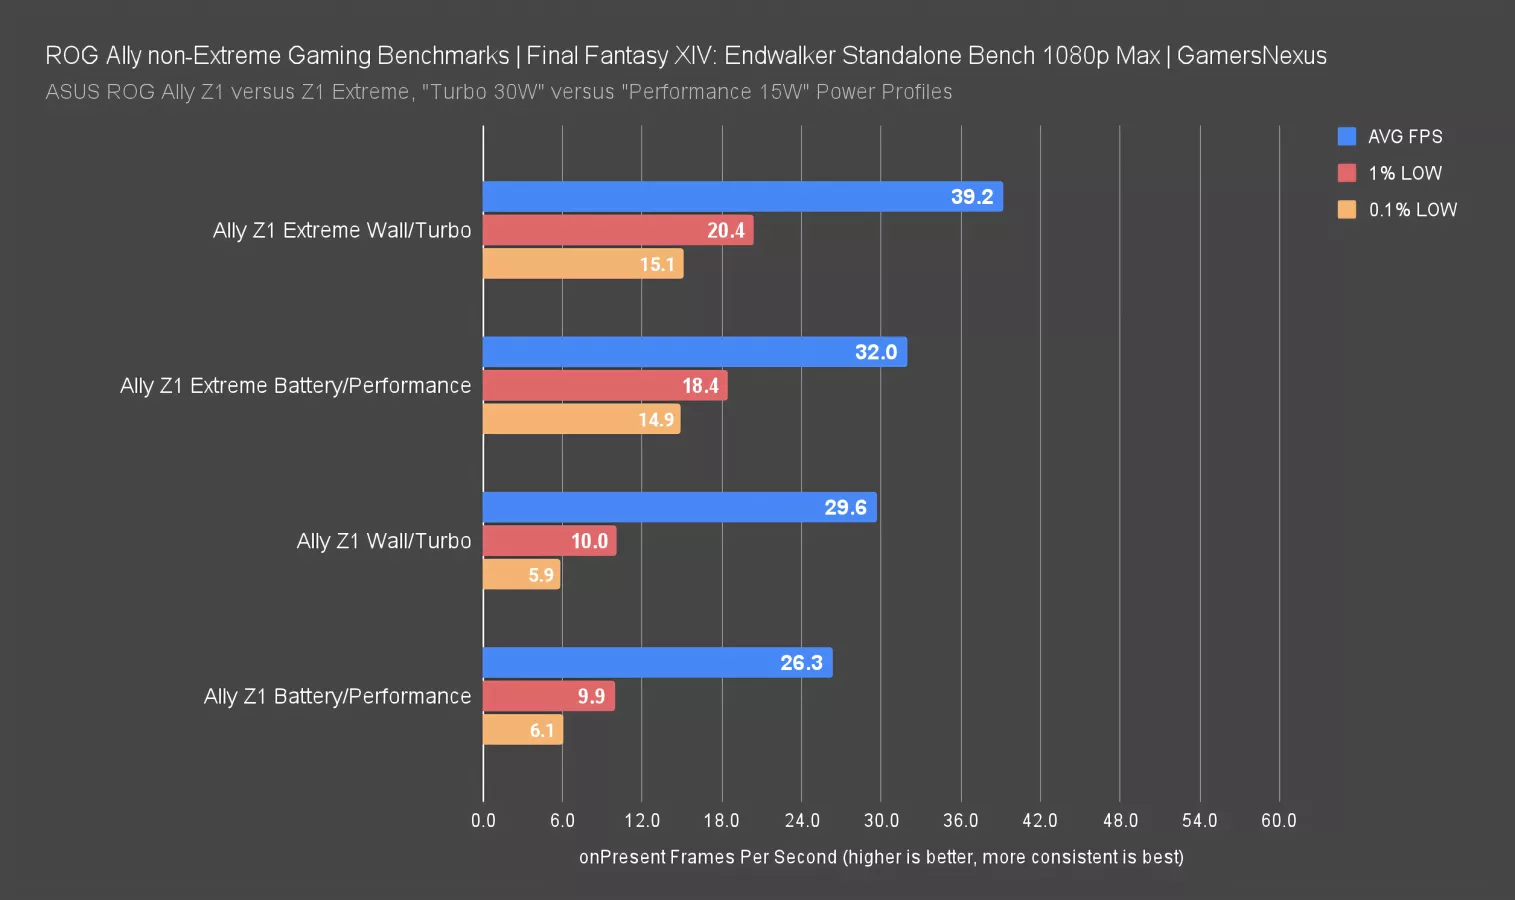
Our usual CPU and GPU tests with the Final Fantasy XIV: Endwalker benchmark use max settings. Even so, we haven't had any recently-tested GPUs average below 60FPS at 1080p, and that includes AMD's RX 6400, Intel's Arc A380, and NVIDIA'S GTX 1650. Based on that, we kept the same 1080p/Max settings for testing the Ally.
On battery power, the Z1 averaged 26FPS, but with serious stutters that kept both 0.1% and 1% lows well below that. It’s not a good experience. Plugging it in achieved a 13% uplift to 30FPS average, but with no improvement in the lows, stuck at 10FPS for even the 1%. The Extreme also had poor lows, but proportionally better than the Z1's, and average FPS was 22% higher on battery and 32% higher on wall power.
Conclusion

On one hand, a less expensive device that draws less power does make sense as an alternative to the Ally–sorry, the extreme Ally–and the Extreme can't take full advantage of its hardware in portable mode without massacring the battery life anyway. On the other hand, giving up such a massive chunk of potential performance for a 15% discount isn't great. Also, if there's any chance you're going to play docked, the Extreme is definitely better.
The GPU busy metrics we saw with Baldur's Gate 3 give an interesting insight into why we lose more performance in some games than others. With Baldur's Gate, we weren't fully leveraging the GPU on the Z1 Extreme (one of its biggest advantages), which indicates a CPU (or memory, or other non-GPU) constraint that pushes the two devices closer together. When the devices are GPU-bound we see a greater divergence, and many gaming scenarios are GPU bound, but it depends on the game. We tested some fairly intensive ones here, but if you're going to play mostly two-dimensional games like Vampire Survivors, the differences won't be as great.
The GPU is the bulk of the meaningful difference. If you plan to play things that are more GPU loaded, then the extra $100 buys you a lot of performance. It's a classic upsell approach, but it does appear that there's a meaningful difference. We're seeing double digit percentages (sometimes 40% or more) for the gap between these two when they're on battery. In our opinion, it's worth $100 for someone who will make use of that GPU. It's a different scenario than a 4060 Ti 8GB versus 16GB, where you spend an extra hundred bucks and get basically nothing useful.