The hardware industry has been spitting out launches at a rate difficult to follow. Over the last few months, we've reviewed the GTX 980 Ti Hybrid (which won Editor's Choice & Best of Bench awards), the R9 Fury X, the R9 390 & 380, an A10-7870K APU, and Intel's i7-6700K.
We've returned to the world of graphics to look at MSI's take on the AMD Radeon R9 390X, part of the R300 series of refreshed GPUs. The R300 series has adapted existing R200 architecture to the modern era, filling some of the market gap while AMD levies its Fiji platform. R300 video cards are purely targeted at gaming at an affordable price-point, something AMD has clung to for a number of years at this point.
This review of AMD's Radeon R9 390X benchmarks the MSI “Gaming” brand of the card, measuring FPS in the Witcher 3 & more, alongside power and thermal metrics. The MSI Radeon R9 390X Gaming 8G is priced at $430. This video card was provided by iBUYPOWER as a loaner for independent review.
AMD & MSI Radeon R9 390X Specs
| AMD R9 390X | MSI R9 390X Gaming | AMD R9 290X | AMD R9 390 | AMD R9 380 | |
| Process | 28nm | 28nm | 28nm | 28nm | 28nm |
| Stream Processors | 2816 | 2816 | 2816 | 2560 | 1792 |
| Boosted Clock | 1050MHz | 1100MHz | 1000MHz | 1000MHz | 970MHz |
| COMPUTE | 5.9TFLOPs | 5.9TFLOPs | 5.6TFLOPs | 5.1TFLOPs | 3.84TFLOPs |
| TMUs | 176 | 176 | 176 | 160 | 112 |
| Texture Fill-Rate | 184.8GT/s | 193.6GT/s | 176GT/s | 160GT/s | 108.64GT/s |
| ROPs | 64 | 64 | 64 | 64 | 32 |
| Z/Stencil | 256 | 256 | 256 | 256 | 128 |
| Memory Configuration | 8GB GDDR5 | 8GB GDDR5 | 4GB or 8GB GDDR5 | 8GB GDDR5 | 2 & 4GB GDDR5 |
| Memory Interface | 512-bit | 512-bit | 512-bit | 512-bit | 256-bit |
| Memory Speed | 6Gbps | 6.1Gbps | 5Gbps | 6Gbps | 5.5-5.7Gbps |
| Memory Bandwidth | 384GB/s | 384GB/s | 320GB/s | 384GB/s | 182.4GB/s |
| Power | 1x8-pin 1x6-pin | 1x8-pin 1x6-pin | 1x8-pin 1x6-pin | 1x8-pin 1x6-pin | 2x6-pin |
| TDP | 275W | 275W | 290W | 275W | 190W |
| API Support | DX12, Vulkan, Mantle | DX12, Vulkan, Mantle | DX12, Vulkan, Mantle | DX12, Vulkan, Mantle | DX12, Vulkan, Mantle |
| Price | $430.00 | $430.00 | - | $330.00 | $200.00 |
The R9 390X hosts familiar architecture. At the center of it all is AMD's existing Hawaii arch, which debuted on the 290X, albeit with a slight update. Everything I'm about to say has already been covered in our R9 390 & R9 380 reviews.
The R9 390X's version of Hawaii has been dubbed “Grenada,” though the core architecture is identical to Hawaii. Changes of note include AMD's power (and, thus, thermal) optimizations and marginal frequency increase. As with other R300 series video cards, the R9 390X sees a reference clock increase of +50MHz, bringing its stock option to 1050MHz from 1000MHz on the 290X. The clockrate increase impacts other specifications of the card; for instance, texture fill-rate is the product of clockrate and TMUs, resulting in a gain to 184.8GT/s from 176GT/s (reference). Read more about texture fill-rate in our drill-down article.
AMD also increased the memory clock frequency to 1500MHz base, which boosted memory bandwidth to 384GB/s maximum throughput. The R9 290X sat at 320GB/s reference.
It is worth noting that, despite AMD's 4GB HBM solution in Fiji and the Fury X, the R9 390X sticks with 8GB of GDDR5 memory. The R9 290X saw a refresh to 8GB at one point, but has shipped in both 4GB and 8GB models; the 390X is strictly available in its 8GB flavor. Because this is a single-GPU card, that's a true 8GB allocated to a single GPU.
MSI R9 390X Differences
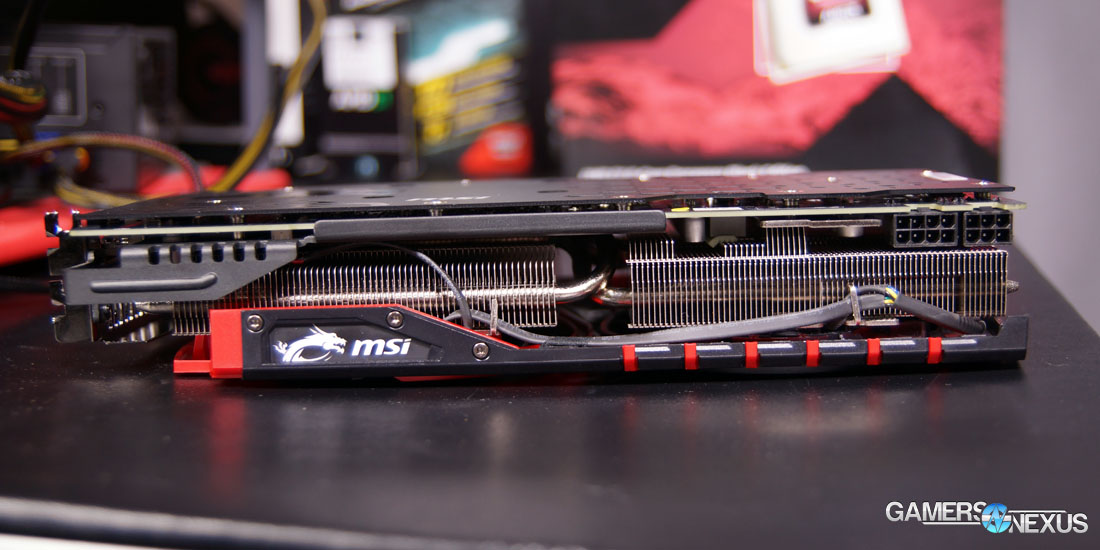
There are a few obvious (but key) differences between the reference and MSI Gaming specs. The most immediate and obvious is the cooling solution. MSI's R9 390X utilizes the company's Twin Frozr V cooler, equipped with two large-diameter fans and idle fan passive cooling abilities. Every company has its own cooler: Sapphire deploys the Vapor, Dual-, and Tri-X coolers; EVGA uses ACX; ASUS uses Strix. For the most part, high-end cooler deployments by these brands doesn't make that massive an impact on the user's experience – a few degrees between them, at best – but is still a key differentiating factor.
Twin Frozr V uses a “Torx” fan, a push fan that reduces turbulence and decreases friction, allowing for more fluid distribution of air. This also decreases noise levels, something all the listed manufacturers have attempted this generation of nVidia and AMD products.
As with nVidia's Maxwell cards, modern AMD coolers allow for passive GPU cooling when an insignificant amount of load is applied. During non-gaming workloads, the Twin Frozr fans will spin-down and relinquish cooling entirely to the (massive) heatsink on the card, which is more than capable of keeping the GPU cool during times of low demand. As may seem obvious, the card is dead silent when passively cooled.
That's the biggest note for this video card – its heatsink is huge. We measured the card at nearly 50mm wide and 110mm high, making it taller than the expansion slot and wider than the usual dual-slot config. The card takes about 2.2 expansion slot spaces. Keep this in mind for dual-card configurations – you'll want a gap between your PCI-e slots. The unit is also prone to sag when mounted vertically, as would be done in most cases, and can dip down toward the far end of the card.
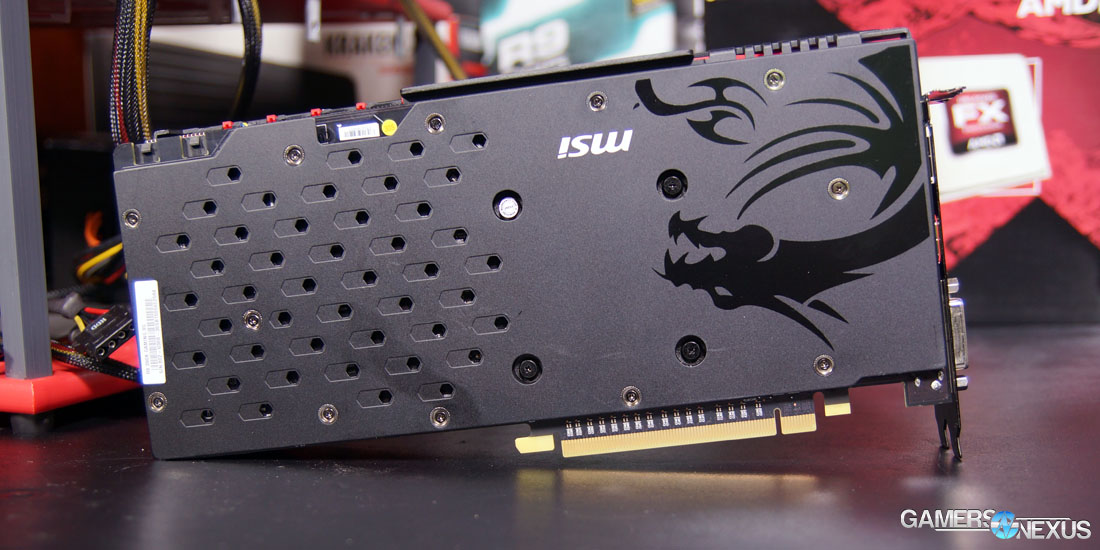
MSI's biggest point of bragging is its cooler, but the company also notes the presence of an LED backlight for the “MSI Gaming” dragon logo. The light can be configured for five different modes through software.
High-end super ferrite chokes are utilized in the VRM design, which operate at 35C lower than reference and, MSI suggests, offer a +30% increased current capacity. Super-efficient capacitors are used across the card (Hi-C Caps) that are rated for 93% efficiency. The use of high-quality VRM and electrical components assists in thermal footprint reduction.
Test Methodology
We tested using our updated 2015 Single-GPU test bench, detailed in the table below. Our thanks to supporting hardware vendors for supplying some of the test components.
The latest AMD Catalyst drivers (15.7.1) were used for testing. NVidia's 355.6 drivers were used for testing. Game settings were manually controlled for the DUT. All games were run at 'ultra' presets, with the exception of The Witcher 3, where we disabled HairWorks completely, disabled AA, and left SSAO on. GRID: Autosport saw custom settings with all lighting enabled. GTA V used two types of settings: Those with Advanced Graphics ("AG") on and those with them off, acting as a VRAM stress test.
Each game was tested for 30 seconds in an identical scenario, then repeated three times for parity.
Average FPS, 1% low, and 0.1% low times are measured. We do not measure maximum or minimum FPS results as we consider these numbers to be pure outliers. Instead, we take an average of the lowest 1% of results (1% low) to show real-world, noticeable dips; we then take an average of the lowest 0.1% of results for severe spikes. Anti-Aliasing was disabled in all tests except GRID: Autosport, which looks significantly better with its default 4xMSAA. HairWorks was disabled where prevalent. Manufacturer-specific technologies were used when present (CHS, PCSS).
Overclocking was performed incrementally using MSI Afterburner and AMD's OverDrive. Parity of overclocks was checked using GPU-Z. Overclocks were applied and tested for five minutes at a time and, if the test passed, would be incremented to the next step. Once a failure was provoked or instability found -- either through flickering / artifacts or through a driver failure -- we stepped-down the OC and ran a 30-minute endurance test using 3DMark's FireStrike Extreme on loop (GFX test 2).
Thermals and power draw were both measured using our secondary test bench, which we reserve for this purpose. The bench uses the below components. Thermals are measured using AIDA64. We execute an in-house automated script to ensure identical start and end times for the test. 3DMark FireStrike Extreme is executed on loop for 25 minutes and logged. Parity is checked with GPU-Z.
| GN Test Bench 2015 | Name | Courtesy Of | Cost |
| Video Card | This is what we're testing! | Various | - |
| CPU | Intel i7-4790K CPU | CyberPower | $340 |
| Memory | 32GB 2133MHz HyperX Savage RAM | Kingston Tech. | $300 |
| Motherboard | Gigabyte Z97X Gaming G1 | GamersNexus | $285 |
| Power Supply | NZXT 1200W HALE90 V2 | NZXT | $300 |
| SSD | HyperX Predator PCI-e SSD | Kingston Tech. | TBD |
| Case | Top Deck Tech Station | GamersNexus | $250 |
| CPU Cooler | Be Quiet! Dark Rock 3 | Be Quiet! | ~$60 |
Continue to Page 2 for the gaming benchmarks!
Note: AMD Driver Improvement
In our previous review of the R9 390 and R9 380, we highlighted the critical issues experienced when using AMD's Catalyst drivers. As of this review, we no longer observe the black flickering output by the previous R300 cards. We have not retested the R9 390 because it was returned after review, but the 390X did not exhibit screen flickering or the usual driver installation difficulties. We hope that this is the beginning of improvement for AMD's driver software.
Note that the Fury X was tested on our X99 platform and is not present in these tests.
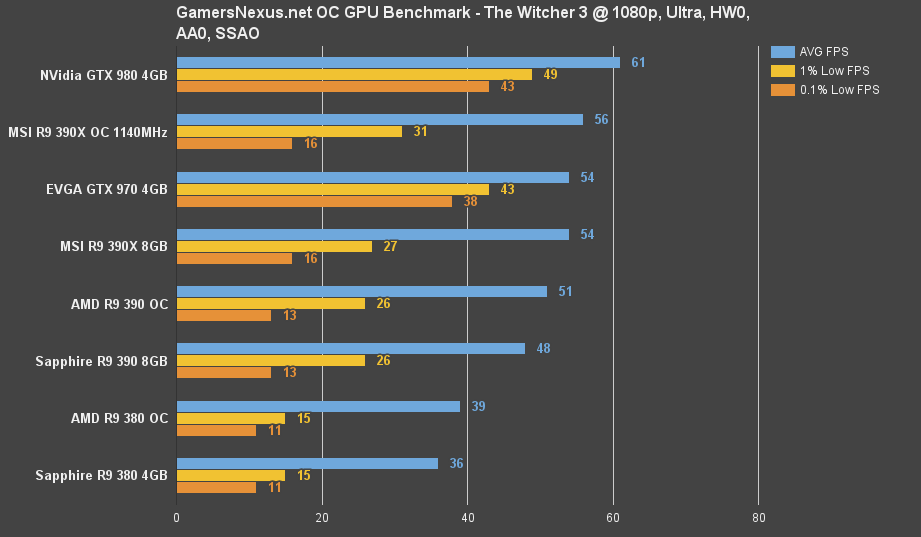
MSI R9 390X vs. R9 390, 290X, GTX 980 – The Witcher 3 Benchmark
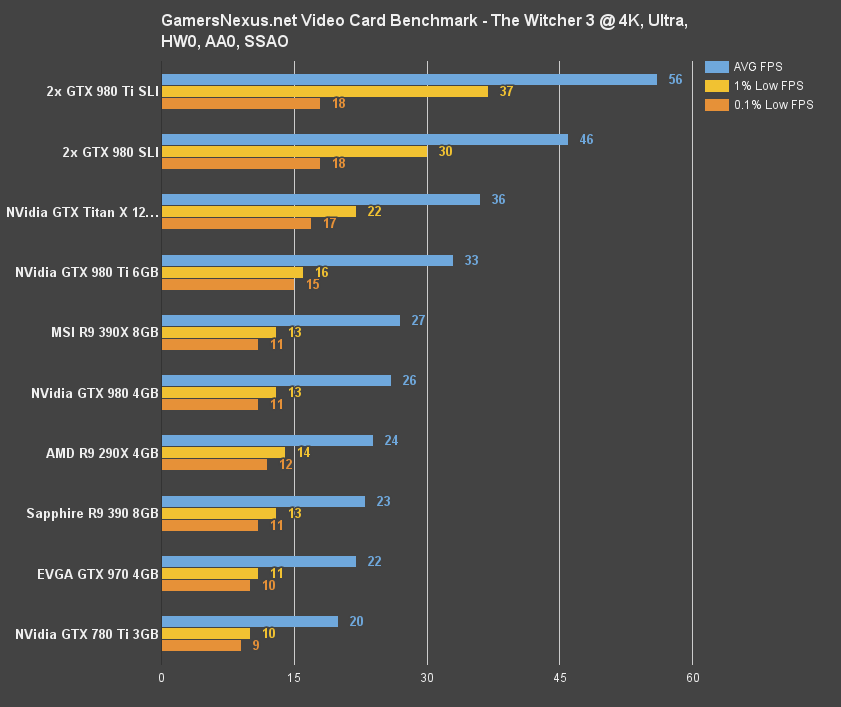
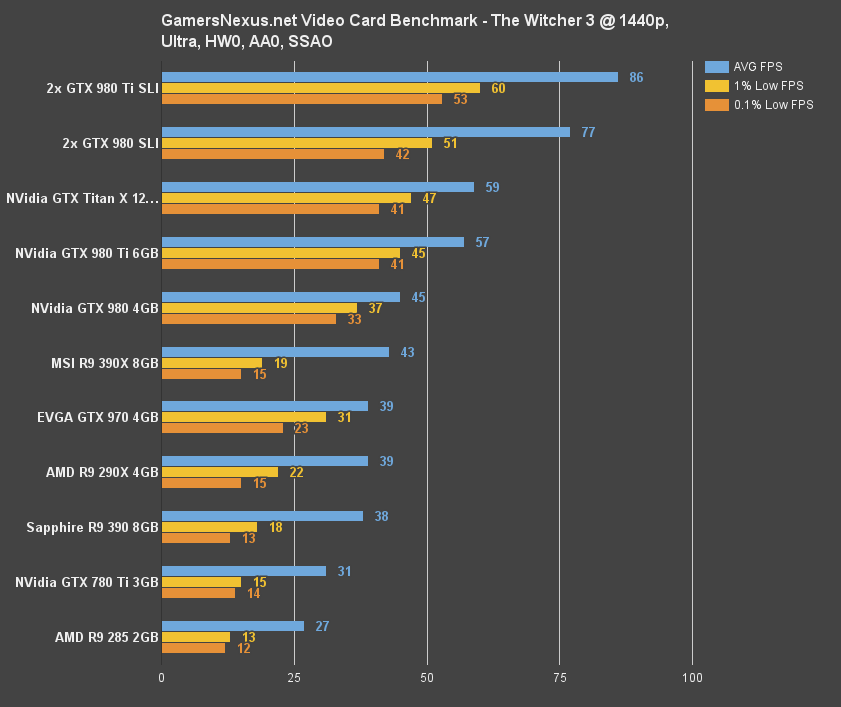

As explained in the test methodology, we leave HairWorks completely disabled for Witcher 3 benchmarking. SSAO is used instead of nVidia's HBAO+ technology.
The R9 390X can't output a playable framerate at 4K resolution using Ultra settings in the Witcher 3, but it's not alone – neither can the 980 Ti or Titan X, two higher-end cards.
At 1440p, things become more reasonable, but still aren't ideal. We see a 43FPS average output at the mid-range resolution, but still experience poor 1% and 0.1% low frametimes (19 & 15FPS, respectively). The $500 GTX 980 is fairly evenly matched with the R9 390X in average framerate, but offers substantially better low frametimes (37 & 33FPS, respectively). This makes the gameplay experience less choppy and produces a borderline playable framerate output. A few tweaks would put either one of these cards into playable range for average FPS, but only the GTX 980 offers solid lows. At an extra $70, this performance increase is somewhat expected.
Moving to 1080p, we see the R9 390X lose some ground to the GTX 980, which sits at 61FPS average and 49/43 1% and 0.1% lows. The R9 390X isn't too far behind – 54FPS average – but again fronts poor low frametime performance. The card produces a playable framerate for The Witcher 3 at 1080p with Ultra settings.
MSI R9 390X vs. R9 390, 290X, GTX 980 – Metro: Last Light Benchmark
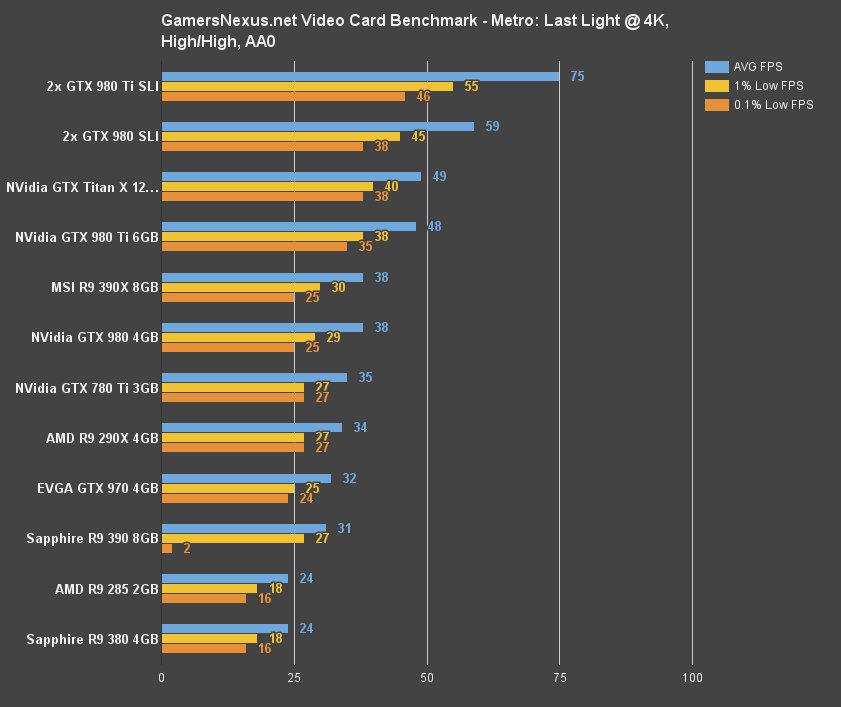
Metro at 4K sees parity achieved between the AMD R9 390X ($430) and the GTX 980 ($500) with comparable low frametimes. Neither is particularly playable – we don't see that until SLI configurations, if aiming for 60FPS – but parity is achieved.
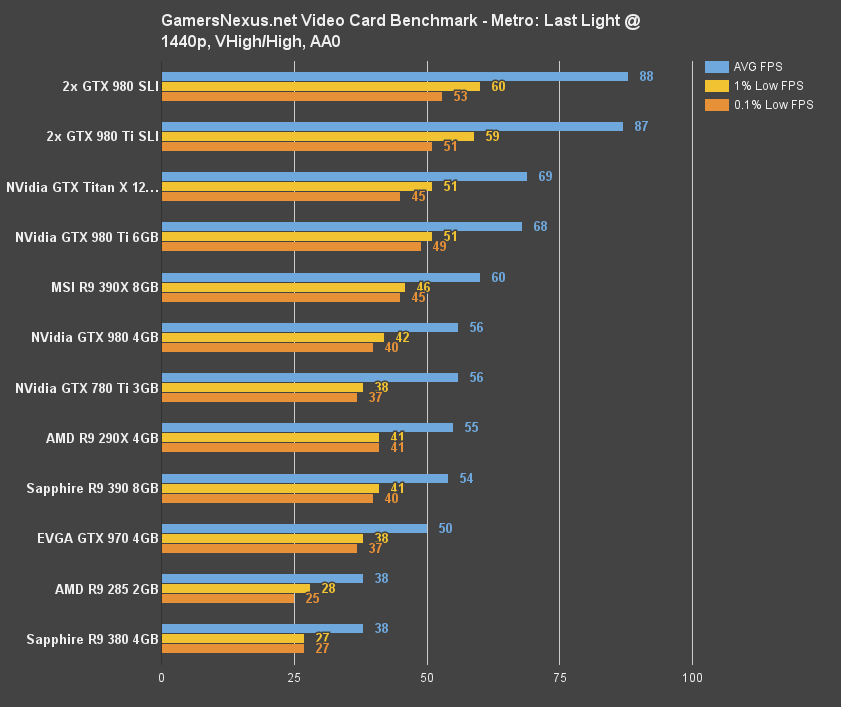
Moving to 1440p, the 390X hits 60FPS just barely, offering superior average and low framerates to the more expensive GTX 980. Unlike in The Witcher 3, AMD is actually able to offer both high averages and fluid framerates in Metro. The 390X has a 6FPS average gain over the 390, pushing the R9 390X into the golden “60FPS” metric. For reference, the R9 390 is priced (generally) around $330.
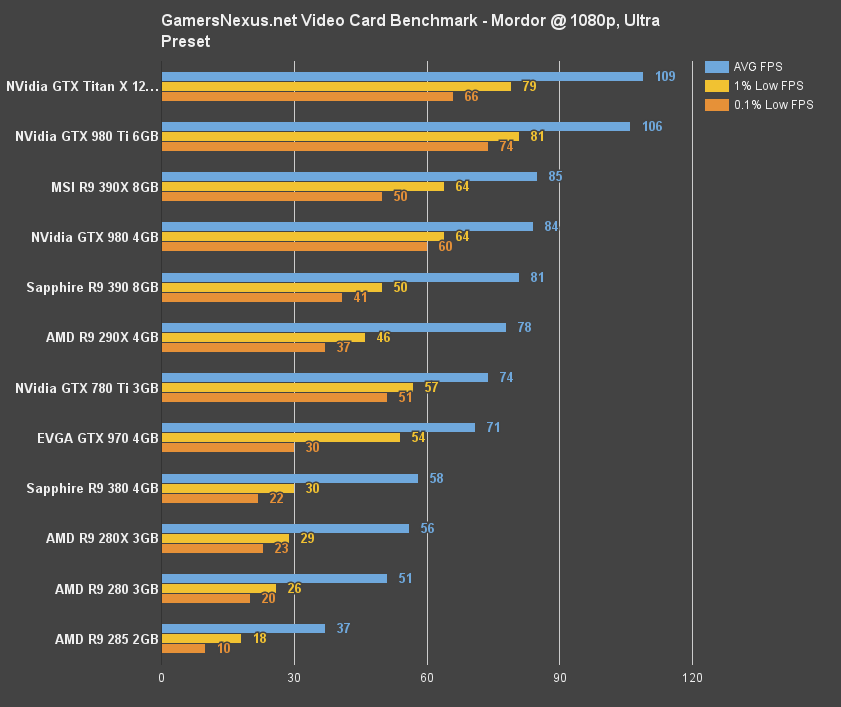
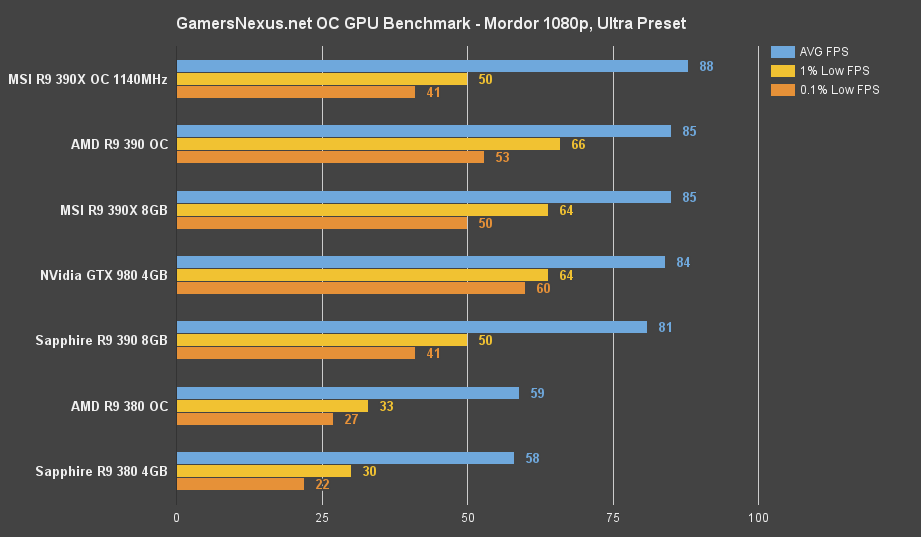
MSI R9 390X vs. R9 390, 290X, GTX 980 – Shadow of Mordor Benchmark
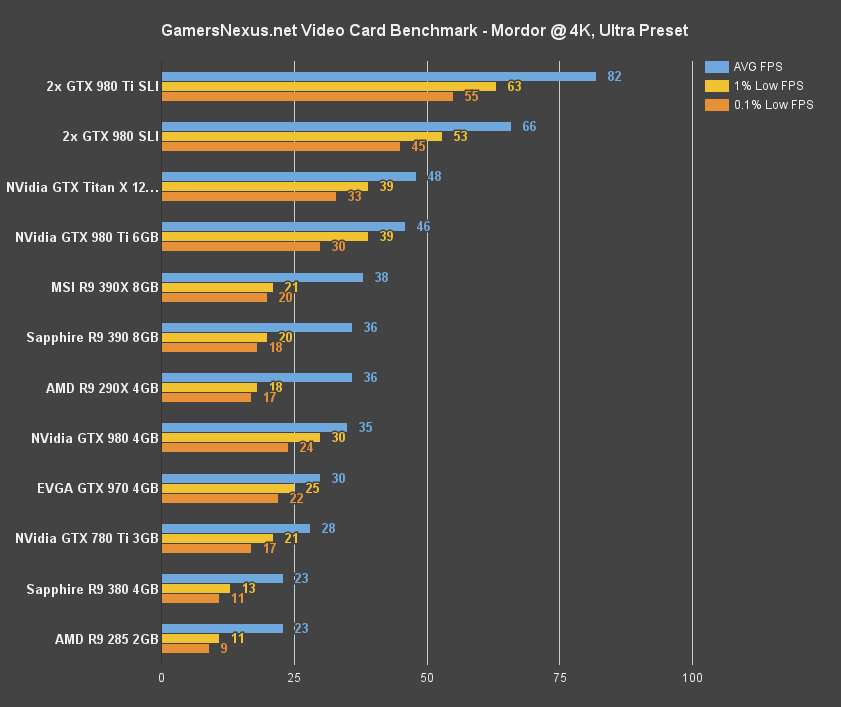
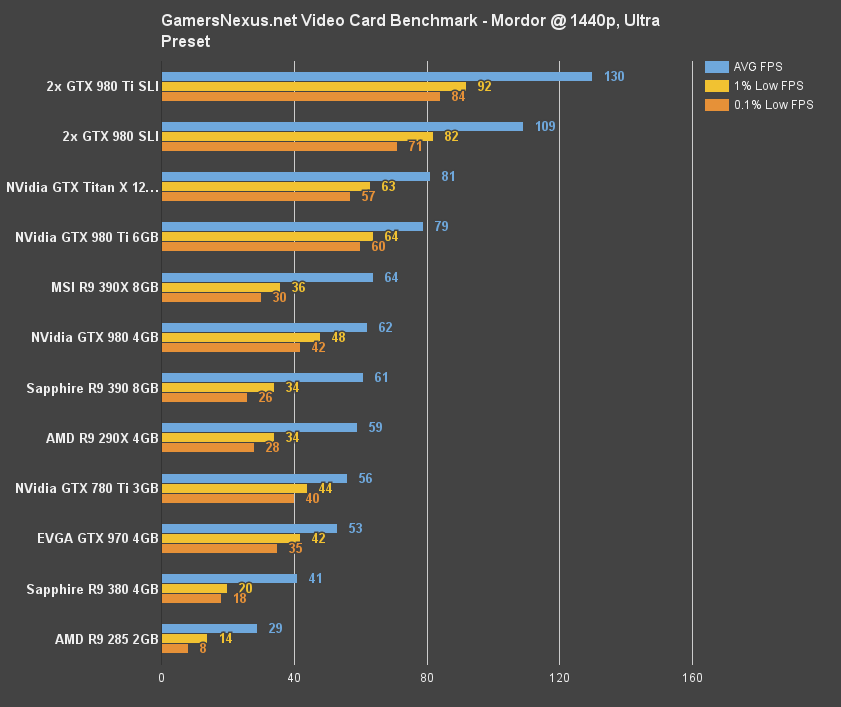
In Shadow of Mordor, we again see marginal gains in the R9 390X over the R9 390 at 4K – but that's due to throttling in the graphics pipeline. It isn't until we move to 1440p that it is revealed where the R9 390X stands: Between the GTX 980 and 980 Ti. That's not a bad place to be, really. Pushing 64FPS average, the 390X has a slight advantage over the 62FPS reference GTX 980, but loses again in 1% and 0.1% low frametimes. Generally, our observation has revealed that the GTX 980 outputs a more fluid experience despite the 2FPS gain held by the 390X. The GTX 980 Ti is substantially more powerful than both of these cards, understandably.
Moving to 1080p, the R9 390X retains its slight lead over the GTX 980 (and slight loss against 0.1% lows). Again, we see that the R9 390X has marginal gains over the R9 390. At 1440p, the 390X is about 4.8% faster than the R9 390; the difference drops to ~3.6% at 1080p.
MSI R9 390X vs. R9 390, 290X, GTX 980 – Far Cry 4 Benchmark
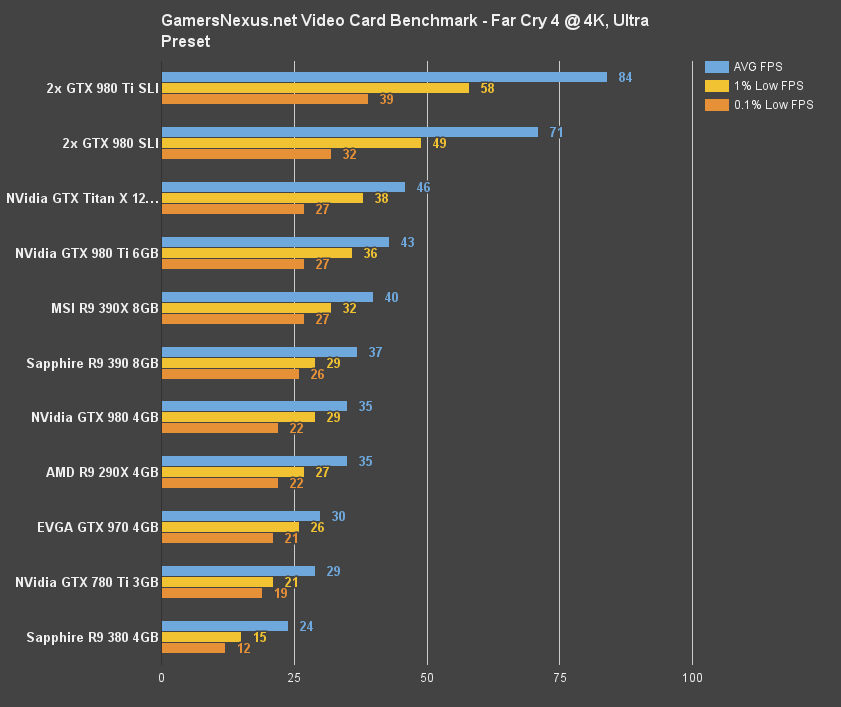
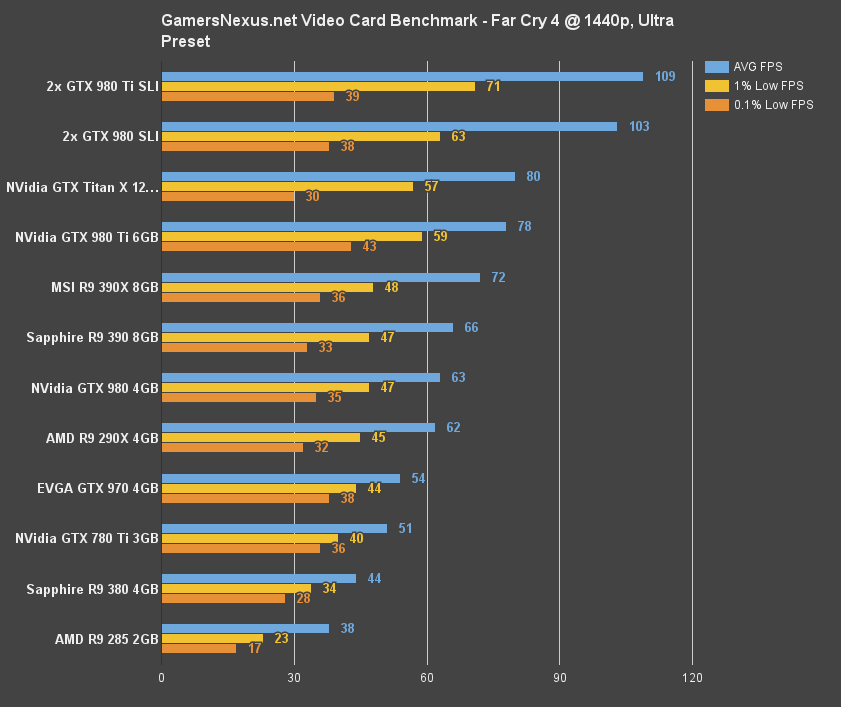
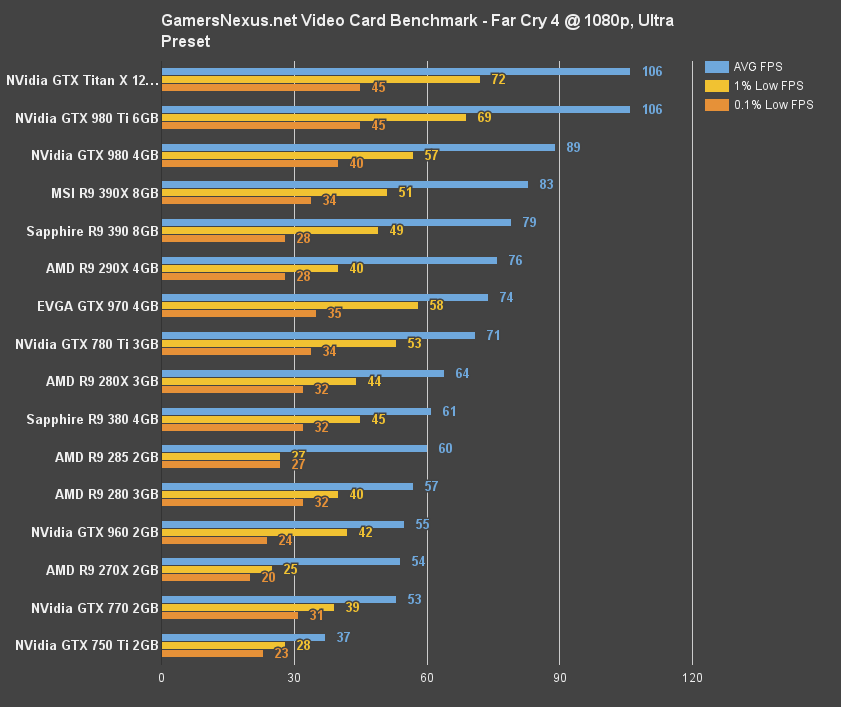
Far Cry 4 is an interesting title. The R9 390X begins to exert greater dominance over its nearby competition, fronting a 13.3% advantage over the GTX 980 (reference) using 1440p / ultra. This is due, in part, to recent driver optimizations performed by AMD. The R9 390X keeps its hold at 4K, but falls behind when dropping to 1080p. This is likely because the GTX 980's raw speed advances its FPS output at 1080p, but the R9 390X's memory capacity and throughput yields the 1440/4K advantage.
MSI R9 390X vs. R9 390, 290X, GTX 980 – GTA V Benchmark
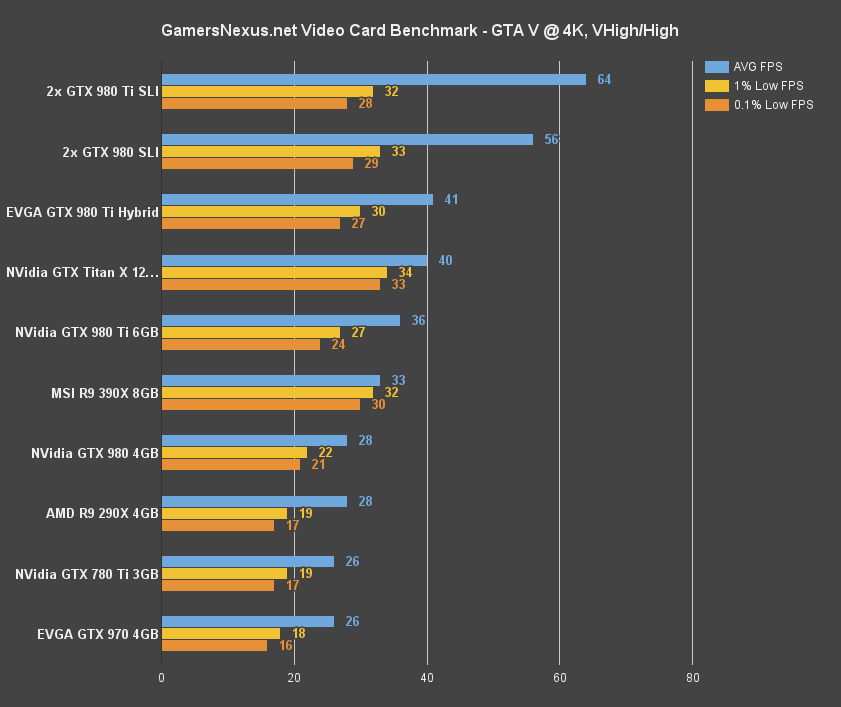
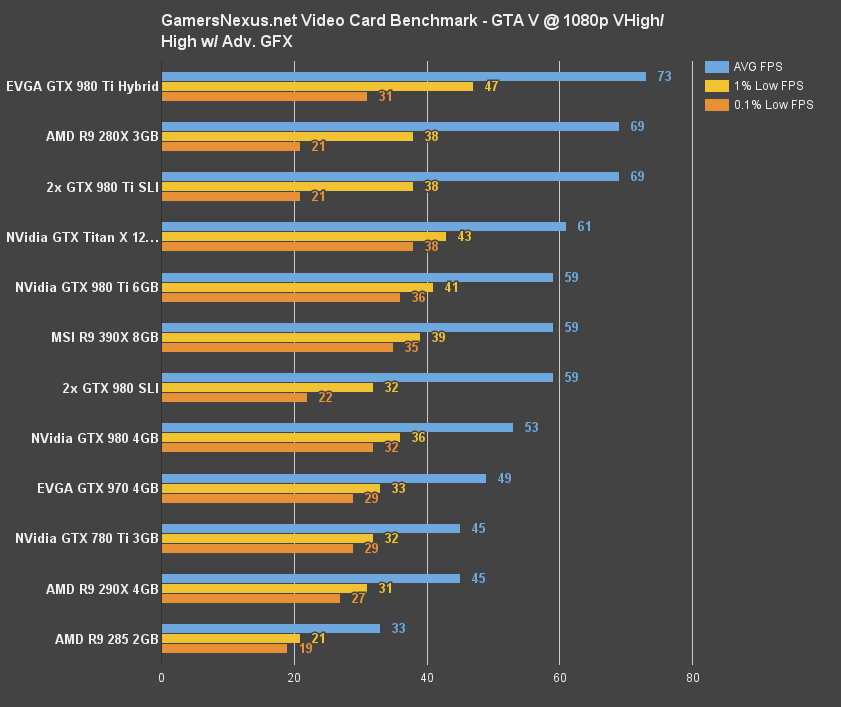
GTA V is one of the most memory-intensive games we test. Despite the fact that the 390X couldn't really handle the game at 4K with higher settings, the test reveals important data: The memory bandwidth and capacity allows for the 390X to shrink its poor 1% and 0.1% low performance delta against the 4GB GTX 980.
MSI R9 390X vs. R9 390, 290X, GTX 980 – GRID: Autosport Benchmark
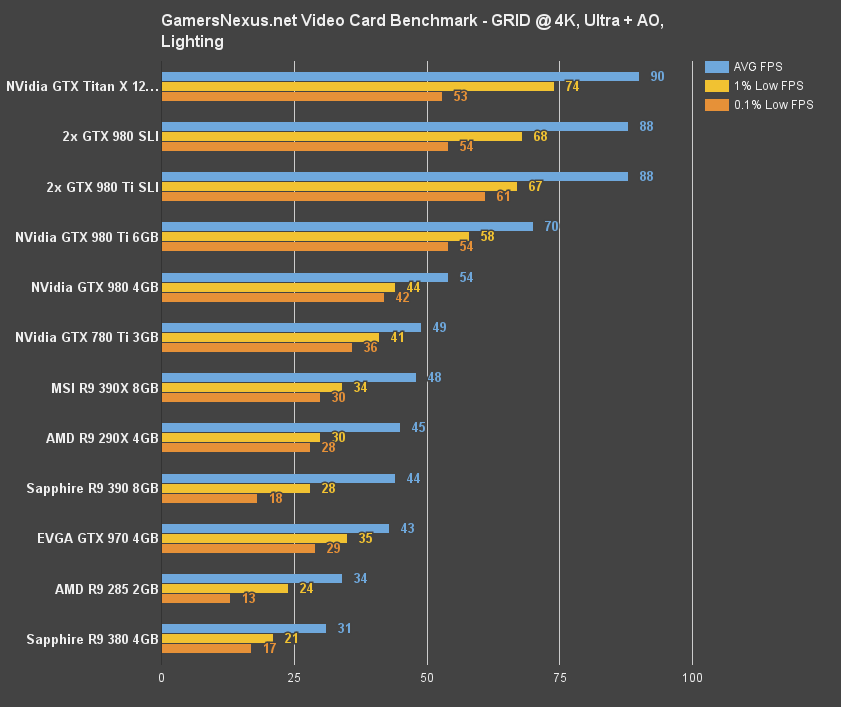
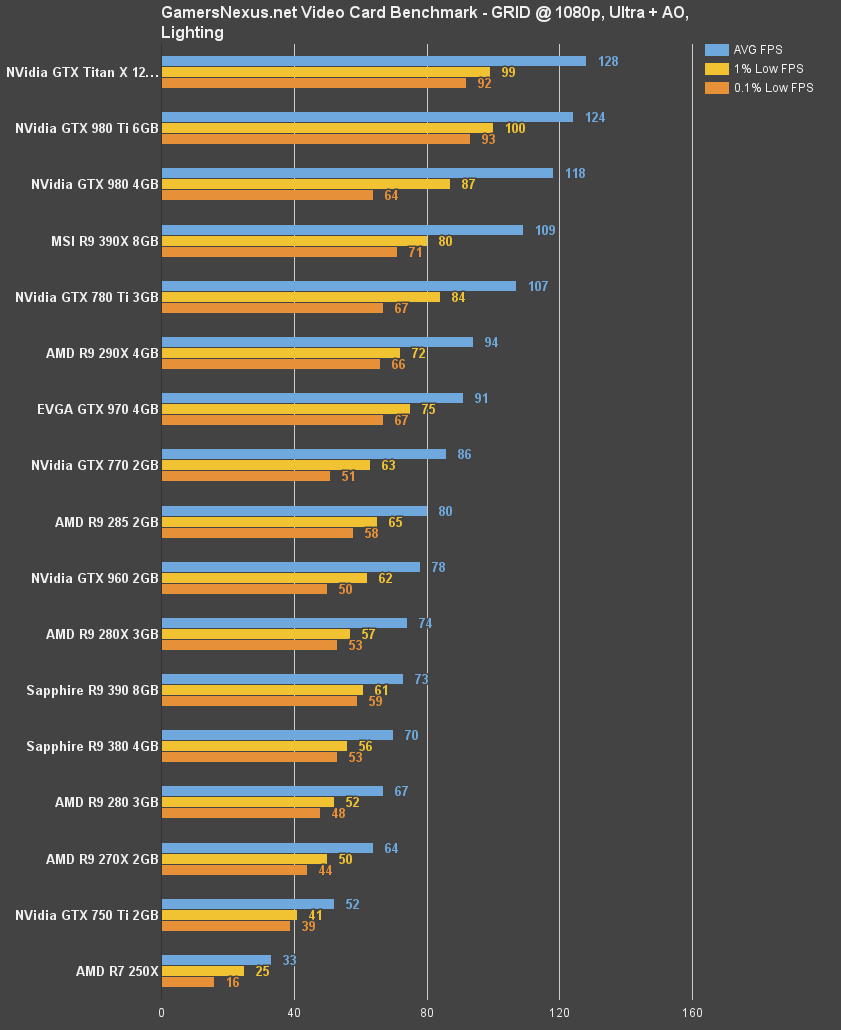
GRID: Autosport has always shown an nVidia / Intel advantage in our testing, but this is a real-world use scenario and demands testing for the best cross-game representation of hardware. The 390X is outperformed by the GTX 980 in GRID: Autosport. The 390X is approximately 11.7% slower than the GTX 980 at 4K.
Continue to the final page for thermals, power, & overclocking!
AMD Radeon R9 390X Temperatures & Power Consumption
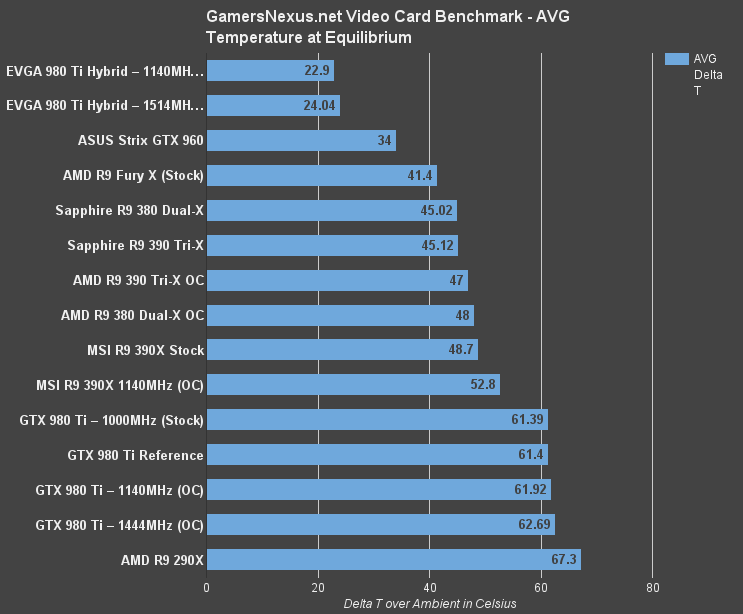
Measured at equilibrium – we're still adapting our new over time metrics to GPU reviews – the MSI R9 390X Gaming output approximately 48.7C of heat. When overclocking (more on that below), the card gained to 52.8C. “Auto” fan settings were used for all tests, as we feel this is the most common way a user utilizes their GPU and presents a real-world metric. Considering the liquid-cooled Fury X's 41.4C stock temperature, an output of 48.7C on air for the 390X isn't all that bad. The Asetek-cooled GTX 980 Ti Hybrid remains king of thermal benchmarking.
Power consumption has never been AMD's strong point, but we remarked in the Fury X review that the gap had closed to such a point that it's become less relevant. Using the MSI R9 390X, we measured averaged peak system load at 416.3W. For comparison, the GTX 980 Ti (stock) draws 353.5W under identical load. To this end, the 390X loses ground substantially against the GTX series video cards, but has still lessened the gap. We wouldn't remark this time, however, that it is an irrelevant gap, as we felt with the Fury X. A ~60W differential is big enough to change power supply selection.
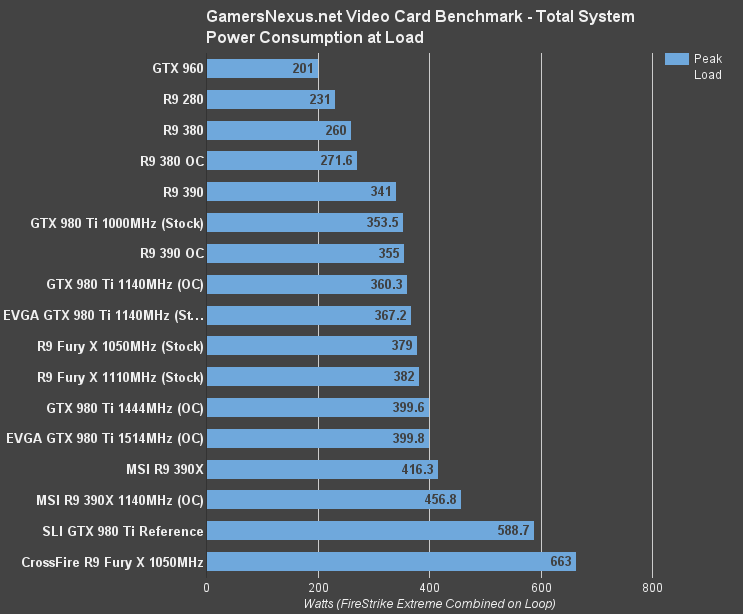
If overclocking is a consideration – which it should be, with this card – we saw a power jump to 456.8W. That's a ~41W climb.
MSI R9 390X Gaming Overclocking Results
Using Afterburner's advanced settings, we can exceed manufacturer limitations to force a memory overclock that is reflected in GPU-Z and Afterburner logging.
Overclocks were stepped incrementally to determine the maximum operating frequency of the core clock and VRAM. We configure the power percent target to its maximum value before adjusting voltage to a mid-range setting. The 980 Ti allows 110% of base power to be supplied to the GPU for overclocking and seems to hover around 1.224V after overvolting; the R9 Fury X allows 150% of base power, but presently offers no overvolting or official memory OC; the R9 390X allows 150% power and allows overvolting.
We then slowly increment clockrate, observing for visual artifacting or catastrophic failures throughout the process. Each increment is left only for a few minutes before moving to the next step. We're eventually confronted with a driver failure, at which point the clockrate is backed-down and then endurance tested for 25-minutes using 3DMark Firestrike Extreme on loop.
Voltage is stepped carefully. We start around +50mV, but will scale to +100mV for testing. Because the GPU has a maximum TDP allowance and because increasing voltage increases watt draw (P(w) = V(v) I(a)), it is generally the case that overvolting a card to its maximum allowable voltage will consume TDP in a fashion that throttles clockspeed under load.
| CLK Offset | Max Clock | Mem Offset | Mem CLK | Power % | Voltage | Initial Test | Endurance? |
| +0 | 1080MHz | +0 | 1525MHz | 100% | +0mV | P | P |
| +70MHz | 1150MHz | +125MHz | 1650MHz | 150% | +50mV | F - flicker | - |
| +70MHz | 1150MHz | +75MHz | 1600MHz | 150% | +50mV | F - flicker | - |
| +70MHz | 1150MHz | +75MHz | 1600MHz | 150% | +75mV | P | F - less bad flicker |
| +50MHz | 1130MHz | +125MHz | 1650MHz | 150% | +50mV | P | P |
| +50MHz | 1130MHz | +140MHz | 1665MHz | 150% | +50mV | F | - |
| +50MHz | 1130MHz | +130MHz | 1655MHz | 150% | +50mV | P | - |
| +60MHz | 1140MHz | +130MHz | 1655MHz | 150% | +50mV | P | P |
| +70MHz | 1150MHz | +130MHz | 1655MHz | 150% | +56mV | F - flicker | |
| +70MHz | 1150MHz | +130MHz | 1655MHz | 150% | +63mV | F - flicker | |
| +70MHz | 1150MHz | +130MHz | 1655MHz | 150% | +69mV | F - flicker |
The above shows our AMD overclock stepping. We got stuck at 1140MHz core and 1655MHz memory. Voltage was best at +50mV. The max core overclock was a 5.4% gain, similar to the Fury X overclock.
MSI R9 390X Gaming Overclocking Benchmark
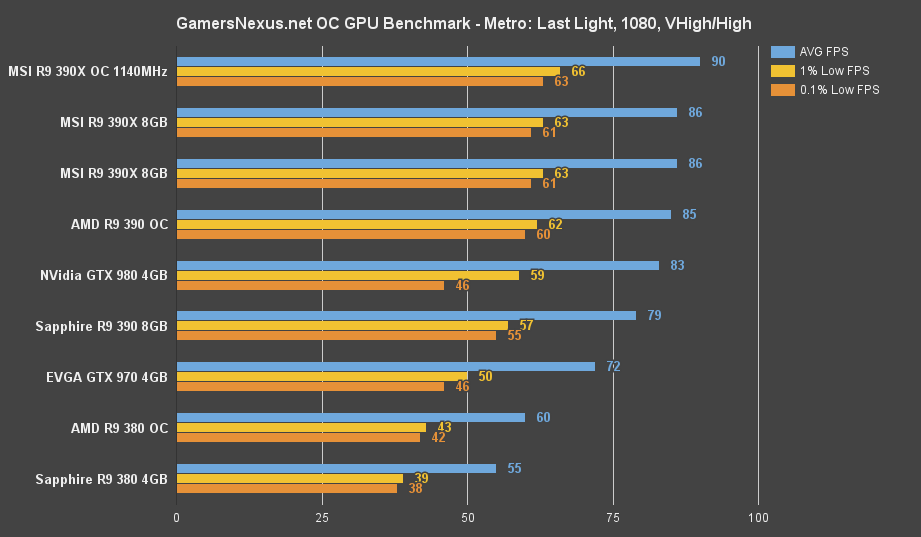
It is generally not worth the effort to overclock the R9 390X. This is the same conclusion we reached with the R9 390 and R9 380. The performance output is barely measurable.
Conclusion
AMD's at its limit with what the Hawaii, Tonga, and “Grenada” architectures are capable of achieving. The slight +50MHz clockrate boost is an indicator of this and, although the cards are more than a mere “rebadge,” the limitations are obvious. Overclocking is effectively irrelevant on the R300 series cards we've tested, to include the 390X, R9 390, and R9 380. The performance gain from tiny, ~5% overclocks ranges 1% to 7% in FPS, which isn't worth the added thermal, power, and overvoltage risk.
Now, that stated, MSI's R9 390X is actually a solid performer. Overclocking isn't everything. The R9 390X outperforms the GTX 980 in some games by small margins and runs $70 cheaper – that's certainly worth talking about. The ~60W power overhead hurts, but isn't a concern to every builder. The more relevant dip in AMD's performance comes from 1% and 0.1% low metrics, which illustrate that AMD is still behind in some games (The Witcher 3, particularly) when it comes to frametimes. This isn't true for all games, looking at the charts, so you'll just have to make a decision based on which games you're playing. In general, the GeForce cards do offer a more consistent and fluid framerate, but the R9 390X keeps up handily and is a fierce competitor at its price-point.
Drivers have also been improved from our last AMD test. We're seeing boosted performance in some games (Far Cry 4, Witcher 3) and haven't exhibited install-breaking driver defects this time around.
With the driver improvement and competitive average FPS performance in mind, we can recommend the R9 390X with relative confidence to builders seeking a sub-$450 video card. Anyone who can afford the GTX 980, in our view, should strongly consider going with nVidia for its advantaged frametime metrics at 1% and 0.1% lows. Sub-$450, the 390X is a high-performing card that will run most games with relative fluidity at 1080p and 1440p.
- Steve “Lelldorianx” Burke.