Liquid-cooled video cards have carved-out a niche in the performance market, granting greater power efficiency through mitigation of power leakage, substantially reduced thermals, and improved overclocking headroom. We've previously talked about the EVGA GTX 980 Ti Hybrid and AMD R9 Fury X, both of which exhibited substantially bolstered performance over previous top-of-line models. More manufacturers have seen the potential for liquid-cooled graphics, with MSI and Corsair now joining forces to produce their own 980 Ti + CLC combination.
This joint venture by MSI and Corsair sees the creation of a liquid-cooled GTX 980 Ti, using the existing Corsair H55 CLC ($60), an Asetek-supplied CLC. Depending on which company you're asking, the graphics card is named either the “MSI Sea Hawk GTX 980 Ti” ($750) or “Corsair Hydro HFX 980 Ti.” Both will have independent listings on retail websites. The cards are identical aside from the branding initiatives. The MSI & Corsair solution sees employment of what is typically a CPU liquid cooler, bracketing the H55 CLC to the GPU using a Corsair HG10 GPU CLC mount. EVGA's solution, meanwhile, uses a CLC with an extruded coldplate for GPU-specific package sizes, which could impact cooling. We'll look into that below.
For purposes of this review, we'll refer to the card interchangeably between the Hydro GFX and Sea Hawk. Our MSI Sea Hawk GTX 980 Ti review benchmarks gaming (FPS) performance vs. the EVGA 980 Ti Hybrid, temperatures, overclocking, power consumption, and value. The liquid-cooled 980 Ti cards are in a class of their own, exceeding base 980 Ti price by a minimum of $50 across all manufacturers. We're pitting the EVGA 980 Ti Hybrid against the MSI Sea Hawk in a head-to-head comparison within this benchmark.
Previous GTX 980 Ti Content
- EVGA GTX 980 Ti Hybrid Benchmark
- GTX 980 Ti SLI Benchmark (2-Way)
- GTX 980 Ti Overclocking Performance a 19% FPS Gain
- NVidia GeForce GTX 980 Ti Review & Benchmark
MSI Sea Hawk GTX 980 Ti Specs & Corsair Hydro GFX Specs
| MSI Sea Hawk GTX 980 Ti | EVGA GTX 980 Ti Hybrid | GTX 980 Ti | GTX Titan X | |
| GPU | GM200 | GM200 | GM200 | GM200 |
| Fab Process | 28nm | 28nm | 28nm | 28nm |
| Texture Filter Rate (Bilinear) | 176GT/s | 176GT/s | 176GT/s | 192GT/s |
| TjMax | 92C | 92C | 92C | 91C |
| Transistor Count | 8B | 8B | 8B | 8B |
| ROPs | 96 | 96 | 96 | 96 |
| TMUs | 176 | 176 | 176 | 192 |
| CUDA Cores | 2816 | 2816 | 2816 | 3072 |
| Base Clock (GPU) | 1190MHz | 1140MHz | 1000MHz | 1000MHz |
| Boost Clock (GPU) | 1291MHz | 1228MHz | 1075MHz | 1075MHz |
| GDDR5 Memory / Memory Interface | 6GB / 384-bit | 6GB / 384-bit | 6GB / 384-bit | 12GB / 384-bit |
| Memory Bandwidth (GPU) | 336.5GB/s | 336.5GB/s | 336.5GB/s | 336.5GB/s |
| Mem Speed | 7Gbps | 7Gbps | 7Gbps | 7Gbps |
| Power | 1x 8-pin 1x 6-pin | 1x 8-pin 1x 6-pin | 1x 8-pin 1x 6-pin | 1x 8-pin 1x 6-pin |
| TDP | 250W | 250W | 250W | 250W |
| Output | 3x DisplayPort 1x HDMI 2.0 1x DL DVI | 3xDisplayPort 1xHDMI 2.0 1xDL DVI | 3xDisplayPort 1xHDMI 2.0 1xDL DVI | 3xDisplayPort 1xHDMI 2.0 1xDual-Link DVI |
| MSRP | $750 | $770 but $710 at this post | $650 | $1000 |
Notably, the MSI Sea Hawk GTX 980 Ti ships with a pre-overclock over the native 1000MHz / 1075MHz reference nVidia setting. MSI and Corsair plant their graphics solution at 1190MHz / 1291MHz (base / boost), using the CLC to keep the overclocked temperatures below reference.
Other than this, as most of you likely know, it's still a GTX 980 Ti. The card has the same TMUs, same ROPs count, same memory configuration (6GB GDDR5) and bus, and so forth. As ever, it's the cooler, the binning process, and the pre-overclock that differentiate cards.
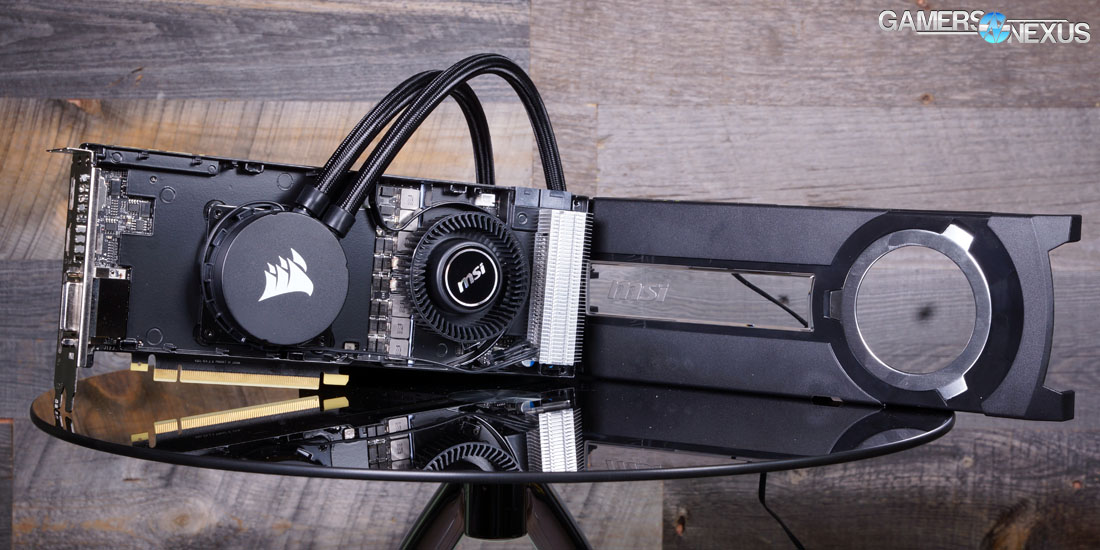
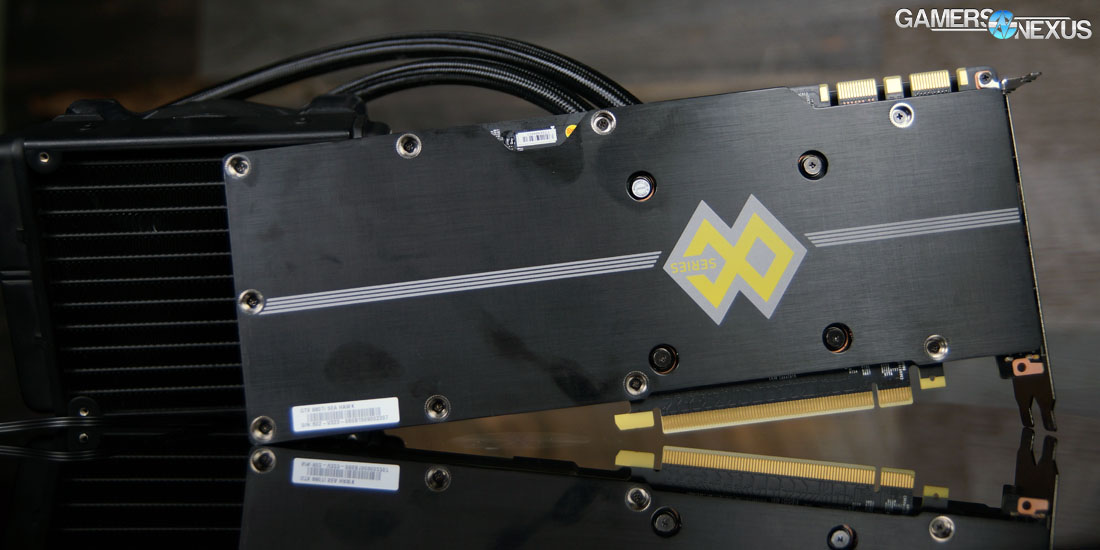
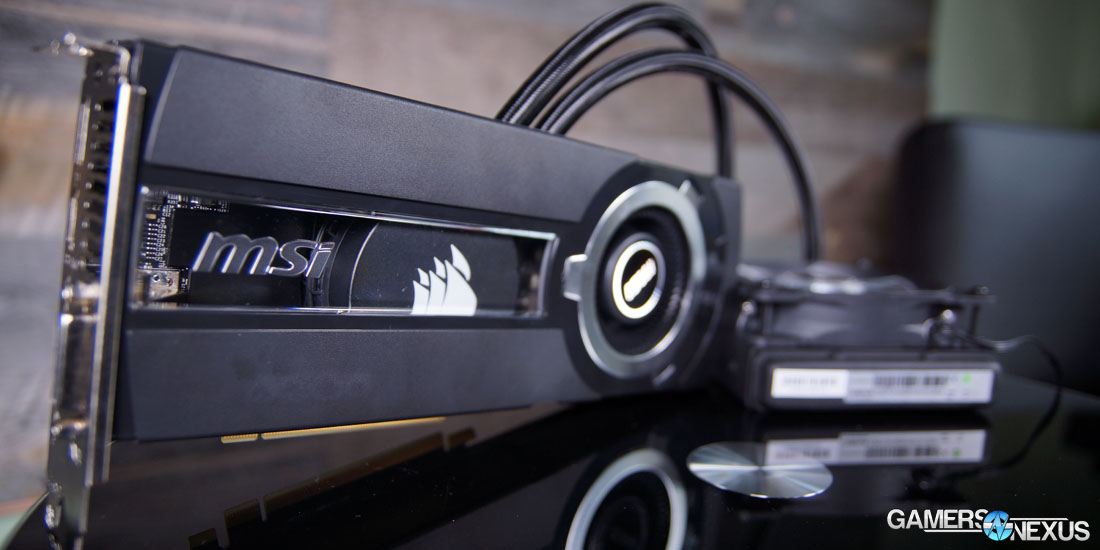
The Sea Hawk uses Corsair's HG10 mounting bracket and adds a rectangular, acrylic window for visibility to the MSI and Corsair logos. The marketing photos have the Corsair “sails” logo fully visible through the acrylic window, but our model presents the Corsair iconography at a three-quarters visibility. The card uses a reference nVidia PCB and rests under a plastic face plate, with a metal backplate to support the card's rear side.
Corsair uses its own solution for the radiator fan, fitted with white LEDs in each of the corners. The radiator fan connects directly to the motherboard via a 3-pin, non-PWM header. For comparison purposes, the EVGA Hybrid's radiator fan connects directly to the video card (along the tubing channels) via 3-pin header, but is voltage-controlled directly by the card's temperature demands.
Of the two, the Sea Hawk's fan looks better (and has LEDs, for those who care), but introduces some slight cable clutter of which buyers should be aware. If you're mounting this in the rear case slot – and you probably are – then the radiator fan cable is largely a non-issue, since most motherboards have a fan port near the rear IO panel.
Why Liquid Cooling Makes Sense for Graphics... Sometimes
Above: VRM aluminum sink allows air passthrough from front intake and dissipation from the blower fan.
This is a topic we deeply explored in our AMD R9 Fury X review, something worth reading for curious buyers.
Liquid cooling has a number of seen and unseen advantages for high-end graphics solutions. The main, obvious disadvantage is support for yet another radiator. Users with CPU CLCs must pay special attention to case selection in this regard, as two closed-loop solutions can become a mounting challenge given tube length and flexibility limitations. Both the MSI Sea Hawk and EVGA Hybrid utilize an underlying Asetek supply. We've found Asetek-made coolers to include some of the most flexible tubing on the market, which helps reduce that concern, but the case must still have two nearby radiator mounts. We couldn't say the same for flexibility with some Apaltek and Cooler Master solutions.
- Primary advantages are as follows:
- Reduced thermals
- Reduced chance of video card sag (less PCB saturation of heavy alloy and copper heatsinks)
- Improved power efficiency by reducing heat-resultant capacitor leakage
- Using binned GPUs, potential for greater OC support
- Theoretically, potential for reduced noise emissions. We do not presently test dBA emissions.
Thermal reduction is the most obvious gain. The CLC works the way any other CPU CLC or radiator setup would: A pump (mounted on the coldplate, for these cards) forces cold liquid into the microfins lining the inside of the copper coldplate, which directly contacts the GPU die, and then propels the heated liquid into the radiator. The liquid then runs down radiator liquid channels, where attached aluminum fins siphon heat for dissipation by radiator-mounted fans. Pretty simple, but hugely improved over the thermal dissipation abilities of air (which has a thermal conductivity of less than 1W/mK at 25C).
High-end air coolers are heavy and potentially introduce sag. Some solutions, like MSI's GTX 980 Ti Lightning, use strategically-positioned steel brackets to help support the PCB under the severe load of copper and alloy heat sinks and pipes. Not all cards do – some of MSI's “Gaming” cards sag – and that means the PCB is placed under strain. Over a lifespan, the strain can impact thermal compound (peel it away) and fan performance (flex the fan mount or bracket and force slight abrasion). A CLC solution immediately removes a large chunk of metal (copper heatpipes and aluminum fins) from the GPU surface, which is instead mounted by a plastic-and-copper block. As a bonus, this block is more central-and-left to the card, where PCB strength is supported by the expansion slot mounting point.
Power efficiency gains are also presented by improved thermal dissipation, a natural “gimme” with liquid coolers. By keeping the thermals of various video card components down – capacitors, chokes, MOSFETs, the GPU itself, memory – the card suffers from less power loss through leakage. As capacitors increase in heat, they lose their ability to retain power and the VRM is forced to work harder to clean voltage supply.
Next to HBM, which had big gains for AMD's power efficiency, the inclusion of a CLC on the R9 Fury X is a measurable contributor to the card's TDP reduction over Hawaii. We saw the power draw gap shrink to ~26W between high-end nVidia solutions and the Fury X, which is more than can be said for the company's previous air cards. This closing gap is partially attributable to the thermal reduction by the CLC, netting improved power efficiency and retention.
Some CLC-equipped video cards do not cool the VRM, which is a concern for high-end cards with overclocking in mind. Both the Sea Hawk and Hybrid use aluminum heatsinks and blower fans for VRM cooling. For comparison, the Fury X uses a modified Cooler Master CLC (resembles the Seidon coolers) with liquid piped through copper VRM channels. This raises overall thermals of the Fury X by “sharing” the liquid with more components, but helps control power leakage and empower AMD's near-max stock clock setting.
There's obviously a cost add. It's worth noting that, when well-designed, air cooling a GPU is still a completely viable option that's more affordable. ASUS' “Strix” cooler, for instance, remains one of the best-performing GPU coolers we've tested – and that's all air and heatsinks.
At $710 – normally closer to $750, before MSI launched a competitor – the EVGA 980 Ti Hybrid sits a full ~$50 over most air-cooled GTX 980 Ti video cards. Considering similar pre-OC performance can be gained through a high-end air cooler, though at a hotter temperature, this price jump is something the buyer must personally balance. The MSI / Corsair Sea Hawk currently rests at $750, a price at which we readily recommended the EVGA Hybrid. If the CLC solution performs well and the pre-overclock outputs high framerate deltas, this price-point is easily justifiable for the right enthusiast audience. But, again, there is no shame in buying air ($660) when cost-limited.
Differences Between the EVGA GTX 980 Ti Hybrid & MSI Sea Hawk 980 Ti
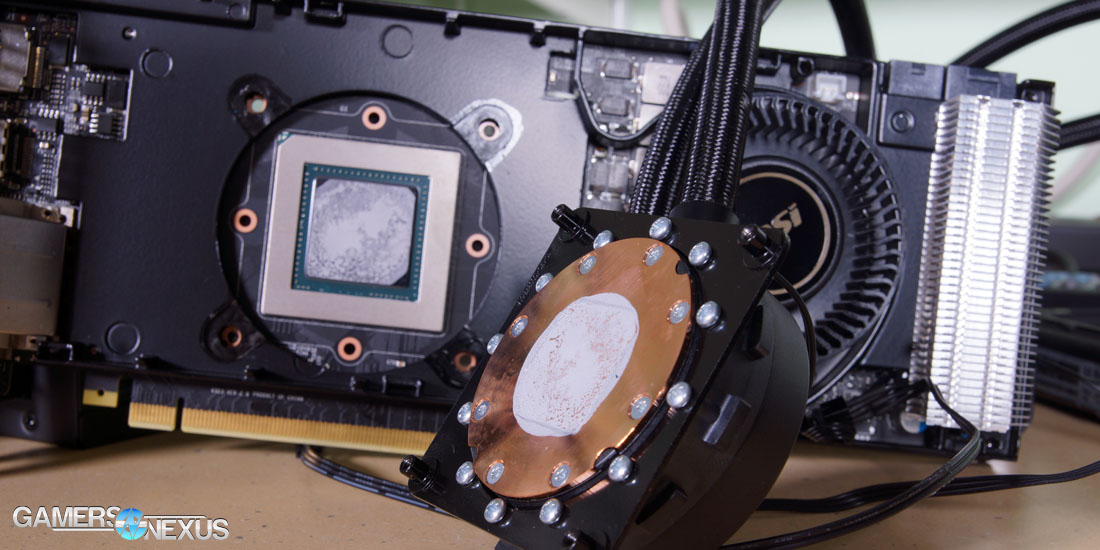
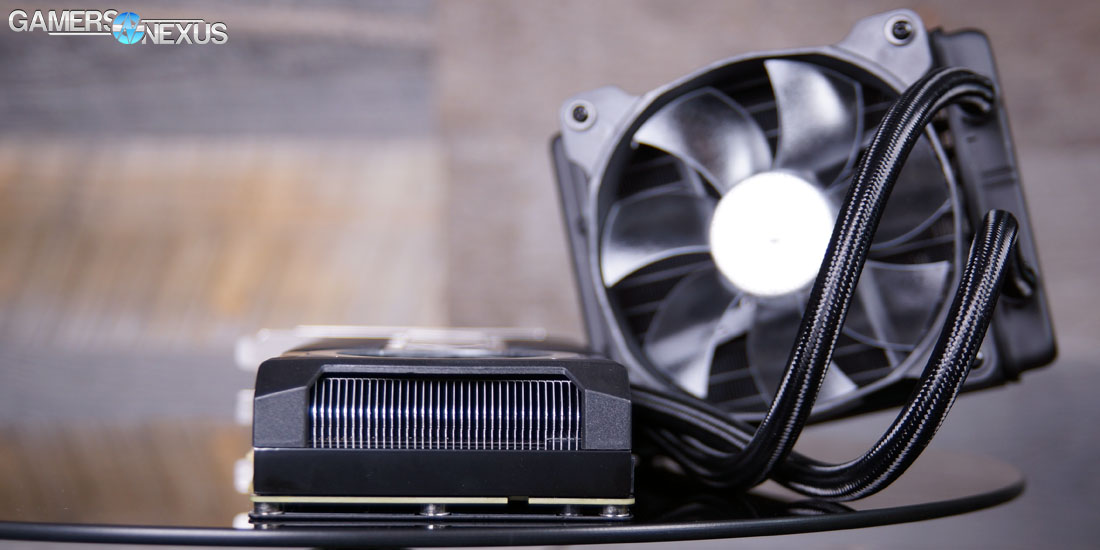
Above: Sea Hawk / Hydro GFX using an H55 CLC with CPU coldplate.

Above: EVGA Hybrid cooler uses a coldplate extrusion to improve GPU contact and performance.
Basic design is the same. Both cards use a plastic faceplate, a CLC bracket, an aluminum VRM heatsink, the reference PCB, and a blower VRM fan. Notably, EVGA just recently announced a free upgrade to an aluminum faceplate (which we think looks far better than the original launch); we suspect this is a response to MSI & Corsair launching the Sea Hawk.
Both cards use an Asetek-supplied liquid cooler, with the Sea Hawk using a Corsair-branded H55. The H55 is built for CPU cooling, but can be adapted to GPU cooling by way of a mounting bracket. This is where we must look for potential thermal dissipation differences.
The cooler on the EVGA Hybrid has a coldplate extrusion which directly contacts with the surface of the GPU. GPU package size and smoothness measure differently than that of a CPU – especially if the CPU CLC is built to fit multiple socket types – and this GPU-specific tuning could potentially have a large impact on thermal output. We'll test that below.
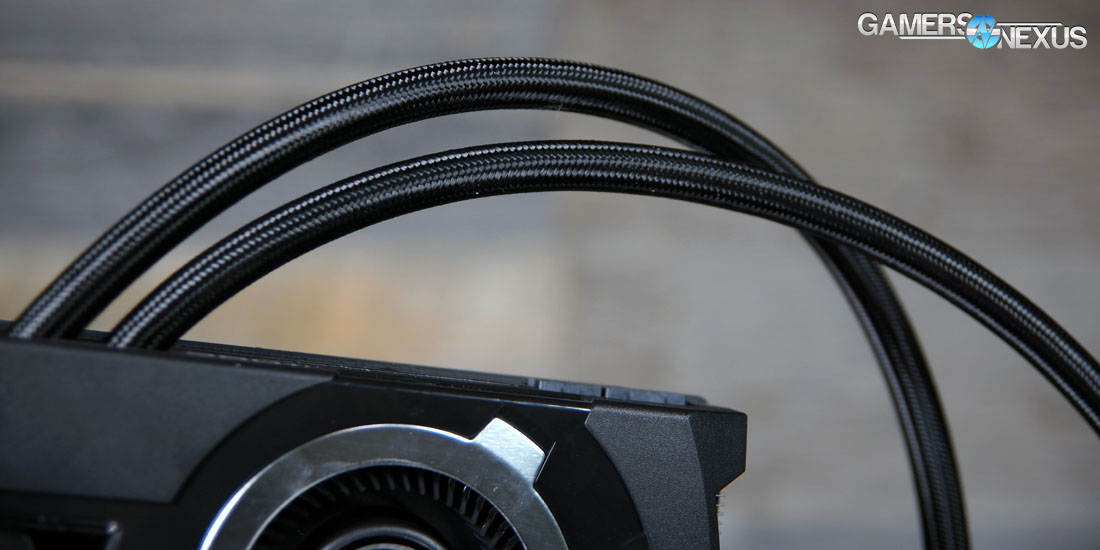
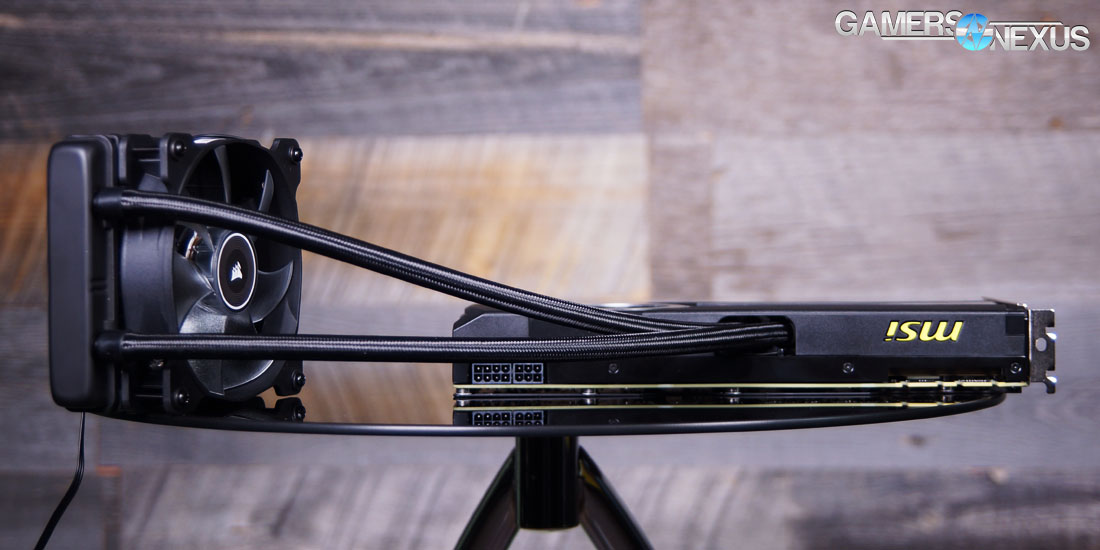
Above: We love the braided finish of the Sea Hawk's CLC tubing.
MSI uses a Corsair fan on its Sea Hawk radiator, complete with white LEDs and semi-transparent blades. The fan connects directly to the motherboard via 3-pin header.
EVGA, meanwhile, doesn't tool its own fan. The fan is a somewhat plain, all-black fan (think: what you'd find in a Rosewill or old Cooler Master case) with no LEDs or frills. EVGA's fan connects directly to a card-attached extension and receives voltage control directly from the GPU.
Test Methodology
We tested using our updated 2015 Multi-GPU test bench, detailed in the table below. Our thanks to supporting hardware vendors for supplying some of the test components.
The latest AMD Catalyst drivers (15.9.1) were used for testing, except in the case of the Fury X, which was on loan and has not been updated since 15.7. NVidia's 358.50 drivers were used for testing. Game settings were manually controlled for the DUT. All games were run at 'ultra' presets, with the exception of The Witcher 3, where we disabled HairWorks completely, disabled AA, and left SSAO on. GRID: Autosport saw custom settings with all lighting enabled. GTA V used two types of settings: Those with Advanced Graphics ("AG") on and those with them off, acting as a VRAM stress test.
Each game was tested for 30 seconds in an identical scenario, then repeated three times for parity.
| GN Test Bench 2015 | Name | Courtesy Of | Cost |
| Video Card | This is what we're testing! | MSI | $750 |
| CPU | Intel i7-5930K CPU | iBUYPOWER | $580 |
| Memory | Kingston 16GB DDR4 Predator | Kingston Tech. | $245 |
| Motherboard | EVGA X99 Classified | GamersNexus | $365 |
| Power Supply | NZXT 1200W HALE90 V2 | NZXT | $300 |
| SSD | HyperX Savage SSD | Kingston Tech. | $130 |
| Case | Top Deck Tech Station | GamersNexus | $250 |
| CPU Cooler | NZXT Kraken X41 CLC | NZXT | $110 |
Average FPS, 1% low, and 0.1% low times are measured. We do not measure maximum or minimum FPS results as we consider these numbers to be pure outliers. Instead, we take an average of the lowest 1% of results (1% low) to show real-world, noticeable dips; we then take an average of the lowest 0.1% of results for severe spikes. Anti-Aliasing was disabled in all tests except GRID: Autosport, which looks significantly better with its default 4xMSAA. HairWorks was disabled where prevalent. Manufacturer-specific technologies were used when present (CHS, PCSS).
Overclocking was performed incrementally using MSI Afterburner. Parity of overclocks was checked using GPU-Z. Overclocks were applied and tested for five minutes at a time and, if the test passed, would be incremented to the next step. Once a failure was provoked or instability found -- either through flickering / artifacts or through a driver failure -- we stepped-down the OC and ran a 30-minute endurance test using 3DMark's FireStrike Extreme on loop (GFX test 2).
Thermals and power draw were both measured using our secondary test bench, which we reserve for this purpose. The bench uses the below components. Thermals are measured using AIDA64. We execute an in-house automated script to ensure identical start and end times for the test. 3DMark FireStrike Extreme is executed on loop for 25 minutes and logged. Parity is checked with GPU-Z.
| GN Test Bench 2015 | Name | Courtesy Of | Cost |
| Video Card | This is what we're testing! | Various | - |
| CPU | Intel i7-4790K CPU | CyberPower | $340 |
| Memory | 32GB 2133MHz HyperX Savage RAM | Kingston Tech. | $300 |
| Motherboard | Gigabyte Z97X Gaming G1 | GamersNexus | $285 |
| Power Supply | NZXT 1200W HALE90 V2 | NZXT | $300 |
| SSD | HyperX Predator PCI-e SSD | Kingston Tech. | TBD |
| Case | Top Deck Tech Station | GamersNexus | $250 |
| CPU Cooler | Be Quiet! Dark Rock 3 | Be Quiet! | ~$60 |
Head over to Page 2 for thermal and power tests.
MSI / Corsair GTX 980 Ti Thermals Over Time & at Equilibrium
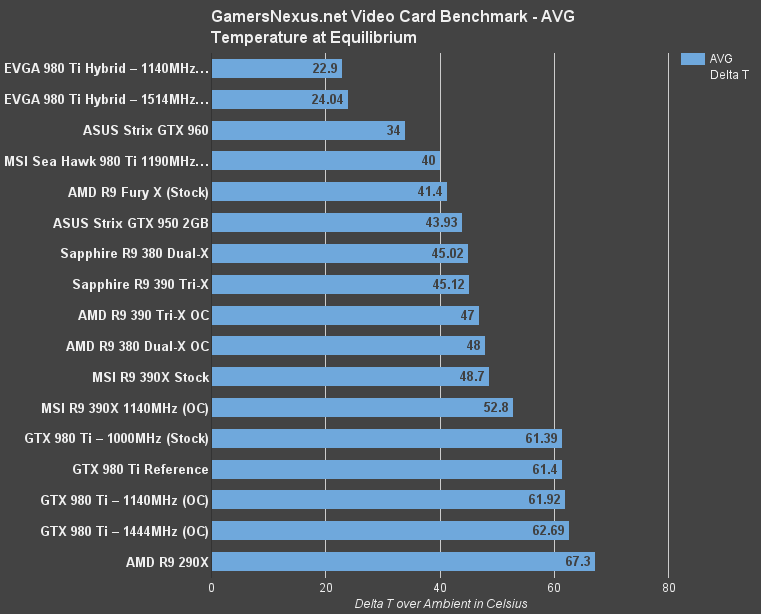
At equilibrium, the Sea Hawk GTX 980 Ti operates at about 40C delta T over ambient (21.6C), a 21.4C improvement over the reference nVidia 980 Ti cooler. The Hybrid nearly doubles that gap, though, with its 22.9C dT thermal performance.
The difference rests in the heatsink design, as we described above. EVGA's Hybrid utilizes a custom GPU cooling block with a large, unibody copper extrusion. Fan differences can also impact thermal performance.
Our Thermals Over Time bench is complete, but pending review by MSI & Corsair. We observed temperature fluctuation which suggests aggressive fan RPM modulation throughout the test. We will edit this post once we have heard back and validated the results.
MSI / Corsair GTX 980 Ti Power Draw

Our power benchmark measures total system load, which is the total power draw of the complete system when under full gaming load. Load is generated using FireStrike Extreme's “combined” tests (CPU + GPU) on loop.
The total system power draw with the Sea Hawk is just 392.76W (averaged, peak outlier was 406W), easily allowing users to build a high-end system with a 550W-600W PSU (leaving room for peak load).
Continue to Page 3 for the FPS & overclocking benchmarks!
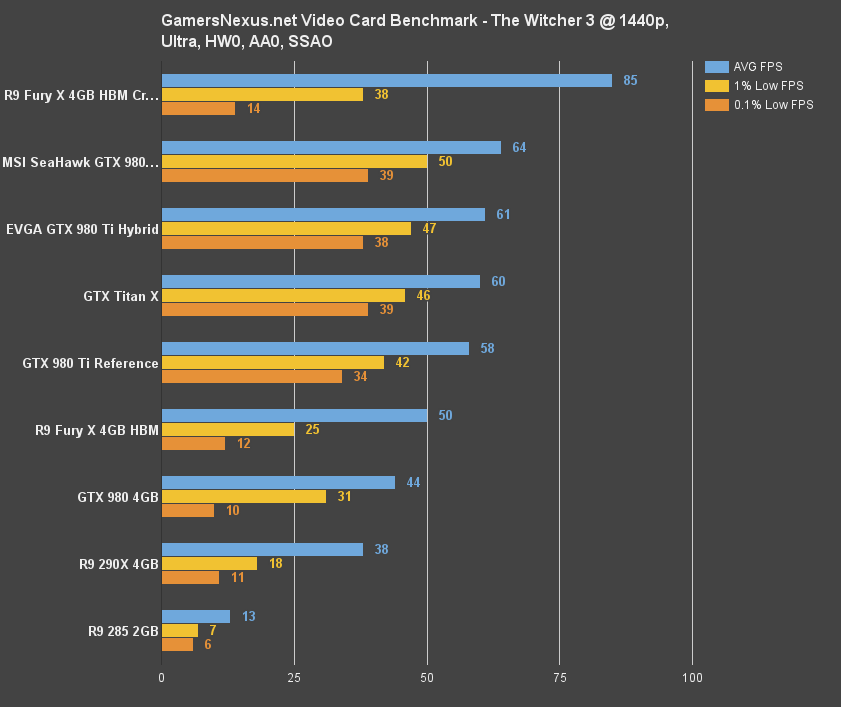
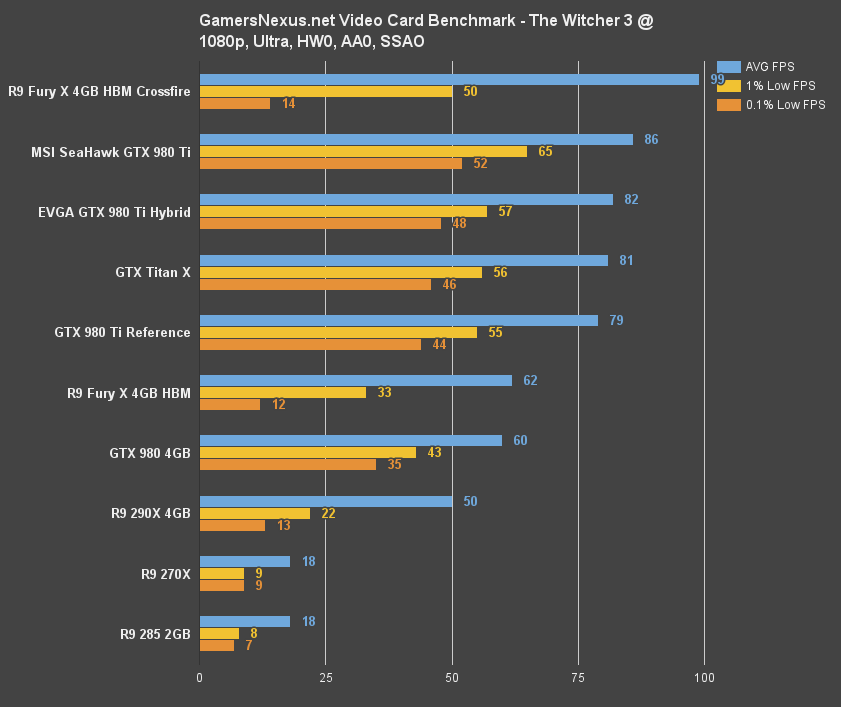
GTX 980 Ti Hydro GFX / Sea Hawk Benchmark – The Witcher 3
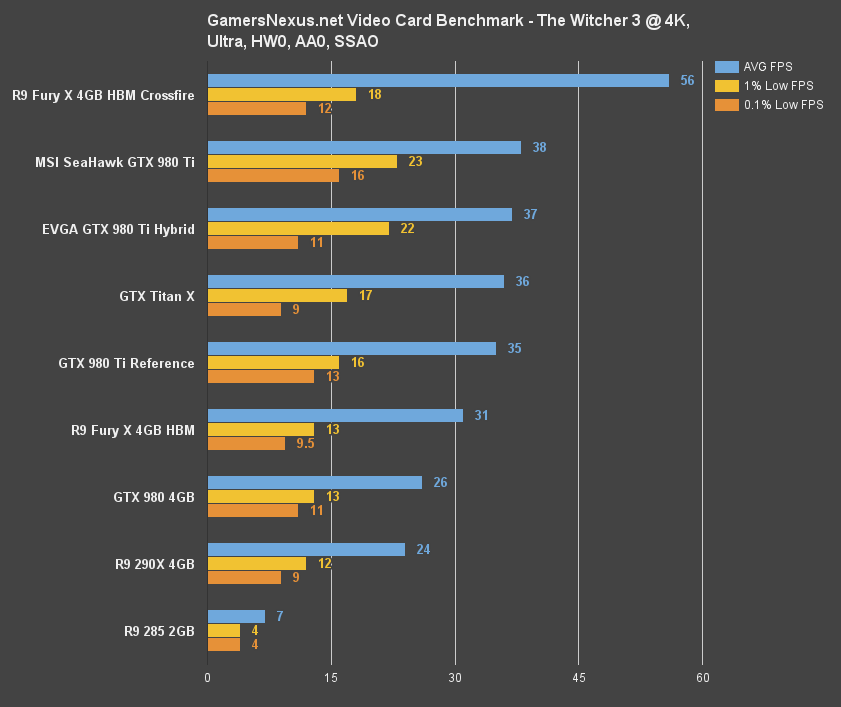
CD Projekt Red's The Witcher 3 is among the most demanding, load-intensive gaming titles at our disposal. The Witcher 3 represents a real-world use case that heavily loads the GPU, but has undergone substantial optimizations by CDPR since launch. For these tests, we disabled HairWorks completely, disable AA, and set ambient occlusion to SSAO to create an equal playing field.
The new MSI / Corsair GTX 980 Ti Sea Hawk (or “Hydro GFX,” if you prefer) outmatches EVGA's GTX 980 Ti Hybrid by a single frame-per-second, which is just barely outside of margin of error. It's a measured difference and displayed consistently through numerous test iterations – but only barely. Still, there's no denying that the Sea Hawk is, technically speaking, at an objective advantage here. That single frame is totally unnoticeable to gamers, but if we look to 1440p we see a more measurable (but still effectively unseen) difference of 4.8%. 1080p presents a 4.7% delta between the competing, liquid-cooled solutions.
Low percentile performance is matched on the two CLC-equipped cards.
The liquid-cooled cards hold an ~8-8.5% advantage over the reference 980 Ti, which has a significantly lower clockrate at 1000MHz / 1075MHz boost. This delta grows as we look at other games.
GTX 980 Ti Hydro GFX / Sea Hawk Benchmark – GTA V
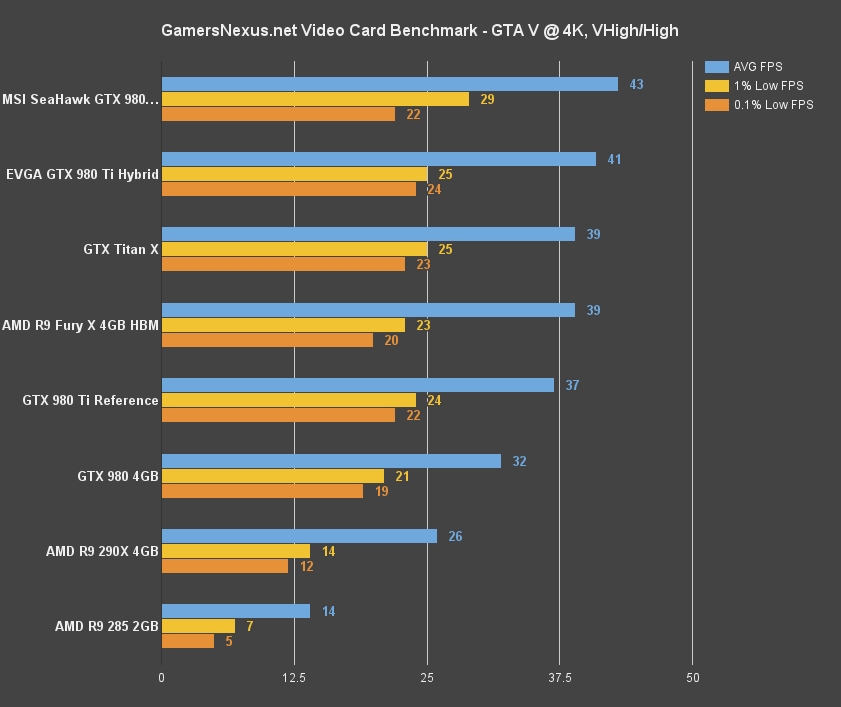

In GTA V at 4K – presenting a high-load scenario – we see a 15% difference emerge between the Sea Hawk and the reference GTX 980 Ti, which becomes a more tangible ~10FPS at 1440p (12.98%). Against the Hybrid, we again see a 4.7% to 6.3% difference (4K to 1440p), favoring the MSI Sea Hawk card. This advantage is yielded by nature of a faster native clockrate, but we'll see how the two truly compare in head-to-head overclocking.
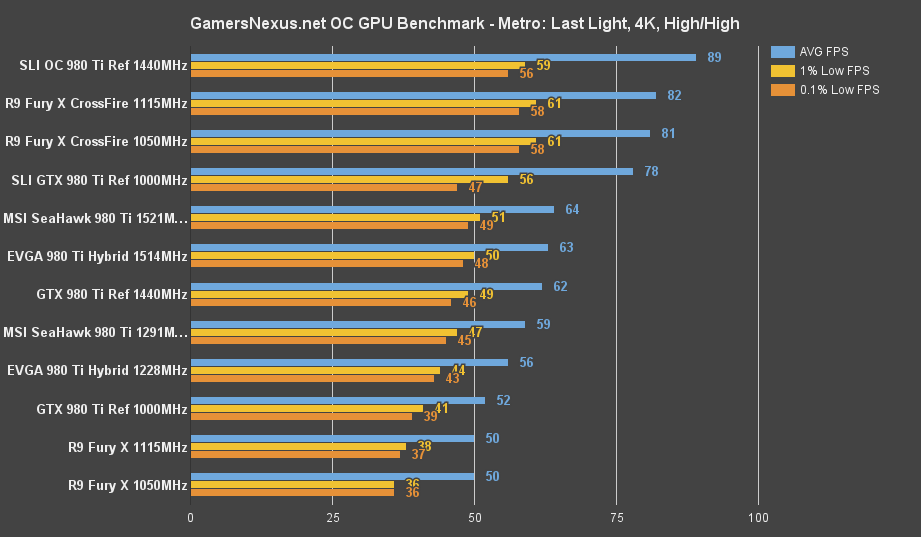
GTX 980 Ti Hydro GFX / Sea Hawk Benchmark – Metro: Last Light
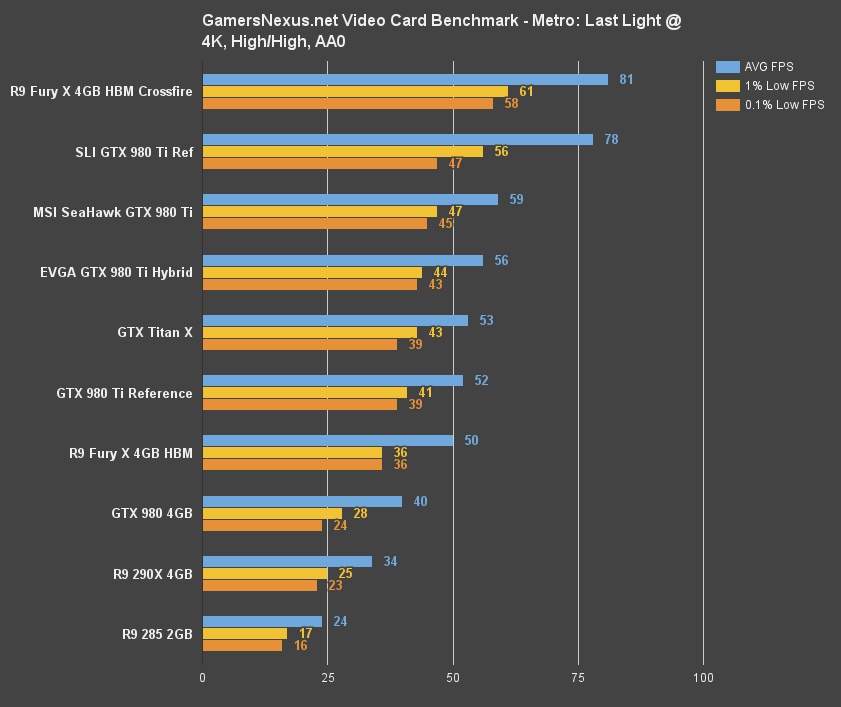
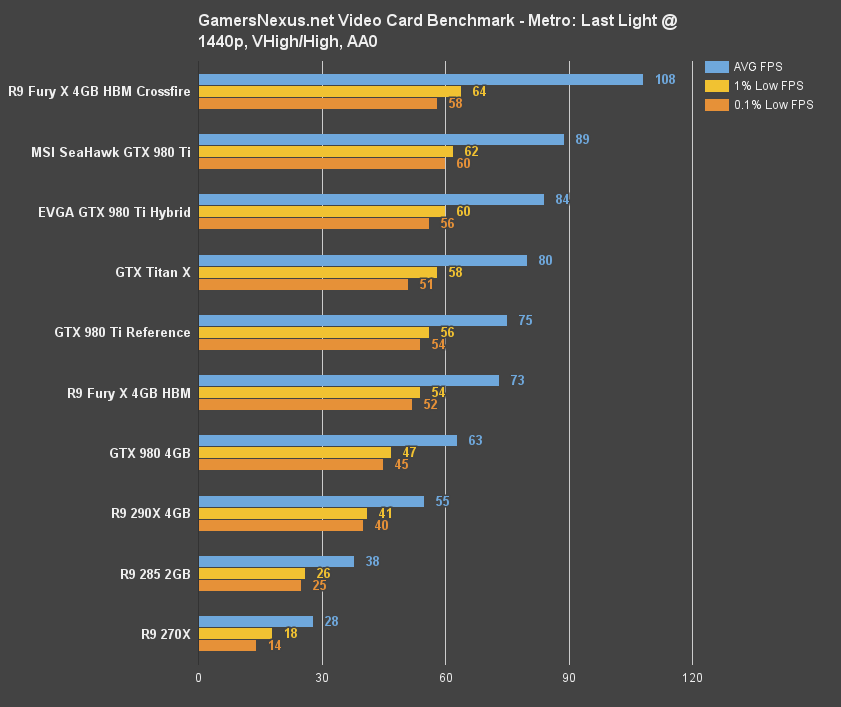
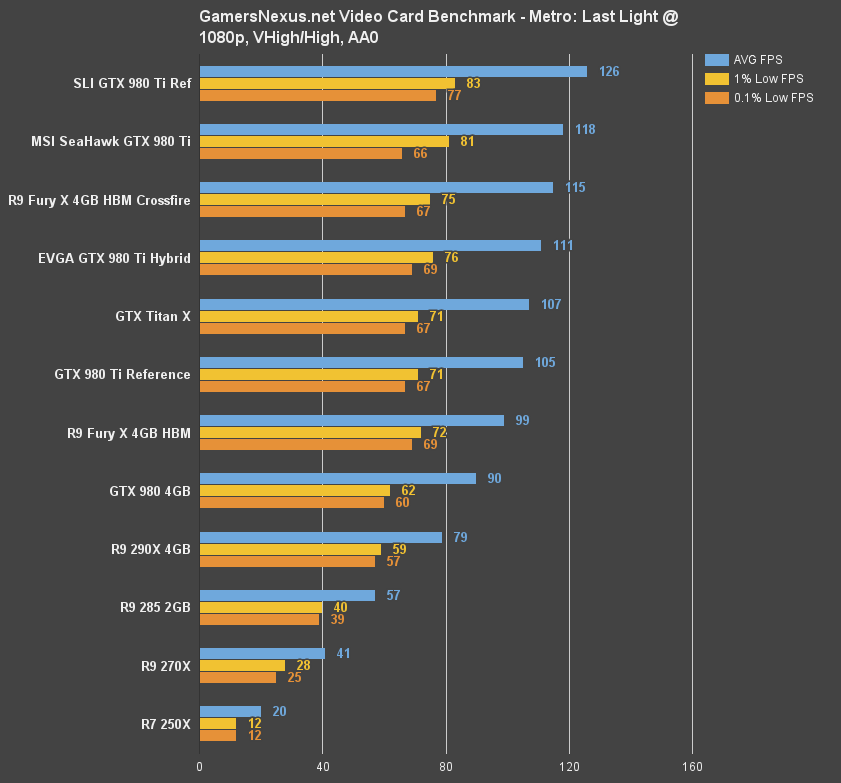
Metro: Last Light tests present another ~5% to 6% delta between the MSI and EVGA GPUs, favoring the MSI / Corsair team. The performance delta is still small enough to force consideration of other factors – like cost and efficacy of the cooling solutions – and not quite enough to create a noteworthy in-game difference.
GTX 980 Ti Hydro GFX / Sea Hawk Benchmark – GRID: Autosport

Again, we're at about a 6% delta between the two head-to-head cards. The gains over reference are somewhat large for the Sea Hawk, which leverages its pre-overclock for an 11FPS (14.5%) lead.
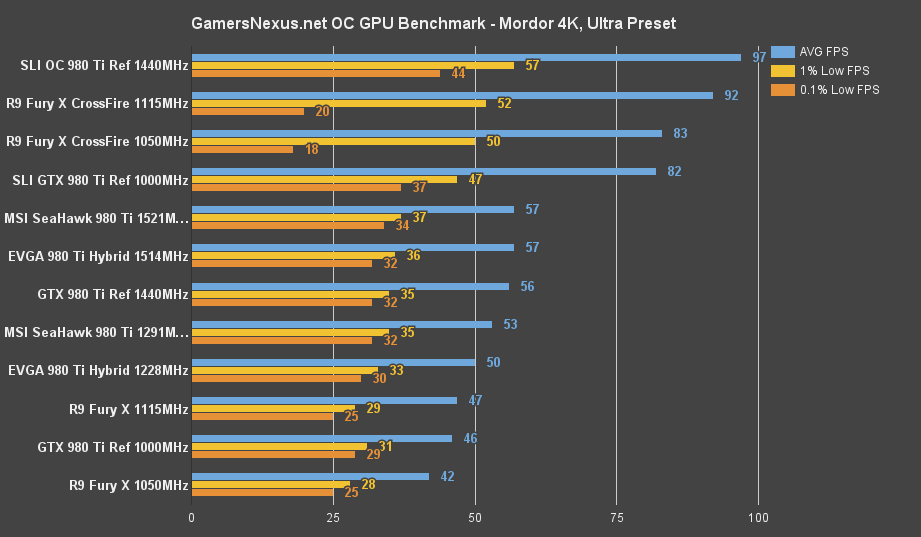
GTX 980 Ti Hydro GFX / Sea Hawk Benchmark – Shadow of Mordor
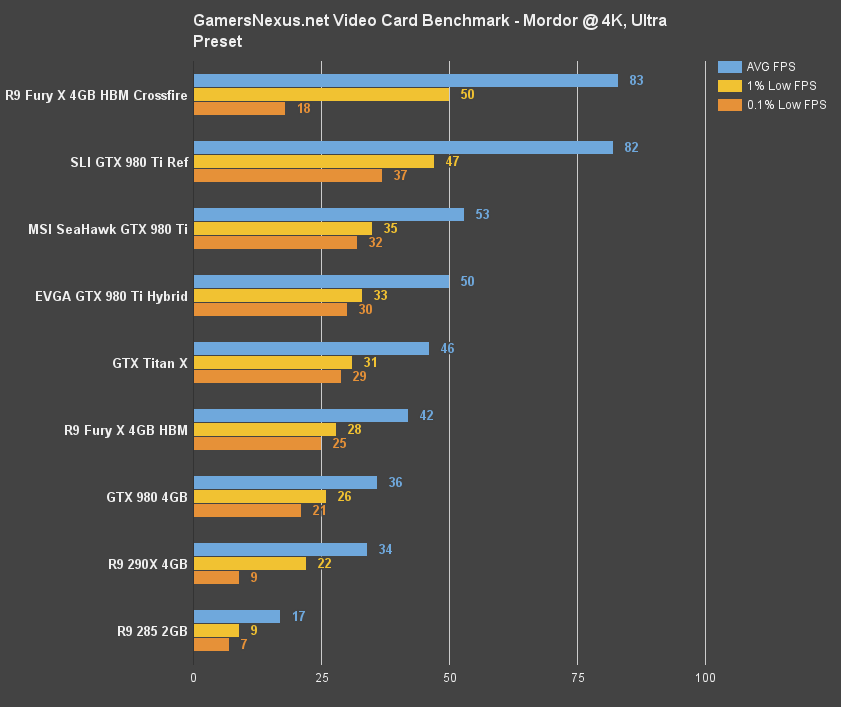
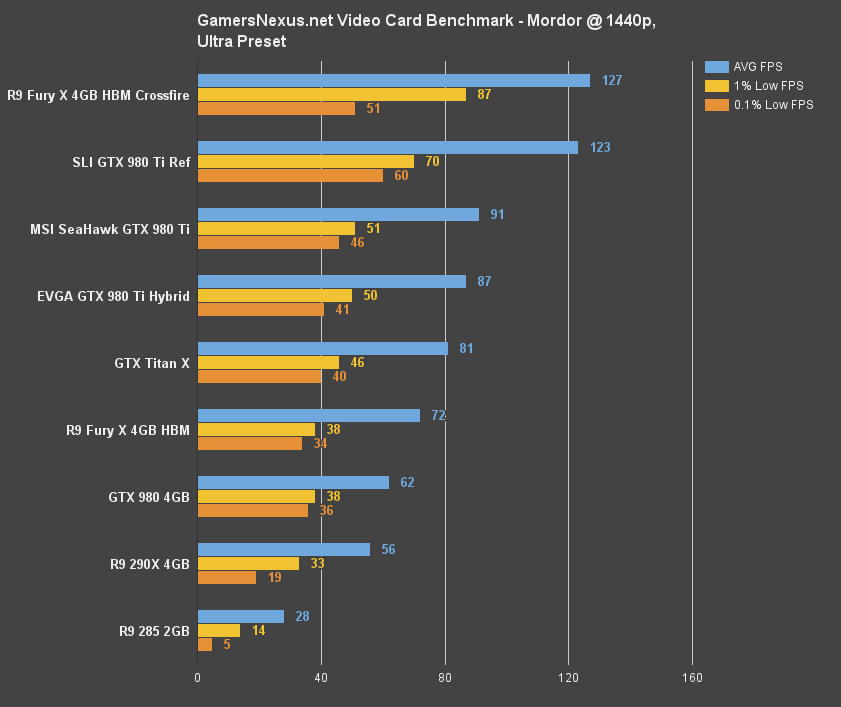
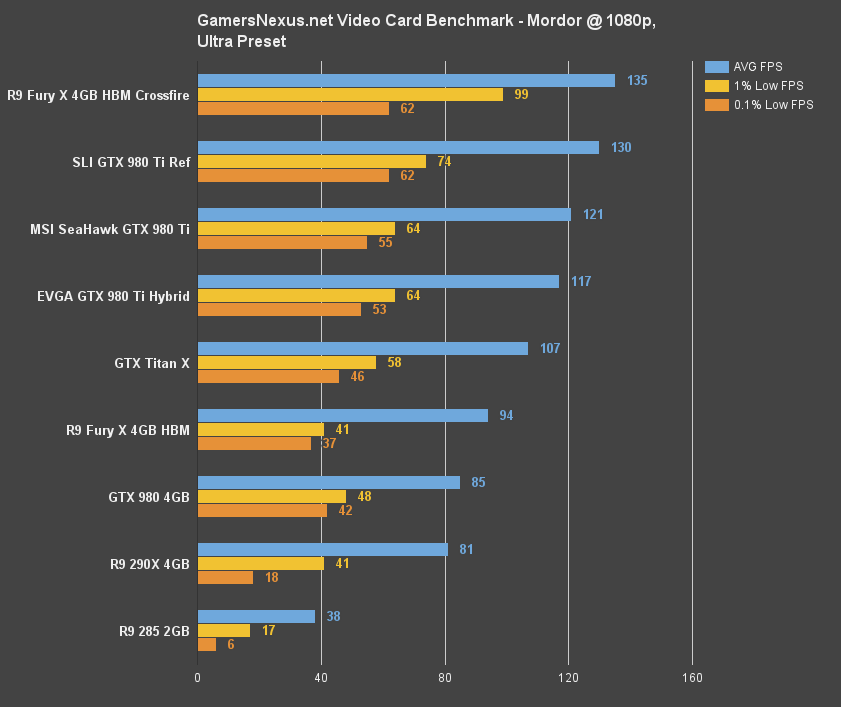
Our review of AMD's Fury X spotlighted Shadow of Mordor for its impressive SLI and CrossFire optimization, creating the massive gains we see at 4K in the above charts. Always a good thing, consistency between the MSI & EVGA liquid-cooling solutions shows a small-but-present lead for the MSI / Corsair solution. This remains true across 1440p and 1080p resolutions, the 980 Ti proving a capable solution for 1440p, high-framerate gaming.
Continue to Page 4 for overclocking results and the conclusion!
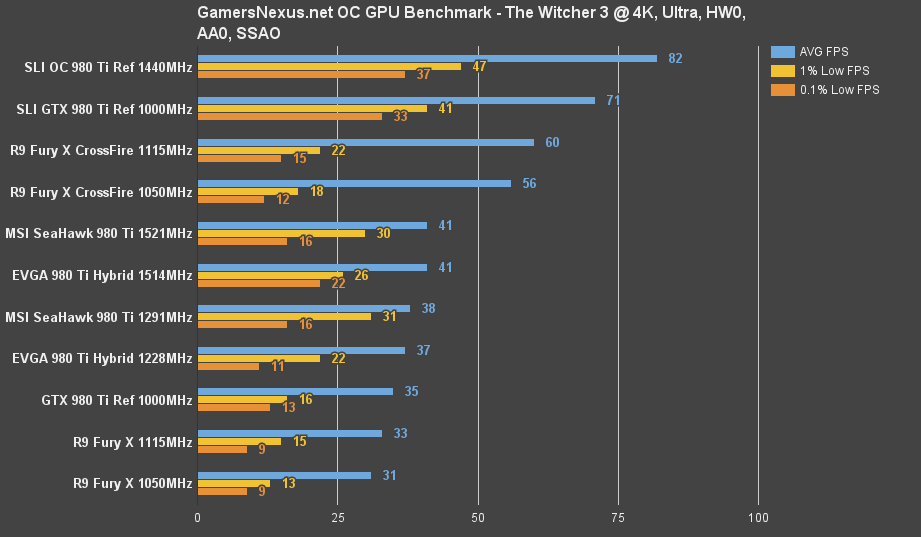
Overclocking Benchmarks
Here's where it becomes more of a duel. EVGA's GTX 980 Ti Hybrid ($710) proved to be the best card we've ever tested for overclocking, landing at a final core clock of 1514MHz and yielding a real-world FPS gain of 10-11.7%. Once overclocked, the Hybrid can surpass the MSI / Corsair Hydro GFX pre-overclock and become a threatening competitor at a similar price-point.
For overclocking, we configure the power percent target to its maximum value before adjusting voltage to its own max output. The 980 Ti Hybrid allows 110% of base power to be supplied to the GPU for overclocking and seems to hover around 1.224V after overvolting; the MSI Sea Hawk GTX 980 Ti has a 107% max base power (but a higher pre-overclock and higher base TDP) and hovers at 1.230V. We then slowly increment clockrate, observing for visual artifacting or catastrophic failures throughout the process. Each increment is left only for a few minutes before moving to the next step. We're eventually confronted with a driver failure, at which point the clockrate is backed-down, then endurance tested for 25 minutes using 3DMark Firestrike Extreme on loop.
Sea Hawk GTX 980 Ti / Hydro GFX Overclocking Table
| CLK Offset | Max Clock | Mem Offset | Mem CLK | Voltage | Initial Test | Endurance? |
| +0 | 1391MHz | +0 | 3548MHz | 1.187V | Pass | N/A |
| +60MHz | NA | +400MHz | 3948MHz | 1.200V | Fail Driver crash | N/A |
| +20MHz | 1412MHz | +0 | 3548MHz | 1.187V | Pass | N/A |
| +60MHz | 1455MHz | +0 | 3548MHz | 1.205V | Pass | N/A |
| +80MHz | 1484MHz | +0 | 3548MHz | 1.205V | Pass | N/A |
| +100MHz | 1504MHz | +0 | 3548MHz | 1.205V | Pass | Unstable |
| +100MHz | 1504MHz | +200MHz | 3748MHz | 1.205V | Pass | Fail |
| +100MHz | 1504MHz | +400MHz | 3948MHz | 1.205V | Fail | N/A |
| +100MHz | 1517MHz | +400MHz | 3948MHz | 1.230V | Pass | N/A |
| +100MHz | 1517MHz | +400MHz | 3947MHz | 1.230V | Pass | Fail |
| +110MHz | 1527MHz | +200MHz | 3748MHz | 1.230V | Pass | N/A |
| +120MHz | 1531MHz | +200MHz | 3748MHz | 1.230V | Pass | Fail |
| +105MHz | 1521MHz | +200MHz | 3748MHz | 1.230V | Pass | Pass |
| +105MHz | 1521MHz | +300MHz | 3848MHz | 1.230V | Pass | Pass |
The MSI Sea Hawk 980 Ti (“Corsair Hydro GFX”) achieved a maximum overclock of 1521MHz core, 3846MHz memory. While overclocking, we noticed severe instability at higher memory clocks; this is in spite of a strong core overclocking potential and limited our maximum combined OC. Memory clocks exceeding a +300MHz offset introduced driver failure and aggressive flickering. The EVGA Hybrid and reference 980 Ti both effortlessly achieve a 4001MHz memory clockrate (+500MHz offset), and the Hybrid has room to be pushed further. The MSI / Corsair memory OC limitation restricts the card to “just” 3846MHz, but this is still a fast clockrate and additional OC will not noticeably impact gaming, anyway.
Note: Given the way nVidia hardware boosts, the maximum clockrate logged does not always equal the advertised stock or Afterburner clockrates.
We were able to get the 980 Ti Hybrid to perform with stability at +160MHz offset, or 1514MHz. There was a brief period of stability at +170MHz (1524MHz boost), but volatility was found approximately twenty minutes into burn-in testing. We left the memory clock OC'd to +500MHz offset, though it could likely be pushed further with granular tweaking. Our main concern is the core and boost clocks.
GTX 980 Ti Hybrid Overclocking Table
| CLK Offset | Max Clock | Mem Offset | Mem CLK | Voltage | Initial Test | Endurance? |
| +100MHz | 1453MHz | +500MHz | 4001MHz | 1.224V | Pass | N/A |
| +120MHz | 1474MHz | +500MHz | 4001MHz | 1.224V | Pass | N/A |
| +130MHz | 1483MHz | +500MHz | 4001MHz | 1.224V | Pass | N/A |
| +140MHz | 1494MHz | +500MHz | 4001MHz | 1.224V | Pass | N/A |
| +160MHz | 1514MHz | +500MHz | 4001MHz | 1.224V | Pass | N/A |
| +175MHz | 1529MHz | +500MHz | 4001MHz | 1.224V | Pass | Unstable |
| +180MHz | 1533MHz | +500MHz | 4001MHz | 1.224V | Pass | Fail |
| +170MHz | 1524MHz | +500MHz | 4001MHz | 1.224V | Pass | Fail |
| +160MHz | 1514MHz | +500MHz | 4001MHz | 1.224V | Pass | Pass |
GTX 980 Ti Reference Overclocking Table
| CLK Offset | Max Clock | Mem Offset | Mem CLK | Voltage | Initial Test | Endurance? |
| +68MHz | 1245MHz | +500MHz | 4001MHz | 1.187V | Pass | N/A |
| +100MHz | 1289MHz | +500MHz | 4001MHz | 1.187V | Pass | N/A |
| +150MHz | 1339MHz | +500MHz | 4001MHz | 1.187V | Pass | N/A |
| +175MHz | 1364MHz | +500MHz | 4001MHz | 1.187V | Pass | N/A |
| +200MHz | 1389MHz | +500MHz | 4001MHz | 1.187V | Pass | N/A |
| +225MHz | 1414MHz | +500MHz | 4001MHz | 1.187V | Pass | N/A |
| +250MHz | 1439MHz | +500MHz | 4001MHz | 1.187V | Pass | N/A |
| +275MHz | 1464MHz | +500MHz | 4001MHz | 1.212V | Fail | Fail |
| +250MHz | 1427MHz | +500MHz | 4001MHz | 1.212V | Pass | Pass |
| +255MHz | 1444MHz | +500MHz | 4001MHz | 1.212V | Pass | Pass |
| +260MHz | 1450MHz | +500MHz | 4001MHz | 1.212V | Pass | Fail |
For the Hybrid and Sea Hawk, the 1514MHz & 1521MHz final clocks are a massive gain over the reference GTX 980 Ti's ~1444MHz overclock. Let's see how that impacts real-world gaming:
Conclusion
The MSI Sea Hawk GTX 980 Ti is now the top-performing stock card on our bench, taking the “Best of Bench” title from EVGA's 980 Ti Hybrid. A delta of just ~4% to 7% separates the EVGA Hybrid and MSI Sea Hawk, on average, with the Sea Hawk pulling ahead. The story changes as overclocking is introduced, where we see parity achieved and effectively identical performance, though another slight lead by the Sea Hawk.
Because the Hybrid is easily overclocked to the Sea Hawk's stock boost clockrate of 1291MHz, the FPS delta can be disregarded by users willing to invest a few minutes into overclocking. Both cards overclock well, with the Sea Hawk pushing just barely higher at 1521MHz (vs. 1514MHz), though this can be chalked-up to the silicon lottery. That noted, the Hybrid is superior in its memory overclocking abilities. Our Sea Hawk can't even reach the reference memory clock OC – though it comes close at 3846MHz against 4001MHz – and this is something we'd also attribute to silicon / binning lottery. As for real-world performance, a ~150MHz delta isn't enough to produce a reasonable FPS gain in any games.


Above: It's just one award -- but a product with two names is uncommon, so we did this.
The Sea Hawk falls between the Fury X and EVGA Hybrid when it comes to cooling, performing at 40C. The Hybrid's coldplate design is tuned for GPUs (rather than the Sea Hawk's H55 CPU CLC), yielding a tangible, impressive cooling advantage. Despite this, it's very important that we convey just how cool these cards are. Even with the ~19C gap observed between the two cards, neither is remotely close to the 61.4C dT equilibrium thermals of the reference 980 Ti. The Hybrid vs. Sea Hawk cooling differential will not reasonably impact product endurance, but it can – and will – impact thermals of neighboring components. Still, for the average user, both cards perform exceptionally well. It is undeniable that the Hybrid's performance is unrivaled at this time.
Laying it all out in easily consumed format, the pros and cons:
| MSI GTX 980 Ti Sea Hawk | EVGA GTX 980 Ti Hybrid | |
| Cooling Performance | Good +19C warmer | Best |
| Stock FPS Performance | Best +4-7% superior | Still impressive! Just no longer the "best." |
| OC Headroom (Base) | Best +7MHz OC, could be silicon lottery. | Very good |
| OC Headroom (Memory) | Good | Best easily +200MHz higher MEMCLK, could do more. |
| Price | $750 | $710 as of this review, but was normally $750-$770 |
The Sea Hawk is superior in its stock framerate benchmarks, if only just. The cards are effectively identical in OC potential, when providing margin of error for binned silicon; they achieve FPS parity when overclocked. The Hybrid is superior in its thermal dissipation abilities and is currently $40 cheaper, plus a free upgrade to the new alloy face plate.
As it stands today, with the sale price of the Hybrid, we think EVGA's card offers superior value at the $710 price-point. The Sea Hawk is still new and faces incumbent price drops, but is offered at $750 – the same price as the Hybrid used to be, or thereabouts – and is a device we would readily recommend. Should the Hybrid increase in price or should the Sea Hawk decrease, we would readily recommend either of these GPUs entirely contingent upon aesthetics and brand preference. Those two aspects are up to you – I won't comment on appearances here.
The Sea Hawk is now our Best of Bench single GPU graphics card, stealing the award from EVGA's nearby competition. The overclocking room is ample for enthusiast play and cooling keeps thermals under control, though could be improved with a GPU-specific coldplate. The minute the prices equalize, it becomes a toss-up that's entirely dependent upon superior stock FPS output (MSI) vs. superior thermals (EVGA); that, and brand preference.
Do you find our content helpful? Please consider helping us on Patreon.
- Steve “Lelldorianx” Burke.