Origin's pre-built “Chronos VR” machine is a mini-ITX box packed with top-tier hardware, hoping to resolve the “VR problem” while maintaining a small form factor. This presents unique thermal and noise challenges, making for interesting content regardless of whether or not the pre-built approach is for you.
In this review of Origin's Chronos VR computer, we'll benchmark FPS performance (GTX 1080 + 6700K), run extensive thermal tests, check noise levels, and look at power draw. Continue on for all of that.
Origin Chronos Specs
| CPU | Intel i7-6700K (OC 4.6GHz) |
| Motherboard | ASUS Z170i Pro Gaming |
| Video Card | GTX 1080 FE |
| Memory | 16GB HyperX 2666MHz |
| PSU | Corsair 450W SFX |
| SSD | 250GB Samsung 850 EVO |
| HDD | 2TB Seagate HDD |
| ODD | 8x DVD slim drive |
| Cooler | Frostbyte 120mm CLC |
Origin Chronos vs. DIY Cost Comparison
| Origin Chronos VR | DIY | Origin |
| CPU | i7-6700K ($350) | i7-6700K |
| GPU | NVIDIA GTX 1080 FE ($700) | NVIDIA GTX 1080 FE |
| Motherboard | ASUS Z170i Pro Gaming ($165) | ASUS Z170i Pro Gaming |
| RAM | 16GB 2666MHz HyperX Fury ($90) | 16GB 2666MHz HyperX Fury (“Origin RAM”) |
| SSD | Samsung 850 EVO 250GB ($100) | Samsung 850 EVO 250GB |
| HDD | 2TB Seagate Barracuda ($63) | |
| PSU | Corsair 450W SFX PSU ($90) | Corsair 450W SFX PSU |
| Case | SilverStone RVZ02 ($70) | Custom case |
| CPU Cooler | (Some aftermarket solution – assume ~$60) | 120mm CLC |
| ODD | Assume ~$30 for slim drive | Slim 8x DVD drive |
| Operating System | Microsoft Windows 10 ($100) | Windows 10 Home |
| Total | $1818 | $2396 |
Origin definitely runs a premium over its competition. The company sticks to an appearance similar to that of a “boutique shop,” and promises more direct customer relations (e.g. 24/7 support, which we audited) as a means to justify the up-charge. We've previously found larger outfits, like CyberPower and iBUYPOWER, to charge anywhere from $100-$300 more to build a system; for a service fee, that's really not bad in instances where DIY is undesired or not possible. Origin lands itself at roughly $578 more than the DIY approach (though does use a custom case, adds red LEDs, and pre-overclocks the system). It also appears that one of the video cards is priced incorrectly versus MSRP, though we're not really sure. On the Chronos VR web page, the relative (because absolute prices are not listed) prices of the RX 480 and GTX 1080 suggest that the 1080 is either $80 too expensive, or the RX 480 is $80 cheaper than MSRP. Might just be a listing issue.
We'll talk more about the value proposition toward the end.
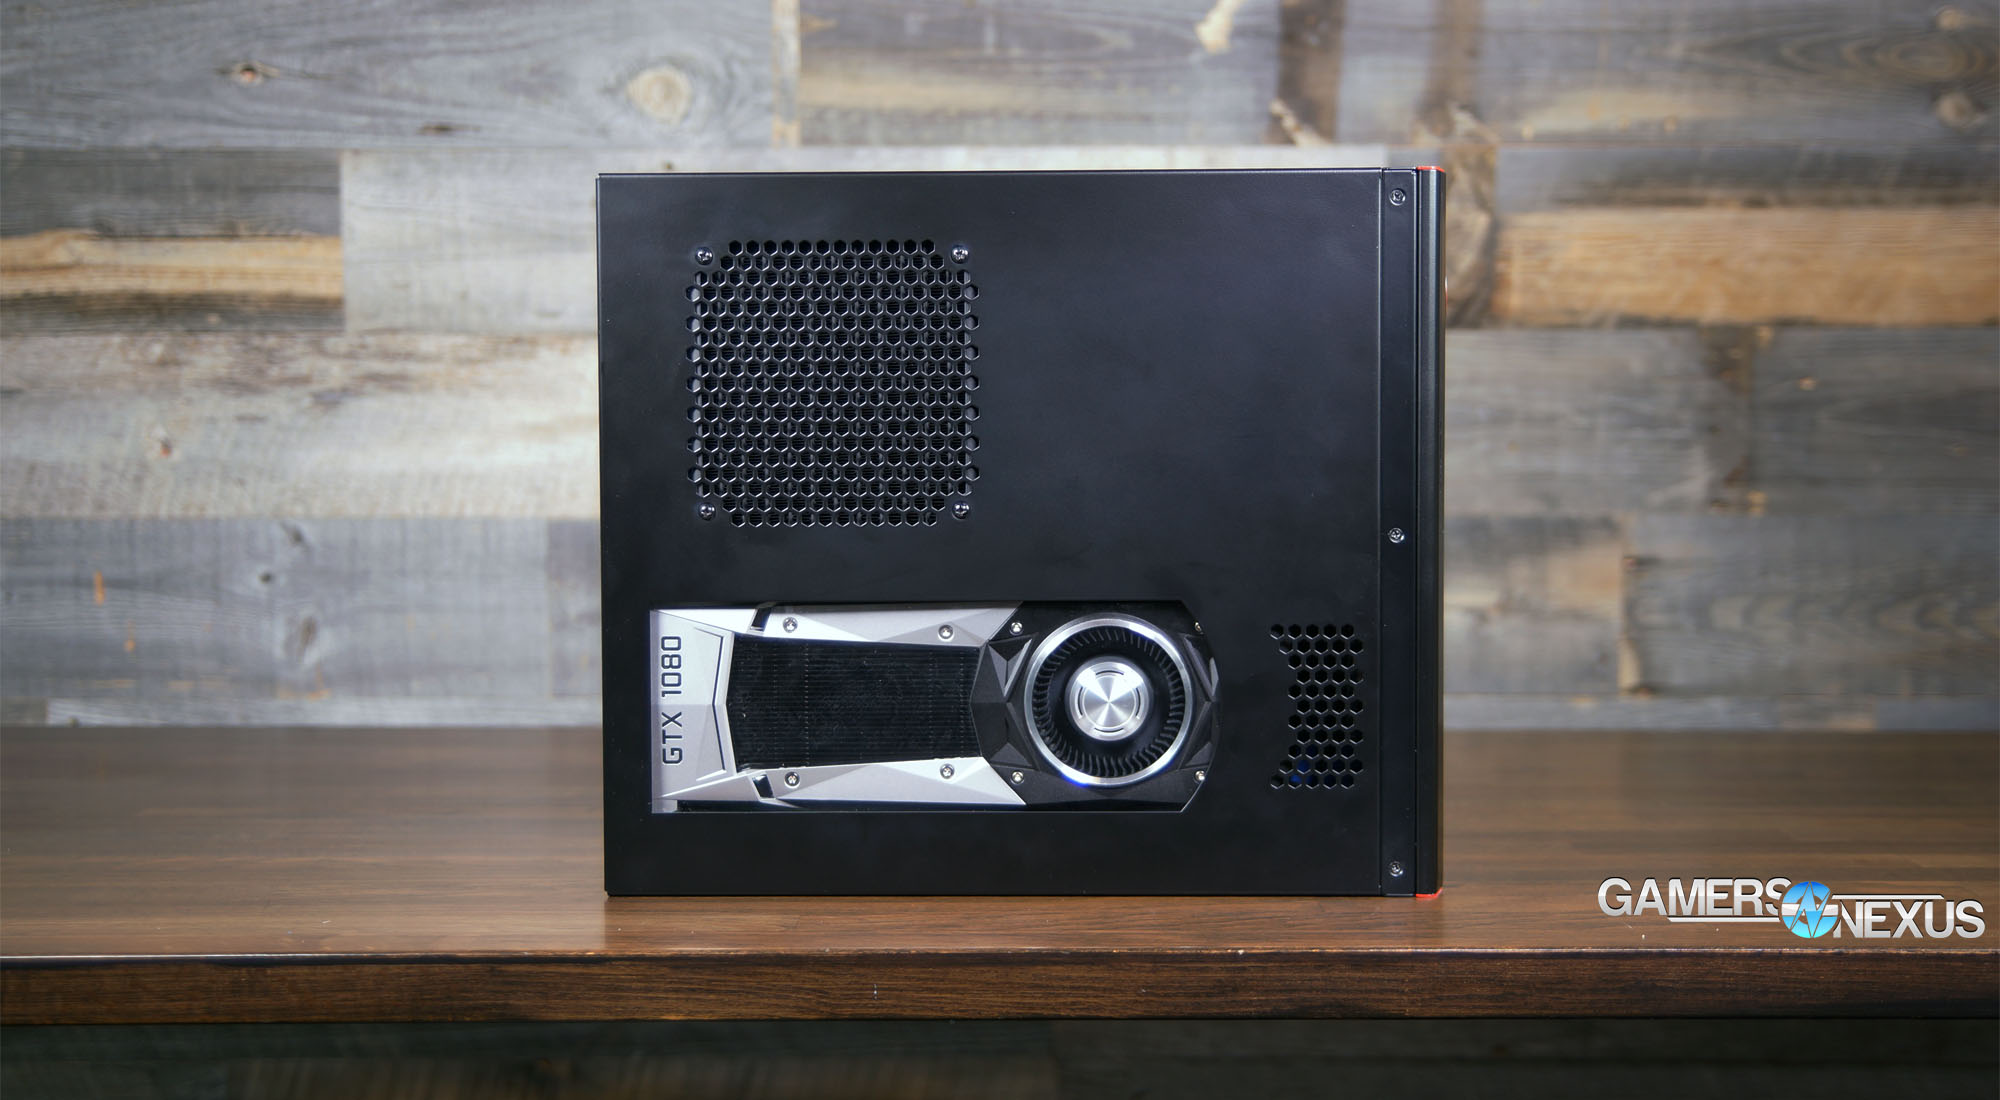
Origin Chronos VR Build Quality
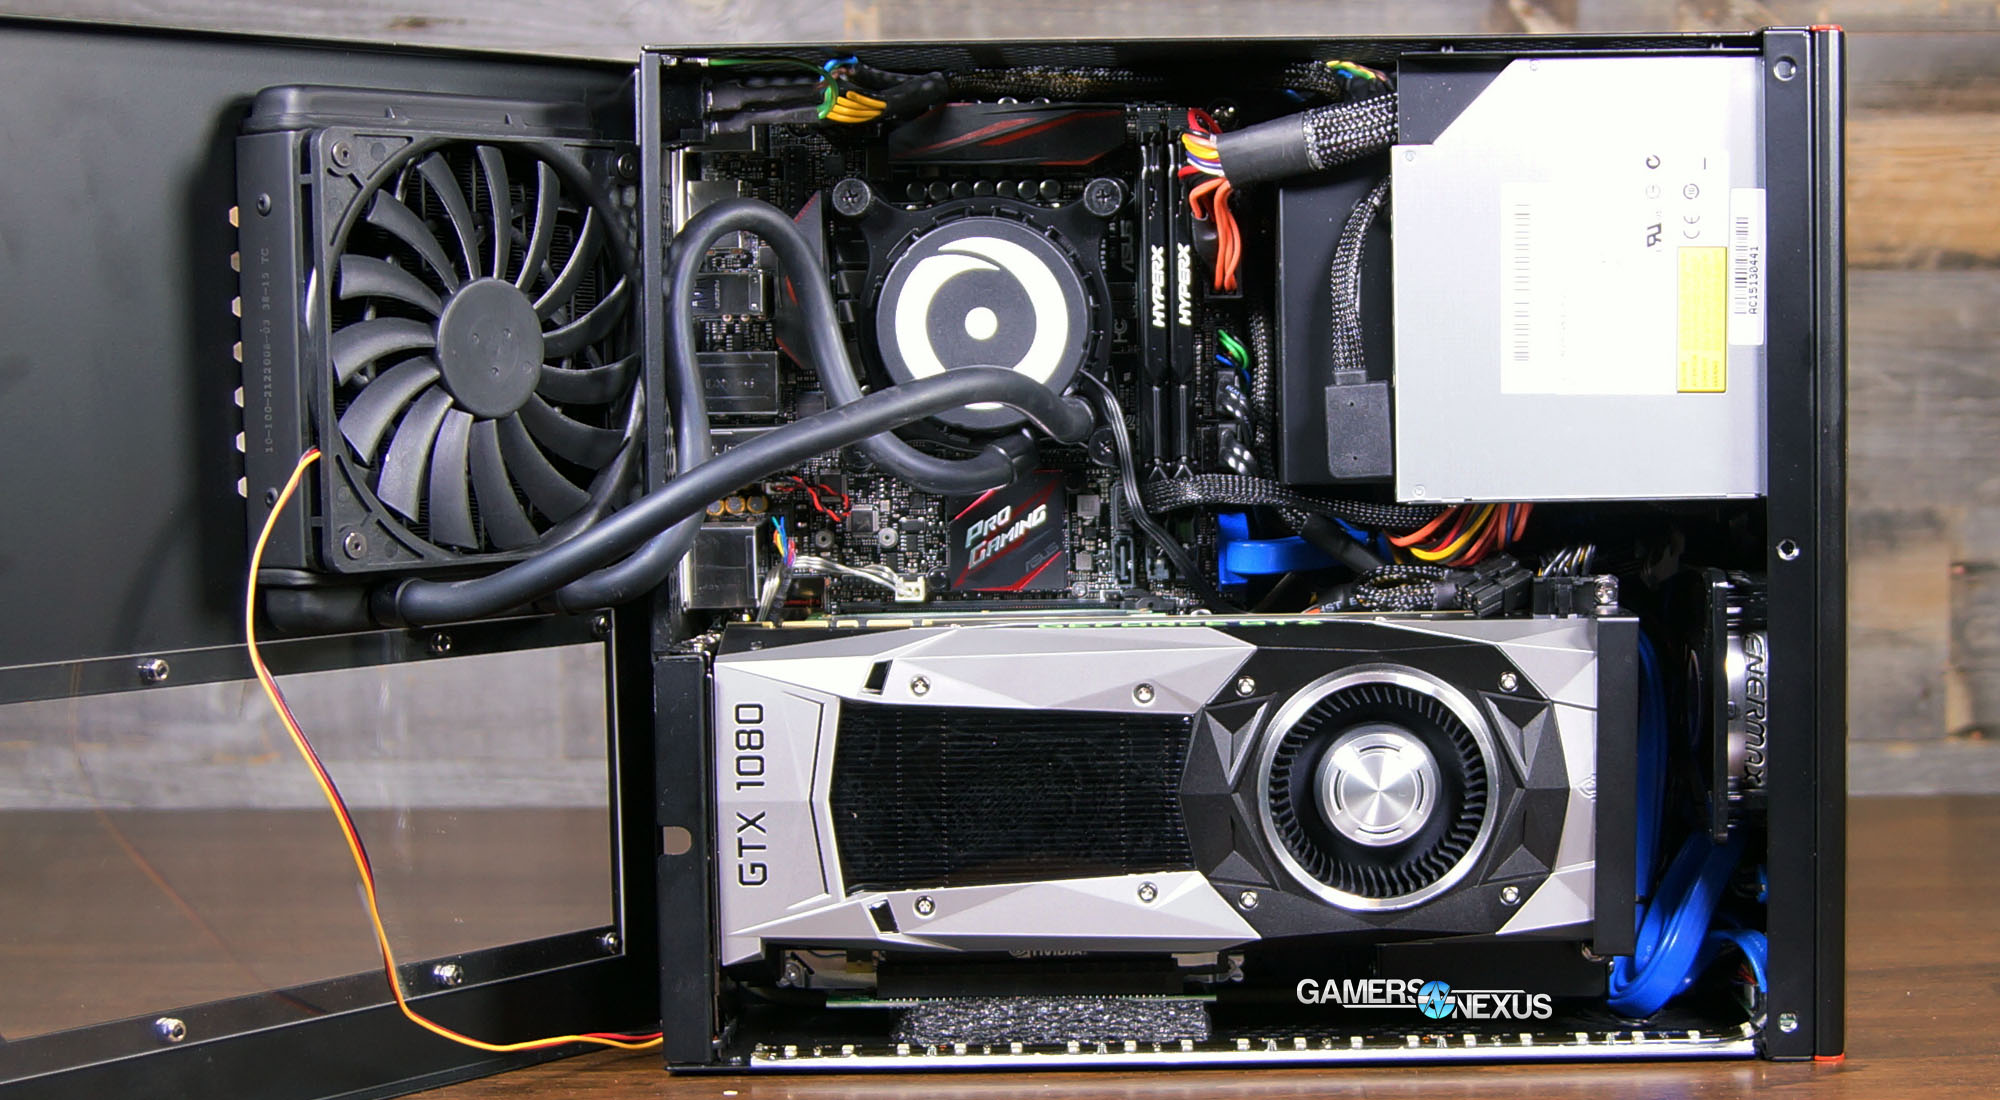
Component selection for the Origin Chronos VR is agreeable. The SFX 450W PSU is almost exactly what should be included in such a build, and many of Origin's competing system integrators will go way overkill on PSU selection. We've seen iBUYPOWER and CyberPower systems sometimes include 700-800W PSUs when totally unnecessary, and it's normally to fill some sort of MDF agreement with the PSU provider. It makes more sense to stick with a sensible power supply that's got higher quality components (and potentially lower, but sufficient wattage) than “more watts is more better.”
The rest of the components are pretty straight-forward – it's more-or-less a “pick the best things and put them in a computer,” which isn't too hard to succeed at. We agree that liquid is the way to go for CPU cooling in such a tight enclosure, but the cooler is still somewhat suffocated (as you'll see later) by the case design. We also think that, if a case with more radiator accommodation were designed, it'd make sense to go with a 'Hybrid' design video card. This is something we talk about in the Revolt 2 review.
One very small, irrelevant point of improvement: We think that Origin should replace the PCI-e riser cable with something that's all black, rather than the gray/black ensemble presently used. The current riser cable looks like it's been duct taped together, which doesn't really matter since it's not even visible through the window. Still, for sake of appearances and quality, and for sake of the inevitable photos that media and customers will take, we think it's a wise change.
Also, as a note, we've found that PCI-e riser cables do not significantly impact performance – so using a riser cable to display the faceplate is a decision we agree with.
The enclosure itself uses steel side panels and has the heft of quality to it. The box would be reliable for LAN events or systems that get moved frequently. We would not recommend the box for HTPC environments, for reasons described below. As a LAN or portable gaming box, though, the form factor is perfect.
Origin Chronos VR Tech Support Undercover Audit
Origin makes big claims to its technical and sales support, highlighting frequently that support is available 24/7 and staffed with competent PC builders. As part of our SI reviews, we've decided to start running “undercover” audits of support teams. We called Origin PC's technical support line and feigned ignorance, acting the role of an existing customer. The question at hand: “I downloaded some software that says my GPU is running at 90C. Is that normal?” This value was completely made-up (though … stay tuned for the thermal tests), and was just a test of what support would recommend.
The response was an instant, “uhh, no” – the correct response, accompanied with some suggestions to check Precision/Afterburner for low fan speed settings, check for dust, and other normal issues that would increase thermals. We agreed with the suggestions made by the support rep, and would rate Origin's technical support as “competent.” We tried calling two times: The first was at 7:30PM EST, which resulted in a 25-minute hold time and eventually giving up; the second was at 3:40PM EST, and the call was answered within 5 minutes. We think that Origin should add a “press X to receive a callback” feature for long hold times.
The sales team, as expected, answered our call in about one minute. We asked what components would be recommended for a PC capable of playing games at high/ultra settings with 1080p or 1440p resolution (did not definitively state which, but provided both options). The sales rep suggested a GTX 1070, then told us that 8GB of RAM is all we'd need. We asked, feigning ignorance, if 8GB is “really enough” for gaming and viewing streams, and the support rep emphatically stated that 16GB would be “overkill” for our needs. This was agreeable, and is also fairly competent. It's not like Origin was just recommending the most expensive parts.
A brief portion of these calls is contained within the video review, embedded above.
Game Test Methodology
The latest NVIDIA 368.69 drivers were used for game (FPS) testing. Game settings were manually controlled for the DUT. All games were run at presets defined in their respective charts. We disable brand-supported technologies in games, like The Witcher 3's HairWorks and HBAO. All other game settings are defined in respective game benchmarks, which we publish separately from GPU reviews. Our test courses, in the event manual testing is executed, are also uploaded within that content. This allows others to replicate our results by studying our bench courses. In AMD Radeon Settings, we disable all AMD "optimization" of graphics settings, e.g. filtration, tessellation, and AA techniques. This is to ensure that games are compared as "apples to apples" graphics output. We leave the application in control of its graphics, rather than the IHV.
Windows 10-64 build 10586 was used for testing.
Each game was tested for 30 seconds in an identical scenario, then repeated three times for parity.
Average FPS, 1% low, and 0.1% low times are measured. We do not measure maximum or minimum FPS results as we consider these numbers to be pure outliers. Instead, we take an average of the lowest 1% of results (1% low) to show real-world, noticeable dips; we then take an average of the lowest 0.1% of results for severe spikes.
Thermal Test Methodology
We strongly believe that our thermal testing methodology is the best on this side of the tech-media industry. We've validated our testing methodology with thermal chambers and have proven near-perfect accuracy of results.
Conducting thermal tests requires careful measurement of temperatures in the surrounding environment. We control for ambient by constantly measuring temperatures with K-Type thermocouples and infrared readers. We then produce charts using a Delta T(emperature) over Ambient value. This value subtracts the thermo-logged ambient value from the measured diode temperatures, producing a delta report of thermals. AIDA64 is used for logging thermals of silicon components, including the GPU diode. We additionally log core utilization and frequencies to ensure all components are firing as expected. Voltage levels are measured in addition to fan speeds, frequencies, and thermals. GPU-Z is deployed for redundancy and validation against AIDA64.
All open bench fans are configured to their maximum speed and connected straight to the PSU. This ensures minimal variance when testing, as automatically controlled fan speeds will reduce reliability of benchmarking. The CPU fan is set to use a custom fan curve that was devised in-house after a series of testing. We use a custom-built open air bench that mounts the CPU radiator out of the way of the airflow channels influencing the GPU, so the CPU heat is dumped where it will have no measurable impact on GPU temperatures.
We use an AMPROBE multi-diode thermocouple reader to log ambient actively. This ambient measurement is used to monitor fluctuations and is subtracted from absolute GPU diode readings to produce a delta value. For these tests, we configured the thermocouple reader's logging interval to 1s, matching the logging interval of GPU-Z and AIDA64. Data is calculated using a custom, in-house spreadsheet and software solution.
Endurance tests are conducted for new architectures or devices of particular interest, like the GTX 1080, R9 Fury X, or GTX 980 Ti Hybrid from EVGA. These endurance tests report temperature versus frequency (sometimes versus FPS), providing a look at how cards interact in real-world gaming scenarios over extended periods of time. Because benchmarks do not inherently burn-in a card for a reasonable play period, we use this test method as a net to isolate and discover issues of thermal throttling or frequency tolerance to temperature.
Our test starts with a two-minute idle period to gauge non-gaming performance. A script automatically triggers the beginning of a GPU-intensive benchmark running MSI Kombustor – Titan Lakes for 1080s. Because we use an in-house script, we are able to perfectly execute and align our tests between passes.
For system testing (e.g. SI systems), we leave them in their stock configurations -- so all fans are left precisely to the way they were configured when the system was built.
Noise Testing Methodology
Our noise testing methodology is new and still being revised, but has been kept consistent across all tests contained herein. We test noise in a real-world environment and do not presently use an anechoic chamber. The results align with what consumers will encounter in their own rooms.
We use a REED logging dB meter mounted to a tripod, whose mic is positioned 20” from the side panel of the computer. The REED meter is approximately 6” above the bench. The system is left in its default fan configuration.
A noise floor measurement is taken prior to each test's execution to determine ambient without any systems running in the room. We then take an idle measurement (GPU & CPU at idle). Our noise floor has a fluctuation of approximately +/-0.6dB.
Noise levels are logarithmic, and are therefore not as simple to perform delta calculations as thermals or framerates. Noise percent differences are calculated using dB=20*log(V2/V1) (where V is amplitude). You cannot perform a simple percent difference calculation to determine the delta. For an example, a 10dB range (50dB vs. 40dB) is not equal to a 22% delta. One flaw in this methodology is that frequency is not taken into account, so you must rely on subjective notes within the noise testing section to find out if the system is higher or lower pitched.
After the noise floor is determined, we log idle fan dB, 50% speed dB, and 100% speed dB (configured in Afterburner). We also measure auto fan dB at an identical stepping for every test; we do this by running FireStrike Ultra for exactly 5 minutes prior to beginning dB logging, which is useful for fans which use two push fans. Some dual-push fan cards will only trigger the second fan if the VRM is under load.
Power Testing Methodology
Power consumption is measured at the system level. You can read a full power consumption guide and watt requirements here. When reading power consumption charts, do not read them as a component-specific requirements – this is a system-level power draw.
Power draw is measured during a FireStrike Ultra - Combined run.
Origin Chronos Thermal Benchmark – Averaged Peak Thermals
Thermal data is where we excel. Our data is mostly presenting temperature as a “Delta T over Ambient” values (learn about what that means here), though we have a few “absolute” temperature tests to depict values over time with ambient added in, mostly highlighting throttle thresholds.
The Chronos VR box runs hot, which is the risk of running a small form factor box with overclocked components and limited ventilation. Here's a look at our averaged peak thermal test, which takes several hundred lines of data and averages the “equilibrium” (stable) thermal value:
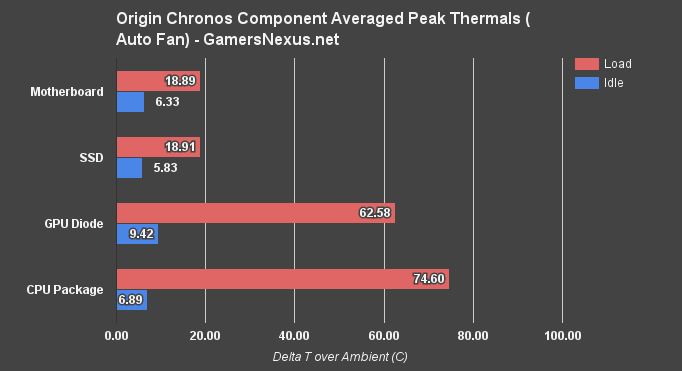
The Origin Chronos VR hits 74.6C delta T over ambient for the CPU cores averaged, which means several of the cores are actually hitting 100C and throttling when exceeding TjMax. This is unacceptably hot, we think, and shows that the thermal design of this enclosure has room for improvement. SFF cases can definitely be done right, and don't have to be large if following SilverStone's example.
GPU temperatures are also fairly high. Our GTX 1080 FE review found that the Pascal chip hits its ideal max temperature at 81C, after which point (82C onward) the card will throttle its clock-rate in effort to maintain temperatures. Origin's Chronos VR has the GPU hitting a temperature of 62.58C peak average, which puts it in the range of ~88C when measuring with ambient.
Out of curiosity, we removed the acrylic window concealing the GPU to test thermals without the obstruction. Theoretically, a blower fan should be pulling air in through the side ventilation (for nVidia, anyway), but a panel still creates something like a diathermic wall that can trap heat to some degree:
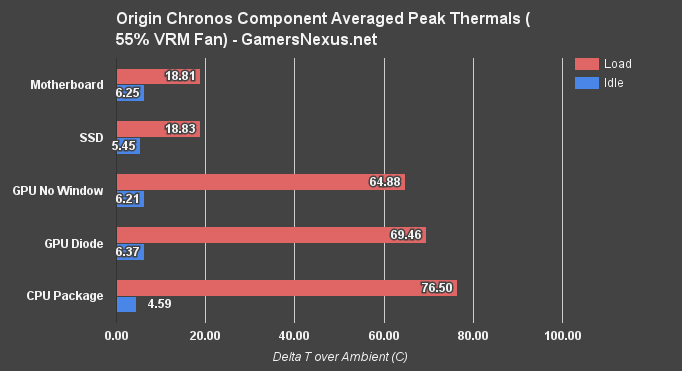
This test had both fans configured to 55% speed, so there was no fluctuation in fan RPM during the above. The point was just to see if the window is suffocating the fan – and it is. We'd recommend to Origin that they cut some intake holes in the acrylic window. It doesn't need to be mesh, but a few drilled holes would help. We're seeing a ~5C difference, in some instances. That's a big deal when the GPU is as hot as this one is.
Origin has overclocked the GTX 1080 FE and allows for a greater fan RPM range (up to 100%, without the usual lock favoring noise), but this only helps so much. We'll show that in the next charts. Before that, here's an excerpt of some of the data rows for the “auto” tests:
| Time (s) | CPU *C | CPU PKG | CPU IA Cores | CPU 1 | CPU 2 | CPU 3 | CPU 4 | GPU 1 |
| 883 | 89 | 101 | 101 | 100 | 100 | 94 | 92 | 88 |
| 884 | 89 | 99 | 99 | 89 | 97 | 100 | 89 | 88 |
| 885 | 89 | 100 | 100 | 88 | 96 | 100 | 87 | 87 |
| 886 | 89 | 100 | 100 | 95 | 99 | 97 | 87 | 88 |
| 887 | 88 | 100 | 100 | 95 | 95 | 100 | 88 | 88 |
| 888 | 88 | 100 | 100 | 95 | 100 | 95 | 90 | 88 |
| 889 | 89 | 100 | 100 | 95 | 99 | 100 | 90 | 88 |
| 890 | 89 | 99 | 99 | 95 | 96 | 100 | 92 | 88 |
| 891 | 88 | 100 | 100 | 94 | 100 | 96 | 89 | 88 |
| 892 | 89 | 99 | 99 | 95 | 96 | 100 | 90 | 88 |
| 893 | 89 | 101 | 101 | 90 | 99 | 100 | 92 | 88 |
| 894 | 88 | 100 | 100 | 95 | 97 | 100 | 89 | 88 |
| 895 | 89 | 99 | 99 | 99 | 100 | 99 | 88 | 88 |
| 896 | 89 | 99 | 99 | 95 | 95 | 100 | 91 | 88 |
| 897 | 89 | 100 | 100 | 96 | 100 | 99 | 91 | 88 |
| 898 | 89 | 99 | 99 | 92 | 99 | 100 | 89 | 88 |
| 899 | 89 | 100 | 100 | 93 | 100 | 93 | 91 | 88 |
| 900 | 89 | 100 | 100 | 95 | 100 | 97 | 92 | 88 |
| 901 | 88 | 100 | 100 | 98 | 99 | 97 | 93 | 88 |
| 902 | 88 | 100 | 100 | 97 | 100 | 97 | 90 | 88 |
| 903 | 88 | 101 | 101 | 95 | 100 | 88 | 91 | 88 |
| 904 | 89 | 98 | 98 | 96 | 98 | 100 | 89 | 88 |
| 905 | 89 | 99 | 99 | 95 | 99 | 100 | 85 | 88 |
| 906 | 89 | 100 | 100 | 96 | 100 | 95 | 92 | 88 |
| 907 | 88 | 100 | 100 | 93 | 97 | 99 | 85 | 88 |
| 908 | 88 | 100 | 100 | 96 | 100 | 96 | 91 | 88 |
| 909 | 89 | 100 | 100 | 97 | 98 | 100 | 85 | 88 |
| 910 | 89 | 100 | 100 | 92 | 99 | 97 | 90 | 88 |
| 911 | 89 | 100 | 100 | 97 | 100 | 95 | 92 | 88 |
| 912 | 89 | 100 | 100 | 94 | 95 | 100 | 85 | 88 |
Thermal Benchmark – Temperatures Over Time
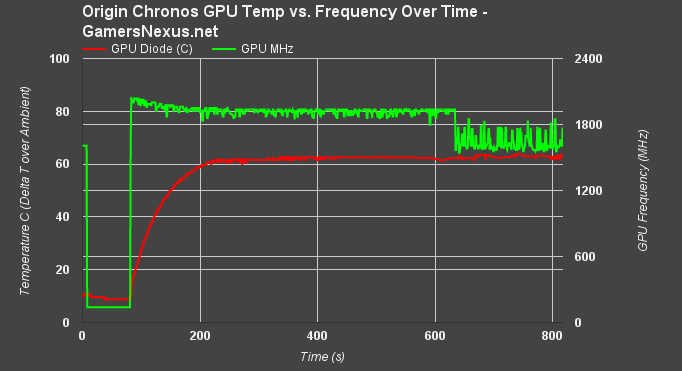
For our short-term test, the GPU spikes in frequency erratically over the test period as a result of thermal fluctuations. This means that the 1080 is functioning as designed, and is using Boost 3.0 to bounce between clock-rates as a means to reduce temperature.
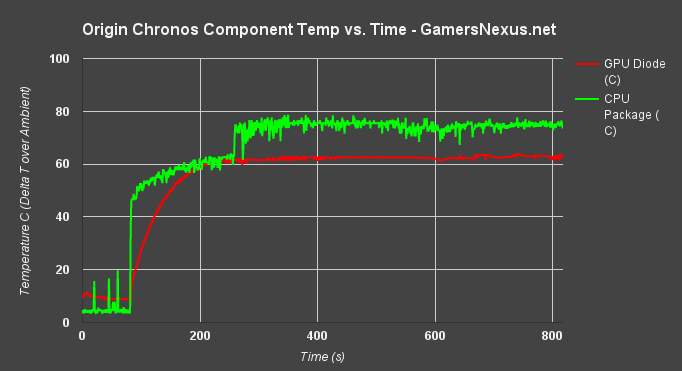
Note that around the 600 second mark, the temperature is hitting in the range of 90C for the non-delta temperature, or about 65C delta. Compare that to the harsh, sudden drop of frequency, where we fall to nearly 1600MHz. That lines up with the temperature spike, and the reduced clock is the only way the GPU can stay within spec. This results in an impact to framerate as time goes on. The clock-rate initially was about 2000MHz (~1961MHz), and over the course of the test fell to 1600MHz. That means that, under similar conditions, a long play session would allow the thermal solution to 'saturate,' eventually degrading performance of the GPU. Games which are clock biased will exhibit bigger swings, like Shadow of Mordor and its pendular >15% FPS swings.
Thermal Benchmark – Temperature vs. Frequency Over Time
Let's throw frequency into the mix.
Using Metro: Last Light, we see that the frequency is a bit more stable than initial burn-in – but that's because the workload is lighter on clock-rate, and the fan is boosting to maximum speed. Here's a look at that:
Endurance Benchmark – Frequency vs. Fan Speed (%)
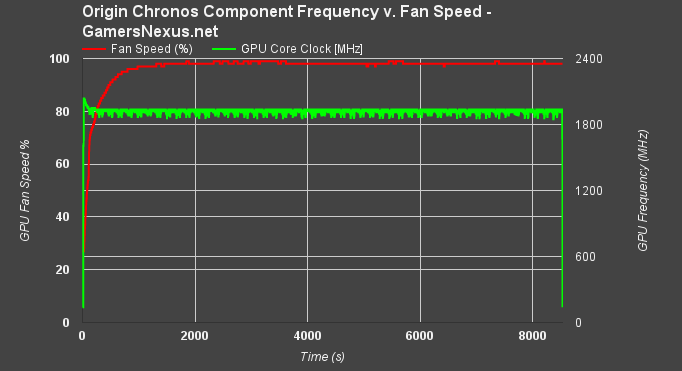
So, the Chronos VR is still failing to maintain its 1900~2000MHz clock-rate, but we're no longer falling as low as 1600MHz. This is achievable only by blasting the fan at 100% (~4000RPM), adding a bit to the noise output. We'll look at that below. First, here's a look at the frequency impact if we run a 55% fan speed (favoring noise to thermals):
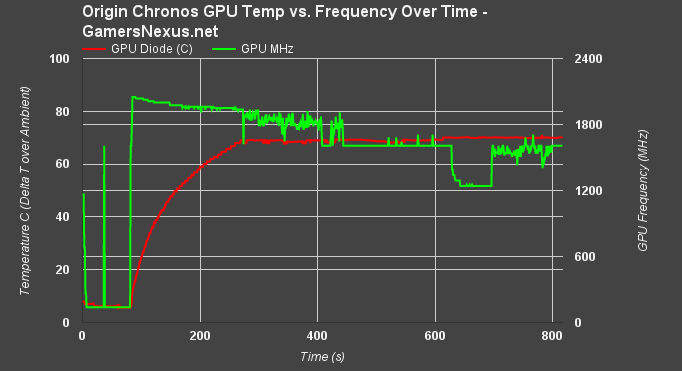
Definitely sub-optimal. Auto is much better. 55% fan speed sees drops to ~1200MHz.
Origin Chronos VR – Noise Levels (dB Test)
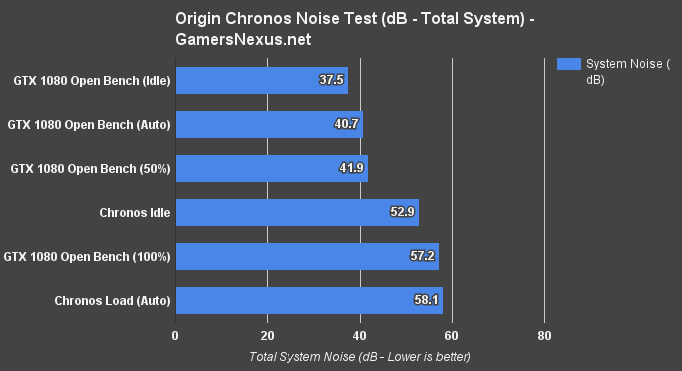
This chart doesn't take into account the frequency/pitch of noise output, so keep in mind that raw dB comparison is flawed in some ways. Still, we're provided with a baseline for noise.
We subtract out the ambient noise floor by using a logarithmic formula for computing deltas between decibel values, as they cannot be simply subtracted. For reference, the GTX 1080 FE on our open air test bench is present.
Origin's Chronos runs at a good hum, with its idle noise level at about 52.9dB using the preconfigured BIOS smart fan and auto GPU fan settings. For comparison, the open air test bench with a 1080 FE idles at about 37.5dB, but that is using an X41 CLC and Hale90 PSU – both quiet fans, and the only fans present. A better comparison would be other ITX builds from SIs, but we haven't received any since we started dB testing.
Origin's hitting about 58dB under 100% RPM, which is only slightly louder than the open air 1080 at 100% fan RPM (the Chronos VR is louder because its CPU and case fans are louder than our open test bench). The two are more or less the same volume to the average listener, but the GTX 1080 FE will never hit 100% fan speeds when in an open air bench, and Origin's only does because of how warm this ITX box runs.
The Chronos VR also sustains a relatively loud idle noise level with the GPU fan at 1100RPM and CPU fan pushing 2000RPM. The load levels are acceptable for the RPM of the fan, but the RPM would be lower in a more thermally friendly case.
Origin Chronos VR – Power Consumption (Watt Draw)
Using a 450W SFX PSU seems crazy for a GTX 1080, but that's becoming more common with modern, low TDP components. Technically, nVidia recommends a 500W PSU, but our testing shows that normal gaming use is still well under even 450W draw. You will only push the power envelope of this system by running intensive GPU transcoding while simultaneously thrashing the CPU with 100% load processing (e.g. LFFTs), which seems like an unrealistic use case for this box.
We were hitting a power draw of 282.9W full system power when running 3DMark FireStrike Ultra at 4K, using the Combined test to hit both the CPU and GPU. The power supply selection seems acceptable, given this data, and we commend Origin for not going overkill on PSU selection as many vendors do. We often see 800W PSUs configured with these boxes, and it's just totally pointless to make that provision. Origin has done well in this division of component selection.
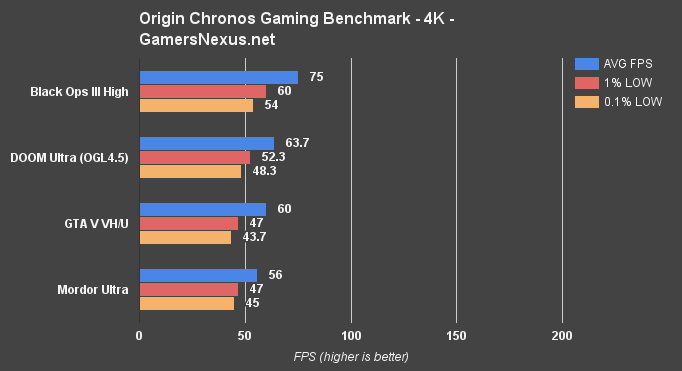
Origin Chronos VR – FPS Benchmark (1440p & 4K)
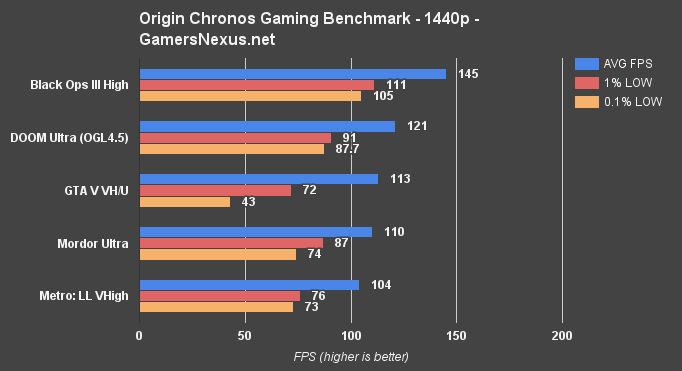
FPS testing for SI builds isn't revolutionary, since we're basically repeating tests that were already conducted for individual components. Still, it's important to look at FPS throughput for something being bought by gamers – a lot of whom may not follow our regular reviews.
1440p posts 145FPS for Black Ops III on high, with tightly timed 1% lows and 0.1% lows. DOOM with OpenGL 4.5 hits 121FPS, and with settings tweaks or Vulkan could hit 144Hz output. GTA V has worse 0.1% lows, but is hitting 113FPS average, and so on. These charts don't tell us anything that we don't already know – the GTX 1080 clearly can handle 1440p with no issues. The same is mostly true for 4K gaming, represented by the charts above.
The overclock is mostly beneficial, but we do see some stability tests with endurance runs as a result of heat build-up.
Conclusion
Origin's Chronos VR is an interesting box. The form factor is good and portable. We agree with most of the component selection – the 450W PSU is a nice touch, as most SIs do go unnecessarily insane on their wattage. The GTX 1080 is breathing through side panel ventilation and leveraging its blower fan as a means to support the unique installation (faceplate facing out), and that's sort of cool to see in its “natural” use case.
The case has thermal problems, though. It's choking the GPU clock-rate down to 1600MHz from an initial clock of 1961~2000MHz, a result of heat build-up and an inability for the GPU to dissipate that heat quickly. We resolved some of this by removing the acrylic window, and Origin could drill a few holes into that window to improve thermal performance. We were hitting 100C on some CPU cores (even under liquid), which also causes throttling there (mitigating some of the pre-OC). Note that all of this is going on while running a 100% GPU fan speed, which pumps out ~58dB for total system noise.
Build quality is generally good, component selection is generally competent, and (from our undercover audit) the 24/7 support is genuinely competent when available. The case just runs hot, and that's a potential concern. You'll want to run this thing non-overclocked to reduce the thermal threat to the CPU and GPU, or just buy a different Origin system instead (as the support is good). We can give praise to component selection and technical competence, but not for the ITX case's thermal design. That said, Origin runs a bit more of a premium than its competition. If you're not after a boutique look and you don't want to DIY, it's worth looking into CyberPower, iBUYPOWER, and CyberTron.
Editorial: Steve “Lelldorianx” Burke
Video: Andrew “ColossalCake” Coleman