We’re reviewing the new MSI GTX 1080 Ti Gaming X card today, priced at $750 and positioned as one of the highest-performing gaming cards on the market. These tests will extensively look at thermals, given that that’s the primary differentiator between same-GPU video cards, and then look at gaming performance (in FPS) versus the Reference card and our Hybrid mod FE card. Part of our thermal testing will include performance analysis with and without a backplate. Noise levels are going to be the same as the last Twin Frozr card we tested, which can be found here.
This generation of GTX 1080 Ti cards has gone big. MSI’s Gaming X is already large, but the Gigabyte unit that we’re reviewing next is similarly big in the multi-slot department. The Gaming X uses MSI’s known twin-frozr cooler, with modifications to the underlying aluminum heatsink to increase surface area and fin density. Noise output is therefore identical to the noise output of previous Twin Frozr coolers we reviewed for the 10-series, including the GTX 1080 non-Ti Gaming X.
MSI ships the 1080 Ti Gaming X at three different frequencies, configurable through software: OC mode runs at 1683MHz boost and 1569MHz base, Gaming mode runs at 1657MHz boost and 1544MHz base, and silent mode runs at 1582 and 1480MHz.
MSI GTX 1080 Ti PCB & VRM Analysis
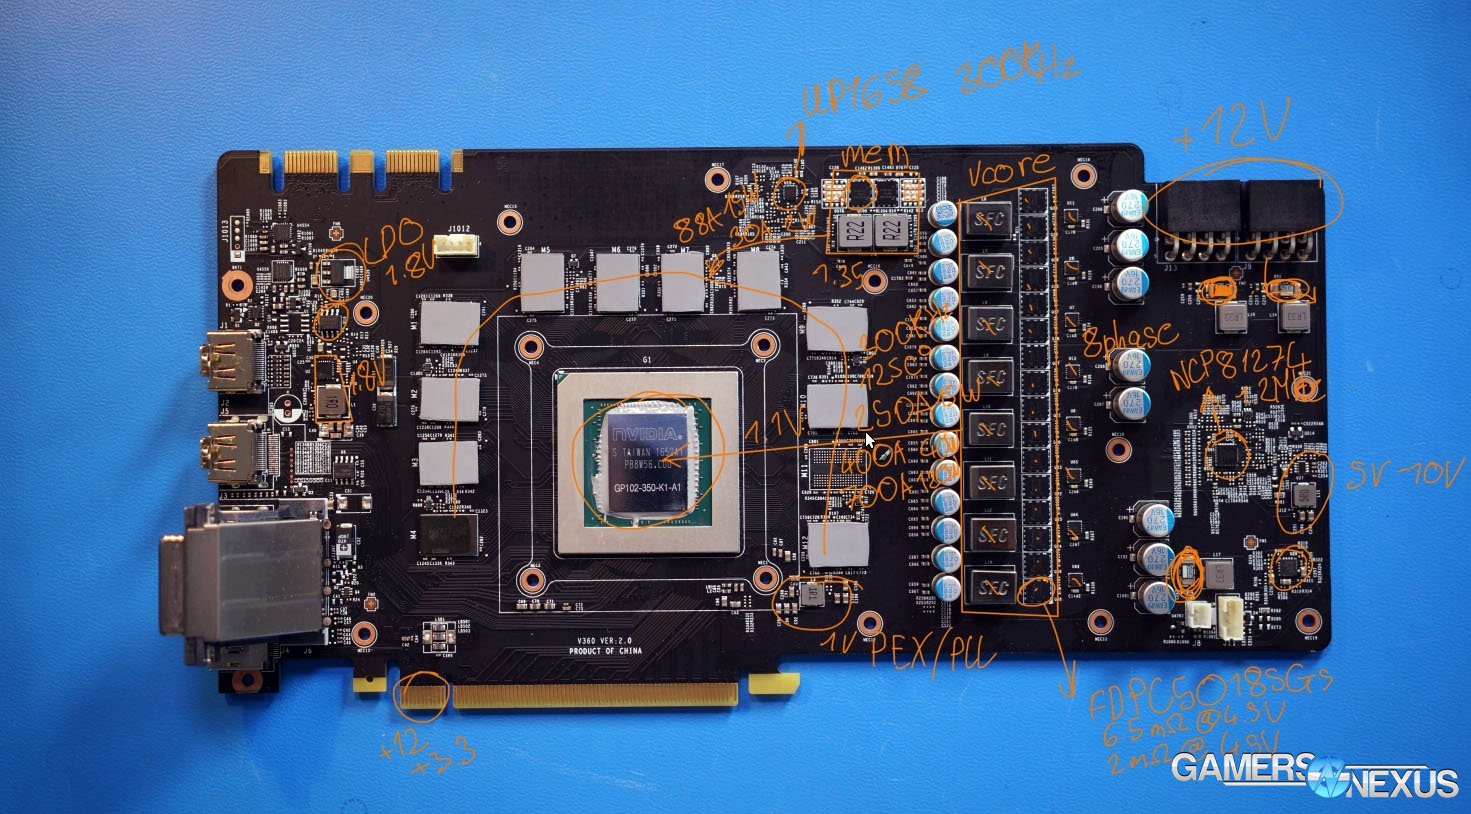
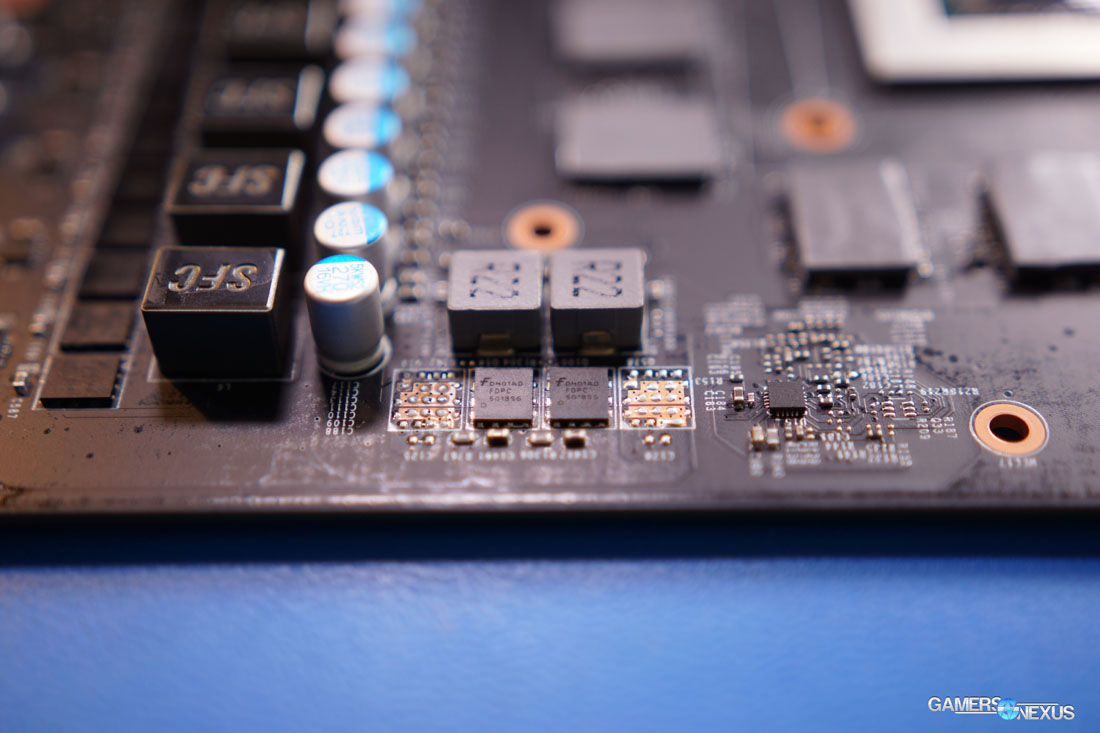
Our PCB & VRM analysis of the MSI GTX 1080 Ti Gaming X can be found here, as conducted by overclocker Buildzoid. Briefly, the card uses 16 FDPC5018SGs hooked up to 8 inductors, controlled by 8 driver ICs, resulting in an 8-phase VRM with 4 MOSFETs per phase. The Fairchild 5018SGs are dual-FET packages with both high-side and low-side FETs contained. This bulked-up VRM results in a VRM that outputs only 15W of heat under a typical 250A load, or would output ~40W of heat under an intense 400A load (assuming 125C and a safe 300KHz switching frequency).
MSI GTX 1080 Ti Gaming X Tear-Down
We previously tore down the MSI GTX 1080 Ti Gaming X card over here, but will recap in today’s review.
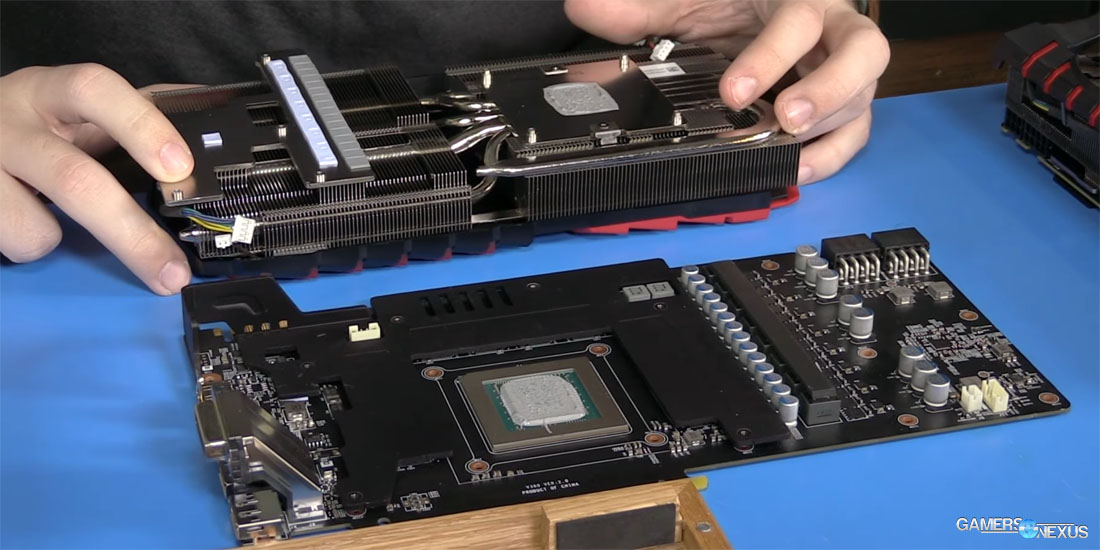
The cooler consists of two isolated baseplates contacting the GPU proper (and VRAM) and the VRM components. These each hook into the heatpipes and, therefore, the finstack above them, but are isolated to help with controlling temperatures around the board.
The GPU coldplate contacts the silicon with a copper coldplate, isolated from the surrounding aluminum plates that contact the VRAM modules. The VRAM modules sink into the same block, ultimately, and so we might see some slightly higher core temperatures than on cards where VRAM doesn’t sink to the same block as the GPU. At the end of the day, an extra couple degrees on the GPU core won’t change anything, but shedding temperature from VRAM will make a more meaningful impact with regard to differentiating design from competition. EVGA and Gigabyte have both explored this, mostly with their respective FTW Hybrid and Xtreme Water cards. As for the aluminum heatsink, we’re looking at a large fin stack that covers the entire card, with some channeling for the inductors (connected to the fins via thermal pad – and yes, despite smaller surface area, it does help) and for the capacitor bank. The FETs and driver ICs also independently contact the separate baseplate via thermal pads.
MSI’s cooler is the usual Twin Frozr design, and hasn’t had a refresh since the 10-series launch. These are 100mm axial fans that can spin down to 0 RPM, and tend to hover around 55% in their default profile when tortured.
Continue to Page 2 for testing methodology.
GPU Testing Methodology
For our benchmarks today, we’re using a fully rebuilt GPU test bench for 2017. This is our first full set of GPUs for the year, giving us an opportunity to move to an i7-7700K platform that’s clocked higher than our old GPU test bed. For all the excitement that comes with a new GPU test bench and a clean slate to work with, we also lose some information: Our old GPU tests are completely incomparable to these results due to a new set of numbers, completely new testing methodology, new game settings, and new games being tested with. DOOM, for instance, now has a new test methodology behind it. We’ve moved to Ultra graphics settings with 0xAA and async enabled, also dropping OpenGL entirely in favor of Vulkan + more Dx12 tests.
We’ve also automated a significant portion of our testing at this point, reducing manual workload in favor of greater focus on analytics.
Driver version 378.78 (press-ready drivers for 1080 Ti, provided by nVidia) was used for all nVidia devices. Version 17.3.1 was used for AMD.
Moving forward, we’re refreshing our GPU bench with the relevant high-end contenders: The GTX 1080 Ti, GTX 1080, and GTX 1070 in Founders Edition variants, with a splash from the GTX 980 Ti. We’re also going to add in the RX 480, but note that it competes in a completely different price bracket. That’s just to give some representation for a $250ish card. We’ll add Vega once it’s ready, and will slowly add more GPUs to this bench with each content piece. We do lose the Titan XP in this process, sadly, as our original model was a loaner.
Please note that due to limited time between events, we’re not going to be getting into noise level measurement and deep overclocking today. We’ll look into those post-PAX in some special features.
A separate bench is used for game performance and for thermal performance.
Thermal Test Bench
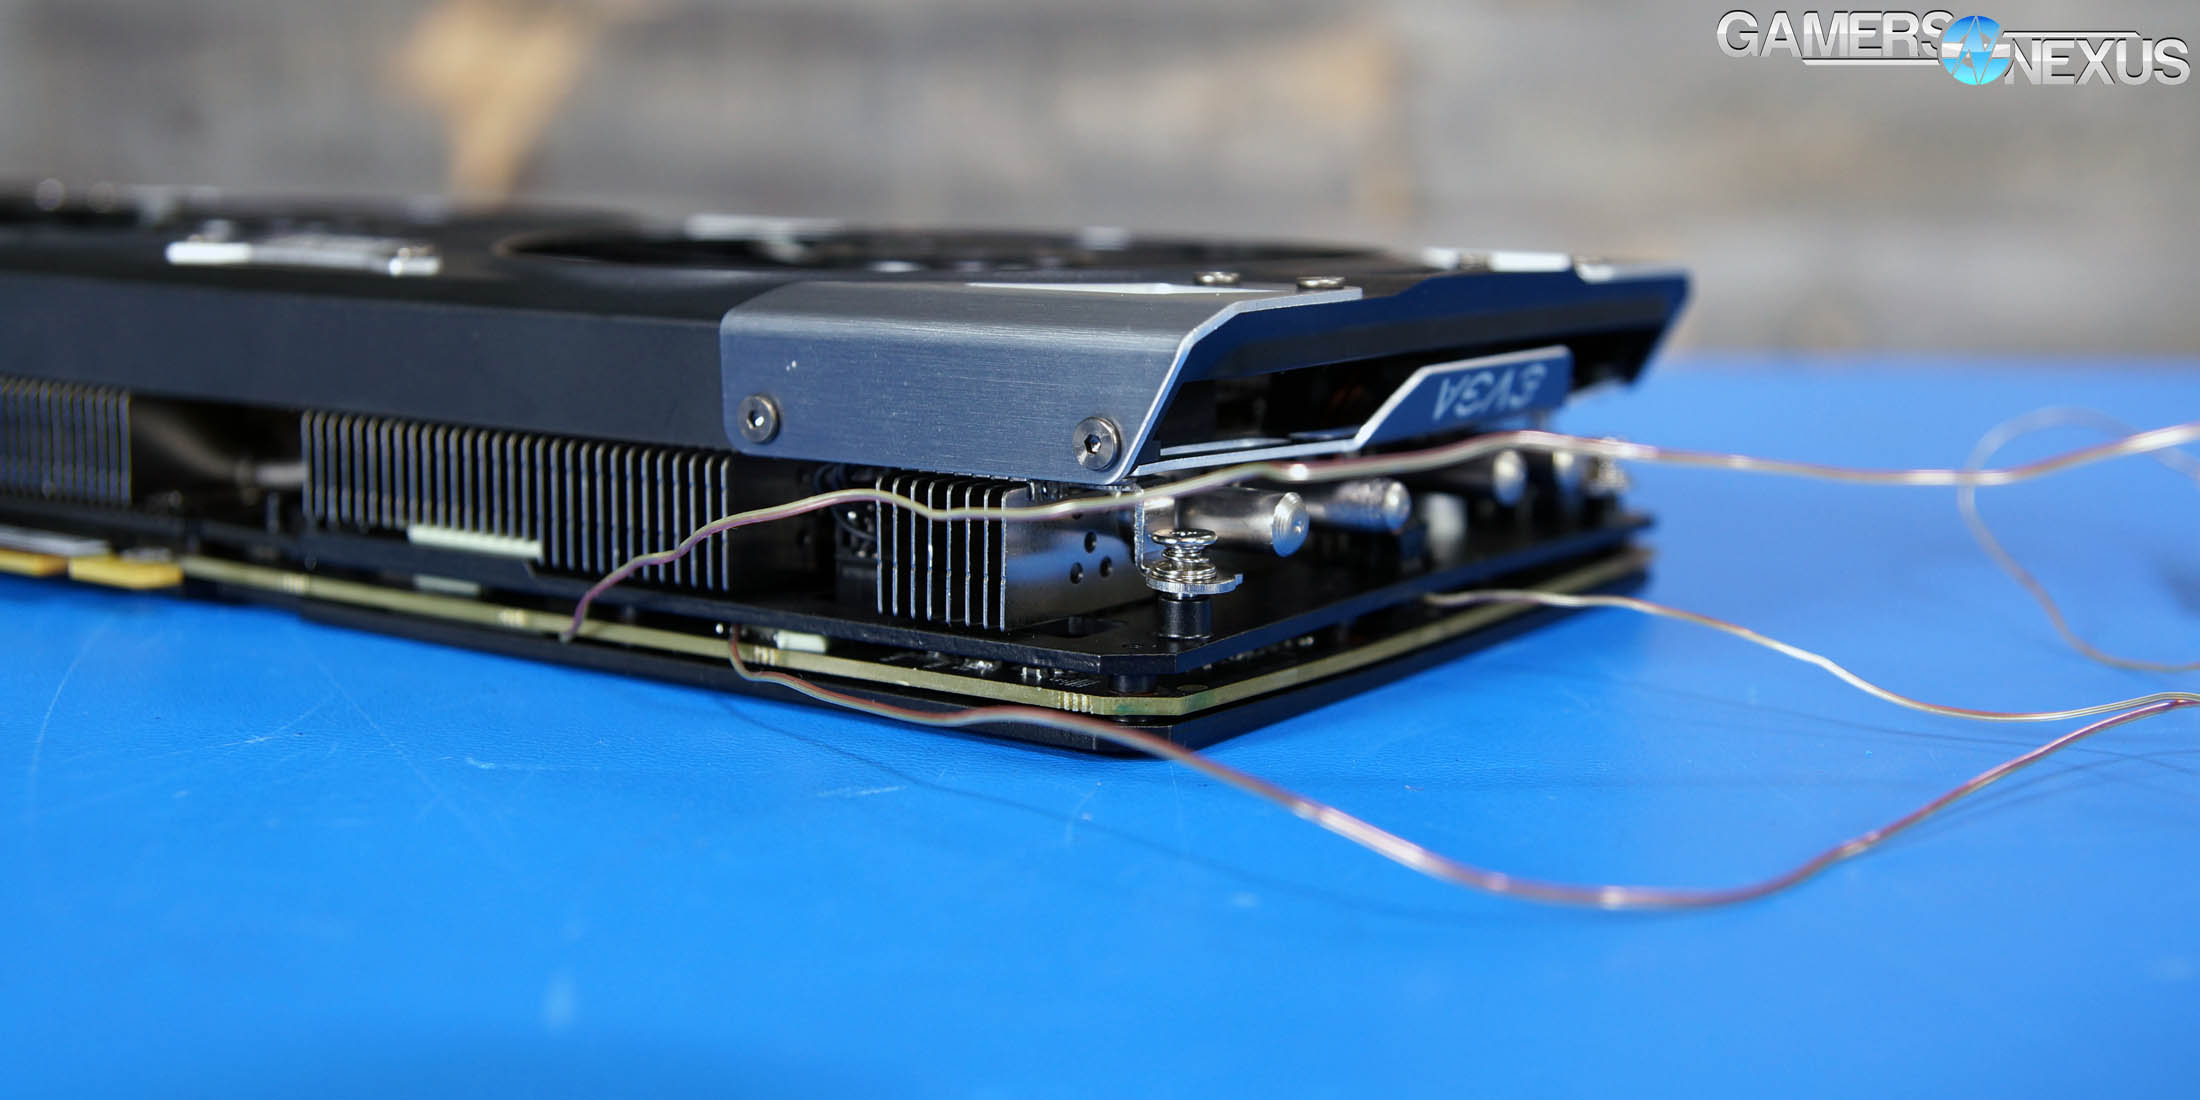
Our test methodology for the is largely parallel to our EVGA VRM final torture test that we published late last year. We use logging software to monitor the NTCs on EVGA’s ICX card, with our own calibrated thermocouples mounted to power components for non-ICX monitoring. Our thermocouples use an adhesive pad that is 1/100th of an inch thick, and does not interfere in any meaningful way with thermal transfer. The pad is a combination of polyimide and polymethylphenylsiloxane, and the thermocouple is a K-type hooked up to a logging meter. Calibration offsets are applied as necessary, with the exact same thermocouples used in the same spots for each test.
Torture testing used Kombustor's 'Furry Donut' testing, 3DMark, and a few games (to determine auto fan speeds under 'real' usage conditions, used later for noise level testing).
Our tests apply self-adhesive, 1/100th-inch thick (read: laser thin, does not cause "air gaps") K-type thermocouples directly to the rear-side of the PCB and to hotspot MOSFETs numbers 2 and 7 when counting from the bottom of the PCB. The thermocouples used are flat and are self-adhesive (from Omega), as recommended by thermal engineers in the industry -- including Bobby Kinstle of Corsair, whom we previously interviewed.
K-type thermocouples have a known range of approximately 2.2C. We calibrated our thermocouples by providing them an "ice bath," then providing them a boiling water bath. This provided us the information required to understand and adjust results appropriately.
Because we have concerns pertaining to thermal conductivity and impact of the thermocouple pad in its placement area, we selected the pads discussed above for uninterrupted performance of the cooler by the test equipment. Electrical conductivity is also a concern, as you don't want bare wire to cause an electrical short on the PCB. Fortunately, these thermocouples are not electrically conductive along the wire or placement pad, with the wire using a PTFE coating with a 30 AWG (~0.0100"⌀). The thermocouples are 914mm long and connect into our dual logging thermocouple readers, which then take second by second measurements of temperature. We also log ambient, and apply an ambient modifier where necessary to adjust test passes so that they are fair.
The response time of our thermocouples is 0.15s, with an accompanying resolution of 0.1C. The laminates arae fiberglass-reinforced polymer layers, with junction insulation comprised of polyimide and fiberglass. The thermocouples are rated for just under 200C, which is enough for any VRM testing (and if we go over that, something will probably blow, anyway).
To avoid EMI, we mostly guess-and-check placement of the thermocouples. EMI is caused by power plane PCBs and inductors. We were able to avoid electromagnetic interference by routing the thermocouple wiring right, toward the less populated half of the board, and then down. The cables exit the board near the PCI-e slot and avoid crossing inductors. This resulted in no observable/measurable EMI with regard to temperature readings.
We decided to deploy AIDA64 and GPU-Z to measure direct temperatures of the GPU and the CPU (becomes relevant during torture testing, when we dump the CPU radiator's heat straight into the VRM fan). In addition to this, logging of fan speeds, VID, vCore, and other aspects of power management were logged. We then use EVGA's custom Precision build to log the thermistor readings second by second, matched against and validated between our own thermocouples.
The primary test platform is detailed below:
| GN Test Bench 2015 | Name | Courtesy Of | Cost |
| Video Card | This is what we're testing | - | - |
| CPU | Intel i7-5930K CPU 3.8GHz | iBUYPOWER | $580 |
| Memory | Corsair Dominator 32GB 3200MHz | Corsair | $210 |
| Motherboard | EVGA X99 Classified | GamersNexus | $365 |
| Power Supply | NZXT 1200W HALE90 V2 | NZXT | $300 |
| SSD | OCZ ARC100 Crucial 1TB | Kingston Tech. | $130 |
| Case | Top Deck Tech Station | GamersNexus | $250 |
| CPU Cooler | Asetek 570LC | Asetek | - |
Note also that we swap test benches for the GPU thermal testing, using instead our "red" bench with three case fans -- only one is connected (directed at CPU area) -- and an elevated standoff for the 120mm fat radiator cooler from Asetek (for the CPU) with Gentle Typhoon fan at max RPM. This is elevated out of airflow pathways for the GPU, and is irrelevant to testing -- but we're detailing it for our own notes in the future.
Game Bench
| GN Test Bench 2017 | Name | Courtesy Of | Cost |
| Video Card | This is what we're testing | - | - |
| CPU | Intel i7-7700K 4.5GHz locked | GamersNexus | $330 |
| Memory | GSkill Trident Z 3200MHz C14 | Gskill | - |
| Motherboard | Gigabyte Aorus Gaming 7 Z270X | Gigabyte | $240 |
| Power Supply | NZXT 1200W HALE90 V2 | NZXT | $300 |
| SSD | Plextor M7V Crucial 1TB | GamersNexus | - |
| Case | Top Deck Tech Station | GamersNexus | $250 |
| CPU Cooler | Asetek 570LC | Asetek | - |
BIOS settings include C-states completely disabled with the CPU locked to 4.5GHz at 1.32 vCore. Memory is at XMP1.
We communicated with both AMD and nVidia about the new titles on the bench, and gave each company the opportunity to ‘vote’ for a title they’d like to see us add. We figure this will help even out some of the game biases that exist. AMD doesn’t make a big showing today, but will soon. We are testing:
- Ghost Recon: Wildlands (built-in bench, Very High; recommended by nVidia)
- Sniper Elite 4 (High, Async, Dx12; recommended by AMD)
- For Honor (Extreme, manual bench as built-in is unrealistically abusive)
- Ashes of the Singularity (GPU-focused, High, Dx12)
- DOOM (Vulkan, Ultra, 0xAA, Async)
Synthetics:
- 3DMark FireStrike
- 3DMark FireStrike Extreme
- 3DMark FireStrike Ultra
- 3DMark TimeSpy
For measurement tools, we’re using PresentMon for Dx12/Vulkan titles and FRAPS for Dx11 titles. OnPresent is the preferred output for us, which is then fed through our own script to calculate 1% low and 0.1% low metrics (defined here).
Continue to Page 3 for thermal tests.
MSI GTX 1080 Ti Gaming X Temperatures
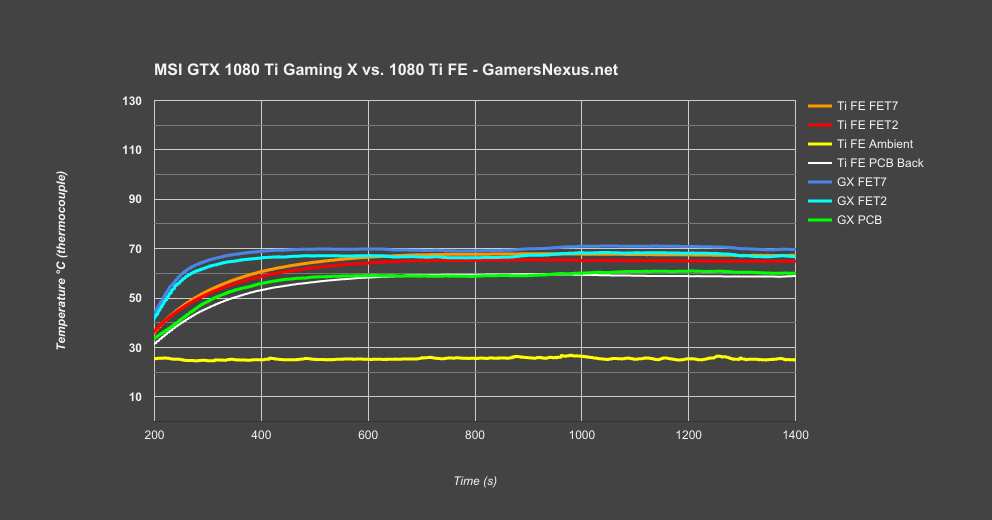
Starting with VRM temperatures strictly compared against the 1080 Ti FE card, we see in this chart that both the Gaming X and 1080 Ti Founders Edition land their VRM component temperatures and PCB backside temperatures at about the same place. The FETs are well under any actually concerning threshold – which you wouldn’t start hitting until 125C, anyway – with the 1080 Ti FE card landing just under 70C for FET7 (represented by the orange line), or right around 65C for FET2 (represented by the red line). The Gaming X, meanwhile, shows its FETs, both shades of blue, at 70-71C for FET7 and 65-70C for FET2. Keep in mind that these packages house multiple FETs for high-side and low-side, and so are dense packages. Our PCB analysis and VRM break-down video has more info on that.
Moving now to a chart that plots frequency and core temperature versus time, we get a chart that’s fairly complex and will be staged a few lines at a time. For this first stage, we’re looking at the clock-rate of the GTX 1080 Ti Founders Edition card versus its temperature. Note that the clock is enumerated from a power virus scenario, which means that it is lower than you’d see in a game – but the heat load is significantly higher, and that’s what we care about here.
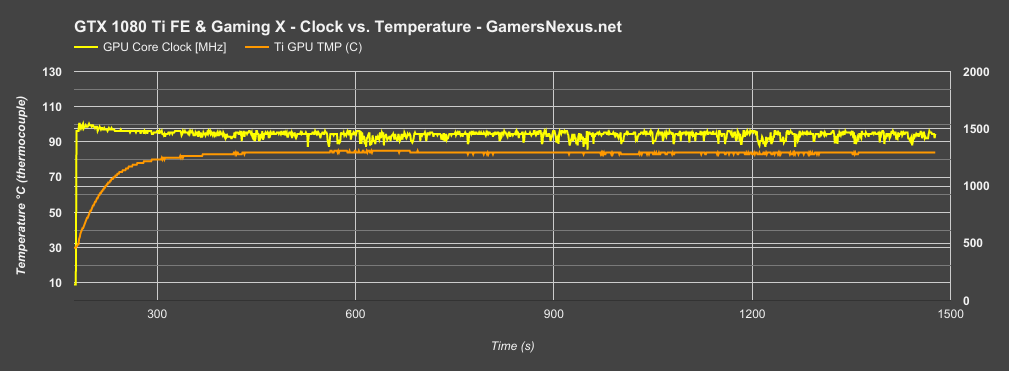
The clock is a bit spikey. We have a range of about 100MHz at times, caused by continually reaching the 84C thermal limiter and dropping clocks to maintain that temperature. The spikes in frequency often align with spikes in temperature for this reason, as they have an inverse relationship.
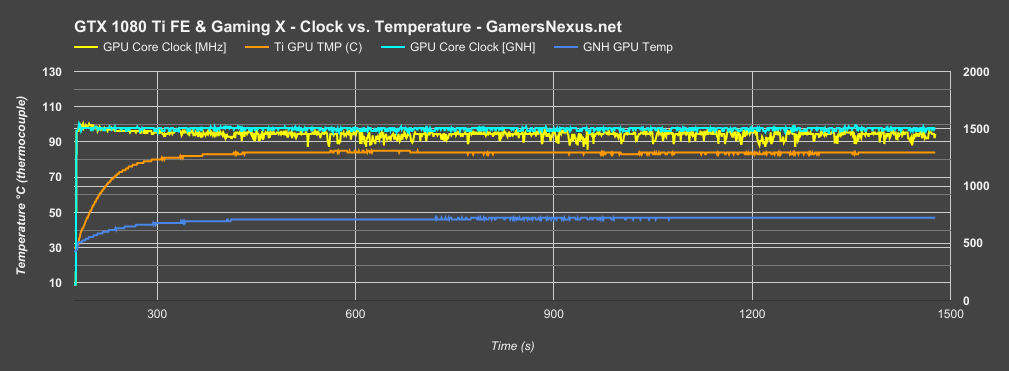
Let’s add in the GN Hybrid card, which is the FE board with an EVGA CLC on it.
Here, we see the Hybrid card runs a GPU temperature nearly at 45C, where the FE card operated around 84C prior to our mod. This could be resolved, of course, with a higher fan speed – but that’s not the point of today’s content. We talked about that in our Hybrid results video.
If we look at the Hybrid’s clock-rate, we can also see that it is less spikey than the clock-rate of the reference cooler. This is what gives us the extra 4-9% performance in games, depending on how clock-intensive they are. Again, that’s old news from our Hybrid deep dive. Let’s add the Gaming X.
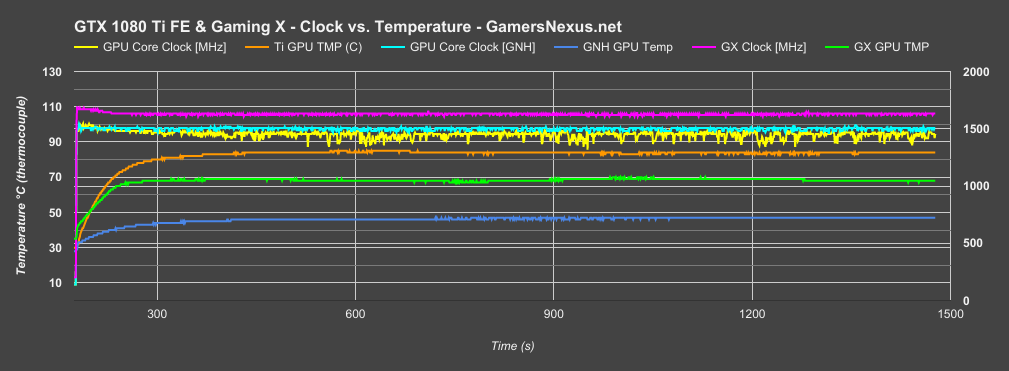
The chart’s getting dense, but this is the last iteration of it. The Gaming X is pre-overclocked, hence the higher frequency, and is also the flattest. The Hybrid card removed the thermal constraint, but immediately ran into power and voltage budget constraints. The Gaming X card will have those at some point as well, of course, but they’re pushed back enough to help further flatten the curve – partly thanks to the massive VRM – while keeping GPU temps with 50% fan speeds at around 68C. This is higher than the Hybrid mod and lower than the reference board, which is really all we need. We’re well below the thermal limiter point on the clock, and the clock is smoother overall. This means we should expect a generally higher framerate out of the Gaming X than the Hybrid, thanks in part to the pre-OC and the better power design. Granted, the FET temperatures aren’t really any different from the 1080 Ti Hybrid.
GTX 1080 Ti Gaming X: Does the GPU Backplate Do Anything?
With a backplate that’s got no transfer medium between the PCB and metal plate, there’s always a question of whether that backplate is actually serving as a hotbox and trapping heat from escaping. We saw this previously with the pre-updated EVGA FTW cards (before the thermal pad addition).
We ran two tests of the MSI GTX 1080 Ti Gaming X with and without the backplate. Looking strictly at back-side PCB temperature, here’s what we see:
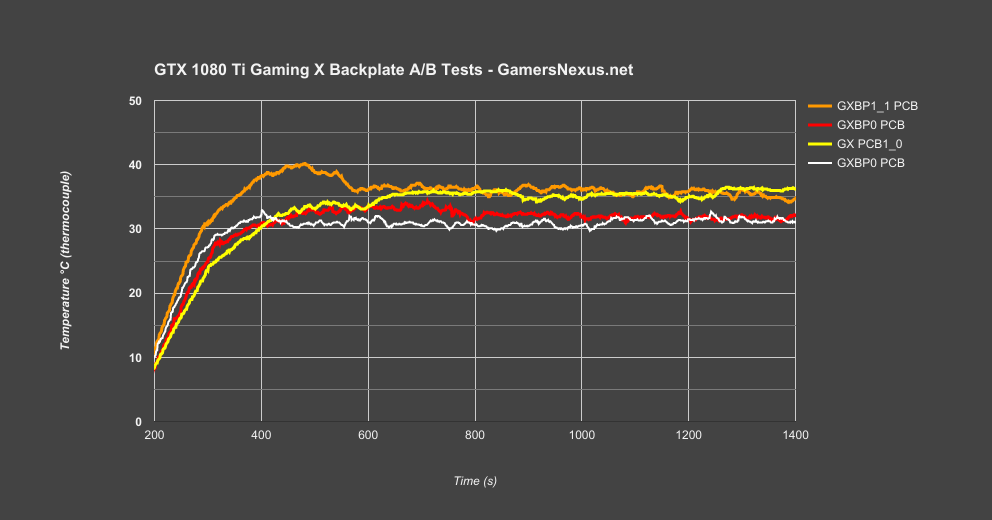
These are delta values. We are running a delta of second-to-second ambient so that we can normalize for variance in the environment.
The red and white lines represent the backplate removed (BP0), coinciding with one another around 30-32C dT over ambient. With the backplate on, our PCB backside temperature is represented by the yellow and o range lines, which is about 35C – so the backplate makes the backside of the PCB warmer by a few degrees.
That’s also irrelevant, at this point, but was just to set the stage for more testing. Knowing this, we can now look at more important temperatures, like GPU core temp (should be unaffected entirely) and FET7/FET2 temps.
Here’s the core temp:
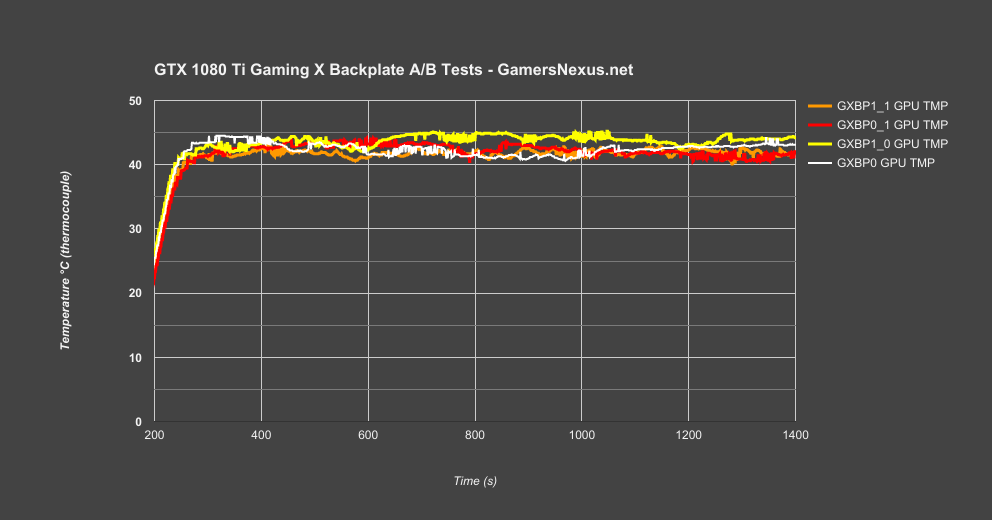
No meaningful difference between these values (again, delta T). The backplate does not affect core temperature in a meaningful way. Again, that’s entirely expected – it’s not part of the cooling apparatus that affects the GPU.
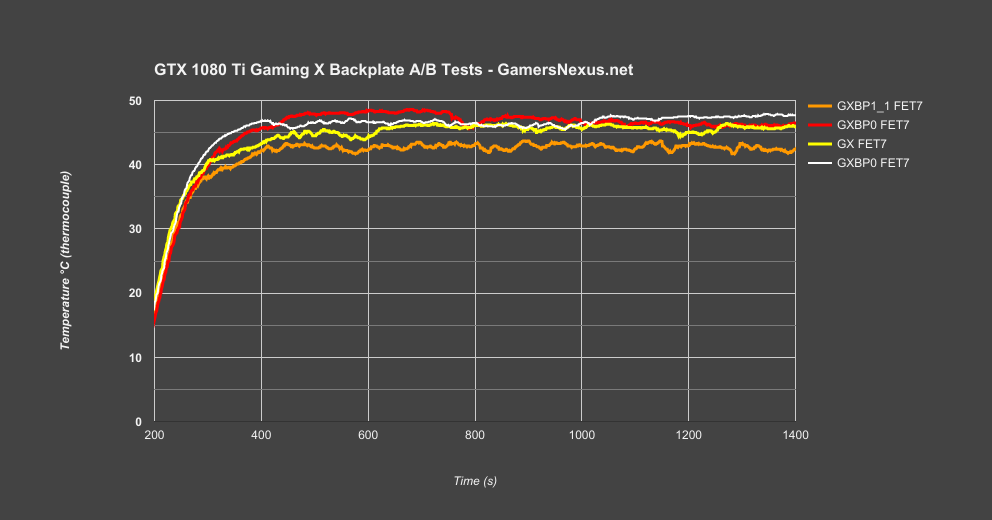
Above is the set of temperatures for FET#7, which is in the middle of the card’s VRM.
The FETs aren’t meaningfully different in temperatures with the backplate ‘toggled.’ Removing the backplate could be impacting temperature in a negative way, but the data is close enough that we have some uncertainty. Mostly, this is a non-issue with the backplate ‘toggle.’
The backplate isn’t meaningfully helping thermals, nor is it hurting them in a meaningful fashion. This backplate, if it serves any function, is purely structural.
Continue to Page 4 for synthetic tests.
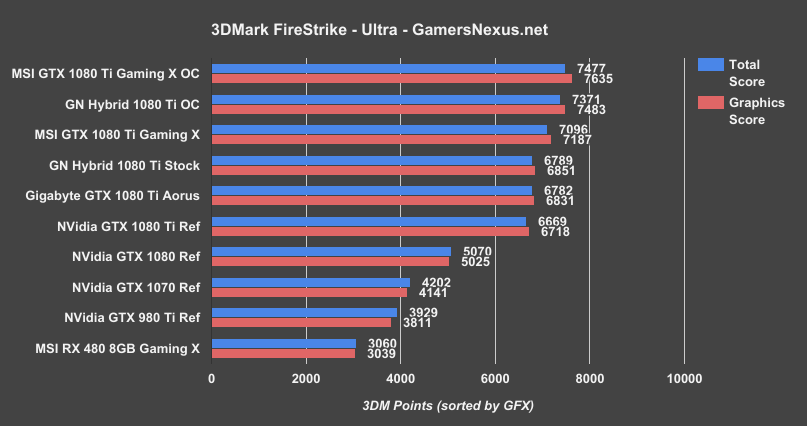
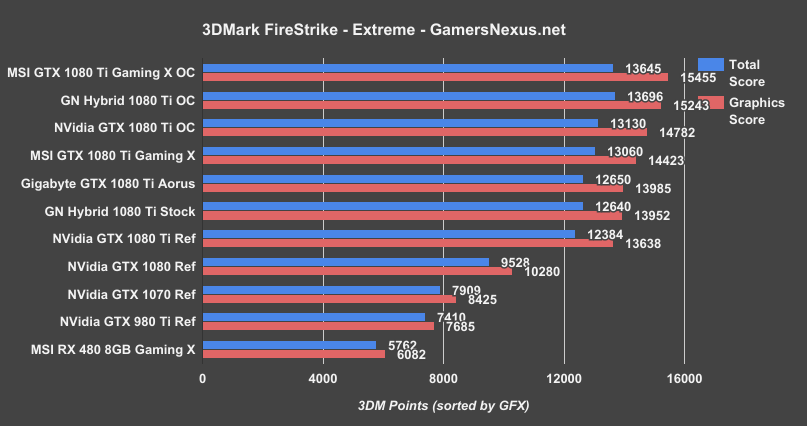
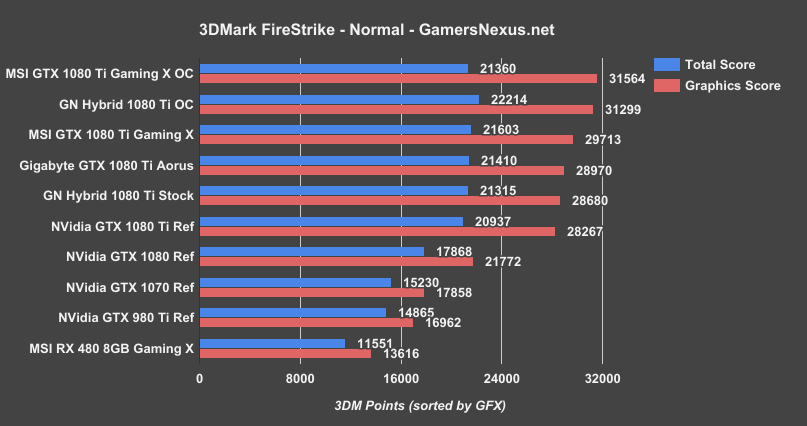
We won’t spend a lot of time analyzing these results, but we’re providing them for 3DMark enthusiasts. These tests include 3DMark FireStrike Ultra (4K version), 3DMark FireStrike Extreme (1440p version), and 3DMark FireStrike “Normal” (1080p version). The testing is standardized and fired off by scripted automation. Note that there is some variance in FireStrike pass-to-pass.
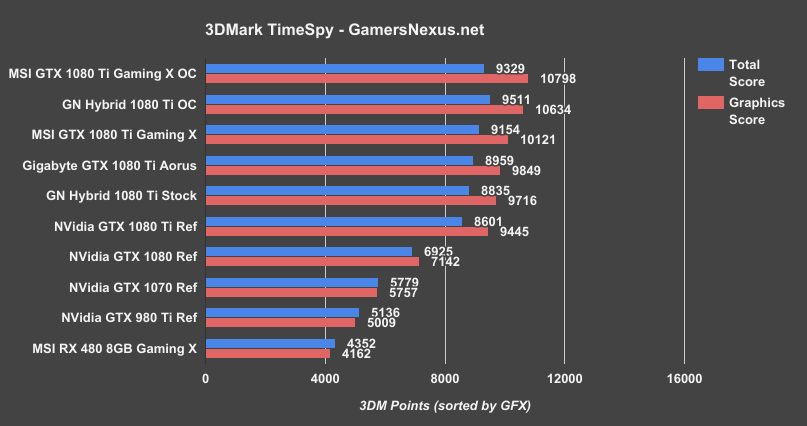
We’ve also included 3DMark TimeSpy results, serving as a low-level API (Dx12) test for the same suite of cards.
3DMark FireStrike Ultra – 1080 Ti Gaming X
3DMark FireStrike Extreme – 1080 Ti Gaming X
3DMark FireStrike Normal – 1080 Ti Gaming X
3DMark TimeSpy – 1080 Ti Gaming X
Let’s do some data analysis on the next (final) page.
Continue to Page 5 for gaming benchmarks
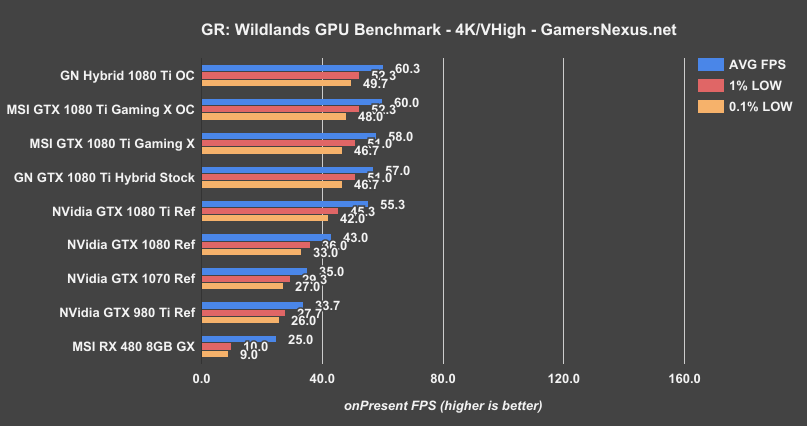
Ghost Recon: Wildlands GPU Benchmark – 1080 Ti Gaming X
Starting with Ghost Recon at 4K, the MSI GTX 1080 Ti Gaming X ($750) places at 58FPS AVG, with lows at 51FPS and 47FPS. This lands the GTX 1080 Ti Gaming X right around where our 1080 Ti Hybrid mod performed. This makes sense, since the Hybrid mod removed the thermal limit of the FE card and provided an additional 5-6% of clock headroom pre-OC. Compared to the 1080 Ti reference card, we’re looking at a gain of about 4.9%.
The Gaming X didn’t overclock in any meaningful way, landing at 60FPS versus 58, for a change of about 3.4%. Looking at frametime plots, there’s no meaningful advantage from overclocking the Gaming X. There’s simply not enough headroom on our unit when considering its stock shipping frequency.
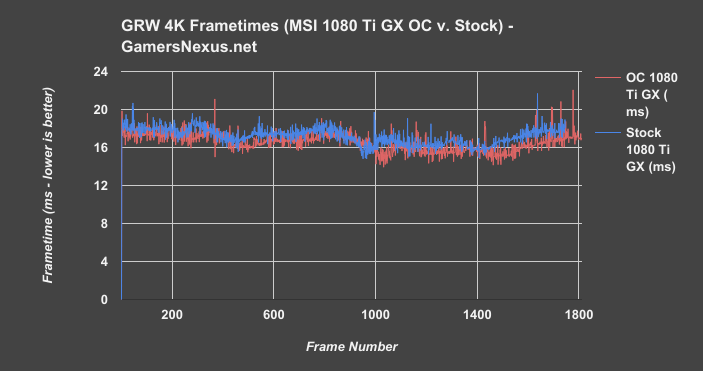
In fact, our GTX 1080 Ti FE modded with the Hybrid cooler allows for overclocking that effectively equals the Gaming X in framerate under OC.
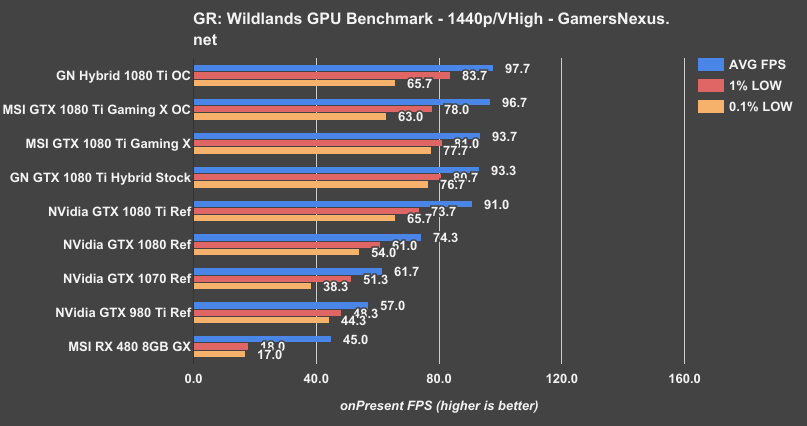
Now at 1440p, the 1080 Ti Gaming X lands at 94FPS AVG under stock conditions, with lows at 81 and 78. This is effectively equivalent to our stock Hybrid mod, with a lead over the reference cooler of about 3%. This is, again, because we’re not encountering a thermal budget limitation on either the Gaming X or DIY Hybrid cards.
Overclocking the MSI GTX 1080 Ti Gaming X gets it up to 97FPS AVG, for a gain of 3.2% over the stock Gaming X. This is led by the Hybrid that we overclocked, though not in a big way.
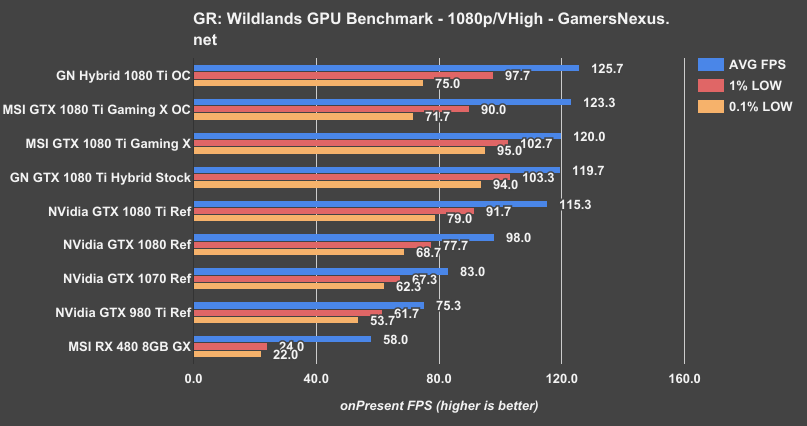
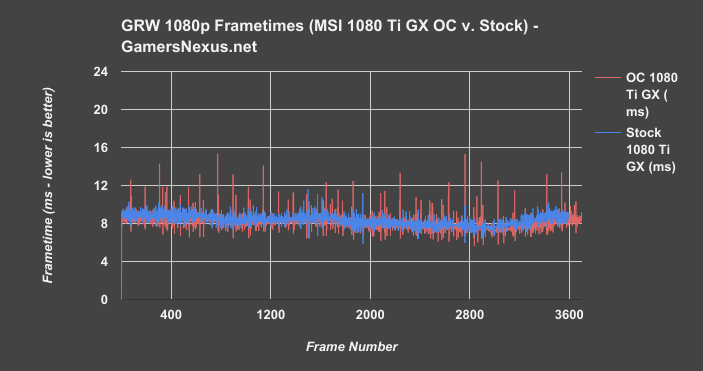
Running at 1080p, we see the hierarchy remains mostly the same. The GTX 1080 Ti Gaming X performs at around 120FPS AVG, ahead of the reference 1080 Ti in both average FPS and frametimes, and roughly tied with the Hybrid stock card. Gains from overclocking are largely insignificant, and introduce additional frametime variance as the card struggles to maintain even a small 75MHz offset. You can see in our frametime plots that, despite higher average FPS and more frame throughput overall, consistency goes down with the overclock.
For Honor GPU Benchmark – MSI 1080 Ti Gaming X
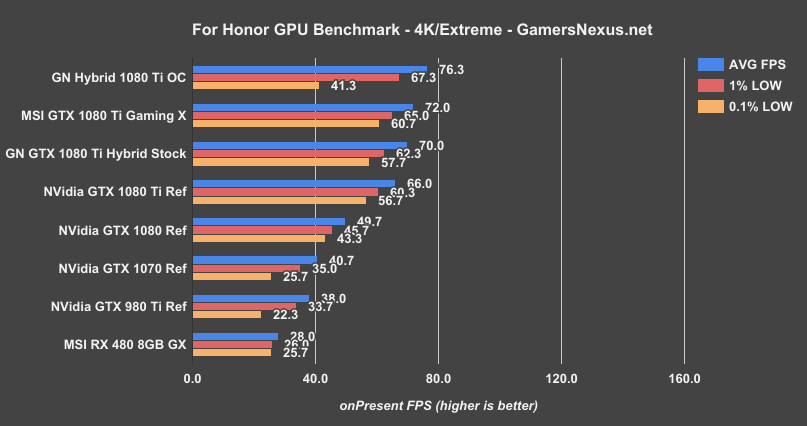
With For Honor at 4K, the MSI GTX 1080 Ti Gaming X performance places above the reference card by about 9% in average FPS, with lows mostly comparable. The 1080 Ti Hybrid sits between the Gaming X and Reference 1080 Ti cards. For Honor has routinely shown issues with frametime stability when overclocked, as illustrated by the 1080 Ti Hybrid OC in these charts. We encountered the same problems with the Gaming X, and decided that the user experience was better with a marginally lower average FPS but significantly improved frametime consistency.
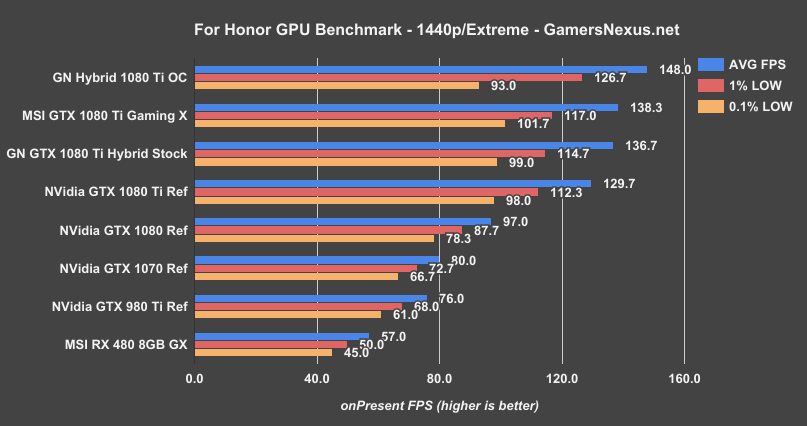
At 1440p, the story remains mostly the same: MSI’s Gaming X performs around 138FPS AVG with lows at 117 and 102FPS, putting it ahead of our Hybrid stock mod by barely 1%. The lead over the reference card is more noteworthy, at around 6.6%. Frametimes scale somewhat linearly, here.
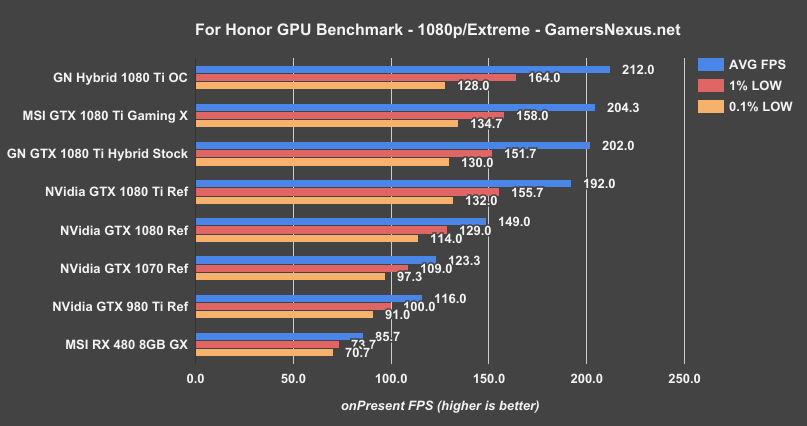
Not much has changed with 1080p. The 1080 Ti Gaming X is just ahead of our stock Hybrid mod, operating at 204FPS versus 202FPS. This lands the Gaming X about 6.3% ahead of the reference GTX 1080 Ti, running a 192FPS AVG.
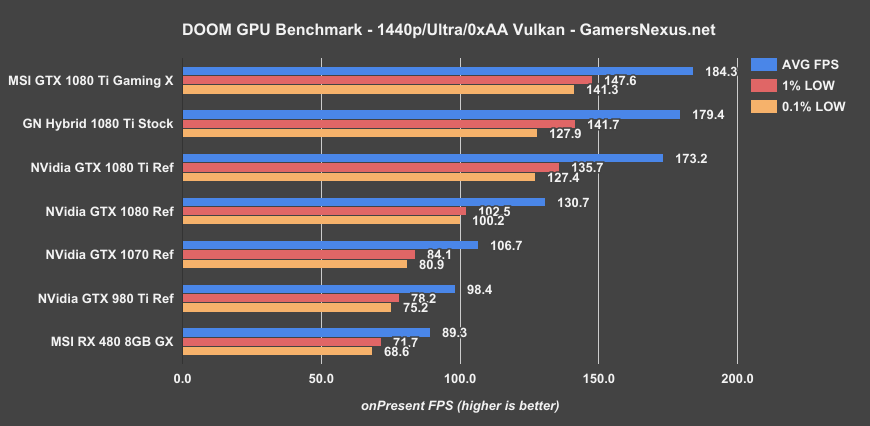
DOOM GPU Benchmark (Vulkan) – MSI GTX 1080 Ti Gaming X
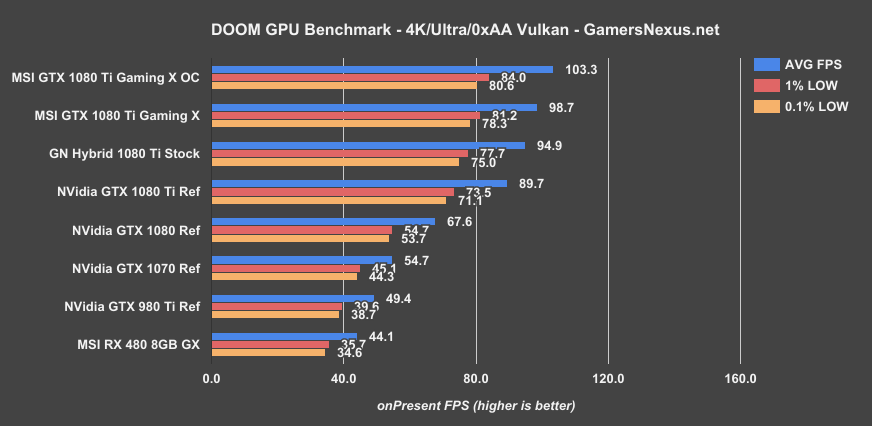
Using Vulkan on DOOM at 4K, the GTX 1080 Ti Gaming X pushes 98.7FPS AVG, with lows at 81 1% and 78FPS 0.1%. This leads the GTX 1080 Ti Hybrid mod with stock clocks, which performs around 95FPS AVG, with lows at 78 and 75. The 1080 Ti reference card, meanwhile, is closer to 90, making for a performance lead of about 10% for the Gaming X over the FE card, or about 4% over the Hybrid mod with no OC.
Overclocking helps the Gaming X push past 100FPS, up to 103AVG, lows at 84 and 81.
The 1440p numbers are less useful for the Ti series of 1080s, given DOOM’s physics bugs beyond 200FPS. This means that DOOM is capped to 200FPS, and so any point at which framerate would have exceeded that number, the FPS is truncated. Regardless, here it is:
Sniper Elite 4 (Dx12) – GTX 1080 Ti Gaming X
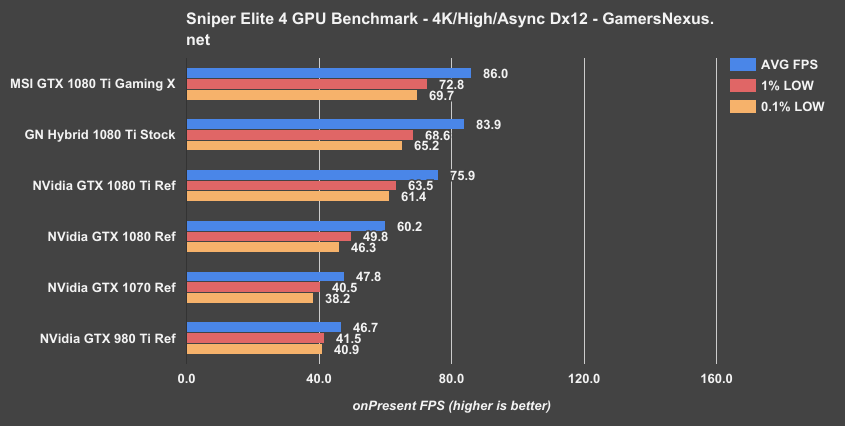
Sniper Elite 4 with Dx12 places the Gaming X at the top of the current chart, where it runs an 86FPS average, lows around 70FPS, against the 1080 Ti Stock card’s 84FPS AVG. It’s not a huge or significant lead, but one that makes sense given the thermal and stock clock advantage of the MSI card. Nothing too exciting overall, though.
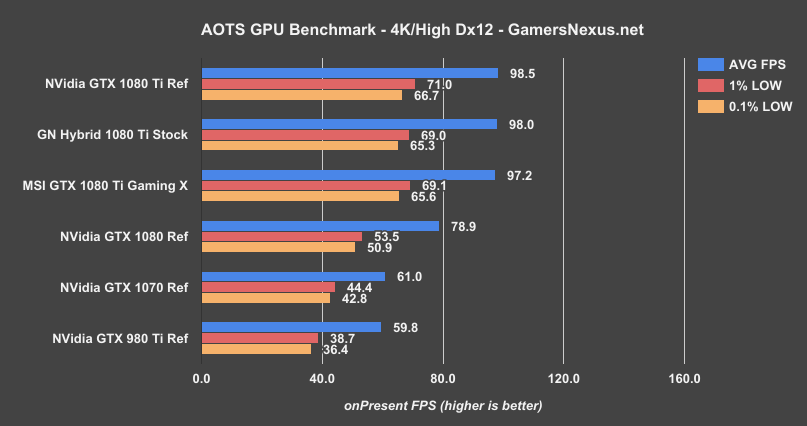
Ashes of the Singularity GPU Bench – 1080 Ti Gaming X
Mass Effect: Andromeda – MSI GTX 1080 Ti Gaming X
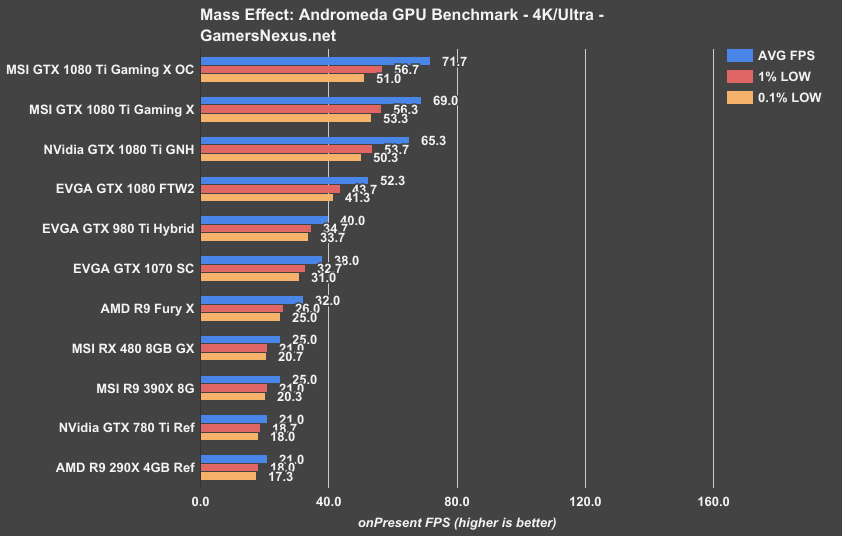
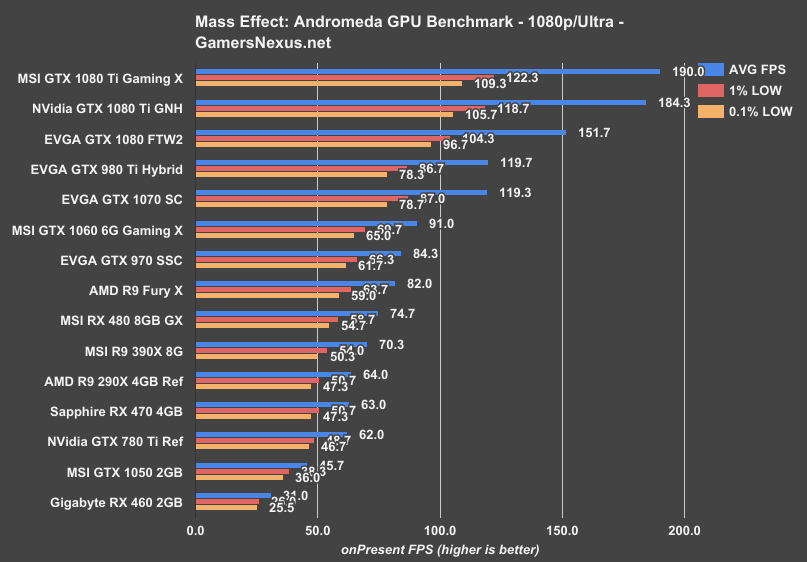
Mass Effect: Andromeda posts the GTX 1080 Ti Gaming X at 69FPS AVG, with lows at 56 and 53FPS. This is ahead of the 1080 Ti Hybrid mod pre-OC by about 5.6%, and behind the overclocked 1080 Ti Gaming X marginally. Overclocking the Gaming X card once again shows very little significance.
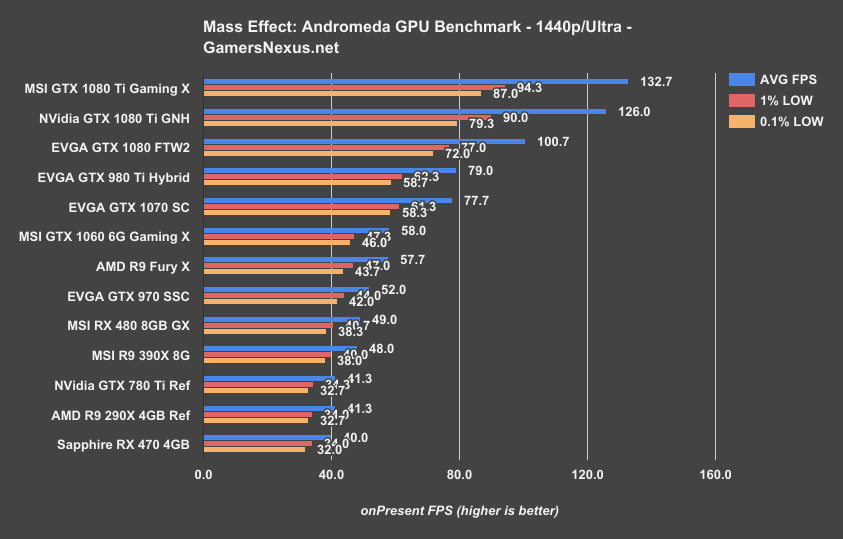
At 1440p, we see similar results: The 1080 Ti Gaming X places at the top of the chart, ahead of the 1080 Ti GN Hybrid card this time by about 5.3% -- roughly the same as the 4K delta.
Conclusion: Is the MSI GTX 1080 Ti Gaming X Worth It?
Overclocking isn’t exciting on this card. It’s already pushed more or less to the limit. As shown in our OC stepping table (below), the card becomes unstable in games once we get to a 75-100MHz offset on the core, and the gains are limited in average framerate (and sometimes negative in frametimes).
| Peak Clock (MHz) | AVG Clock (MHz) | Core Offset (MHz) | MEM CLK (MHz) | MEM Offset (MHz) | Power Target | Voltage | Pass/Fail |
| 1962 | 1873 | 0 | 1377 | 0 | 100 | 0.98 | P |
| 1962 | 1886 | 0 | 1377 | 0 | 117 | 1.043 | P |
| 1962 | 1936 | 50 | 1377 | 0 | 117 | 1.043 | P |
| 1987 | 1962 | 75 | 1377 | 0 | 117 | 1.043 | P |
| 2012 | 1974 | 100 | 1377 | 0 | 117 | 1.062 | P |
| 2062.5 | - | 125 | - | - | 117 | 1.081 | F |
| 2012 | 1974 | 100 | 1411 | 150 | 117 | 1.043 | P |
| 2012 | 1974 | 100 | 1426 | 200 | 117 | 1.043 | P |
| 2012 | 1974 | 100 | 1440 | 250 | 117 | 1.043 | P |
| 2012 | 1974 | 100 | 1465 | 350 | 117 | 1.043 | P |
| 2012 | 1974 | 100 | 1488 | 450 | 117 | 1.043 | F in some games |
| 2012 | 1974 | 100 | 1514 | 550 | 117 | 1.093 | F in some games |
| 2012 | 1974 | 75 | 1514 | 350 | 117 | 1.093 | P |
This is the kind of video card that you buy if hoping to install and forget the GPU without touching an OC. The Gaming X is well-built with regard to its thermal design and power design, both analyzed extensively in our coverage, and doesn’t ask an absurd amount. Still, at $750, the cheaper $700-$720 cards will provide an experience that – provided a better cooler than the FE unit – is largely the same in noise, thermals, and gaming performance. OC headroom on Pascal is limited in many ways, primarily by limitations in place that prevent extreme over-voltage, and that leaves the Gaming X priced a bit higher than competition that will ultimately provide the same experience (+/- 4% FPS isn’t a huge trade for +/-$30-$50). It’s up to you to decide whether the extra spend is worth it, when considering alternatives like the Gigabyte 1080 Ti OC or EVGA 1080 Ti SC.
Editor-in-Chief: Steve Burke
Video Producer: Andrew Coleman