The Ryzen 3 CPUs round-out AMD’s initial Ryzen offering, with the last remaining sector covered by an impending Threadripper roll-out. Even before digging into the numbers of these benchmarks, AMD’s R3 & R5 families seem to have at least partly influenced competitive pricing: The Intel i3-7350K is now $150, down from its $180 perch. We liked the 7350K as a CPU and were excited about its overclocking headroom, but found its higher price untenable for an i3 CPU given then-neighboring i5 alternatives.
Things have changed significantly since the i3-7350K review. For one, Ryzen now exists on market – and we’ve awarded the R5 1600X with an Editor’s Choice award, deferring to the 1600X over the i5-7600K in most cases. The R3 CPUs are next on the block, and stand to challenge Intel’s freshly price-reduced i3-7350K in budget gaming configurations.
And so before even officially launching, AMD’s lower end SKUs have done their job: The i3-7350K is $150 as of this writing (though we’ve seen it as low as $130), posing a threat for AMD’s new R3 venture. Finally, we’re seeing some responsiveness to the market.
Through the R5 launch, our price-sorted stack for gaming has largely started at the G4560, progressed to the R5 1600 or 1600X, and then topped-out at the 7700K for a pure gaming build. The R3 1200 at $110 and R3 1300X at $130 are now on-site to shuffle that stack further, with today’s benchmarking focusing on the more expensive of the two units. Our R3 1200 review goes live immediately hereafter, so stay tuned.
R3 1300X testing will prioritize gaming, power, and production tests, with thermal testing present primarily to determine whether the included “Stealth” cooler is capable of anything worthwhile.
CPU Test Methodology
Windows 10 b970 was used for testing. R7 CPUs have been retested; some i7 & i5 CPUs have been retested. Game settings were manually controlled for the DUT. All games were run at presets defined in their respective charts. All other game settings are defined in respective game benchmarks, which we publish separately from GPU and CPU reviews.
Average FPS, 1% low, and 0.1% low times are measured. We do not measure maximum or minimum FPS results as we consider these numbers to be pure outliers. Instead, we take an average of the lowest 1% of results (1% low) to show real-world, noticeable dips; we then take an average of the lowest 0.1% of results for severe spikes.
Hardware Used
Core Components (Unchanging)
- NZXT 1200W Hale90v2
- For DDR4 platforms: Corsair Vengeance LPX 32GB 3200MHz*
- For Ryzen DDR4: Corsair Vengeance LPX 3000MHz clocked to 2933MHz (See Page 2)
- Premiere & Blender tests do not exceed 8GB DRAM. Capacity is a non-issue for our testing, so long as it is >16GB
- For DDR3 platforms: HyperX Savage 32GB 2400MHz
- Intel 730 480GB SSD
- Open Air Test Bench
- Cooler #1 (Air): Be Quiet! Dark Rock 3
- Cooler #2 (Cheap liquid): Asetek 570LC w/ Gentle Typhoon fan
- Cooler #3 (High-end): Kraken X62
- EVGA GTX 1080 FTW1
Note: fan and pump settings are configured on a per-test basis.
AM4 Platform:
- GEIL X 3200MHz CL16 (R5s, R7 1700, R7 1800X)
- GSkill Trident Z 3200MHz CL14 (R7 1700X)
Used for R7 1800X, R7 1700X, R7 1700.
Z270 Platforms:
- Gigabyte Aorus Gaming 7 (primary)
- MSI Gaming Pro Carbon (secondary - for thermal validation)
- i7-7700K (x2) samples from motherboard vendors
Both used for the 7700K.
Z170 Platform:
- MSI Gaming M7
- i7-6700K retail
Z97 Platform:
- Gigabyte Z97X G1 WIFI-BK
- i7-4790K
Z77 Platform:
- MSI GD65 Z77
- i7-2600K
Dx12 games are benchmarked using PresentMon onPresent, with further data analysis from GN-made tools.
Note: We'd like to add the i5, i3, and FX CPUs, but this was enough for now. We'll add those as we expand into coverage of Zen or i5 Kaby Lake products.
Continue to the next page for power & thermals.
Power Testing – AMD R3 1300X vs. 7350K, R5 1600X, & More
We’re moving on from wall meter power consumption testing and instead measuring power drawn at the EPS12V cables. This at-the-rails method of current measurement allows us to calculate power consumption in wattage, resulting in a more accurate, granular reading for power utilization by the CPU. Other big contributors to power consumption – namely the GPU – are eliminated from measurements in this way, and so we can better isolate CPU power behavior.
Power testing is something we only just added when working on Vega, so we’re working on porting power testing over to X299 and other CPUs. For the meantime, we’ve tested the R3 units, the 1700, the 7350K, and we’re adding a couple others on as we go. Again, this isn’t at the wall measuring – we are clamping the EPS12V outputs. We won’t have a full list of components tested for power consumption immediately, but it’s on the way. This is our debut of our new CPU power consumption testing.
R3 1300X Power Consumption – Idle
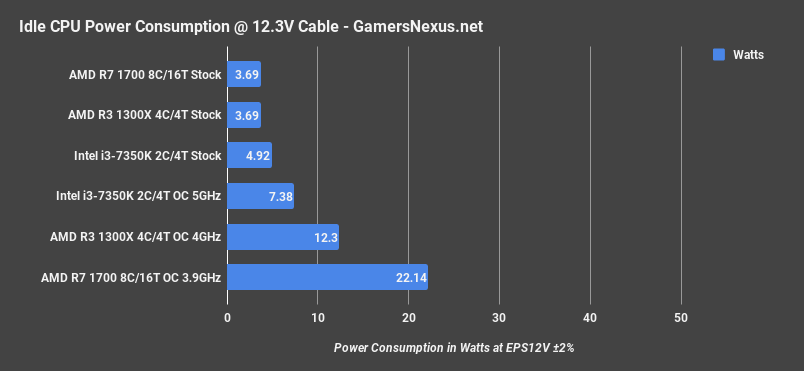
Under idle Windows 10 conditions, the AMD R3 1300X stock CPU consumes about 3.7W on our ASUS Crosshair Hero VI motherboard, +/-2% error. For comparison, the Intel i3-7350K is showing 4.9W, or about 7W when overclocked.
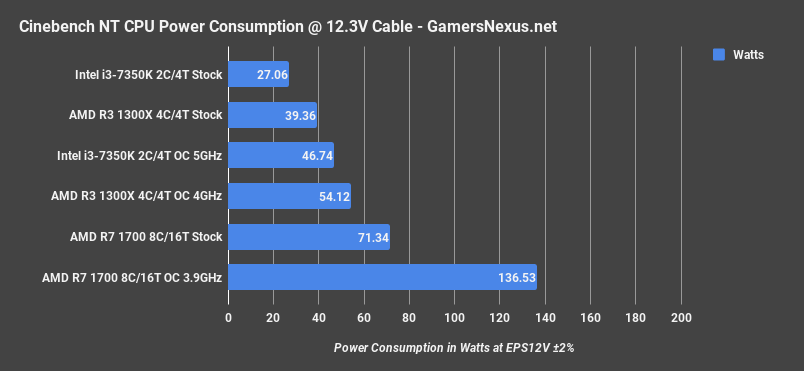
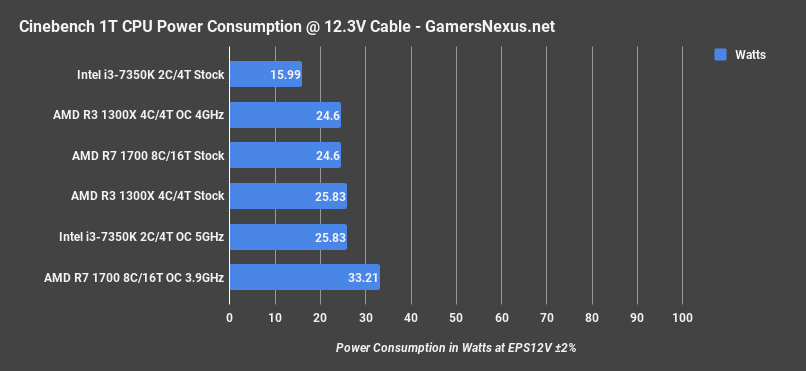
R3 1300X Power Consumption – Cinebench
R3 1300X Power Consumption – Blender
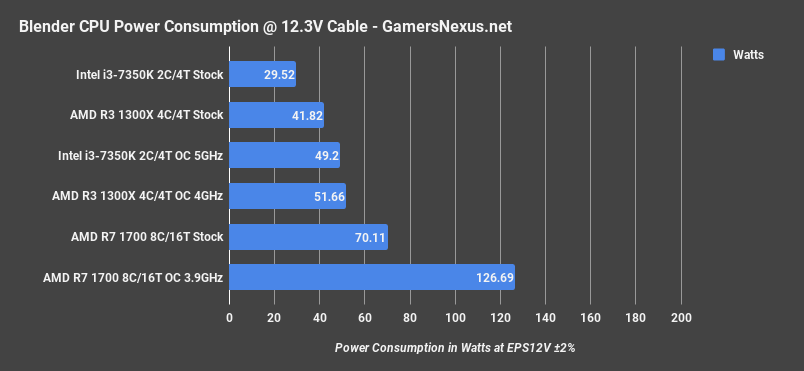
A Blender workload consumed 42W for the stock 1300X, with an overclock increasing power consumption to 52W, or 24% more power for what we later find out is 4.6% render time reduction. The i3-7350K consumes about 29.52W during this workload, with the overclock growing power consumption to 49.2W. The 7350K appears to be less power hungry than the R3 1300X as of now.
R3 1300X Power Consumption – FireStrike Physics
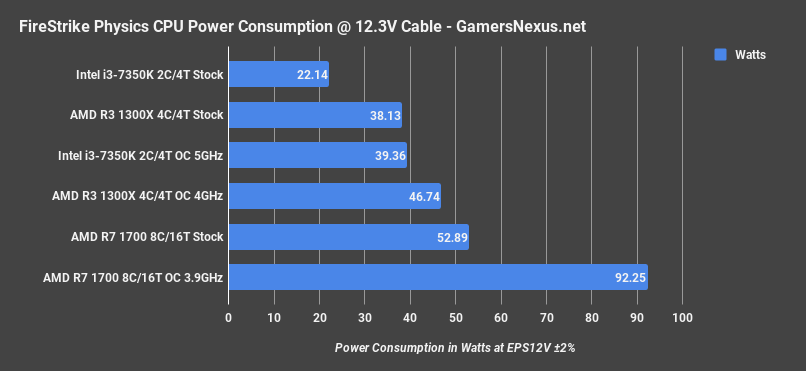
A FireStrike Physics test shows us some gaming workloads, placing the 7350K at 22W, the 1300X at 38W consumption, with the overclocked 7350K at 39.4W when on a 1.35v Vcore. The 1300X pushes to 47W when overclocked.
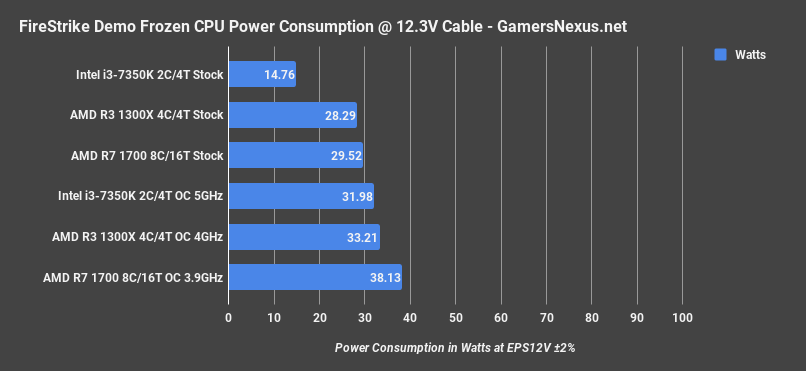
R3 1300X Power Consumption – 3DMark FireStrike Demo Frozen
R3 1300X Power Consumption – Total War: Warhammer
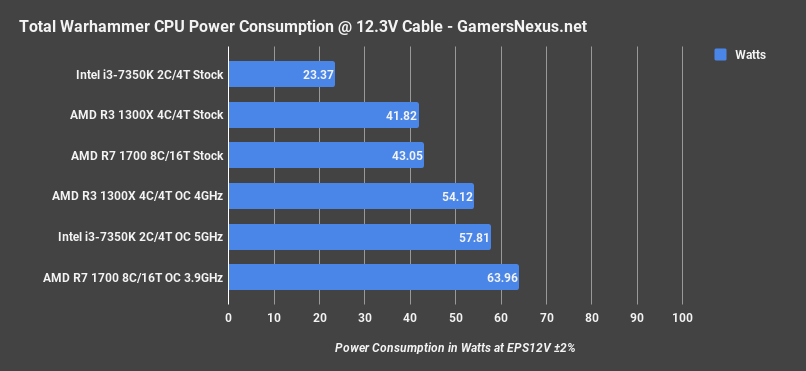
Total War: Warhammer is our real gaming workload. The 7350K pulls 23W to run this game, with the 1300X at 42W stock. Overclocking each increases their power consumption metrics to 54W on the 1300X and 58W on the 7350K.
R3 1300X Power Consumption – Prime95 28.5 LFFTs
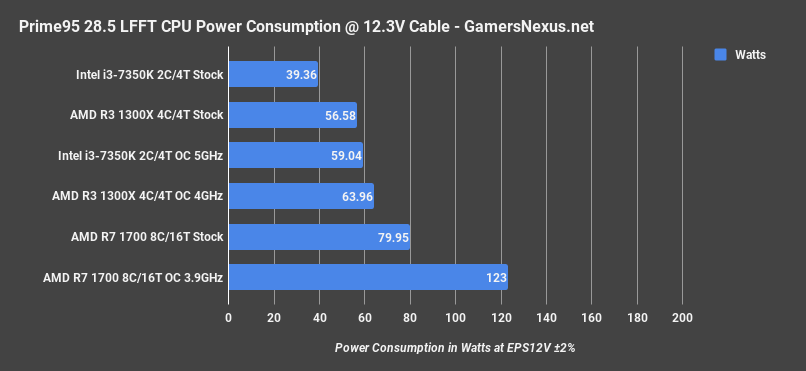
With Prime95 LFFTs, we observed a power consumption of 39W on the 7350K and 56.6W on the R3 1300X, with the overclocked counterparts at 59W and 64W, respectively.
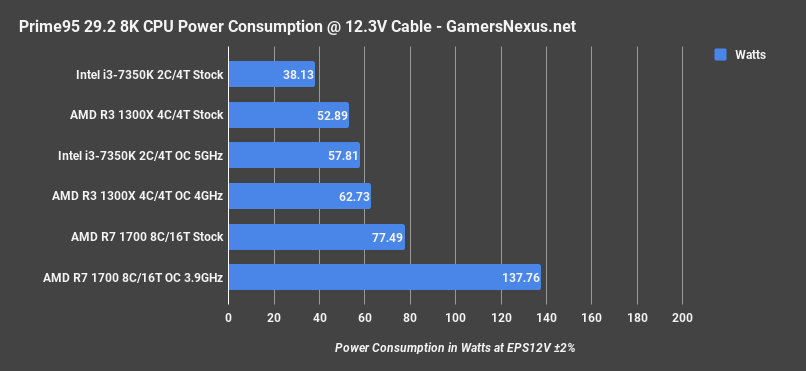
R3 1300X Power Consumption – Prime95 29.2 8x8 FFTs
R3 1300X Stock Cooler Thermals – AMD Stealth
We’ve also completely overhauled our thermal testing for CPUs, so this one starts out just with the stock cooler performance. This endeavor of overhauling power and thermals is a hand-in-hand effort and will take time (read: CPU launches) to stack data. We’re expanding this for a feature piece soon, including the previously promised X299 thermal piece. Note also that we ran all of our actual testing with the standard X62 that we always use, so no thermal throttling occurred.
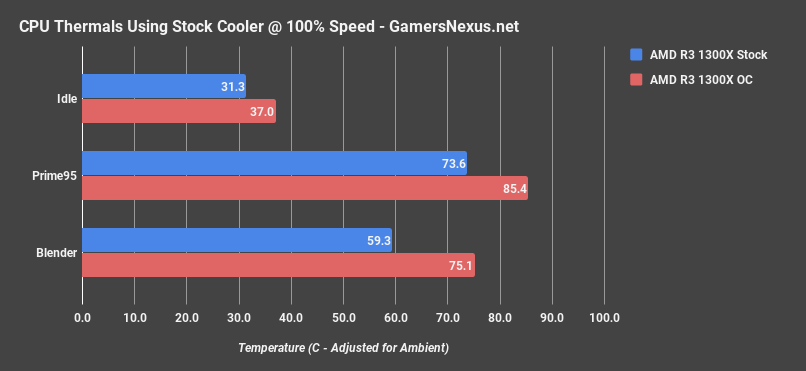
As for the stock cooler, operating temperature landed at 59.3C when executing a Blender workload with the stock configuration and max fan speed – definitely up there. Prime95 29.2 with 8K sizes burned at 74C, which is rapidly approaching the 85C shutdown threshold that we encountered when running the stock cooler with our overclock.
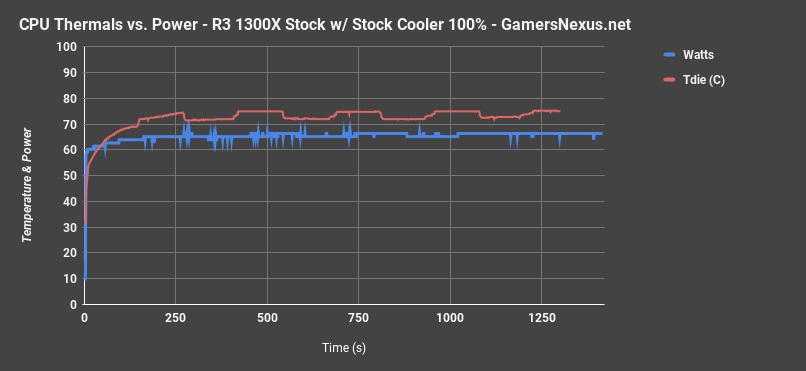
Here’s a look at power consumption over time, temperatures, and power leakage with the stock cooler:
Continue to the next page for Blender, Premiere, & synthetic performance.
AMD R3 1300X Blender Benchmark vs. 7350K, R5 1500X, 1600X, 7600K
Before getting into gaming performance, let’s take a look at Blender animation render times and Premiere encode times.
With our in-house Blender test scene, the AMD Ryzen R3 1300X stock CPU completes the render in 89.2 minutes, ranking the CPU just ahead of AMD’s once-flagship FX-8370 stock CPU and just behind Intel’s Nehalem i7-930 stock CPU, or about 8.6% behind the i5-2500K overclocked to 4.5GHz, and similarly behind the Phenom II X6 CPUs at 81 minutes.
Compared more reasonably to the Intel i3-7350K, the stock R3 1300X CPU completes its render about 2 minutes faster, for a time reduction of 2.3%. Overclocking the R3 1300X results in a render time reduction of 4.6% from the stock R3, or 6.8% from the stock 7350K. Overclocking the 7350K to 5GHz boosts speed to 78.3 minutes, reducing render time by 12.2% from the overclocked 1300X.

Using an R5 CPU would net a significant boost, as shown here. If CPU rendering on a budget is your use case, consider a step-up to the R5 series. The R3 doesn’t host the same thread-count benefit that R5 offers over i5 CPUs, and so offers unimpressive (but reasonable, all things considered) Blender rendering performance. If CPU-based rendering is part of a common use case for a build, we’d strongly recommend the R5 alternatives.
AMD R3 1300X Adobe Premiere Benchmark vs. R5, R7 CPUs
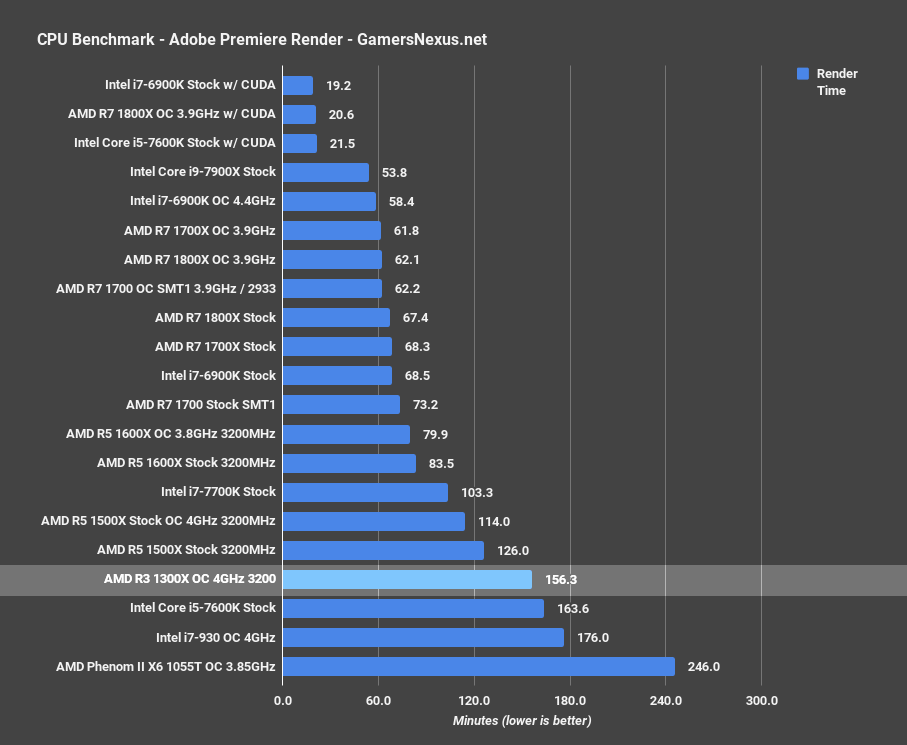
Rendering a 1080p60 AVCHD source video into a video card review takes 156 minutes on the R3 1300X when overclocked to 4GHz, or 2.5 hours. The 1500X stock CPU reduces this time requirement by 19%. We didn’t run this test stock on the 1300X, as it’d just take far too much time to be worth it. Premiere is not a good use case for the R3 CPUs. Don’t be talked into thinking that the R3 will suffice for any meaningful production work in Adobe Premiere. Rendering can be drastically accelerated by CUDA in some instances, but that doesn’t help with certain types of effects or some preview playback. Although it is possible to use an R3 CPU for this task, we would recommend purchasing something better suited for video production, if that’s the desire.
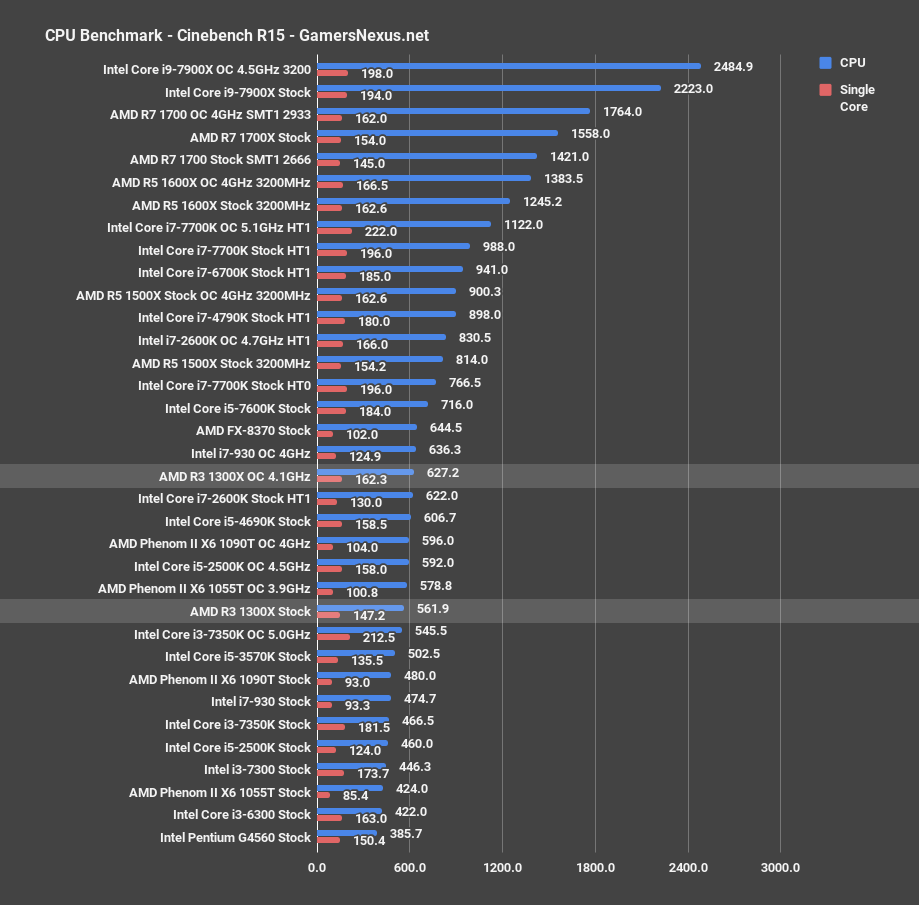
AMD R3 1300X Cinebench vs. 7350K, 7300, R5, G4560
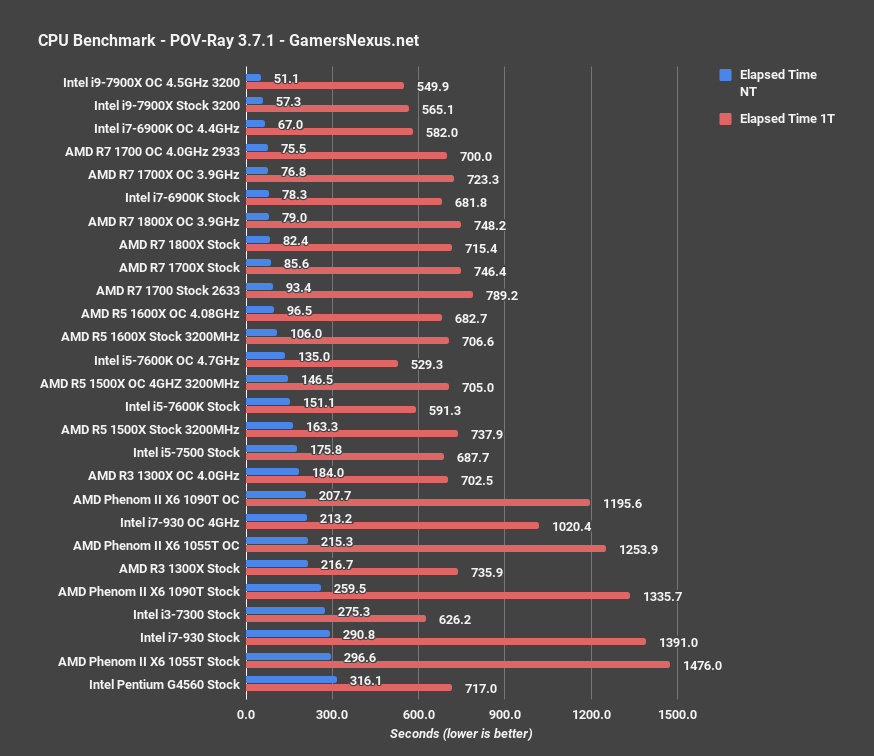
AMD R3 1300X POVRay Benchmark
AMD R3 1300X FireStrike

Continue to the next page for gaming performance.
Total War: Warhammer – R3 1300X vs. i3-7350K, i3-7300, R5 1500X
Starting with Total War: Warhammer, first note that items containing asterisks have been run with the most recent version of Total Warhammer, which we have plotted as improving FPS by several percentage points on both AMD and Intel CPUs. All the relevant units were updated for this review.
The AMD R3 1300X stock CPU performs at an average framerate of 118FPS, with lows at 71 1% and 65 0.1%. The closest current-gen neighbor is the i3-7300 stock CPU at 128FPS AVG, with lows comparably timed. Given that the 7300 and 7350K have both been $150 for a while, we can next look to 7350K stock performance at 134FPS AVG. This plants the 7300 and 7350K 8% and 13% ahead of the 1300X stock CPU, respectively. The 7300 is locked, so that’s the end of its performance; overclocking the 1300X to 4.1GHz permits the R3 CPU to surpass the 7300 in gaming performance with this title. The 7350K overclocked to 5GHz boosts to 150FPS AVG, leading the 1300X OC by 16% in AVG FPS, with lows also ahead following the Total War update.

Battlefield 1 – R3 1300X vs. 7350K, 7600K, G4560

Battlefield 1 is next, and is also on the list of titles that received an update boosting both Intel and AMD performance.
In this game, the 1300X operates an average FPS of 110, which places the R3 CPU ahead of the FX-8370 and i7-930 by about 14%, with the G4560 leading the R3 1300X stock CPU by about 2%. Battlefield 1 has routinely shown strong performance on Intel CPUs, so this isn’t all that surprising. Overclocking the 1300X bolsters performance to 116FPS AVG, a gain of 5.9% over the stock performance. This lands the 1300X OC around the 2500K. For a current-gen comparison, the 7300 CPU averages 125FPS for a 14% lead over the stock 1300X and 7.8% ahead of the overclocked 1300X.
Looking to the 7350K, which received its price drop almost certainly because of Ryzen 3, performance leads by 17% at 128FPS AVG stock, or 17% when both the 7350K and 1300X are overclocked.
Watch Dogs 2 – R3 1300X vs. i3-7350K, G4560, R5 1600X
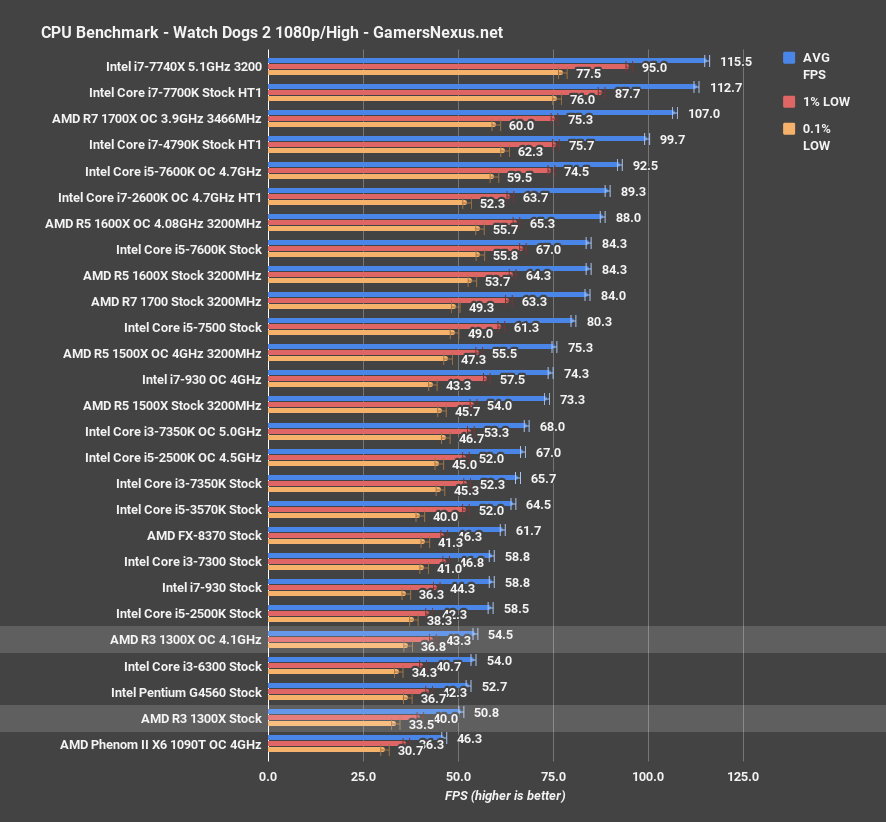
Watch Dogs 2 has proven to be a heavily multithreaded game, and has benefited from higher core and thread counts in the past.
Here, the R3 1300X CPU operates at 51FPS AVG stock, with lows at 40 1% and 33.5 0.1%. Overclocking to 4.1GHz gets us an improvement of 7.3%, now at 54.5FPS AVG instead. This plants the i3-6300 right between the R3 1300X stock and overclocked values, at 54FPS AVG, and runs the 1300X stock CPU behind the 7300 locked CPU by 16%. That’s pretty comparable to what we’ve been seeing the rest of the tests. Overclocking closes the 7300’s lead to 7.9%. The 7350K stock CPU manages 66FPS AVG, for a lead of 30% stock. Overclocking doesn’t do much for the 7350K’s performance here, though we do gain another couple of frames per second.
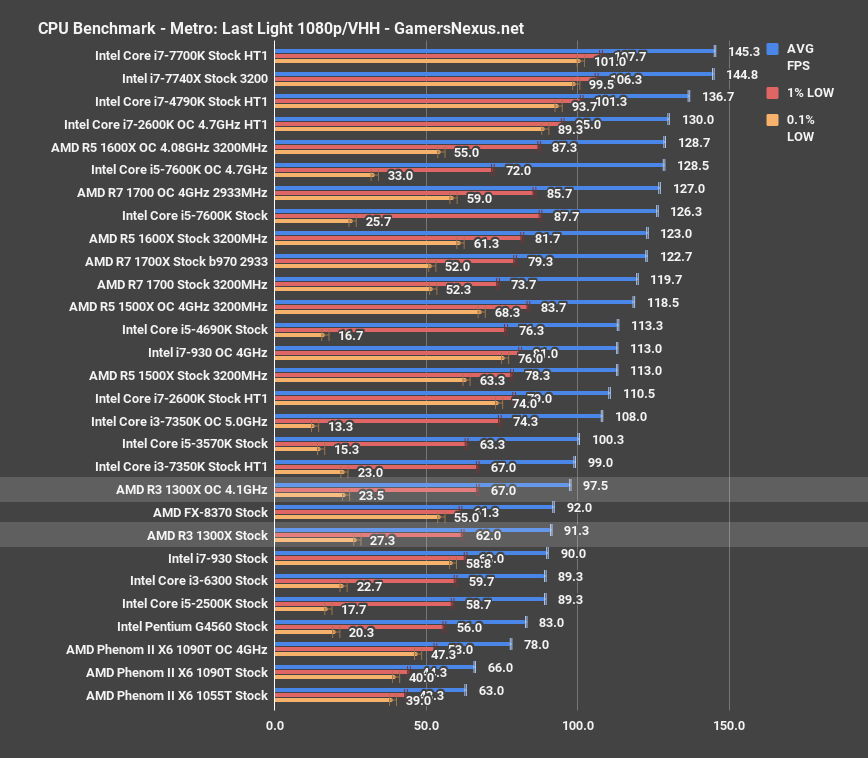
Metro: Last Light – R3 1300X vs. i3-7350K
GTA V – R3 1300X vs. i3-7350K, i5-7500
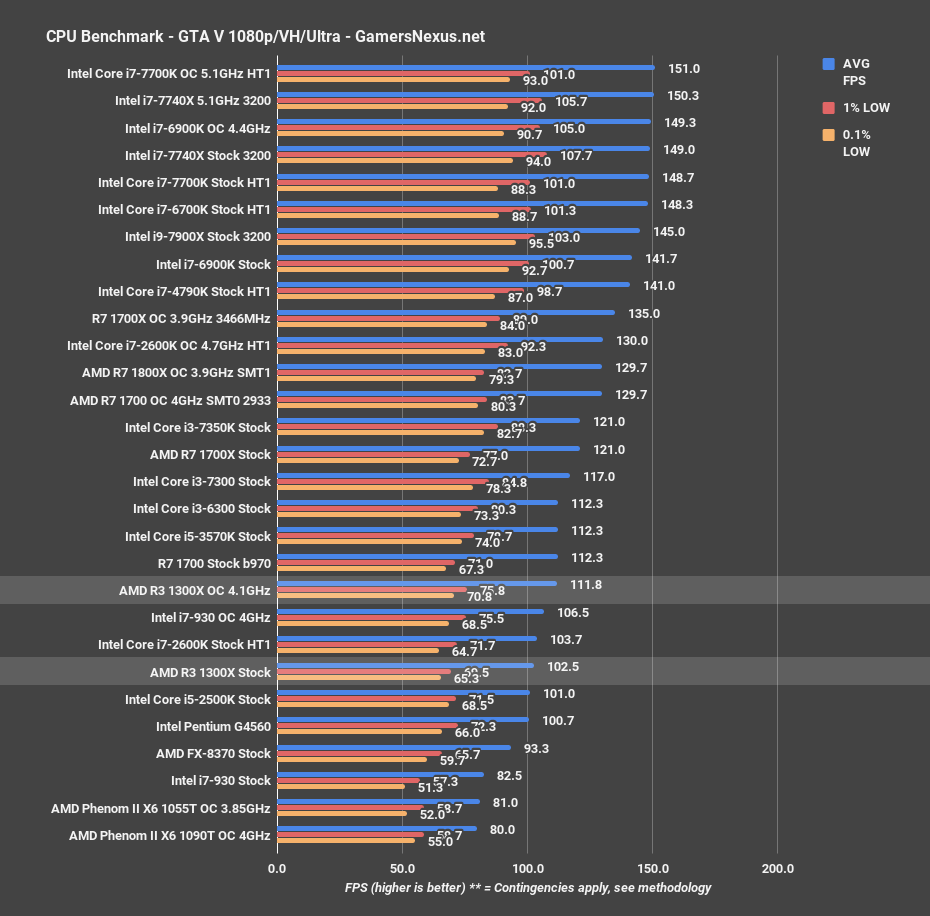
Ashes of the Singularity – R3 1300X Benchmark
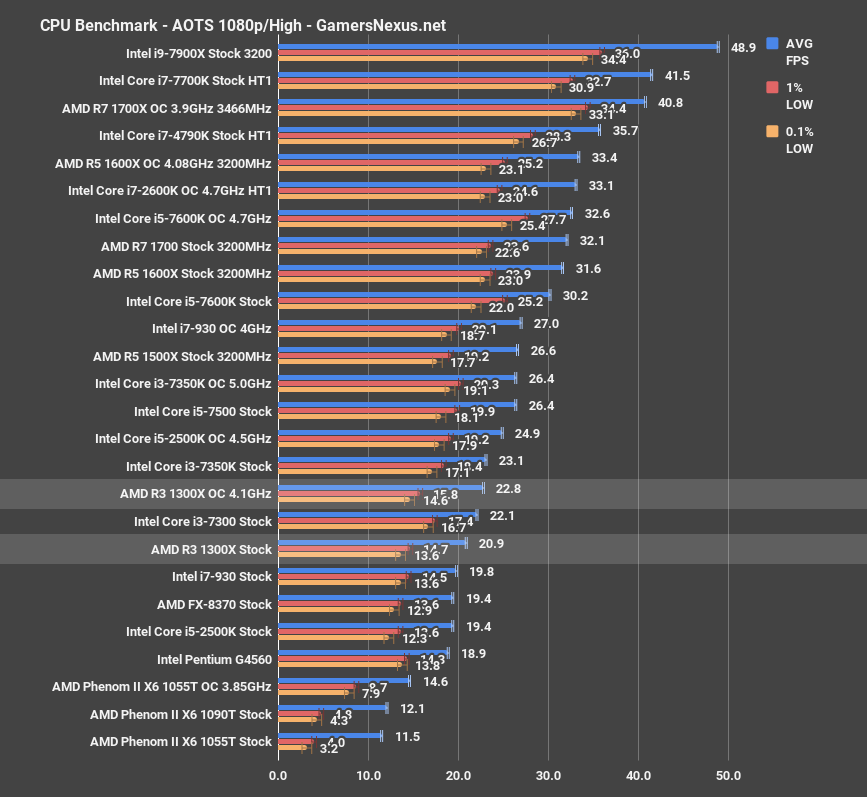
Ashes of the Singularity is mostly treated as a synthetic benchmark, at this point, and so isn’t really a game scenario. We mostly use it to understand scaling. The R3 1300X stock CPU operates at 21FPS AVG, placing it between the i3-6300 and FX-8370. The i3-7300 CPU operates 5.7% faster, and overclocking the 1300X to 4.1GHz boosts it beyond the 7300 by 3%. The 7350K stock CPU outperforms the 1300X overclocked CPU marginally, though sustains better low-end performance, and overclocking the 7350K boosts it to 16% ahead of the 1300X overclocked. This is about the same spacing as we saw in other tests.
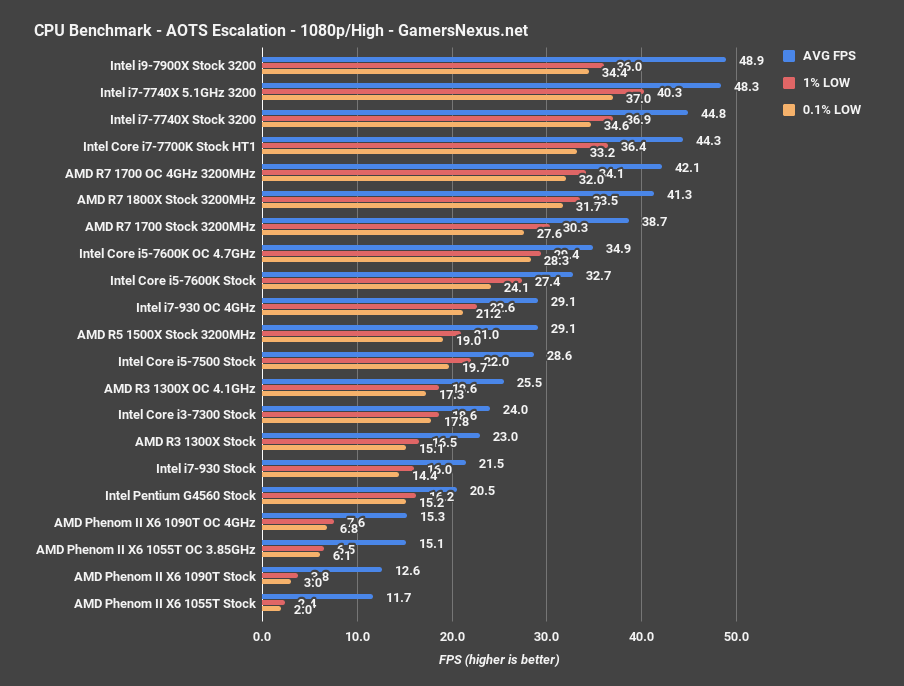
Here’s AOTS: Escalation –
Conclusion: AMD R3 1300X vs. i3-7350K
The R3 CPUs are interesting. They’ve already inspired Intel to respond to competition by dropping the 7350K price to $150, from its previously untenable $180 price-point. This makes the 7350K a real competitor, and not too distant in price. AMD’s 1300X runs a $130 price target, performs reasonably in games if generally behind, and manages decent performance in our synthetic and production tasks. That said, you really don’t buy this thing for that purpose – if even occasional creative workloads are on the mind, we’d still recommend seriously considering stepping up to an R5 product. They are significantly better suited for such tasks, and an R3 – although technically capable – only stands to hinder production. We cannot recommend enough the move to a higher-tier CPU for anything beyond “occasional hobbyist” content production work.
The R3 CPUs pose a real threat to Intel’s i3 lineup. The G4560 holds strong at the cheaper price-point, and the R3 doesn’t challenge in that territory, but the i3s have already been weakened by Intel’s own G4560 and now by AMD’s R3s. The i3-7350K is a superior CPU in nearly all the gaming tests, and manages to hold a lead in Blender rendering when overclocked. That said, the 1300X outperforms the 7350K in Blender when stock. The 7350K looks a whole lot better with its price reduction, and is precisely what reactionary competition resembles. The 1300X isn’t so far behind to be useless and comes in a bit lower in price.
If an IGP is of interest, cost on a dGPU can be saved by going with an Intel i3 part. This helps hold the line in SI builds where an IGP might be preferred for biz-client type systems. For gaming builds, that’s not as much of a concern, and the R3 1300X can help save $20 by cutting the IGP and some gaming performance. You’re probably putting a dGPU in there, anyway.
Definitely get rid of the stock cooler if doing any kind of overclocking, as we experienced thermal shutdowns with the stock cooler and an OC. The stock cooler holds when the CPU is used out-of-box, though not very well. We’d recommend something more suitable.
The R3 CPUs compete well. We still think AMD’s stronghold is in the R5 1600 and 1600X units, where it makes little sense to buy a competing i5 even for gaming machines, but the R3s round-out the pack. They’re not nearly as exciting as the R5 CPUs, but not bad. The cores and threads argument kind of vanishes here, as the 7350K ultimately does host the same thread-count and achieves similar performance in most tested tasks, so it just boils down to platform choice, upgrade pathways, and whether saving a couple bucks is important.
Update: We’re now seeing the i3-7350K as low as $130 on some retailers. If that price holds, it’s looking like the 7350K may well be the winner at the price-point. We’ll have to wait for pricing to stabilize to fully call it.
Editorial, Test Lead: Steve Burke
Test Technician: Patrick Lathan
Video Producer: Andrew Coleman