This content piece will explore the performance anomalies and command line options for the Final Fantasy XV benchmark, with later pieces going detailed on CPU and GPU benchmarks. Prior to committing to massive GPU and CPU benchmarks, we always pretest the game to understand its performance behaviors and scaling across competing devices. For FFXV, we’ve already detailed FPS impact of benchmark duration, impact of graphics settings and resolution on scaling, we’ve used command line to automate and custom configure benchmarks, and we’ve discovered poor frametime performance under certain benchmarking conditions.
We started out by testing for run-to-run variance, which would be used to help locate outliers and determine how many test passes we need to conduct per device. In this frametime plot, you can see that the first test pass, illustrated on a GTX 1070 with the settings in the chart, exhibits significantly more volatile frametimes. The frame-to-frame interval occasionally slams into a wall during the first 6-minute test pass, causing noticeable, visible stutters in gameplay.
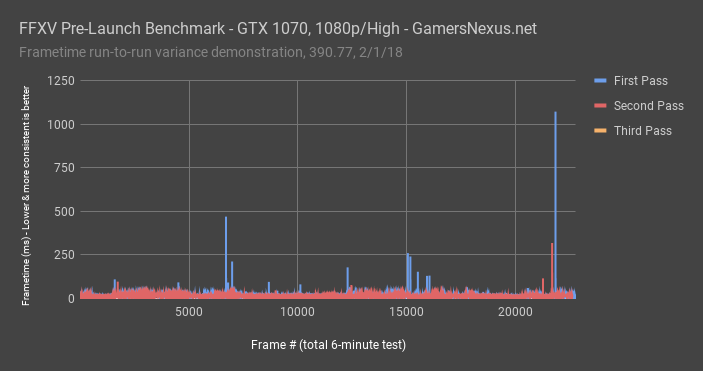
The second pass was noticeably more consistent in frametime interval, though it did still encounter one spiked frametime in excess of 250ms – bad enough to notice a stutter. This was over the 6-minute period. That said, that’s one spike over 250ms, as opposed to spikes over a full second for the first run. A 1200ms frametime means that you’re left staring at the same frame for a full 1 second – in other words, you’re getting less than 1FPS, technically speaking, for that interval. The average still hits 65FPS for both of these passes, even in spite of the 1000ms frametime, and that’s because we’re averaging nearly 30,000 frames. As a reminder, you’d need about a 16.667ms frametime interval to achieve an effective 60FPS.
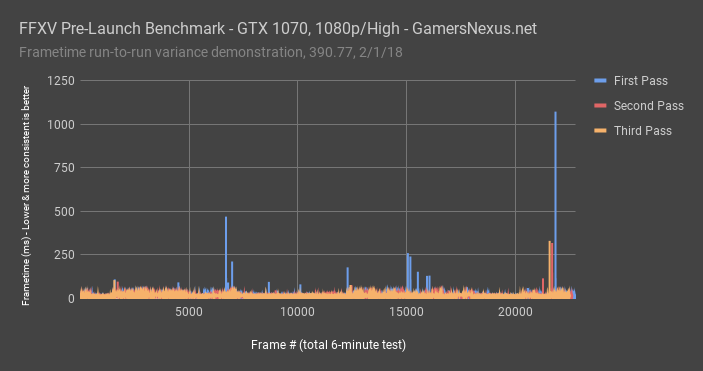
Run 3 exhibited similarly smooth behavior to run 1. We have now observed across 6 GPUs that the first run, particularly with 1080p/High settings, appears to have worse 1% and 0.1% lows than subsequent runs.
Explaining the FFXV Graphics Settings
For graphics settings, reddit user “randomstranger454” detailed all the lower-level settings options for the three presets in the game. The benchmark launcher only gives the ability to switch between preset low, medium, and high. Knowing the lower-level details tells us where GameWorks and other graphics options are enabled and disabled, giving us a look at two things: (1) a potentially closing relative performance gap between AMD and nVidia as lower level graphics options are configured, as these disable GameWorks technology, and (2) a look at future options for the full game.
Let’s start with the GameWorks options.
Setting | High | Middle |
NVIDIA Flow | On | Off |
NVIDIA HairWorks | On | Off |
NVIDIA Shadow Libs | Off? | Off |
NVIDIA Terrain Tessellation | On | Off |
NVIDIA Turf | On | Off |
NVIDIA VXAO | Off? | Off
|
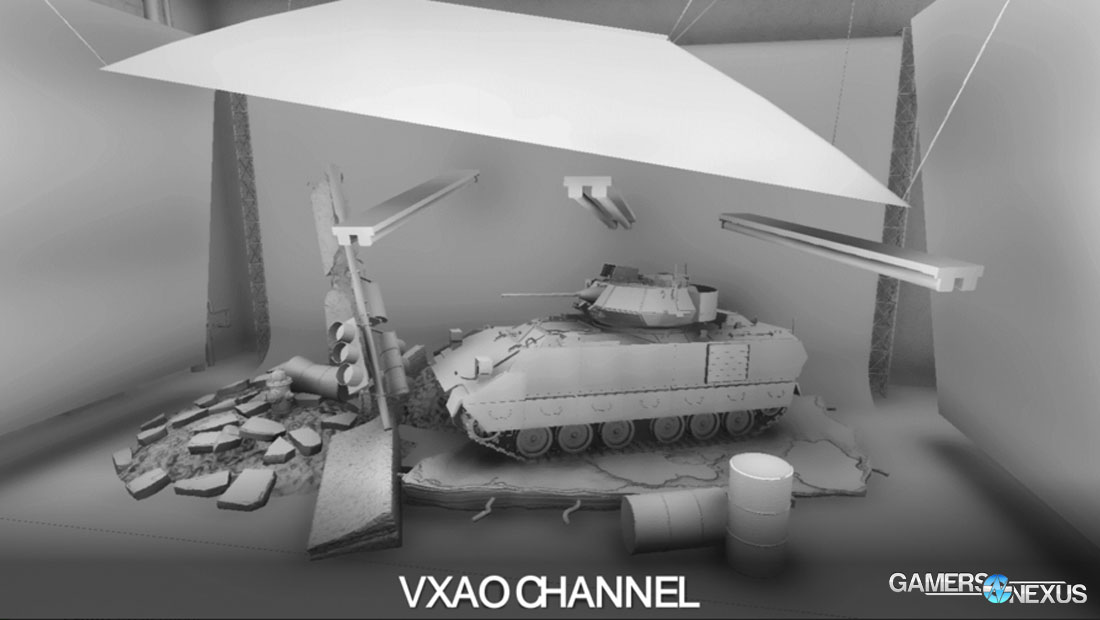
The High preset is presently the only time that GameWorks graphics options are enabled, and two of those options supposedly remain disabled for the benchmark utility. The ShadowWorks library is disabled at present, as is voxel-accelerated ambient occlusion. That said, the same user who detailed these settings as disabled later posted a screenshot of the on-screen display, having hacked it to work in FFXV, and now believes that VXAO is enabled for 1080p/High settings. Either way, we previously detailed most of these graphics settings when they were unveiled, back at GDC 2016. VXAO converts the screen space into voxels based upon geometric data, which reduces the complexity present from raw triangles and primitives. VXAO then runs a cone-tracing pass for shadowing computation. The result is that ambient occlusion can theoretically be calculated more accurately, demonstrated with nVidia’s tank asset.
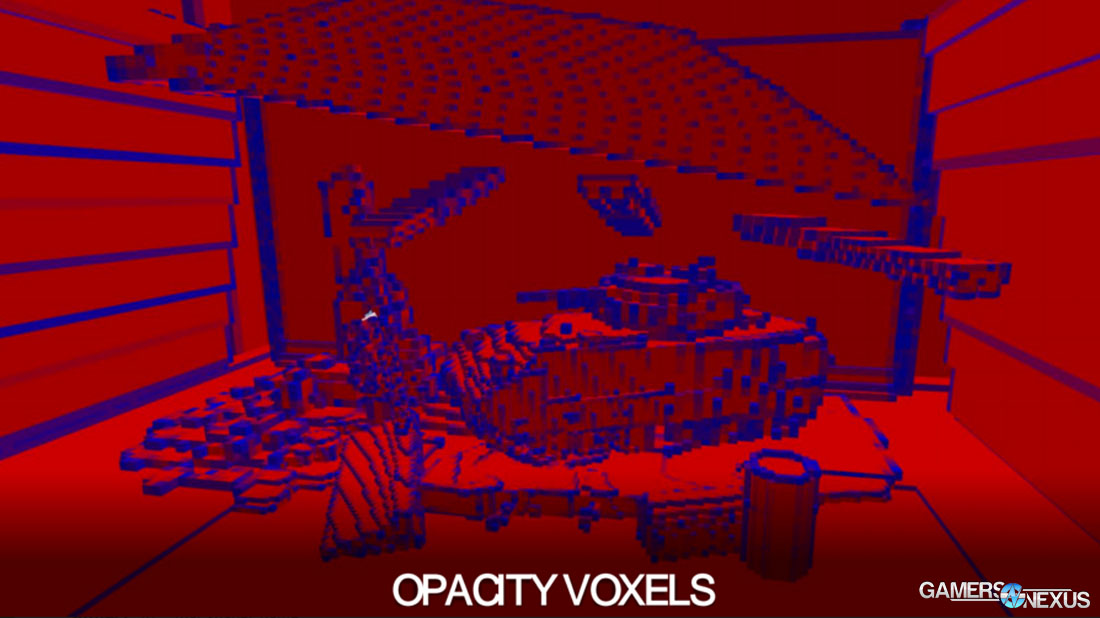
In this example, blue voxels are partially occluded and red voxels are completely covered by the volume of geometry. Cone-tracing draws lines from each point to calculate how much occlusion exists from the respective points, traced into the hemisphere around that point. To learn more about this, click our old article linked below.
VXAO does require Maxwell architecture and up. We are unsure how well VXAO will work on AMD, if at all. As for the rest of the GameWorks options, those are all enabled.
AMD vs. NVIDIA Scaling with GameWorks Off/On
Let’s pull some quick data out of our upcoming GPU benchmark. This will look at relative performance scaling between the RX 580 and GTX 1060 6GB cards, switching between Medium and High settings. The idea is to see if relative scaling worsens with the higher settings, as that is where nVidia theoretically has more optimization. Keep in mind that more than just the GameWorks settings change between medium and high, but those are most likely to be drivers in performance deltas.
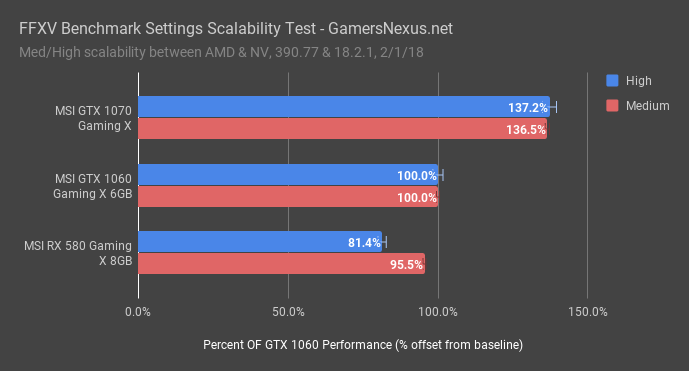
The GTX 1060 6GB card is baseline here, marked at 100% performance. The GTX 1070, under both medium and high settings, maintains 137% of the GTX 1060’s performance. It is almost equal for both presets.
UPDATED Section: The RX 580 maintains 81.4% (original test indicated 60%, we discovered some more issues with the benchmark that caused us to rerun tests) of the GTX 1060 performance when using High settings, or 95.5% (original text said 66.6%) of the GTX 1060’s performance when using low settings. AMD is regaining ground at medium settings, which means that at least one of the settings enabled under “High” is more taxing for the RX 580 than it is for the GTX 1060. This comes down to shader-level optimization and/or architectural level differences, where shader-level optimization would also account for driver and library differences involving GameWorks. We cannot conclude that GameWorks is the cause of the 6-percentage-point disparity, but it is a likely contributor, as it is reasonable to assume that GeForce would process those nVidia effects with greater performance.
CPU numThread & AsyncThread Commands
For CPU testing, we ran command line benchmarks using the numThreads & numAsyncThreads commands, checking for performance disparities on our stock R7 1700 platform and on a stock i7-8700K platform. Our thanks to Peerless Girl of the GN Patreon backer Discord for helping troubleshoot these commands. The goal was to determine if either command impacts Intel or AMD differently, not to match the CPUs head-to-head. That’ll come later.
First of all, here’s the utilization difference on the R7 1700:
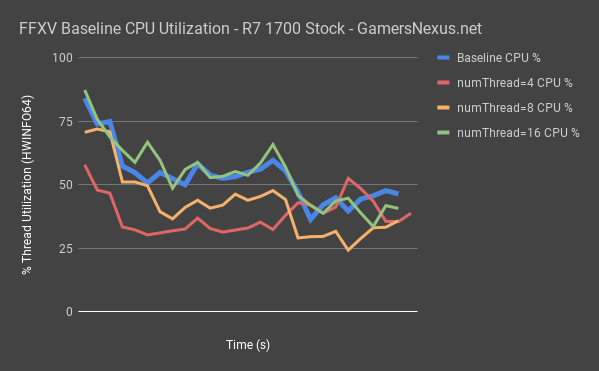
This chart shows all those tests at once. We’re seeing the highest utilization when set to 16 threads, with baseline also roughly equating numThreads=16. Halving to 8 threads noticeably reduces CPU utilization, so the function appears to be working. Going to 4 threads further reduces utilization, aside from one spike toward the end of the test.
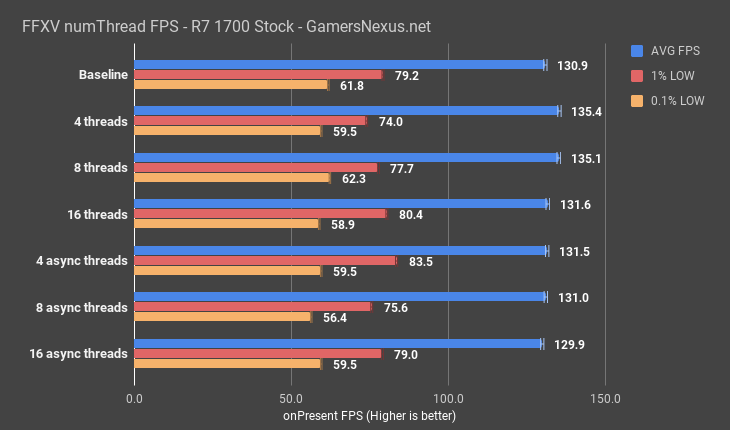
Ultimately, it comes down to FPS: although an ad-hoc test, we did collect data that seemed to indicate a baseline FPS, using a 1080 Ti, of about 131FPS AVG. Using numThreads =4 or =8 gave us 135FPS AVG, which is just outside of acceptable margins of test variance. numThreads=16 didn’t seem to show uplift outside of error. This appears to be a limitation of the GPU. With a 1080 Ti at 1080p/Medium settings, we’re still plotting about 94% utilization on the GPU. We could potentially show a bigger difference in what this command is doing, but it would enter the realm of being entirely academic. A G4560 might show a difference, or ultra-low, sub-720p resolutions on the 1080 Ti.
As for numAsyncThreads, we’re really not sure if the feature works right now, or how it’s supposed to work. There’s no real documentation for it. We tried numAsyncThreads=16, 8, and 4, and saw about the same performance across all three runs and baseline. It’s possible that it’s not enabled, that it doesn’t like this CPU, or that we just don’t know how to use it properly. If you have an idea on using this command, let us know below.
We also ran this testing for the 8700K, but found it to be completely pointless – we were up against GPU bottlenecks, even at 1080p/Medium.
And here's the trouble: We're GPU bottlenecked. It would be possible to derive greater performance gains from these arguments, but that becomes an academic endeavor. This is something we might revisit once we get to lower-end CPUs in our benchmark. For now, we'd need to reduce the GPU bottleneck, and with no SLI support, the primary way to do that would be to lower the CPU SKU or lower the settings into the ground. We'd have to drop to unrealistic resolutions -- ones we've never tested on the site, like 720p or even 480p -- in order to remove the GPU bottleneck from the 1080 Ti while hosted by the 1700 CPU.
Standard Deviation, Variance, & Test Duration
Standard deviation is another aspect of our data analysis for new benchmarks. At time of filming this, we’ve only completed half of our nVidia cards and one of our AMD cards – we were waiting for AMD to push today’s driver revision prior to testing, which they just did moments before filming this.
| STDEV - 1080p/High | AVG FPS | 1% LOW | 0.1% LOW |
| MSI GTX 1070 Gaming X | 2.7 | 2.3 | 2.0 |
| MSI GTX 1060 Gaming X 6GB | 1.3 | 2.3 | 2.7 |
| EVGA GTX 1080 FTW1 | 3.7 | 5.4 | 4.4 |
| MSI RX 580 Gaming X 8GB | 0.1 | 0.1 | 0.2 |
| EVGA GTX 1080 Ti FTW3 | 4.2 | 1.5 | 1.4 |
| STDEV - 1080p/Medium | AVG FPS | 1% LOW | 0.1% LOW |
| MSI GTX 1070 Gaming X | 0.3 | 0.8 | 1.3 |
| MSI GTX 1060 Gaming X 6GB | 0.5 | 1.3 | 1.4 |
| MSI RX 580 Gaming X 8GB | 0.3 | 1.1 | 0.9 |
Using our still limited dataset, starting with 1080p/High, we can see that standard deviation is relatively consistent across 4 runs, though exhibited greater variance in our GTX 1080 test. We may rerun the GTX 1080 as a result of its wider deviation from the norm. The RX 580 has the least deviation, but this is also because it has the lowest framerate with these settings – it’s struggling at 1080p/High, something we’ll talk about in our GPU benchmark. Much of this has to do with terrain tessellation.
At 1080p/Medium, with the GameWorks settings disabled and tessellation turned down, we’re observing tighter results, with standard deviation on AVG FPS below 1 point for the three presently tested devices, or below 1.5FPS for the 1% and 0.1% low values. The RX 580 also was consistent in its testing. This gives us reasonable margins for error of +/- a couple FPS. We’ll further refine this data prior to our GPU benchmark publication.
CPU benchmarks are also forthcoming, of course. Those will post shortly after the GPU benchmarks.

For test durations, we found that the full 6-minute benchmark produces roughly equivalent results to a 60-second test pass, or even a 30-second pass, with relative scalability cross-vendor also scaling equivalently between 6 minutes and 30 or 60 seconds.
As for SMT, we'll spoil that we've found performance uplift on the R7 1700 (stock and overclocked) by disabling SMT altogether. This seems to coincide with the numThread=8 performance uplift.
Editorial, Host, Testing: Steve Burke
Testing: Patrick Lathan
Video: Andrew Coleman