The AMD RX 7800 XT is one of the better value cards this generation -- but the 6800 XT is better.
The Highlights
- The AMD RX 7800 XT and 7700 XT fill-in AMD's mid-range
- Value as compared to the remaining 6800 XT stock is rough
- Overall, the 7800 XT is better positioned than many other recent launches
- Original MSRP: $500
- Release Date: September 6, 2023

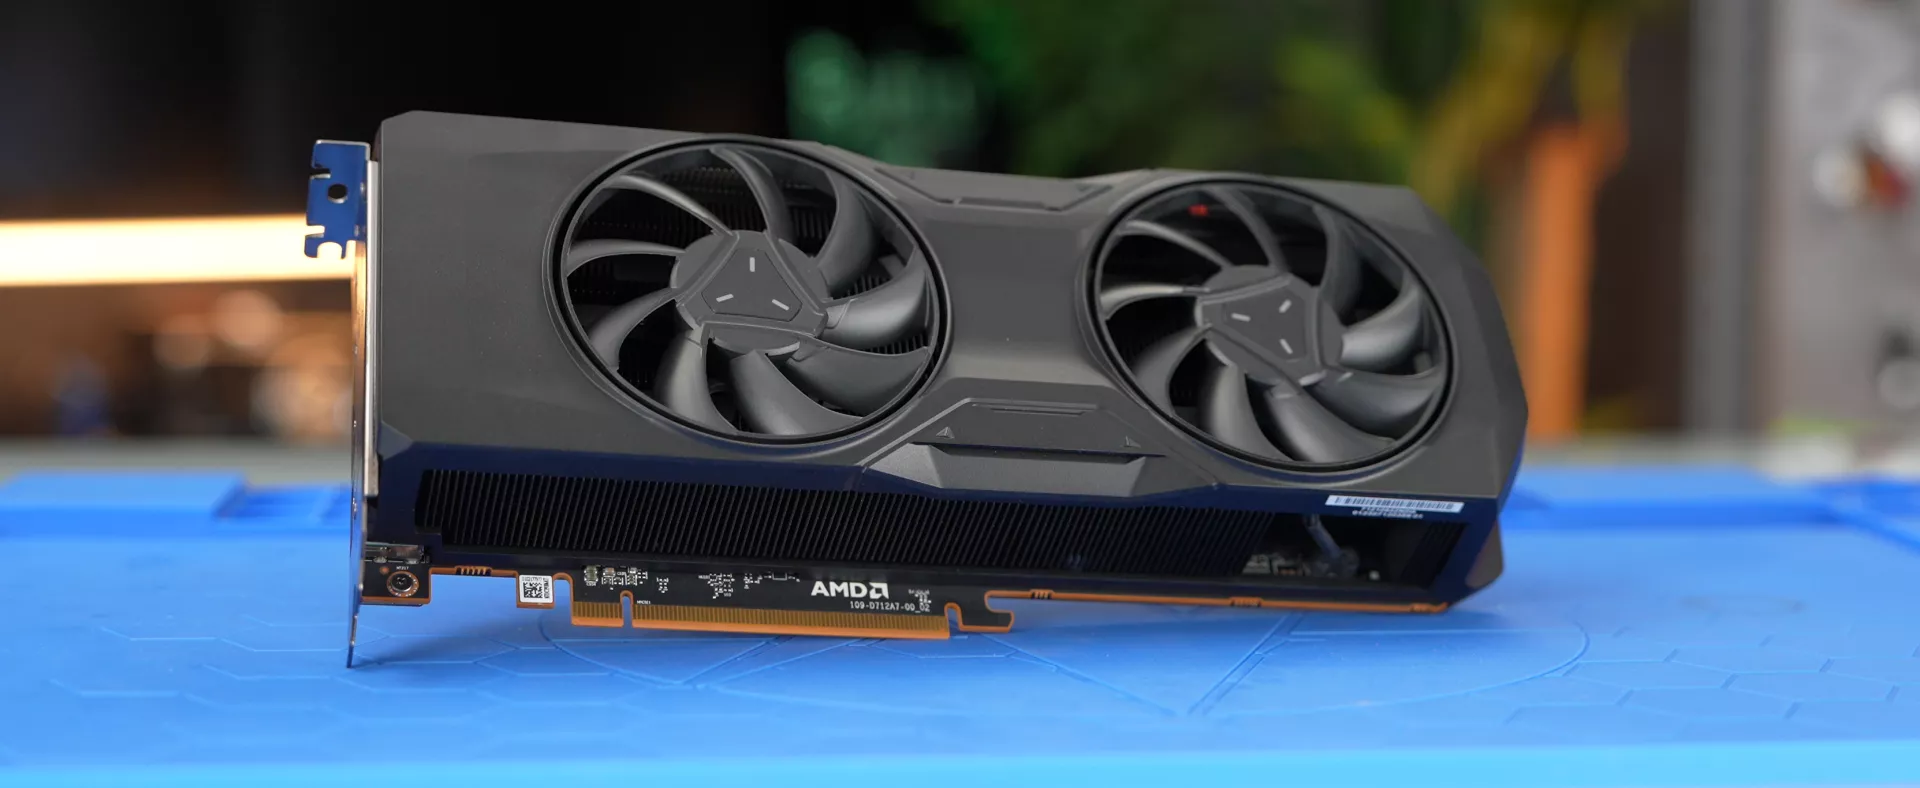
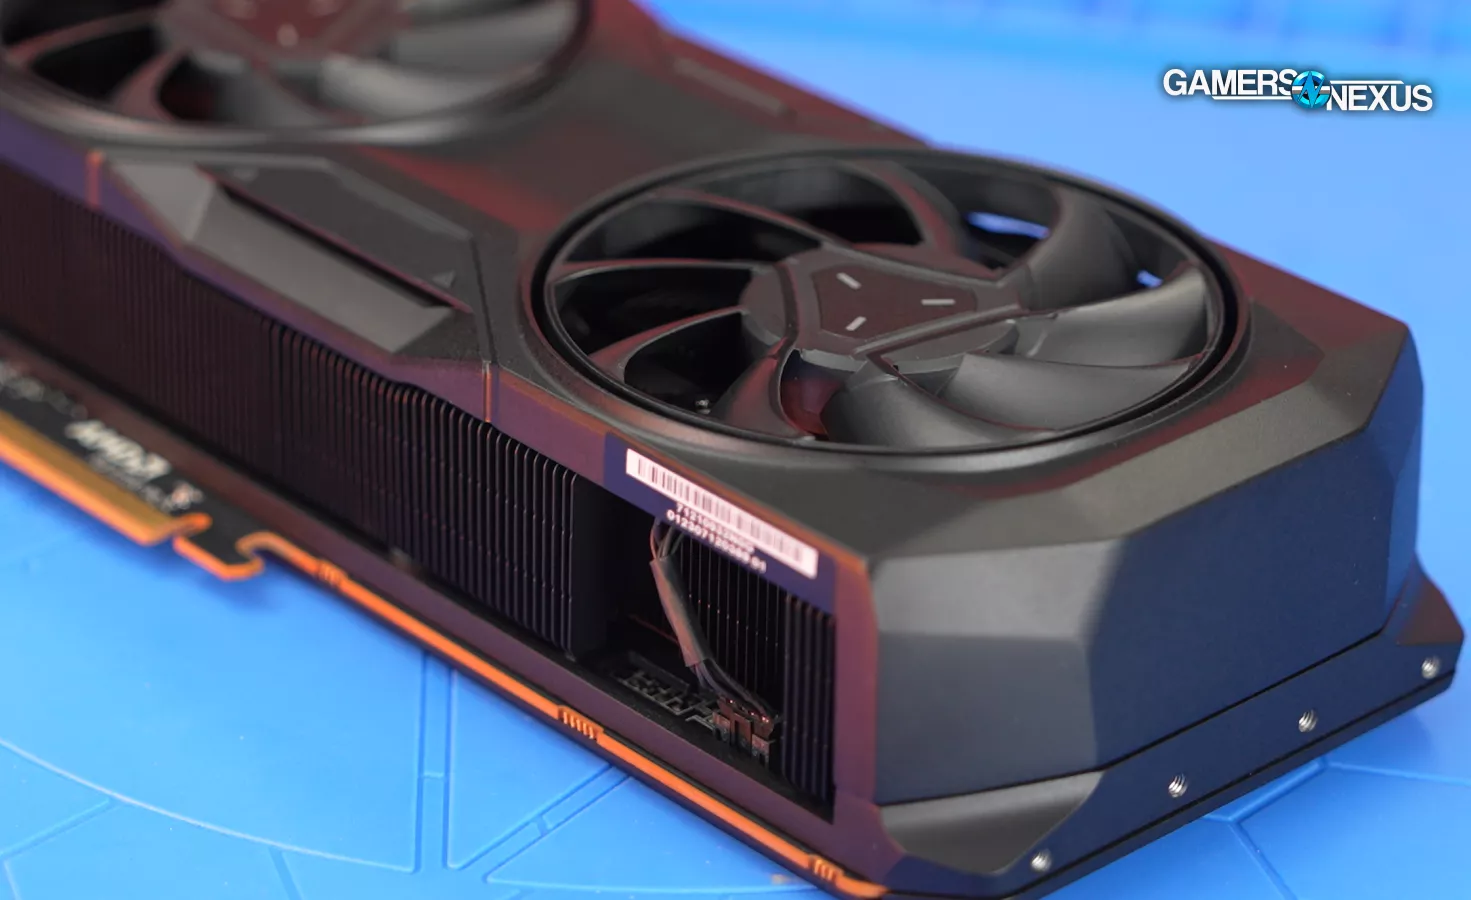
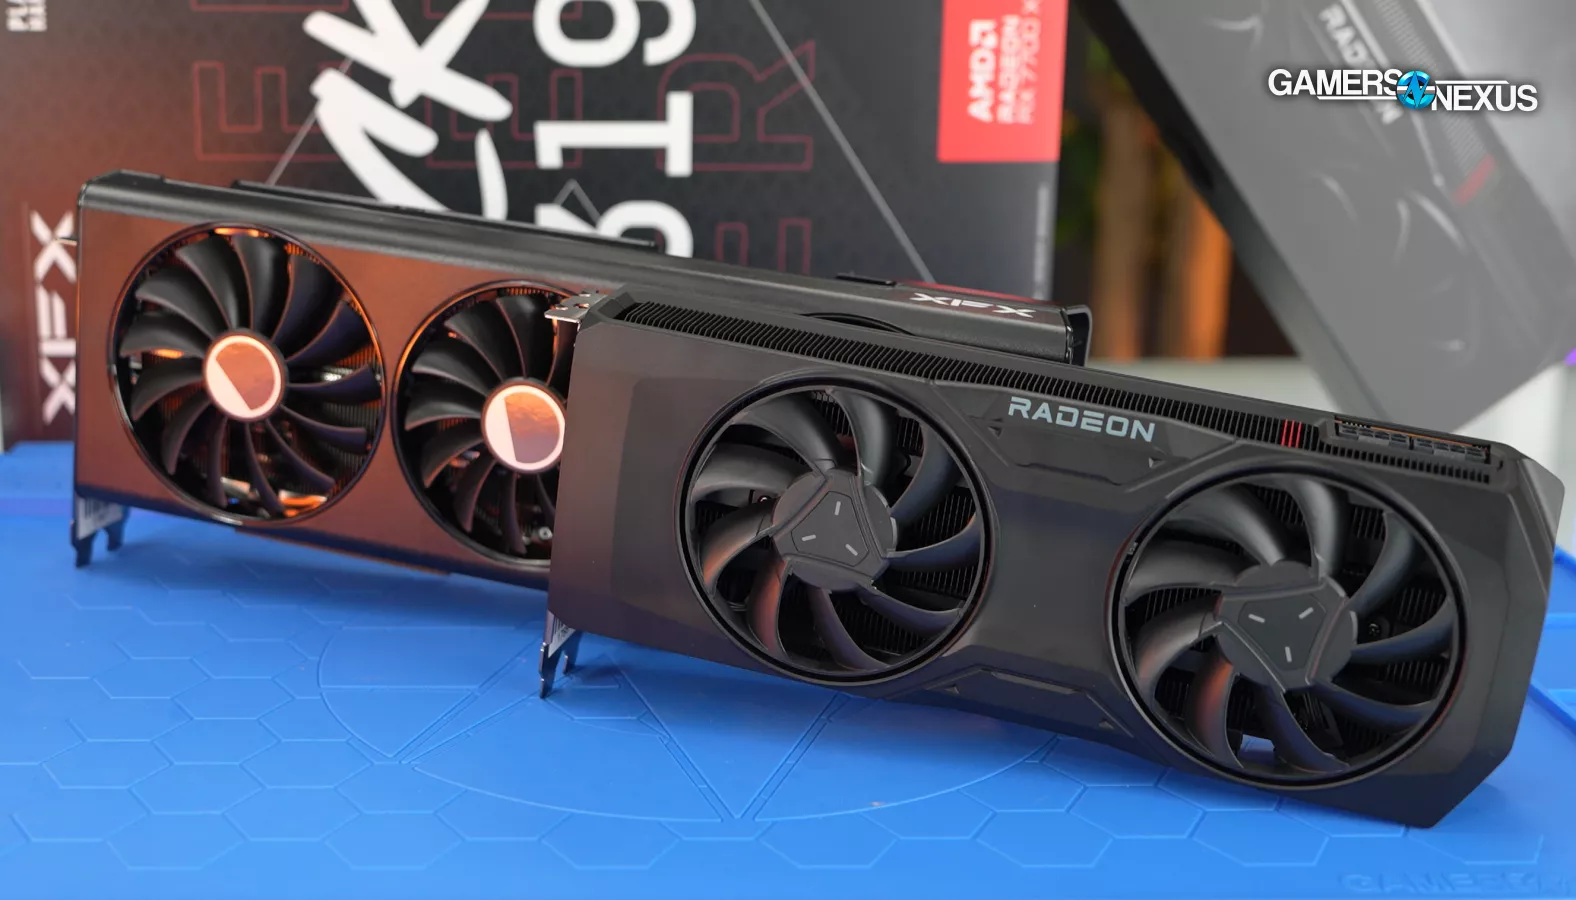
Today, we're reviewing the AMD RX 7800 XT. We also have a review coming up for the RX 7700 XT (update: it's live here), but this one is focused on the new 7800 XT, a $500 MSRP card from AMD.
For this benchmarking, a couple of things to consider:
- As with everything else this current generation, there are a lot of last-gen cards that are still relevant and available in many cases. So, we'll be looking at those a bit more closely than we might for just any other modern GPU launch, because there are a lot of options in the $400 to $500 range.
- The 7700 XT is priced at $450. There's only a $50 price gap between this 7800 XT and the 7700 XT, which makes that comparison particularly interesting. That's why we wanted a separate review to focus on it.
AMD believes that the RX 7800 XT is the true successor to the RX 6800, not the 6800 XT. So by name, marketing, and signaling to the customer, AMD suggests this is the successor; however, by spec and MSRP, the company hints that the original 6800 is the predecessor. We don't really care about any of that marketing; what we care about is how it performs versus the 6800 XT, because it's the same price today. On Newegg and Amazon, there are a few listings for around $500. That makes the 6800 XT a direct competitor to the 7800 XT. If you're considering second-hand cards, platforms like eBay offer many options from both the 30-series and the 6000 series.
Credits
Test Lead, Writing, Web Editing
Steve Burke
Testing, QC
Patrick Lathan
Jeremy Clayton
Mike Gaglione
Video Production
Vitalii Makhnovets
AMD RX 7800 XT GPU Specs
| RX 7800 XT | RX 6800 XT | RX 7700 XT | |
| Architecture | RDNA 3 | RDNA 2 | RDNA 3 |
| GPU Core | Navi 32 | Navi 21 | Navi 32 |
| Die Style | 1x GCD 4x MCD | Monolithic | 1x GCD 4x MCD |
| Process Node | 5nm/6nm | 7nm | 5nm/6nm |
| Core Configuration | |||
| Advertised "Game" Clock | 2124MHz | 2015MHz | 2171MHz |
| Advertised "Boost" Clock | 2430MHz | 2250MHz | 2544MHz |
| Compute Units (CUs) | 60 | 72 | 54 |
| Stream Processors (SPs) | 3840 | 4608 | 3456 |
| Ray Tracing Cores (RT Cores) | 60 | 72 | 54 |
| Texture Mapping Units (TMUs) | 240 | 288 | 216 |
| Render Output Units (ROPs) | 96 | 128 | 96 |
| L2 Cache | 4MB | 4MB | 2MB |
| L3 Cache | 64MB | 128MB | 48MB |
| Memory Configuration | |||
| Memory Capacity | 16GB | 16GB | 12GB |
| Memory Type | GDDR6 | GDDR6 | GDDR6 |
| Memory Bus Width | 256-bit | 256-bit | 192-bit |
| Memory Bandwidth | 624GB/s | 512GB/s | 432GB/s |
| Memory Speed | 19.5 Gbps | 16 Gbps | 18 Gbps |
| Power Configuration | |||
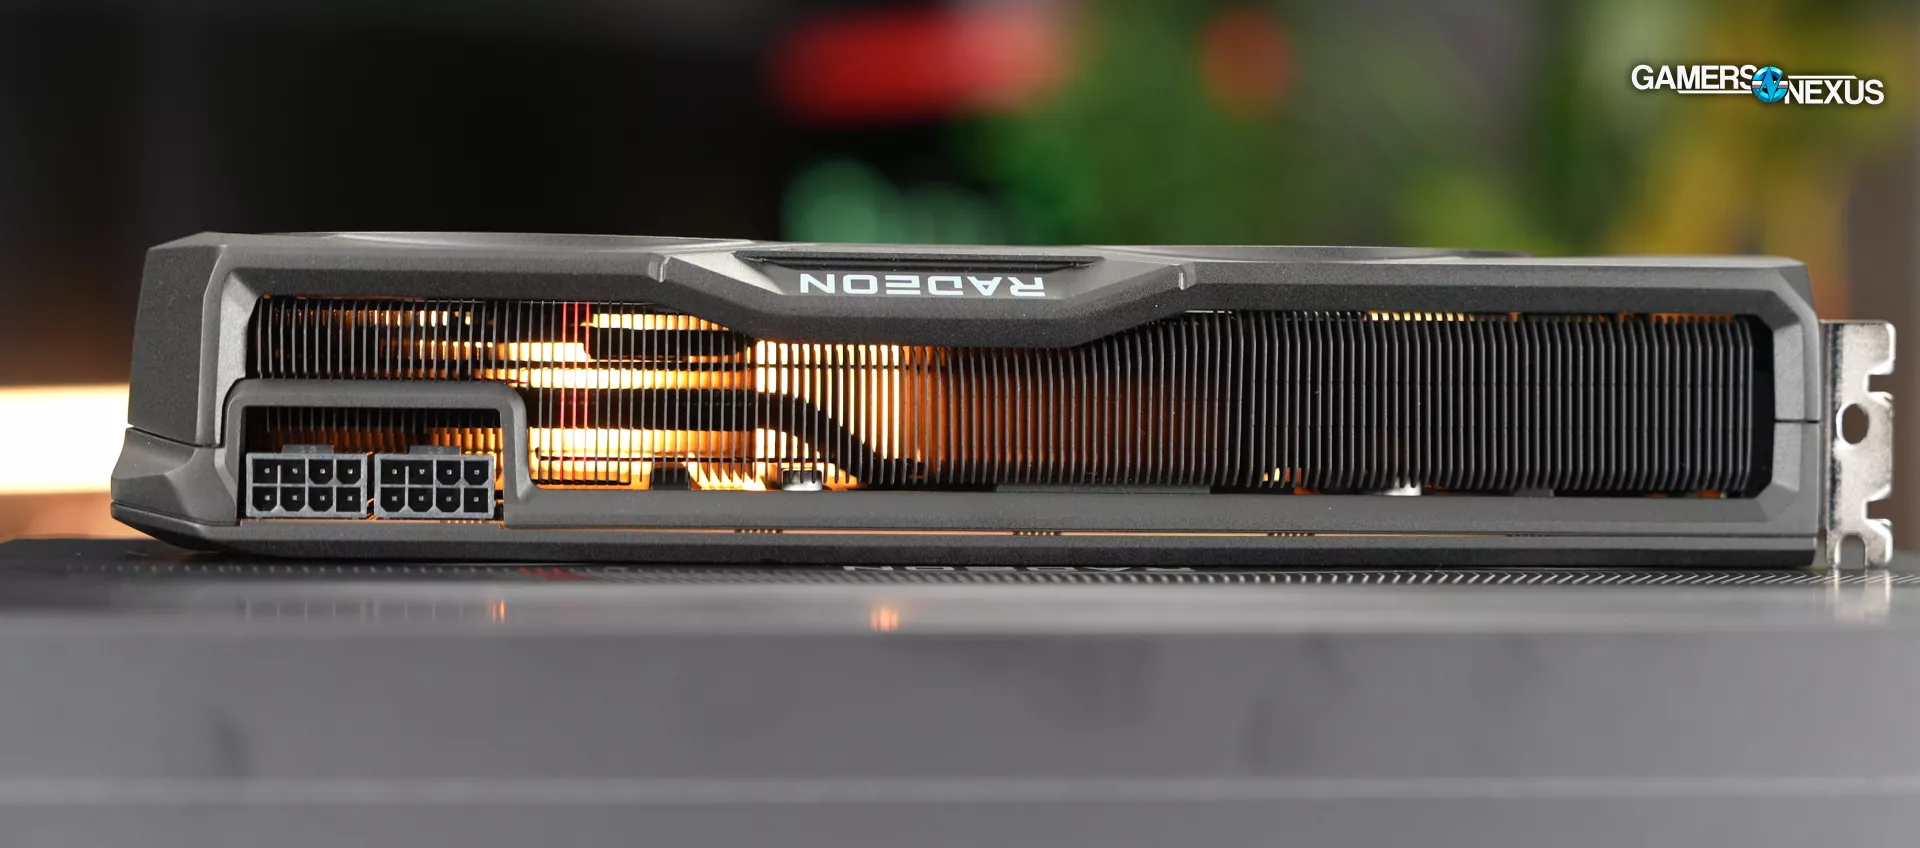
| Power Connectors | 2x 8-pin | 2x 8-pin | 2x 8-pin |
| TDP | 263W | 300W | 245W |
| Launch Information | |||
| Original MSRP | $500 | $650 | $450 |
| Launch Date | September 6, 2023 | November 18, 2020 | September 6, 2023 |
You can see above that the RX 6800 XT is, in many ways, the better card. Architecturally, the 7800 XT is superior -- but the 6800 XT will be able to make-up for the differences with brute force in many locations. The direct NVIDIA competition would primarily include the likes of the RTX 4060 Ti 8GB (the 16GB card is, and has been, a massive waste of money). The RTX 4070 would be the next price class up from NVIDIA.
AMD RX 7800 XT Alternatives
Here are some quick pricing numbers (all within +/- $20 based on a glance at Newegg and Amazon):
NVIDIA GPU Alternatives
- Nvidia's 4070 Ti is around $800
- The 4070 is around $600
- The 4060 TI is around $400
- The 4060 non-Ti is $300
AMD GPU Alternatives
- For AMD, the 7900 XT is about $800
- The 6950 XT is approximately $630
- The 6900 XT is around $600
- The 6800 XT is about $500
- The 6700 XT is about $330
These set up the key comparison points versus the 6800 XT. The main difference is the cut CU count from the 6800 XT: AMD's spec page lists it as 60 versus 72. This will play a role in situations where the architecture alone and frequency changes can't account for the 12CU difference. They're not directly comparable one-to-one, but there's an advantage to those CUs, especially for some of the 4K tests.
Benchmarks
That's enough setup. We have a lot of data to cover today, but we've compacted it more than usual. We'll start with Starfield.
For testing on the RX 7800 XT, our focus will be on rasterization, ray tracing, and some power consumption. We have not conducted our usual acoustic tests for this particular review as we made cuts to accommodate other content this week (namely, the Starfield benchmarks, plus work on Baldur's Gate 3).
GPU Test Bench
| Part | Component | Provided By |
| CPU | Intel Core i7-12700KF Overclocked (4.9GHz P-Cores, 3.9GHz E-Cores) | Bought by GN |
| Motherboard | MSI Z690 Unify | MSI |
| RAM | DDR5-6000 G.Skill Trident Z (manually tightened timings) | G.Skill |
| Cooler | Arctic Liquid Freezer II 360 @ 100% Fan Speed | Bought by GN |
| PSU | EVGA 1600W T2 Supernova Corsair AX1600i | EVGA Corsair |
| OS | Windows 11 | Bought by GN |
Rasterization
Our first set of benchmarks will look entirely at rasterization performance. Our ray tracing tests will follow toward the end. As an important note, be advised that any games which overlap in these two categories -- such as Shadow of the Tomb Raider -- are incomparable between the two charts. That means a 4K/High Tomb Raider result when rasterized cannot be compared to a ray traced result (unless your goal is to compare only the effect of the settings change).
Our rasterization testing does not use any upscaling technology. All testing is done native. Some ray tracing testing uses upscaling technologies, but those are noted explicitly when used.
Starfield RX 7800 XT GPU Benchmarks
Starfield - 4K/High
We’ll start with Starfield, seeing as that’s what we’ve spent the last week testing.
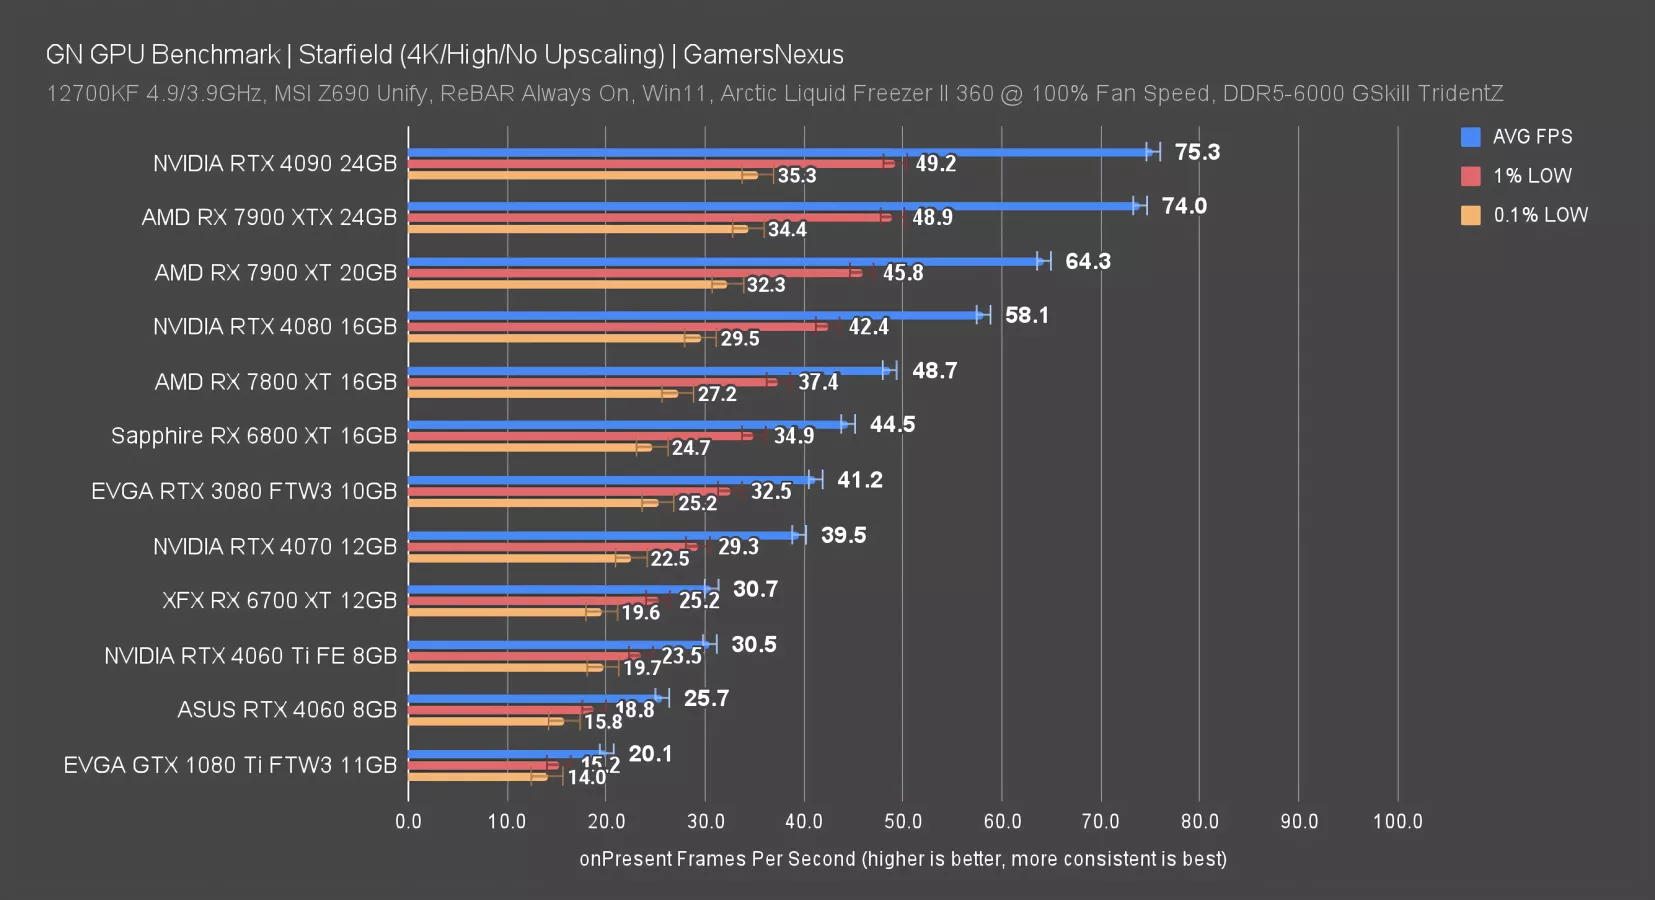
At 4K/High, the RX 7800 XT ran at 48.7FPS AVG, with lows at 37 and 27. Those are paced similarly to what we saw elsewhere -- this game is kind of a mess for performance, but it’s at least consistently a mess. That’s all that matters for benchmarking.
For current generation flanks, the RTX 4060 Ti 8GB, about $100 cheaper, ran at 30.5FPS AVG. That allows the 7800 XT a lead of 60% -- a massive increase -- at a cost increase of about 25% MSRP-to-MSRP. The RTX 4070 is priced around $100 higher and lands at 39.5FPS AVG, giving the 7800 XT a lead of 23% while being more expensive than it. In at least Starfield, AMD is currently in a strong lead. We’ll revisit this as things patch and change to see if that remains, but for now at least, they’re in a better starting point than NVIDIA.
As for more expensive options, in this particular title and with this game version, only the other AMD cards would be worth considering. The 7900 XT improves by 32% at 64FPS AVG while costing around $790-$820 today.
Finally, as compared to the RX 6800 XT - which is a similar price - the 7800 XT holds a lead of about 10%.
The game may be messy for performance, but AMD’s relative positioning is currently extremely competitive for the 7800 XT in this title.
Starfield - 1440p/High
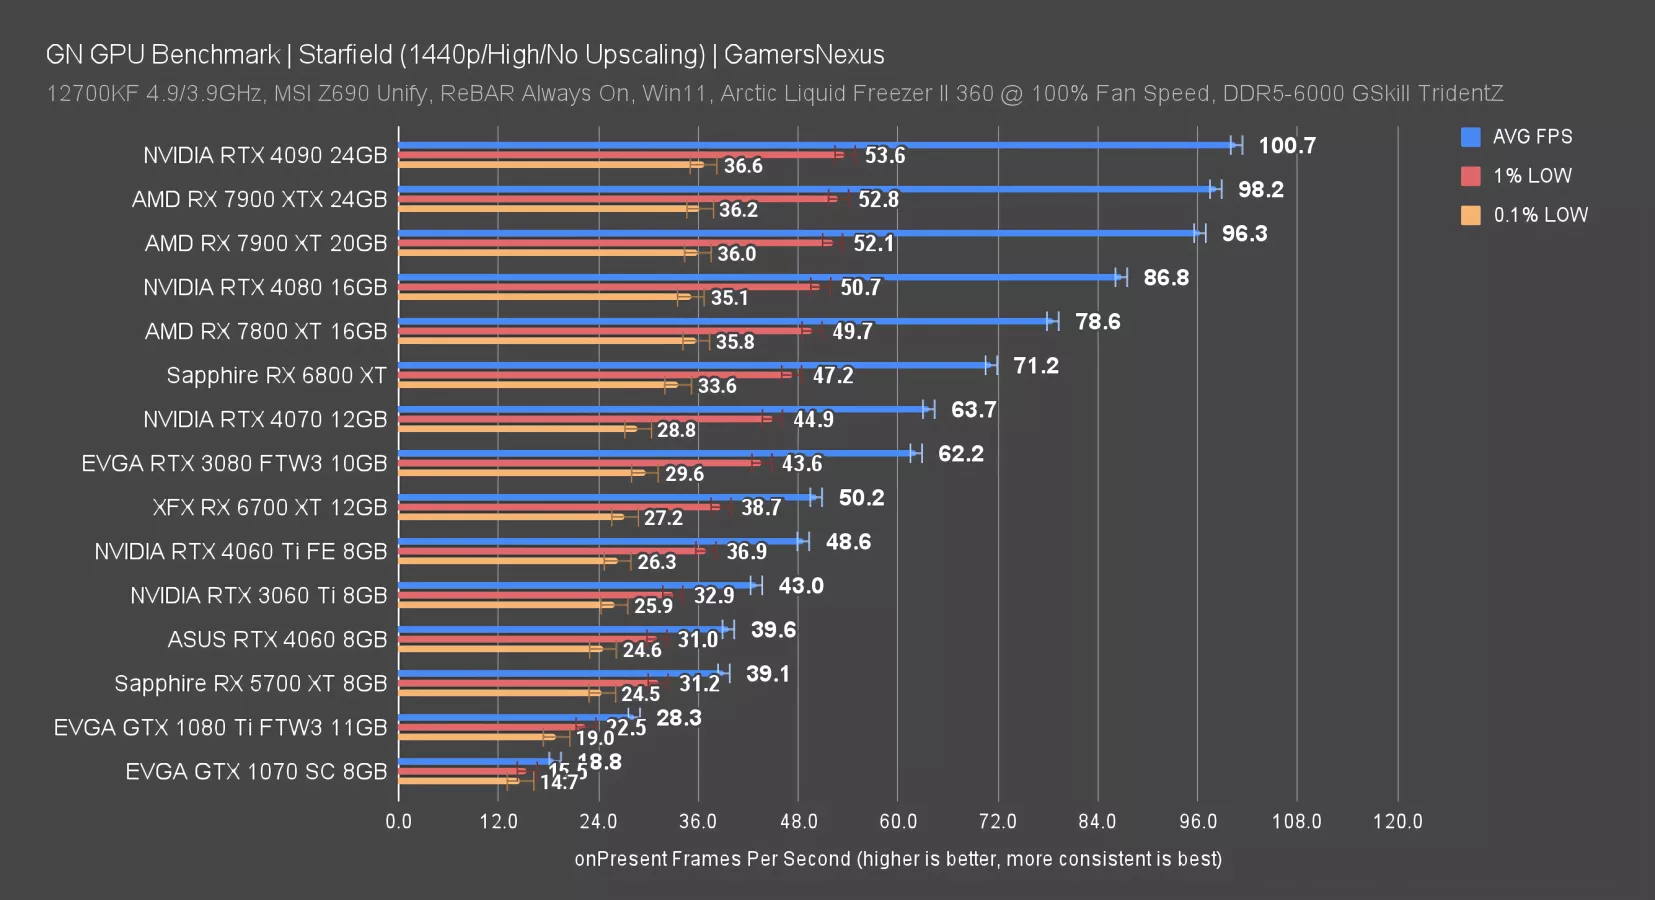
At 1440p/High, the RX 7800 XT ran at 79FPS AVG, with lows at 50 and 36. That has it ahead of the 6800 XT by 10% -- so that much remains the same. The 7900 XT leads the 7800 XT by 22.5% in this test, down from 32% previously. That’s because the 7900 XT is starting to hit a CPU bottleneck, so there’d be more room to scale if not for that limiter.
Compared to NVIDIA price competitors, the 7800 XT leads the 4070 by 23% and the 4060 Ti by 62%. Scaling is similar to the 4K/High testing. AMD is incredibly strong with its 7800 XT as compared to the 4070 and 4060 Ti in this particular game. We have one more resolution before we see how it does in other games.
Starfield - 1080p/High
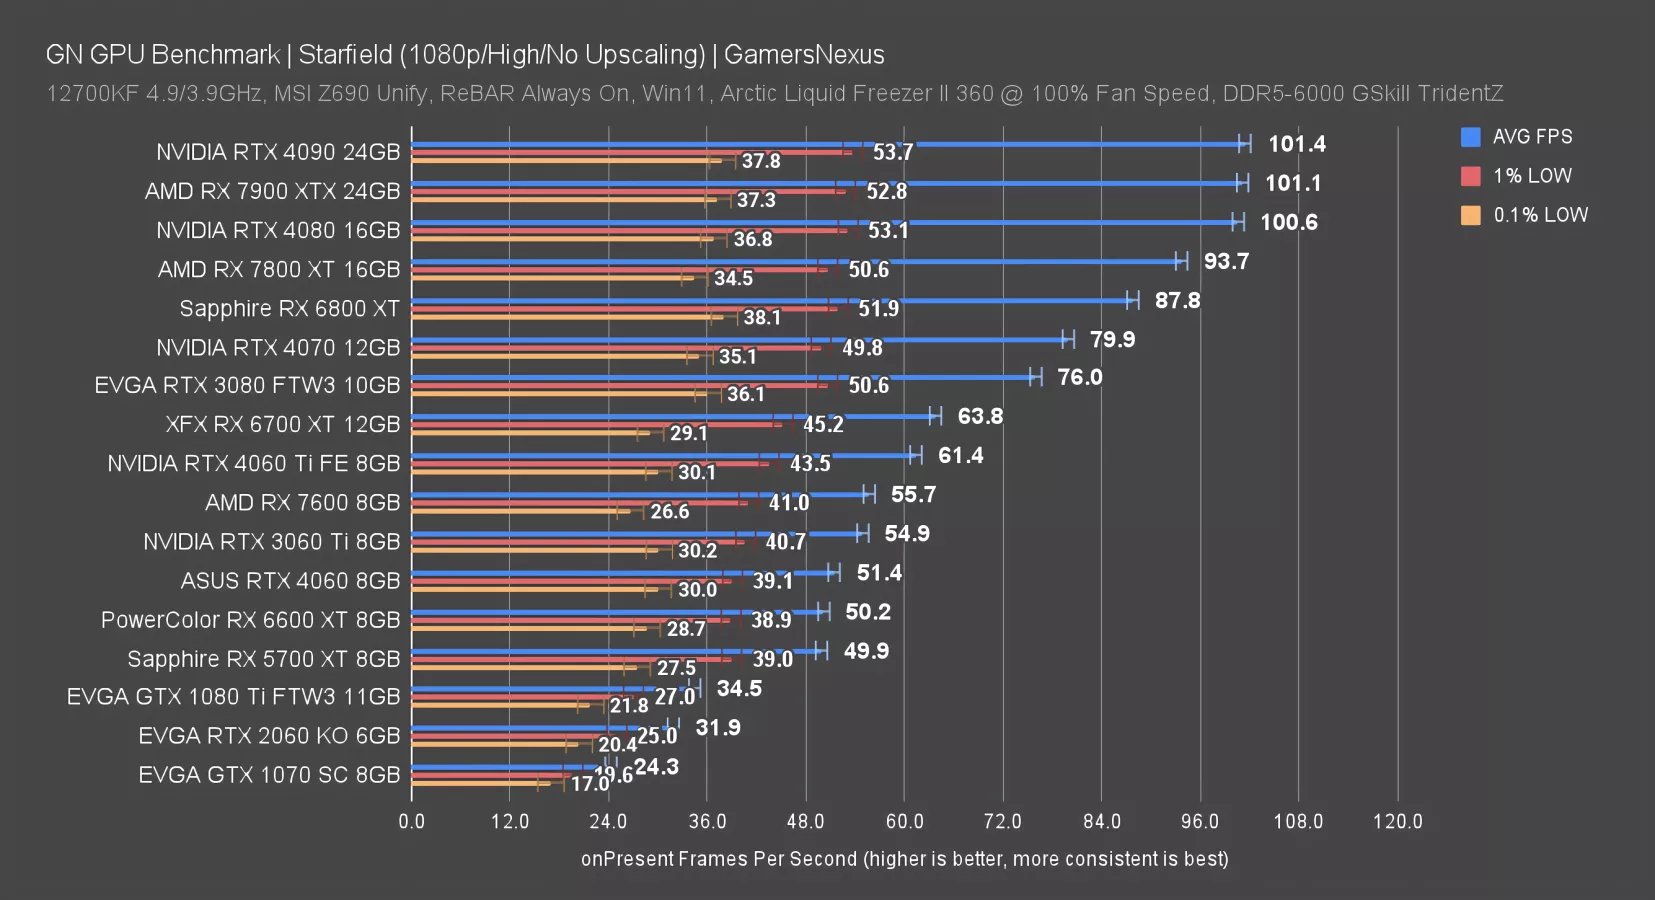
At 1080p, the 7800 XT was nearing our CPU bind. The 7900 XT isn’t present because it’s irrelevant -- it’s also CPU-bound. So are the 4090 and 7900 XTX. There’s no room to scale here. Let’s move to the next one.
Dying Light 2 GPU Benchmarks
Dying Light 2 - 4K
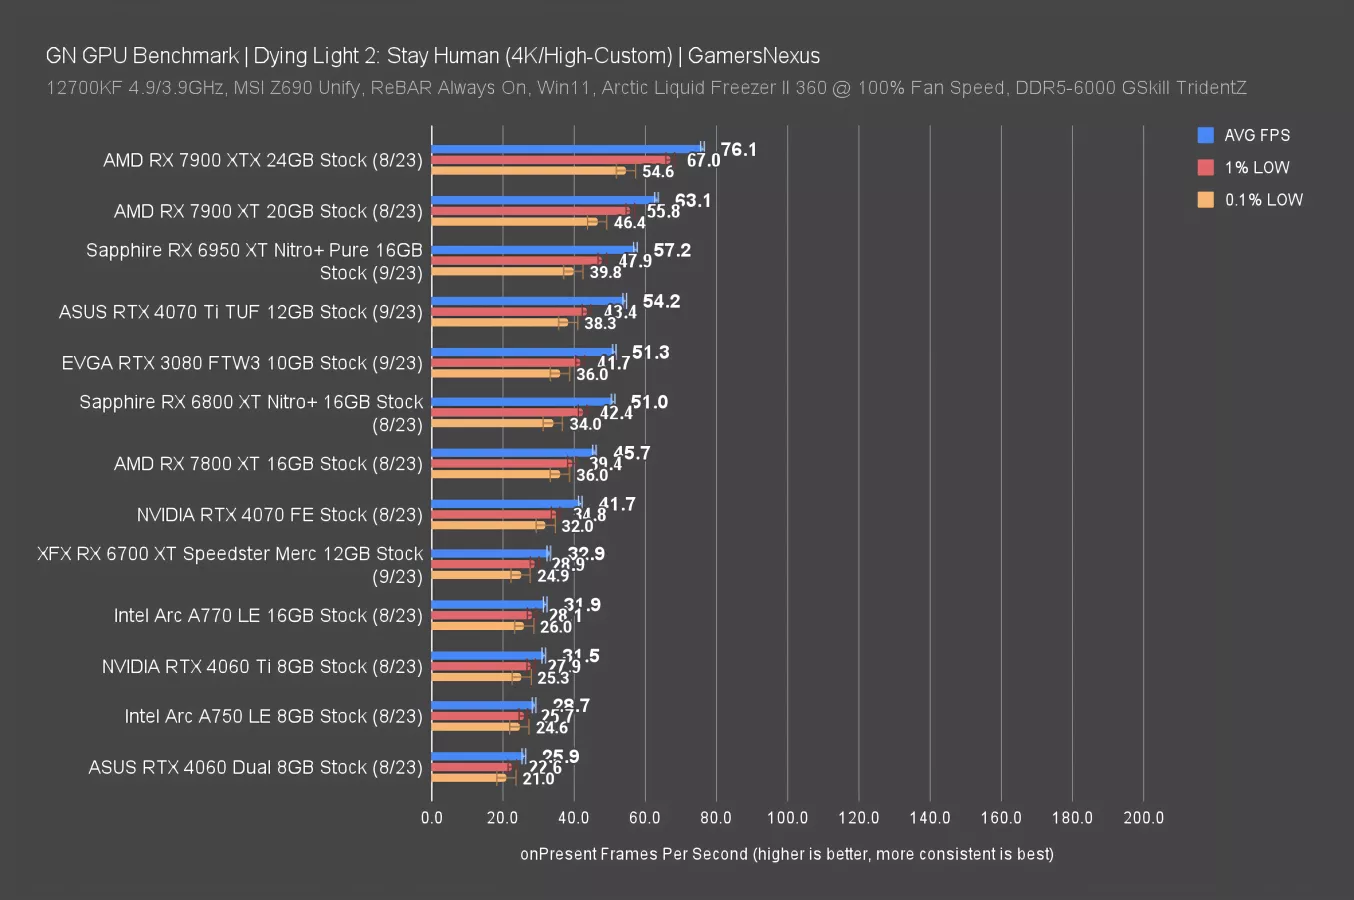
Dying Light 2 is new to our benchmark suite. Starting at 4K and with a custom/high configuration, the 7800 XT ran at 45.7 FPS AVG with lows well-timed. That has the 7800 XT as about 9.6% higher framerate than the 4070, about 39% higher than the 6700 XT, and similarly ahead of the 4060 Ti. The 6800 XT ended up ahead of the 7800 XT, embarrassingly for AMD, with a 12% lead. That’s more than just a partner model difference. It looks like AMD’s choices on the CU count may have impacted it here.
As for the 4070 Ti, that leads by 19%.
Dying Light 2 - 1440p
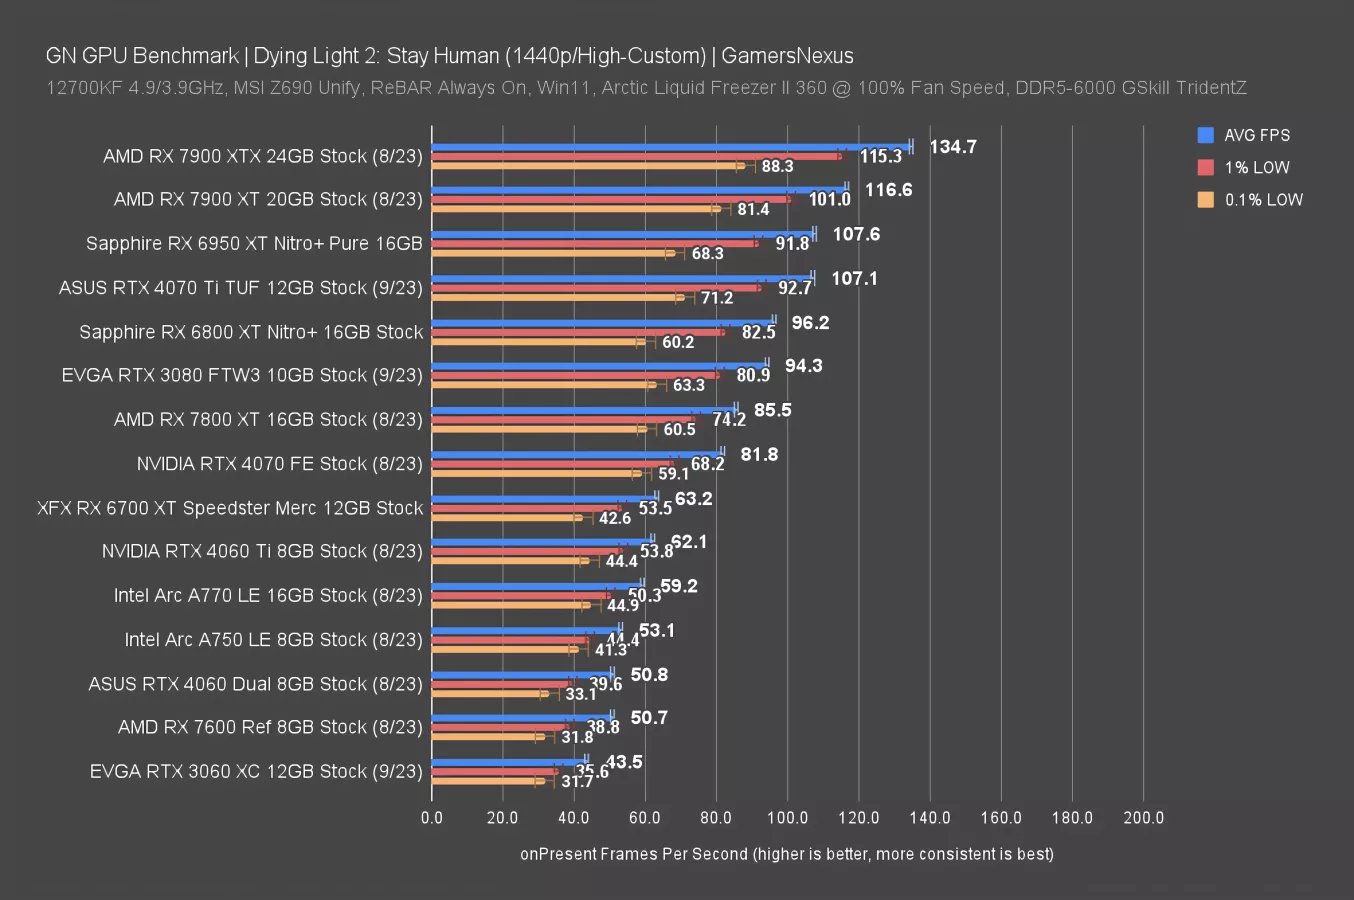
Now for 1440p. Here, the 7800 XT ran at 85.5 FPS AVG, with frametimes again overall consistent and well-paced. The 3080 leads, followed by the 6800 XT, which itself holds a lead over the 7800 XT of 13%. These companies really all woke up and chose embarrassment with their naming scheme. It’s amazing how much less embarrassing the generational losses -- both for NVIDIA and AMD -- would be if they’d just stop trying to trick people into thinking the cards are worth more just by a name.
Dying Light 2 - 1080p
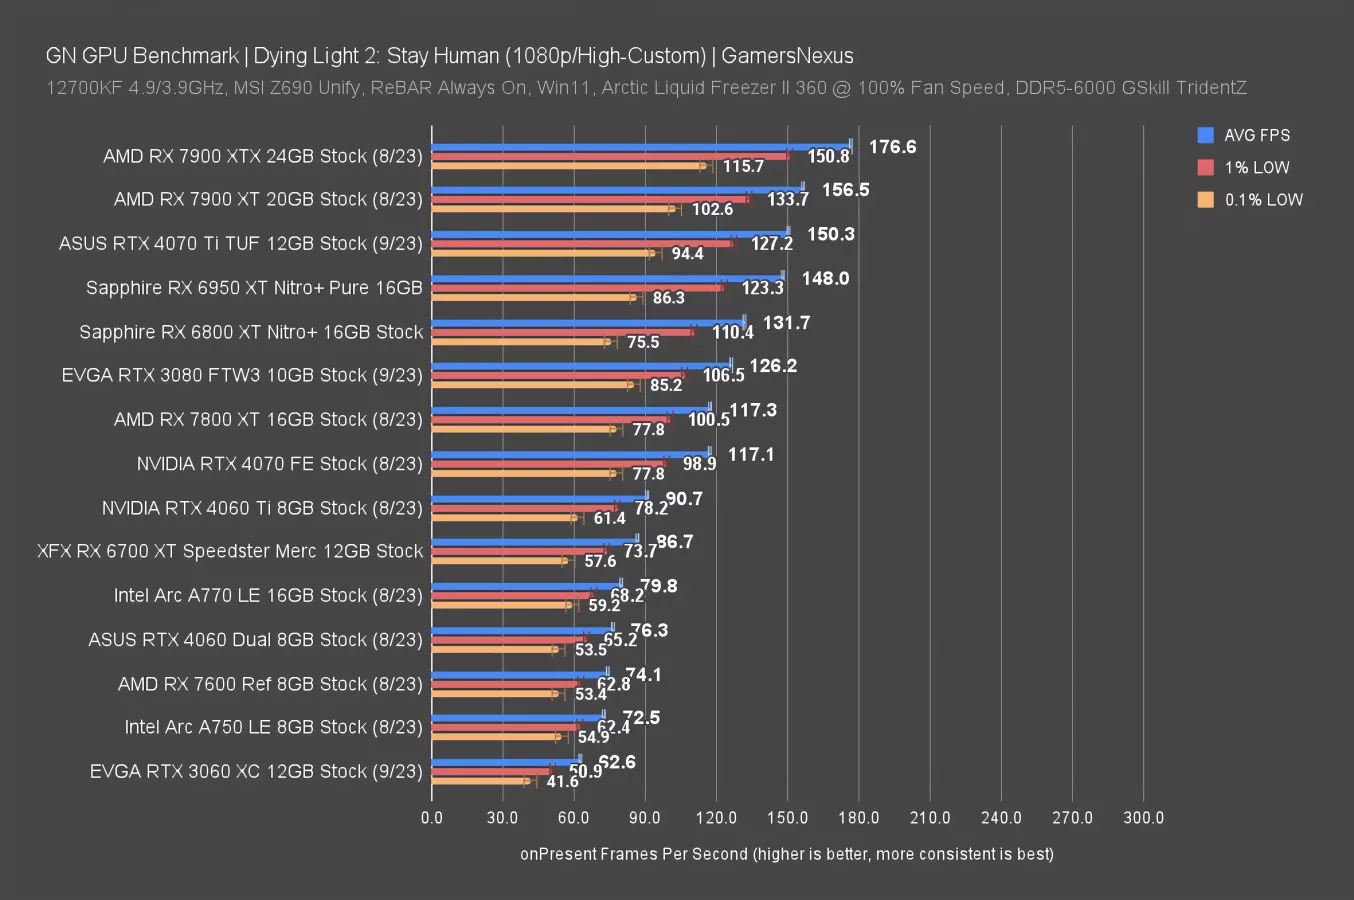
At 1080p, the RX 7800 XT’s 117FPS AVG still afforded the 6800 XT a 12% lead. It’s also about tied with the RTX 4070, including the lows. Compared to the 4060 Ti, the lead is about 30% here. AMD’s biggest competition right now appears to be itself. From the company’s perspective, that’s probably not bad.
Resident Evil 4 Benchmarks
Resident Evil 4 - 4K
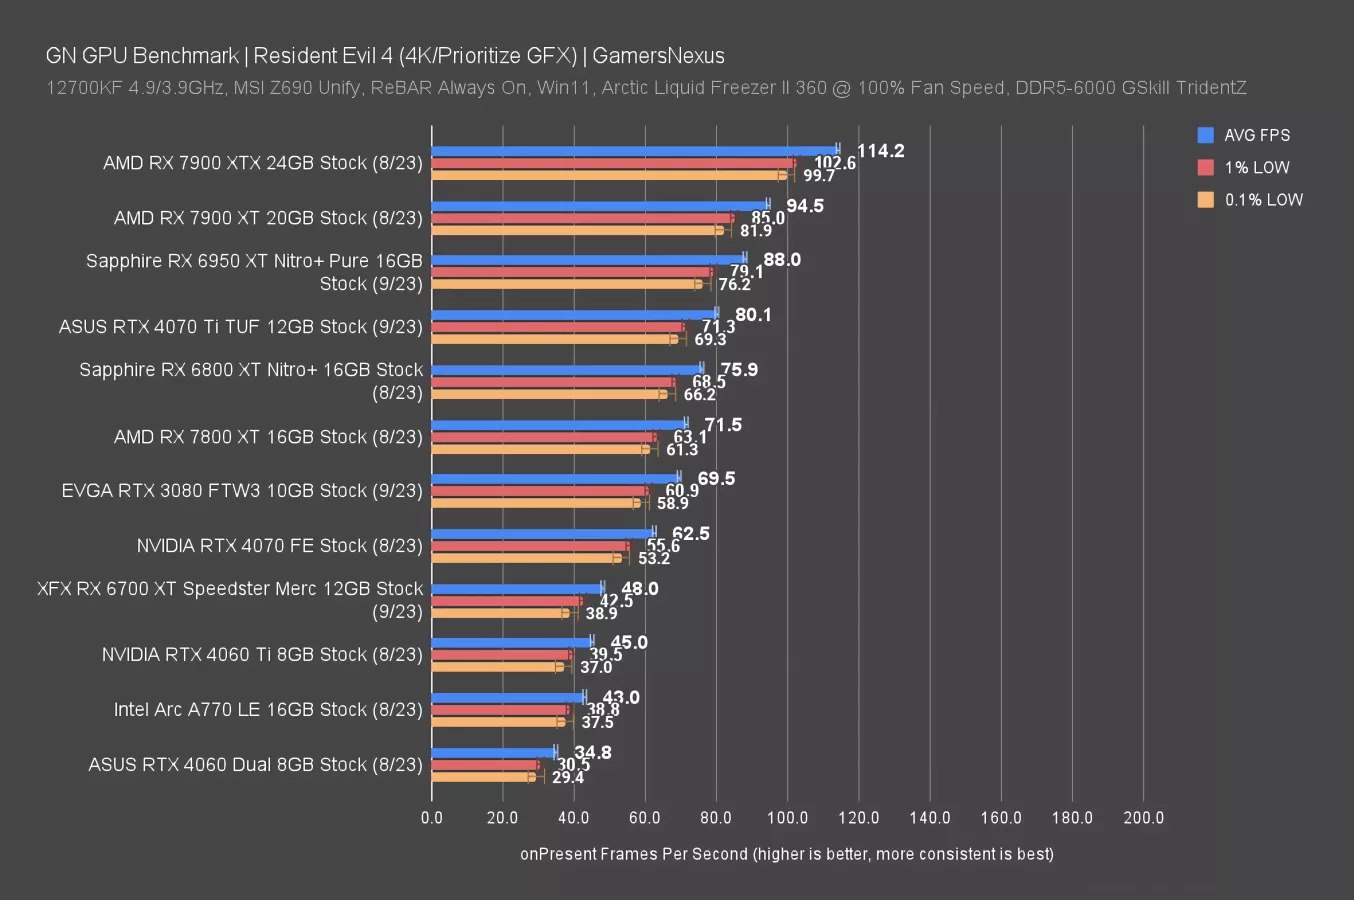
Resident Evil 4 is up now, another new game in our test suite for this overhaul. At 4K, the 7800 XT ran at 72FPS AVG, with frametimes again consistent. This game appears to pace frames well on most of these cards. The RX 6800 XT leads the 7800 XT, this time by 6.2%. The 7800 XT ends up ahead of the 4070 and roughly tied with the 3080 this time.
Resident Evil 4 - 1440p
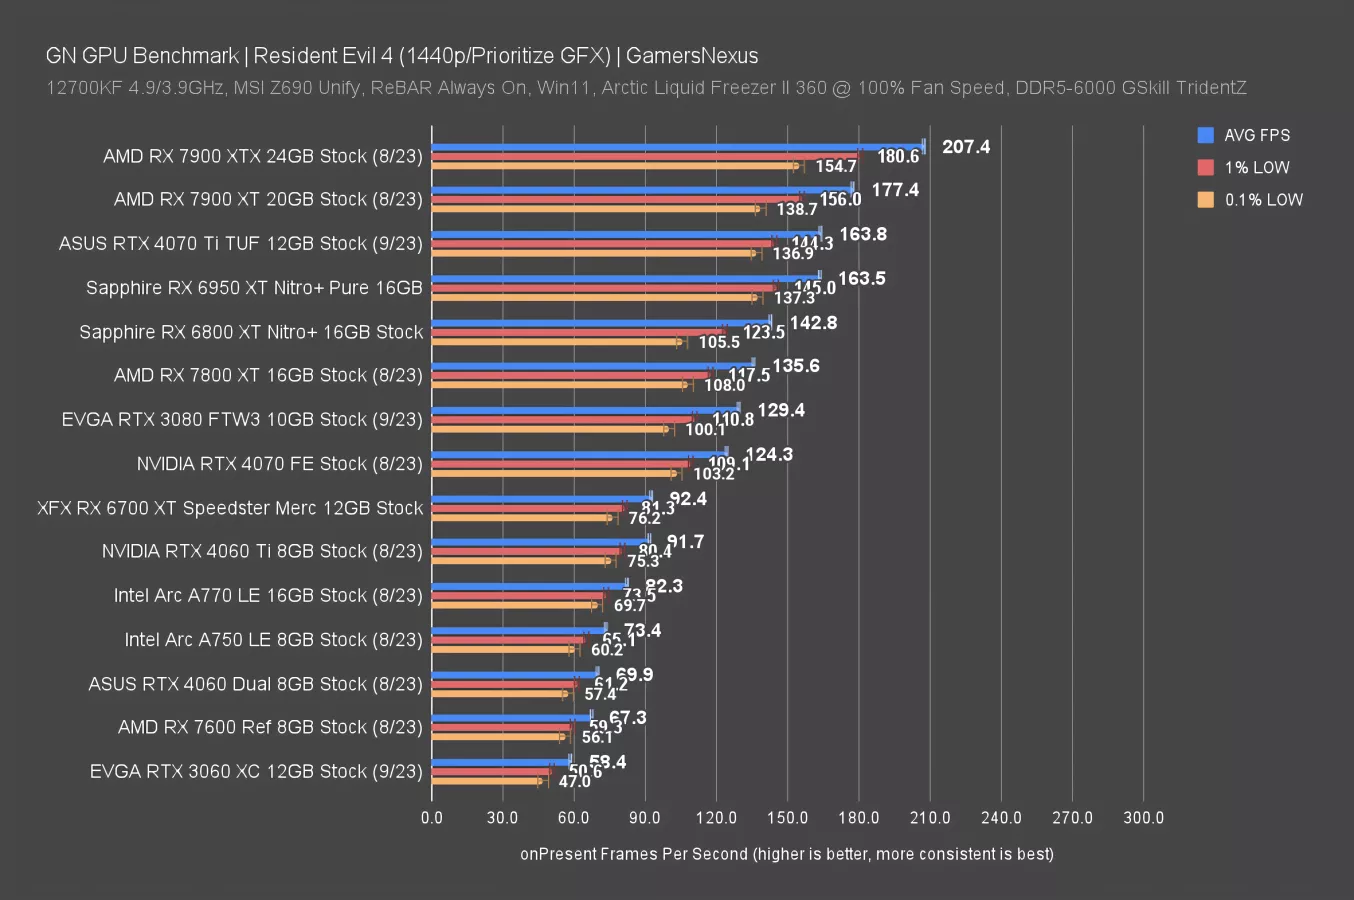
At 1440p, the 7800 XT’s 136FPS AVG has it again just below the 6800 XT, ahead of the 4070 by 9%, and ahead of the 6700 XT by 47%.
Total War: Warhammer 3 Benchmarks
Total Warhammer 3 - 4K
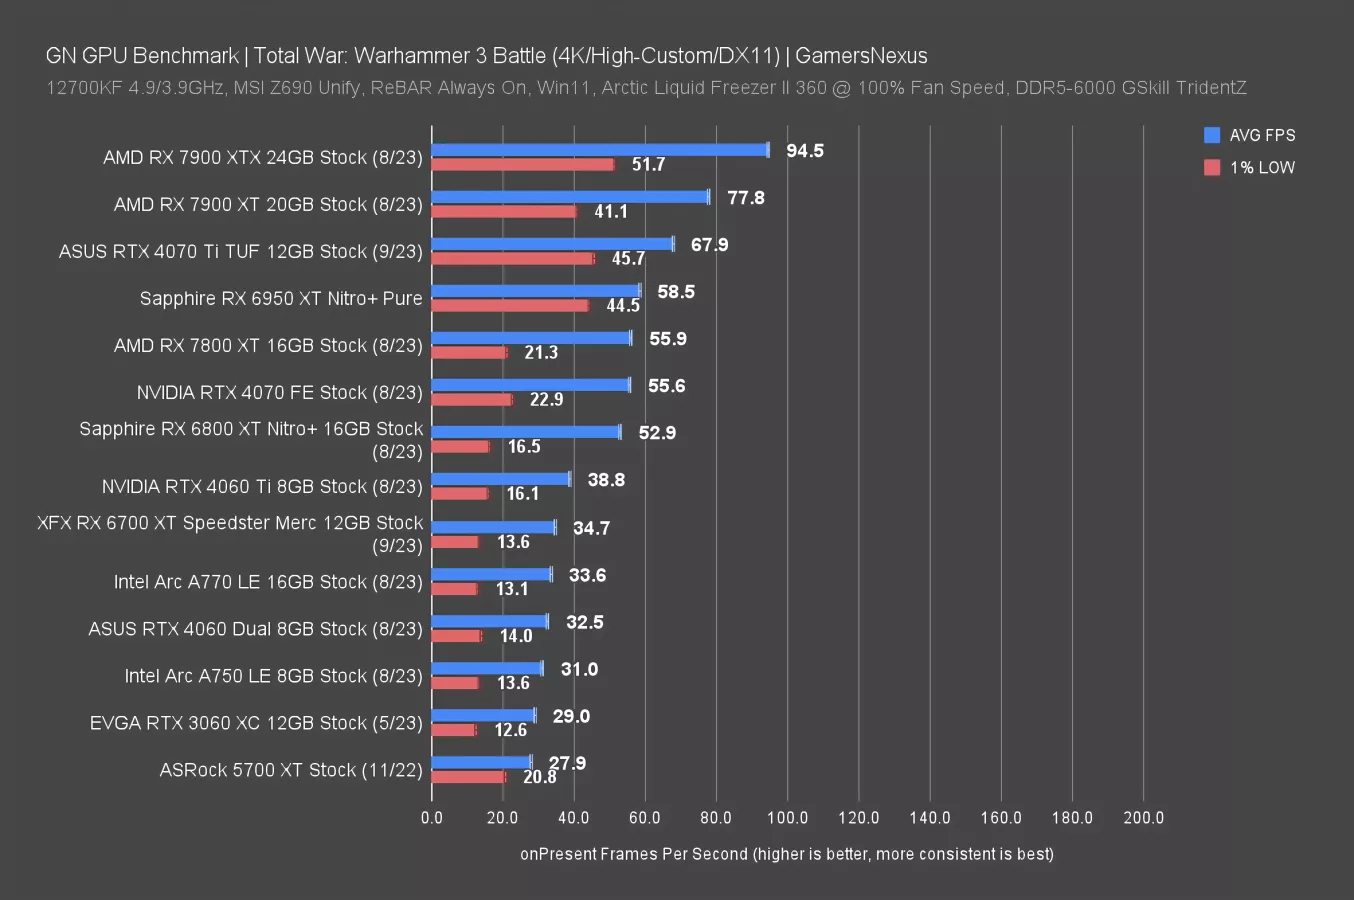
Total Warhammer is up now. At 4K, the 7800 XT sits at 56FPS AVG with relatively low 1% lows compared to the GPUs ahead of it. The 7900 XT leads by 39% at 78FPS AVG, with the 7900 XTX about 70% ahead. As for other GPUs, the lead over the RTX 4060 Ti is 44%, establishing a strong position against NVIDIA’s recent launch. The 4070 is tied with the 7800 XT in all metrics for this one, with the 6800 XT a bit behind.
Total Warhammer 3 - 1440p
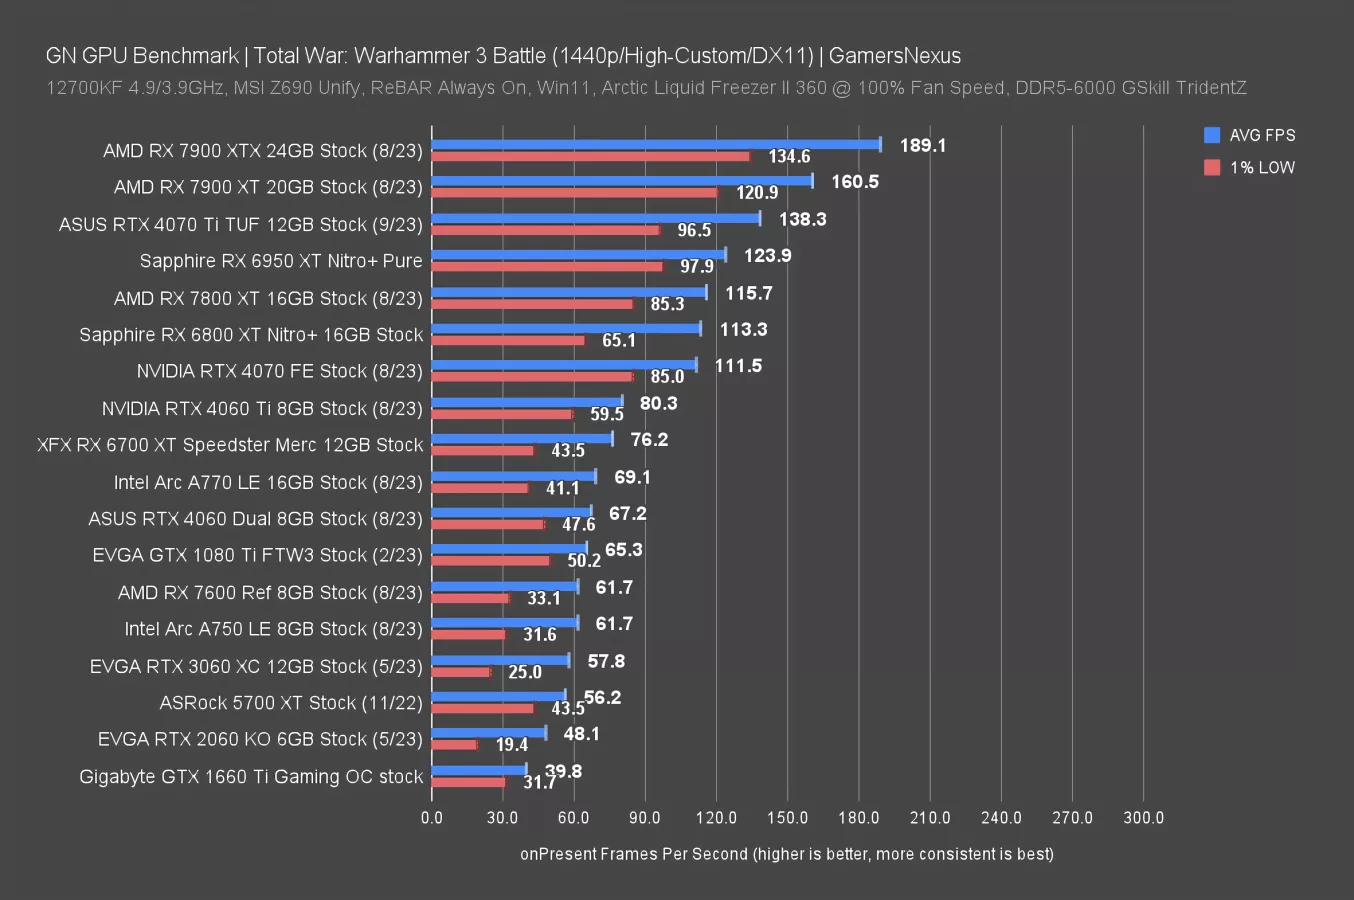
But 4K is demanding for the 7800 XT. Moving to 1440p, the 7800 XT’s 116FPS AVG has it about 4% ahead of the RTX 4070 in AVG FPS. The RTX 4060 Ti is far behind, allowing a 44% lead to the 7800 XT. As for the 6950 XT, that one establishes itself as a strong alternative if you can grab one of the last remaining cheaper models, with a lead of 7% over the 7800 XT. The 7900 XT jumps 39% ahead with its 161FPS AVG.
Compared to the flanking RTX 4070 Ti, the 7800 XT gives up a 20% lead to NVIDIA’s much more expensive $800 alternative.
Users of an RTX 2060, RTX 3060, or RX 5700 XT might find value in an upgrade here.
Total Warhammer 3 - 1080p
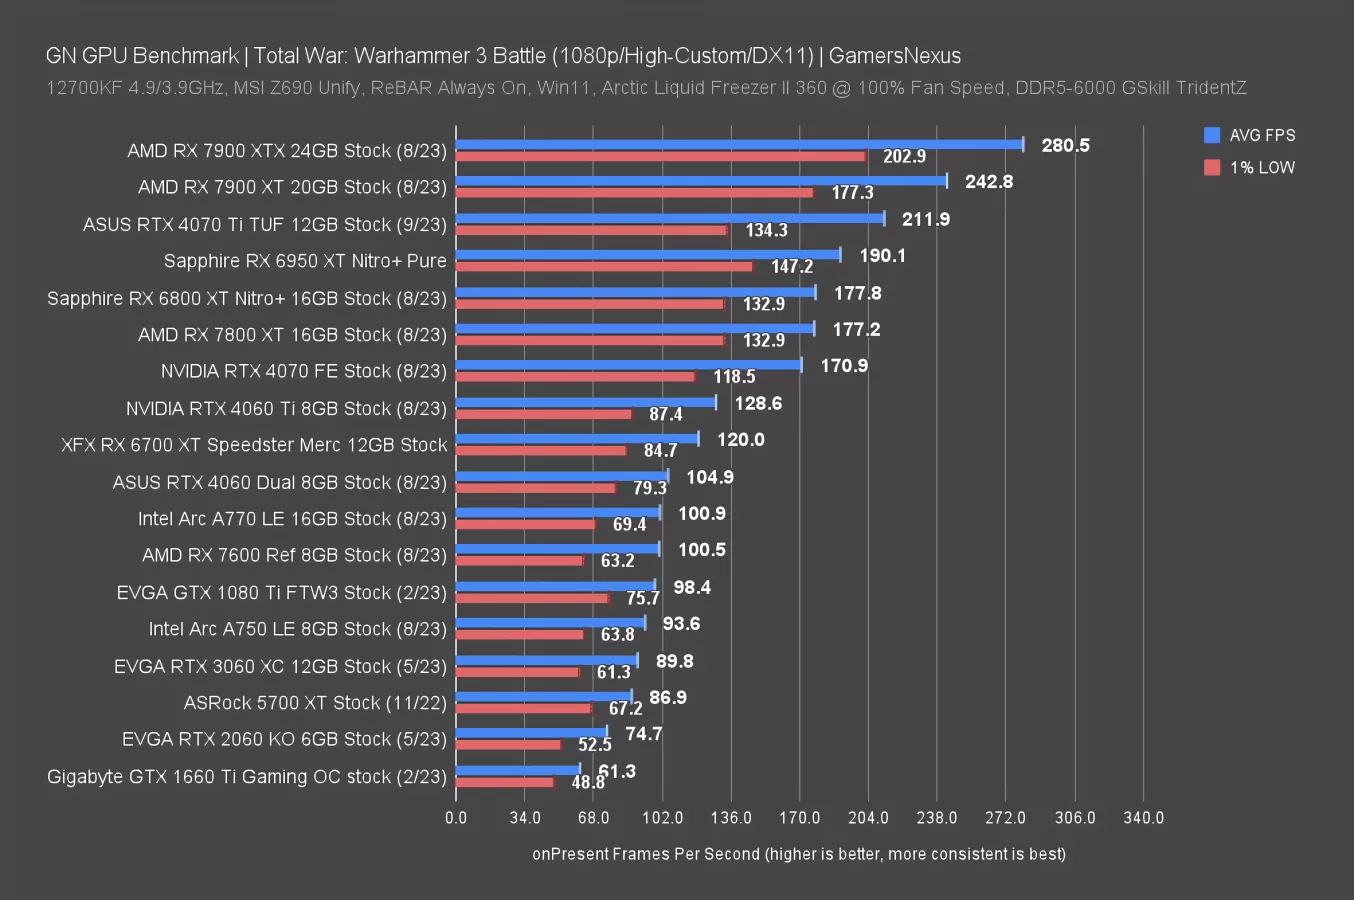
At 1080p, the 7800 XT still has plenty of CPU scaling headroom to take advantage of. The 7900 XT has a 37% lead over the 7800 XT, with the RTX 4070 about tied -- within 4% -- of the new AMD GPU. The 4060 Ti remains somewhat distant and will be a better comparison to the 7700 XT in our next video.
Last generation’s 6800 XT managed nearly identical performance to the 7800 XT, with the 6950 XT pushing a little further ahead. If you’re wondering what an extra $300 gets you from the NVIDIA side, the 4070 Ti would again yield about a 20% uplift. Not great value comparatively.
Shadow of the Tomb Raider Benchmarks
Tomb Raider - 4K
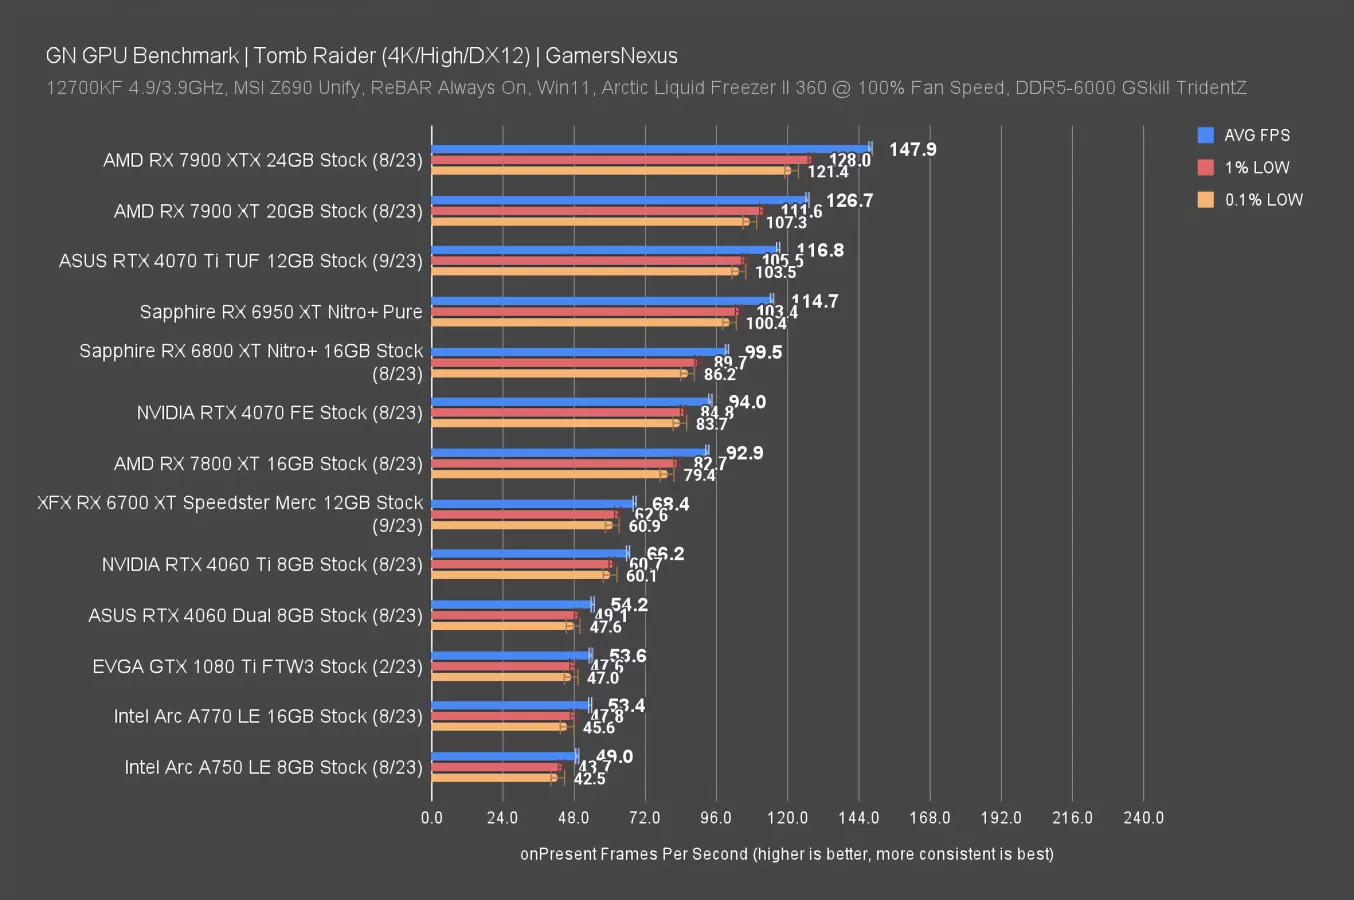
In Tomb Raider at 4K, the RX 7800 XT held a 93FPS AVG with frametimes highly consistent and well-paced at 83 and 79. That has it behind the RTX 4070 on a technicality, but in reality, they’re effectively tied. The 6800 XT also leads by a few percentage points, with the 6950 XT a more notable 23% ahead. The 4070 Ti holds a similar lead. Compared to cheaper options, the 6700 XT manages 74% of the performance of the 7800 XT, with the 4060 Ti around the same positioning. Moving to a 4070 Ti or 7900 XT would gain you between 26% and 36% more performance.
We’re going to start going through these charts a lot faster now to just rip through some numbers.
Tomb Raider - 1440p
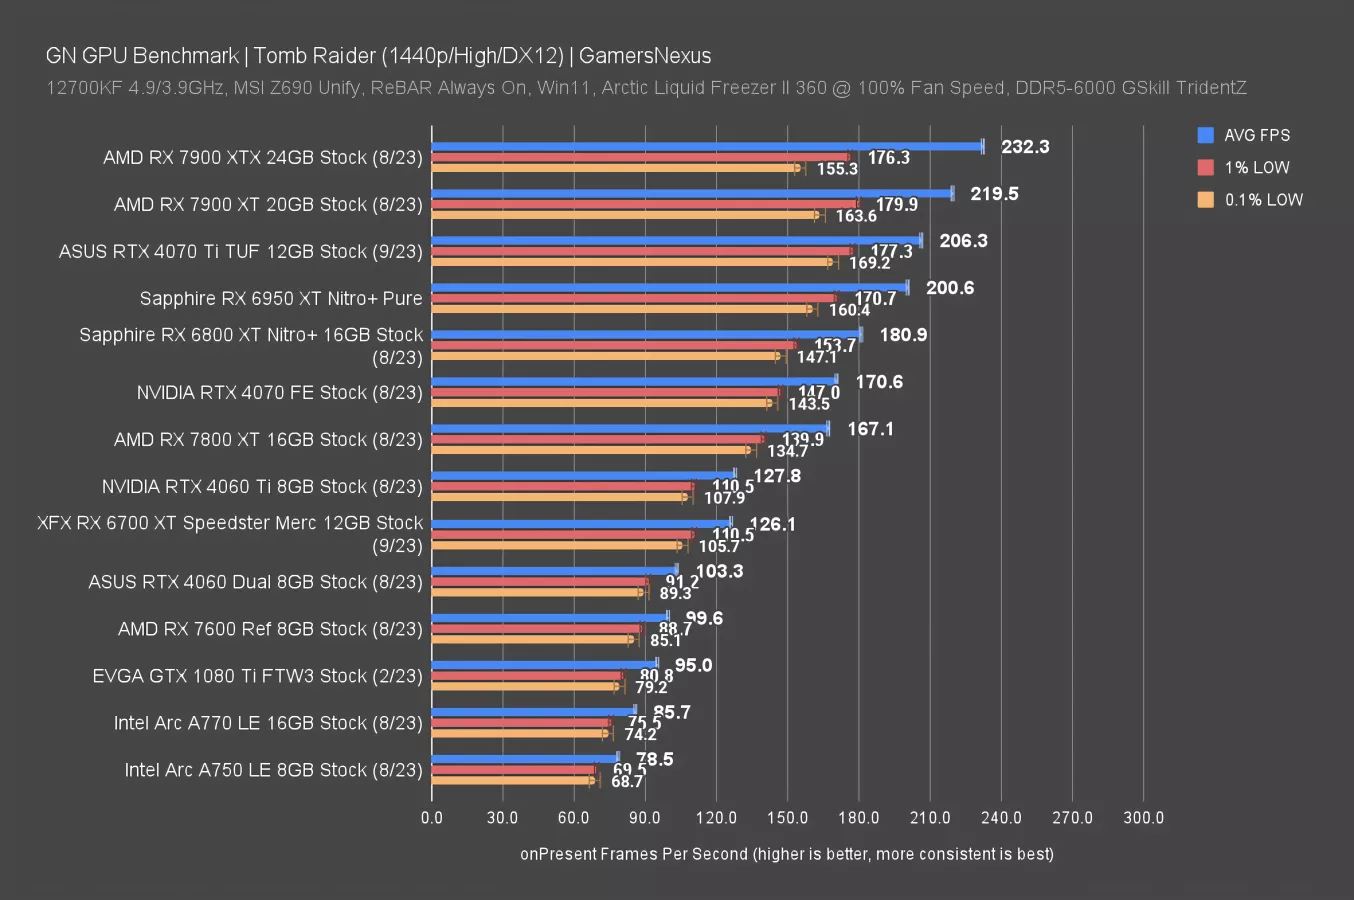
At 1440p, the 7800 XT moves to 167FPS AVG with frametimes again consistently timed. The 4070 has a technical lead of 2% here, with the 4070 Ti more noteworthy at 23% (again). While we’re up here, the 7900 XT keeps a 31% advantage over the new card.
Cheaper options, like the 6700 XT or 4060 Ti, are outpaced by the 7800 XT by about 32%.
Tomb Raider - 1080p
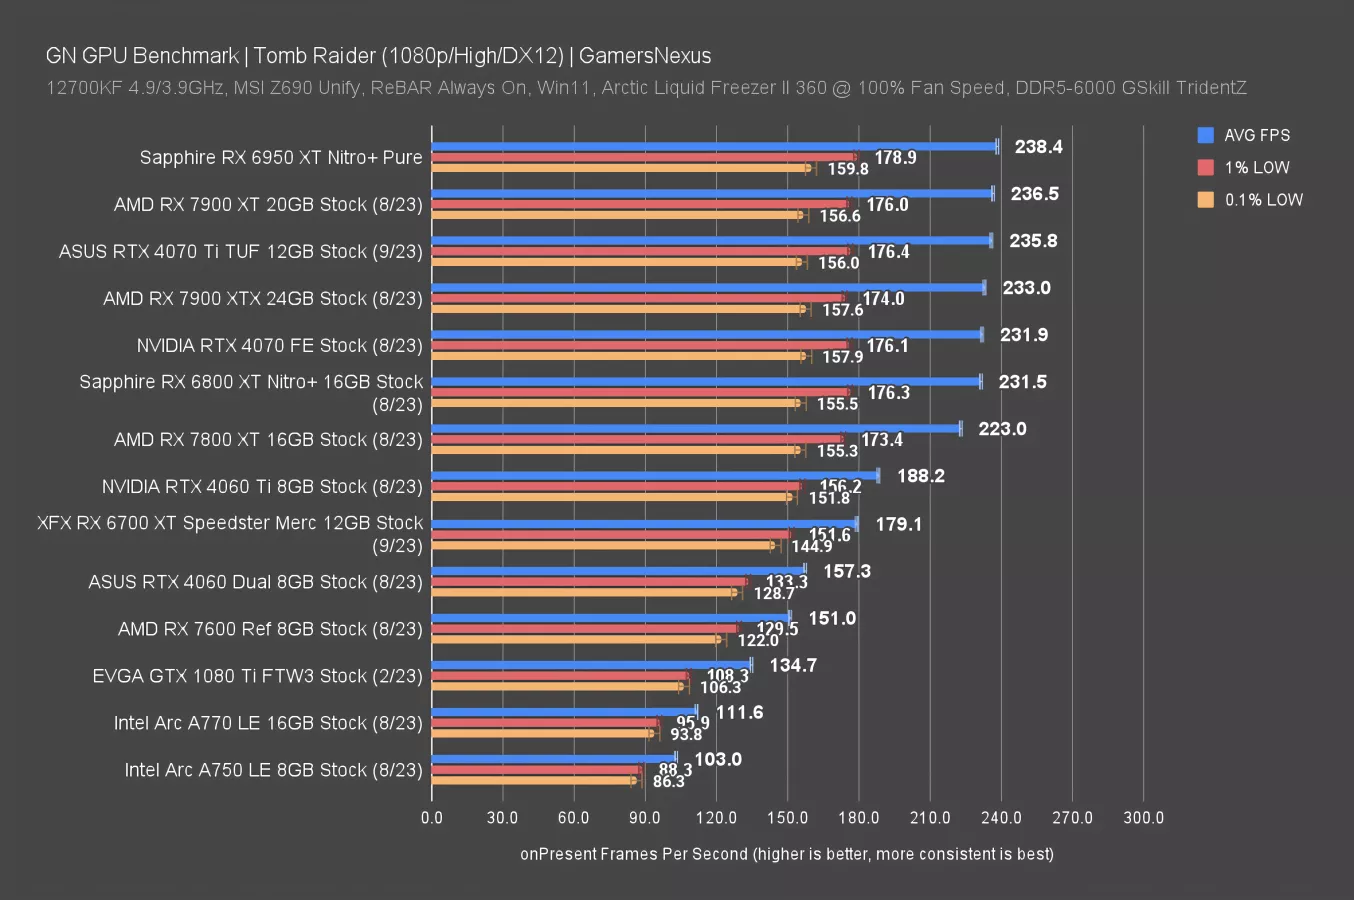
Finally for this one, 1080p has the 7800 XT at 223FPS AVG, pushing the card close to the 7900 XT due to external bottlenecks -- the CPU is limiting the scaling room here, so everything north of 230FPS is bound. You can ignore all of those results. They’re not scaling properly. The growth over the 6700 XT was 25% here.
Horizon Zero Dawn Benchmarks
Horizon Zero Dawn - 4K
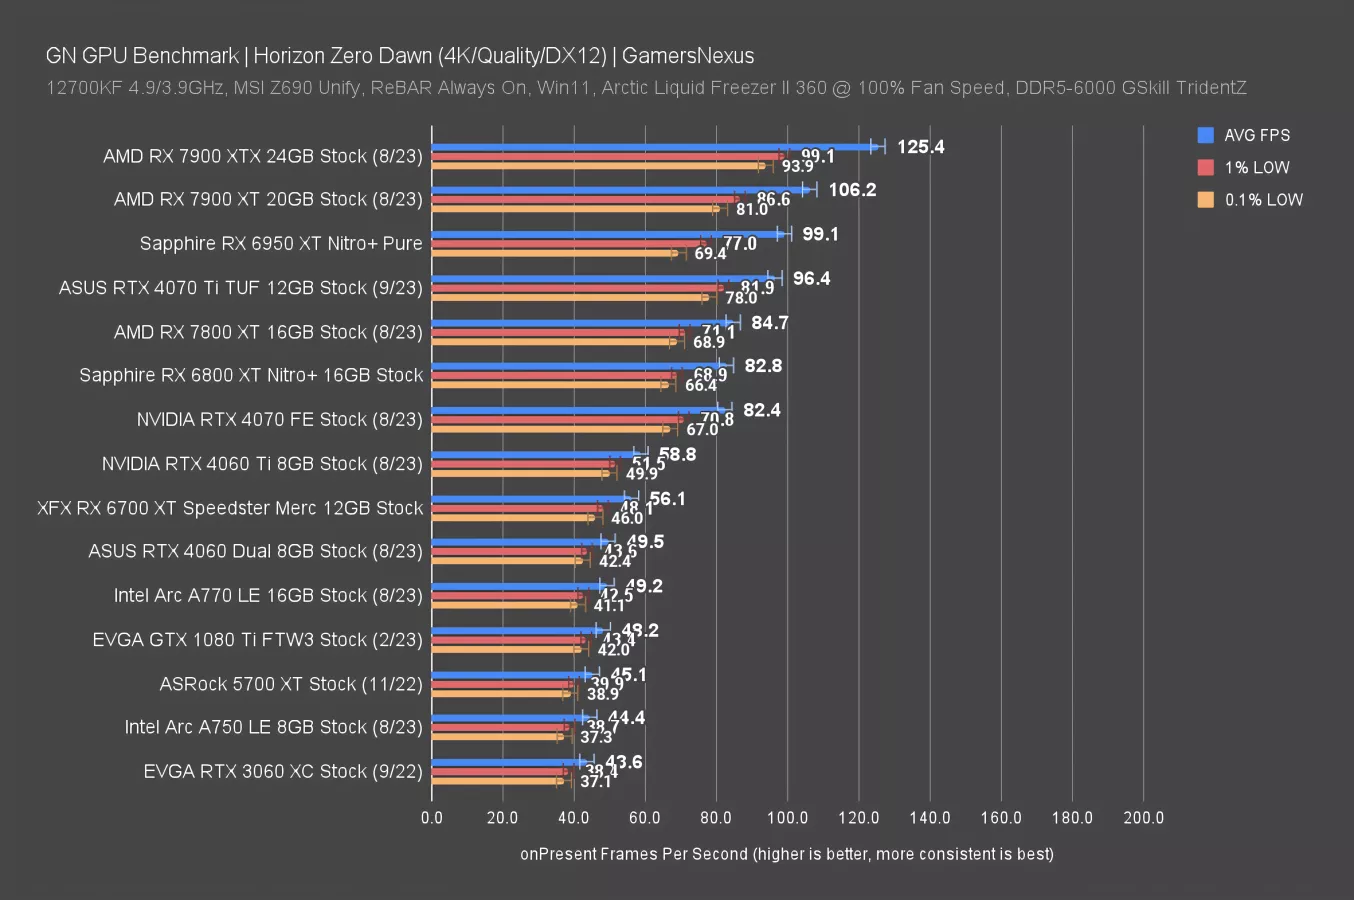
Horizon Zero Dawn is in briefly now. In this one, the 7800 XT’s 85FPS AVG had it functionally tied with the 6800 XT and RTX 4070, including in frametime pacing. The lead over the 6700 XT was 51% generationally, with nearly a doubling of the 5700 XT’s framerate. As for the other direction, the 4070 Ti leads by 14%, with the 7900 XT ahead by 25%.
Horizon Zero Dawn - 1440p
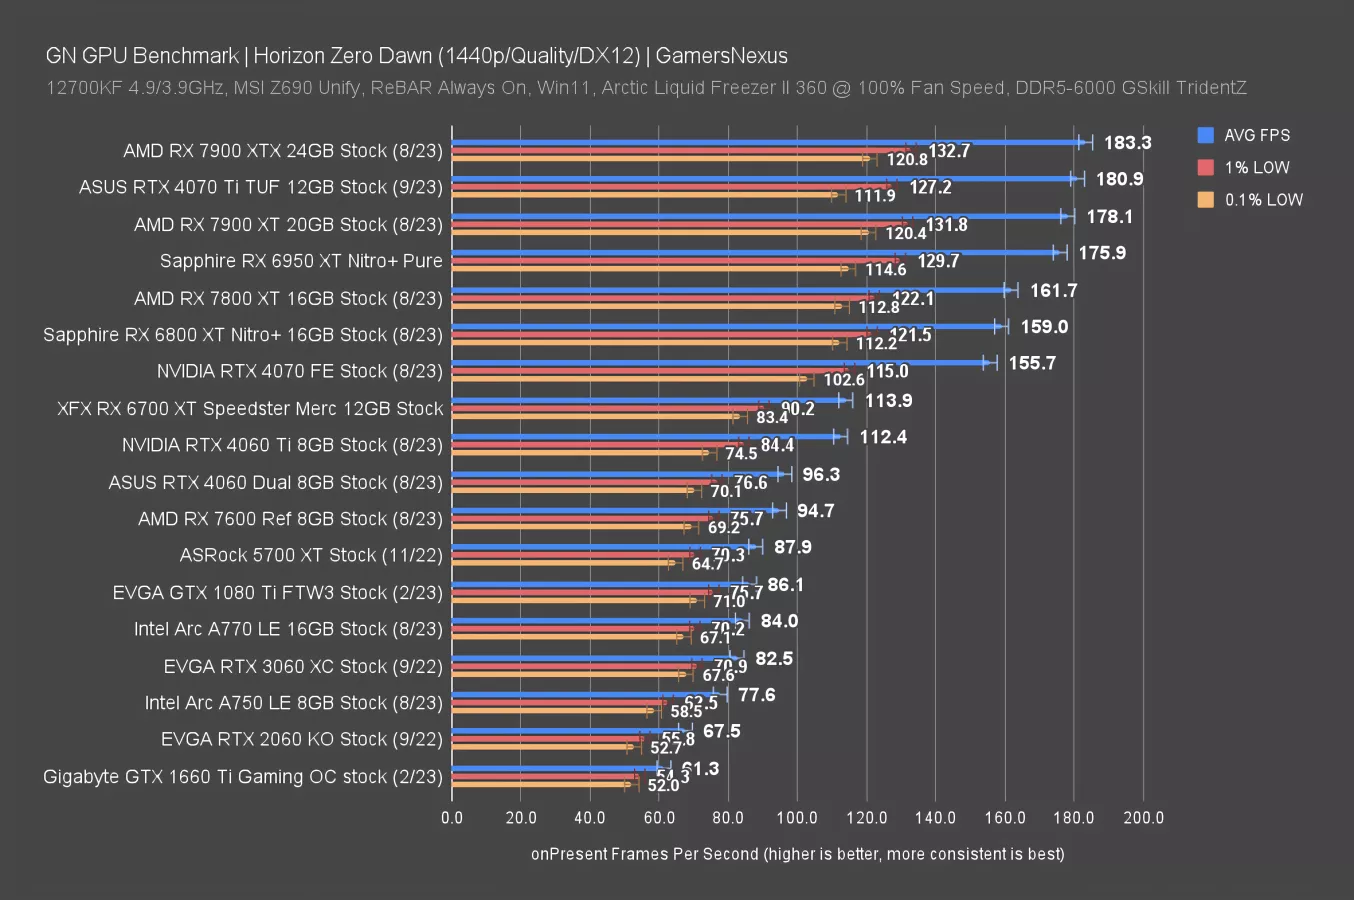
At 1440p, the 7800 XT is about tied with the 6800 XT, ahead of the 4070 by 3.9%, ahead of the 6700 XT by 42%, and the 4060 Ti about the same. Once again, we’re seeing about an 84% lead over the 5700 XT. Users of that GPU or the older 3060 and 2060 cards may see an opening for an upgrade.
1080p didn’t prove useful. We were CPU-bound.
Final Fantasy XIV (FFXIV) Benchmarks
FFXIV - 4K
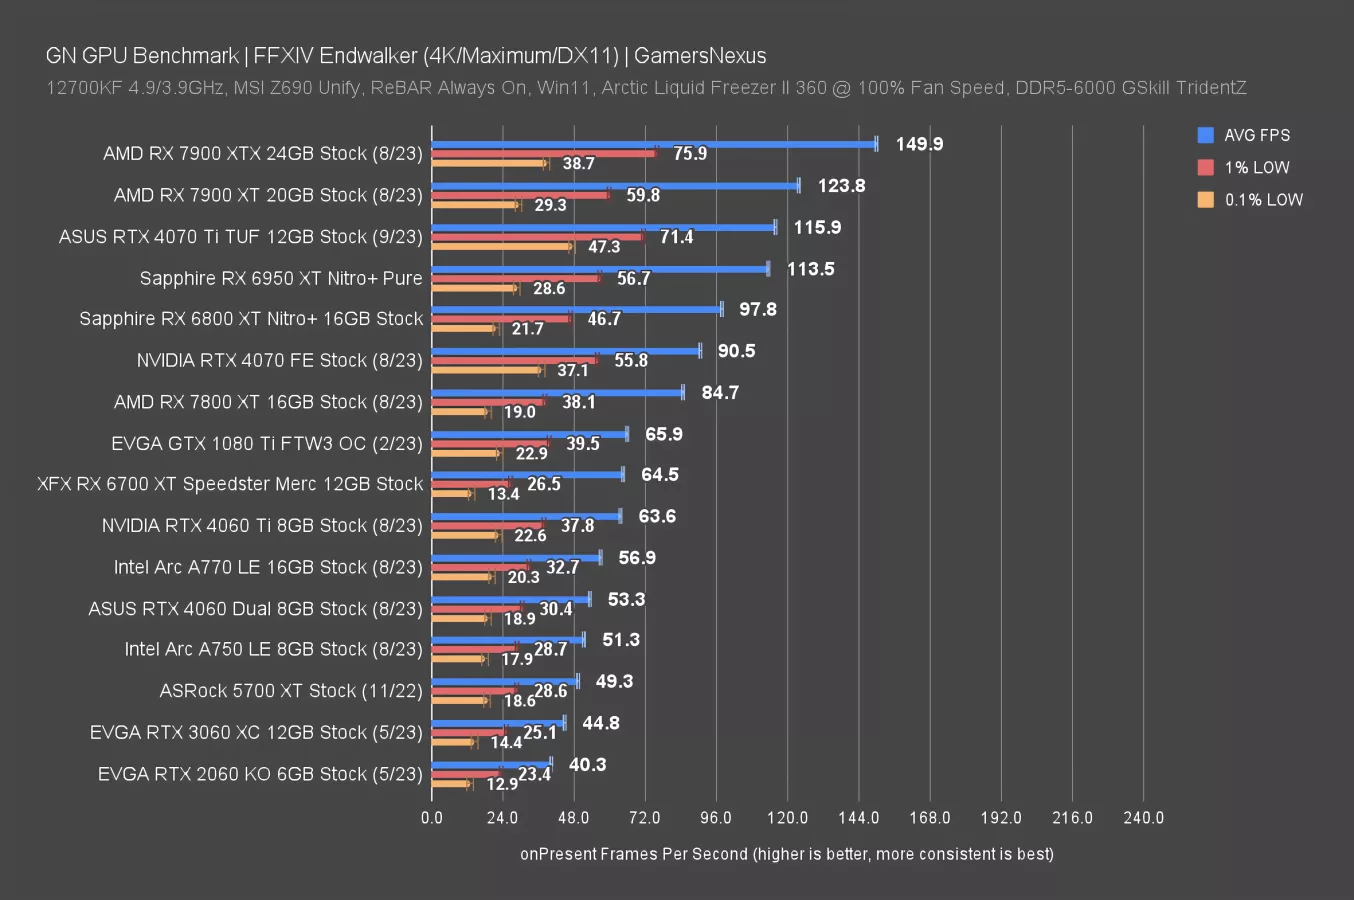
In Final Fantasy 14 at 4K, the RX 7800 XT posted an 85FPS AVG result, although with 0.1% lows behind where they should be. This has been true of AMD’s hardware in the current version of this testing process for this specific game, so it’s not unique to the 7800 XT.
The 7800 XT manages to lead the 6700 XT by 31% -- similar to the 1080 Ti and the 4060 Ti, actually. The 4070 is ahead of the 7800 XT in this one by about 6.8%. The 6800 XT pushes a little higher still, gaining 15% over the 7800 XT. As a final reference point toward the top, the extra money spent on a 4070 Ti would gain you 37%, or 46% at the 7900 XT.
FFXIV - 1440p
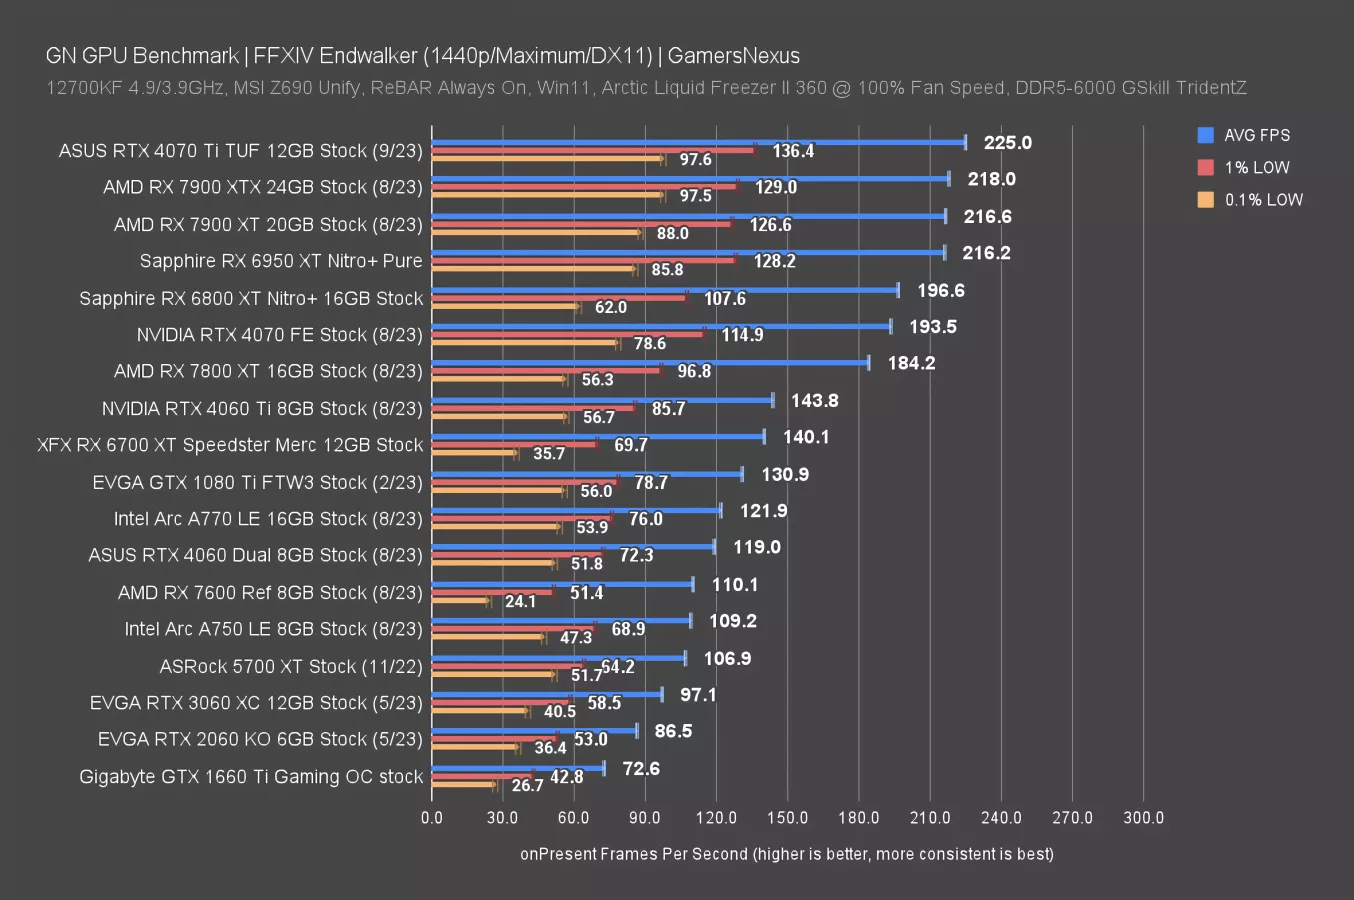
At 1440p, the lows behave the same way as we saw at 4K -- that’s a specific frametime pacing behavior related to this game. The 7800 XT’s 184FPS AVG has it ahead of the 4060 Ti by 28% and has the 4070 non-Ti ahead by 5%. The cards are becoming limited at the top of this chart, allowing the 4070 Ti to pull ahead -- but we are bottlenecked on the CPU now, so let’s move on.
Real-Time Ray-Tracing Benchmarks
Ray Tracing - F1 2022 4K
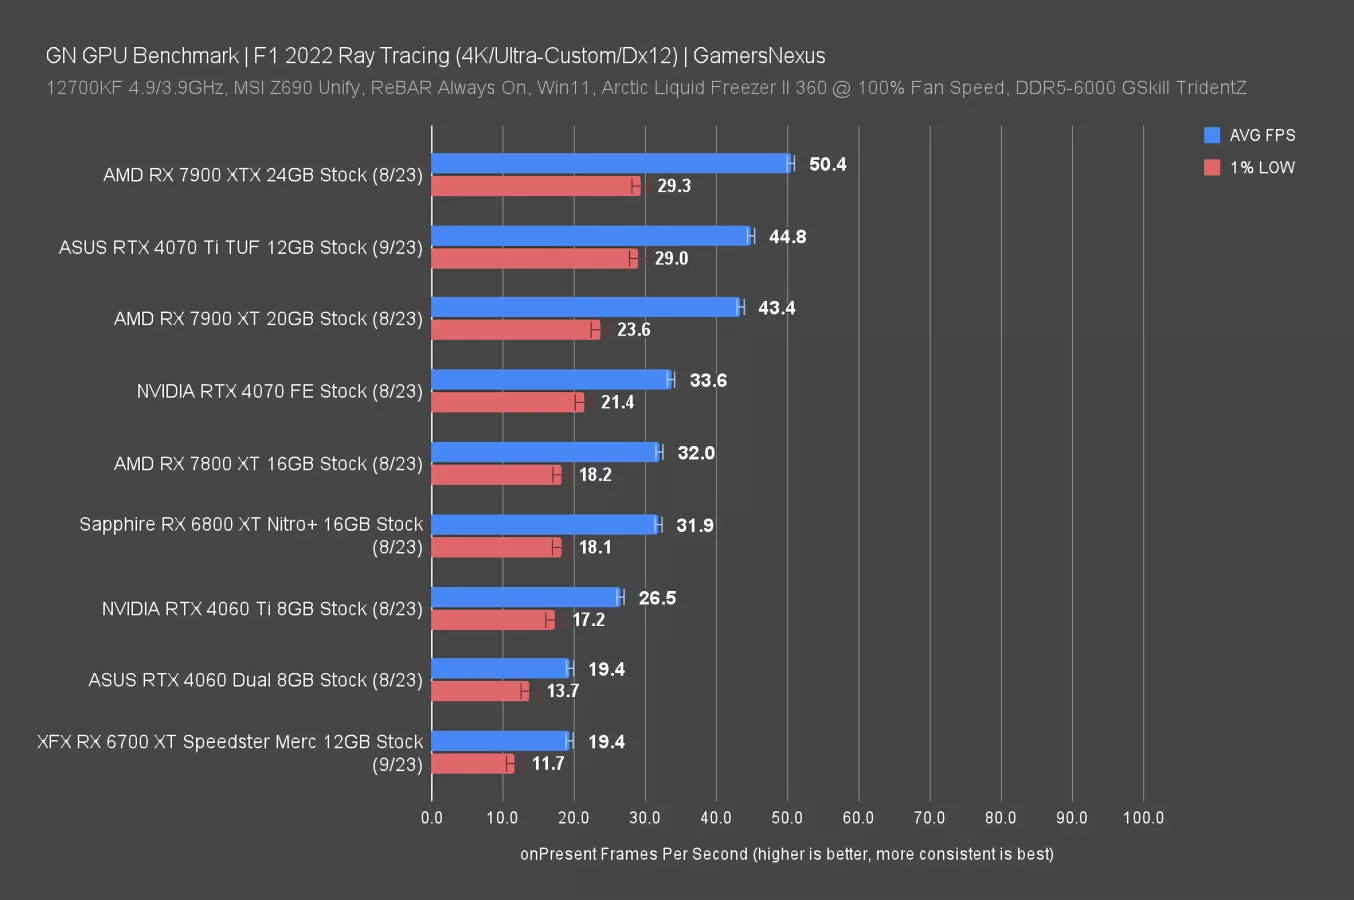
Ray tracing is up now. We’re keeping this brief since we just added a bunch of games to our test suite for rasterization, but we’re adding more RT testing shortly to accompany those changes.
Starting with F1 2022 at 4K with RT on, the RX 7800 XT ran about equal to the RX 6800 XT. That’s not great for AMD given some of the prices for the 6800 XT lately, especially if you go used. The 4070 has about a 5% lead here, so not much -- but our resolution is also high. Let’s move to 1440p.
Ray Tracing - F1 2022 1440p
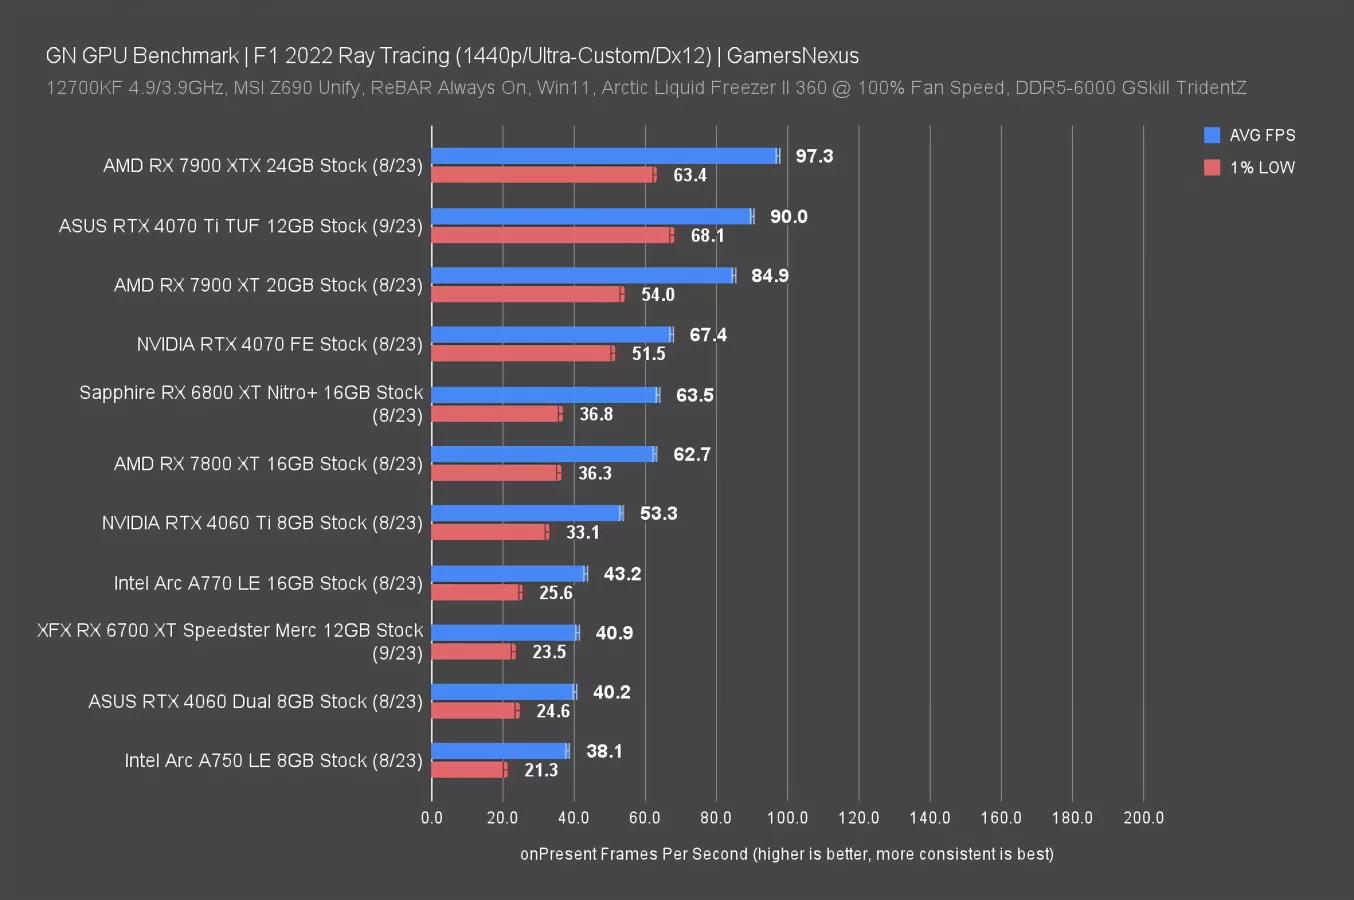
At 1440p with RT, the RX 7800 XT again roughly tied with the RX 6800 XT. It leads the 4060 Ti by 18%, with the 4070 leading the 7800 XT by 7%.
Ray Tracing - Tomb Raider 4K
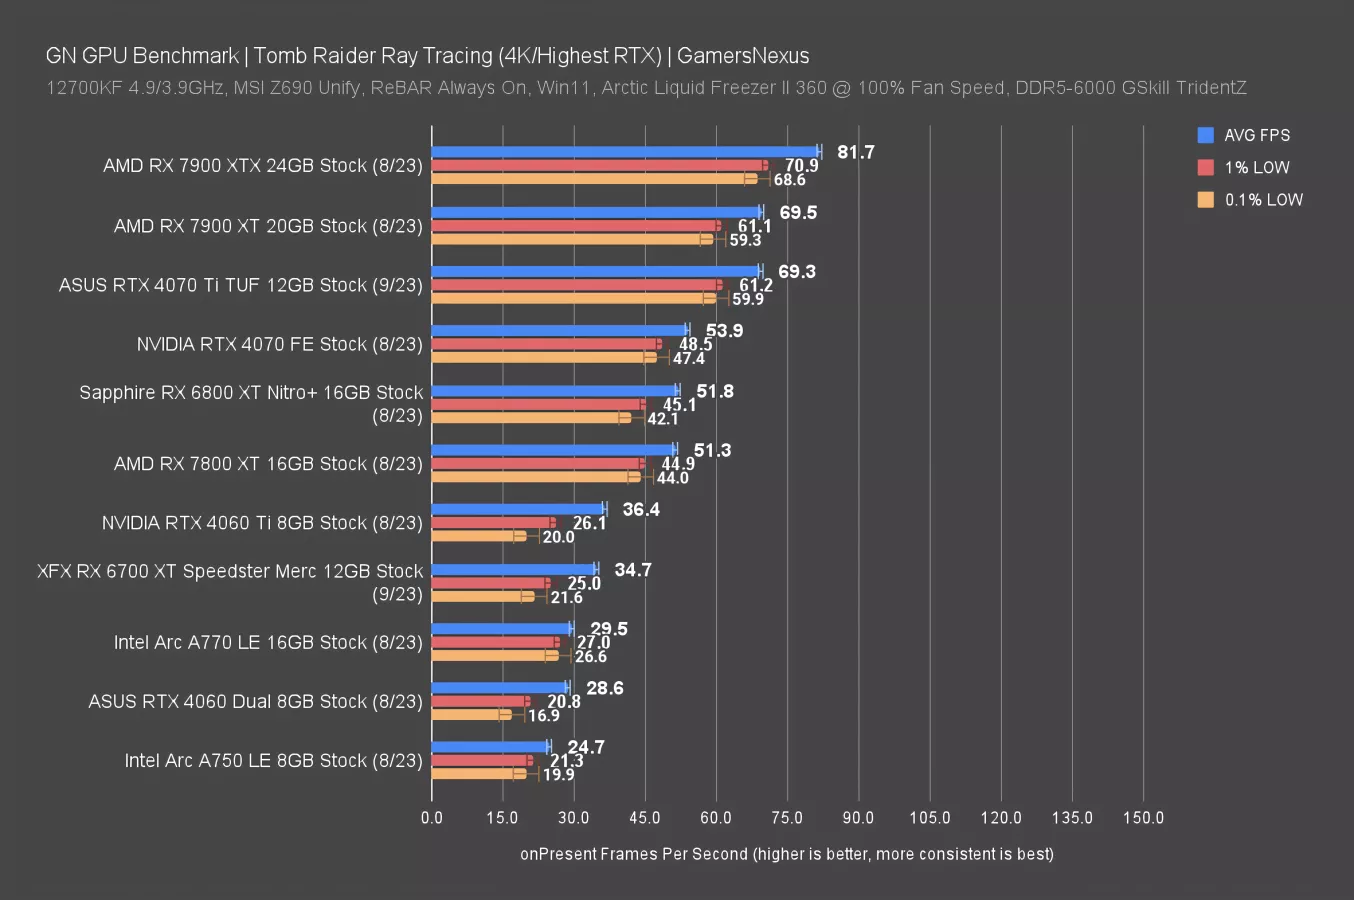
Moving to Tomb Raider with RT shadows, first at 4K, the 7800 XT was tied with the 6800 XT. The lead over the 4060 Ti is massive due to the resolution here -- that reduces as resolution reduces. The 4070 maintains a 5% lead here.
Ray Tracing - Tomb Raider 1440p
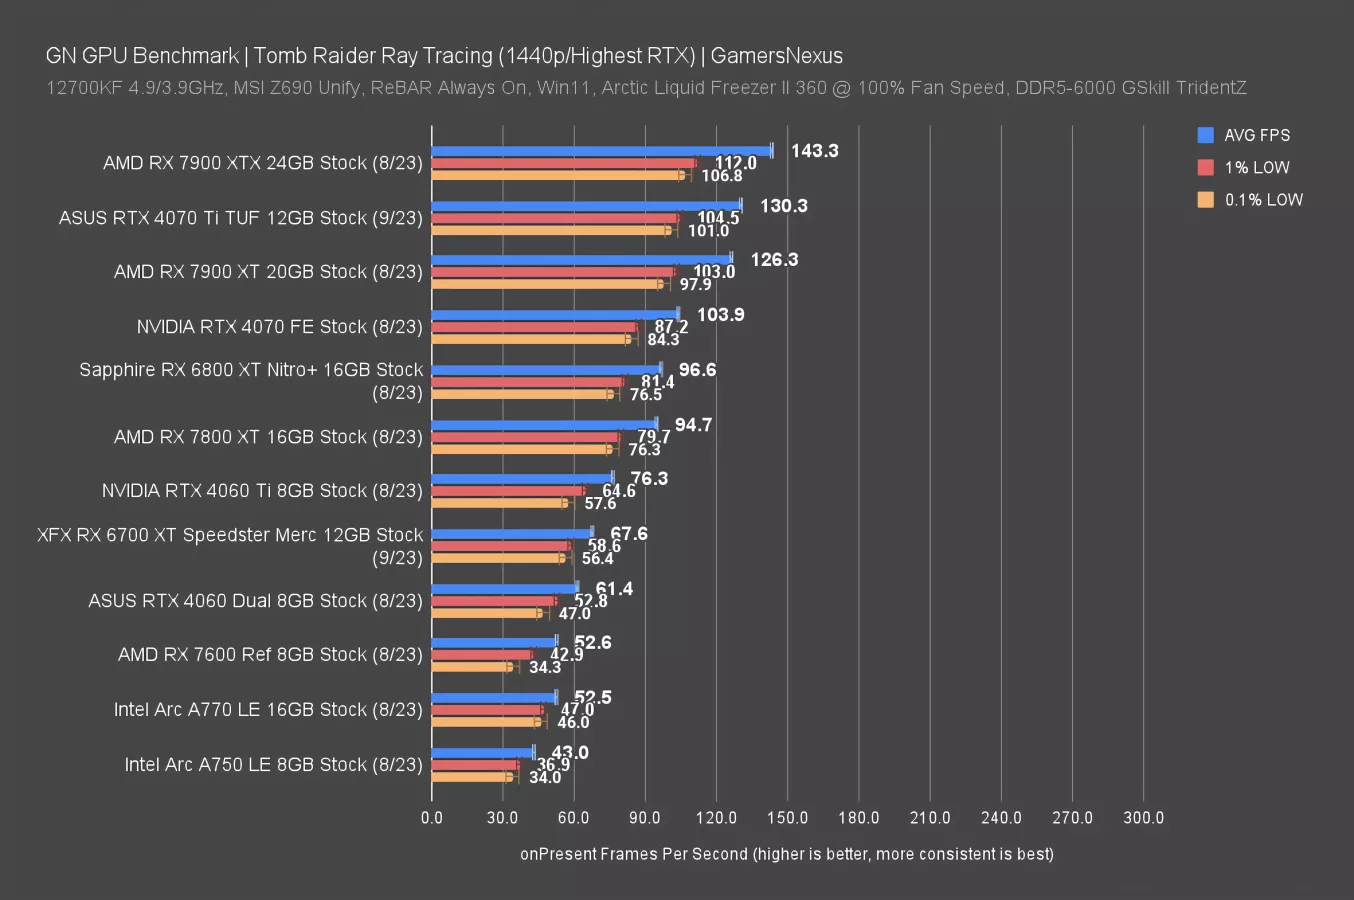
1440p brings the lower-end closer to the 7800 XT, but allows the 4070 to pull ahead and grow its lead to 10%. Otherwise, the 6800 XT again is about the same as the 7800 XT.
GPU Power Consumption Comparison
Now for power consumption.
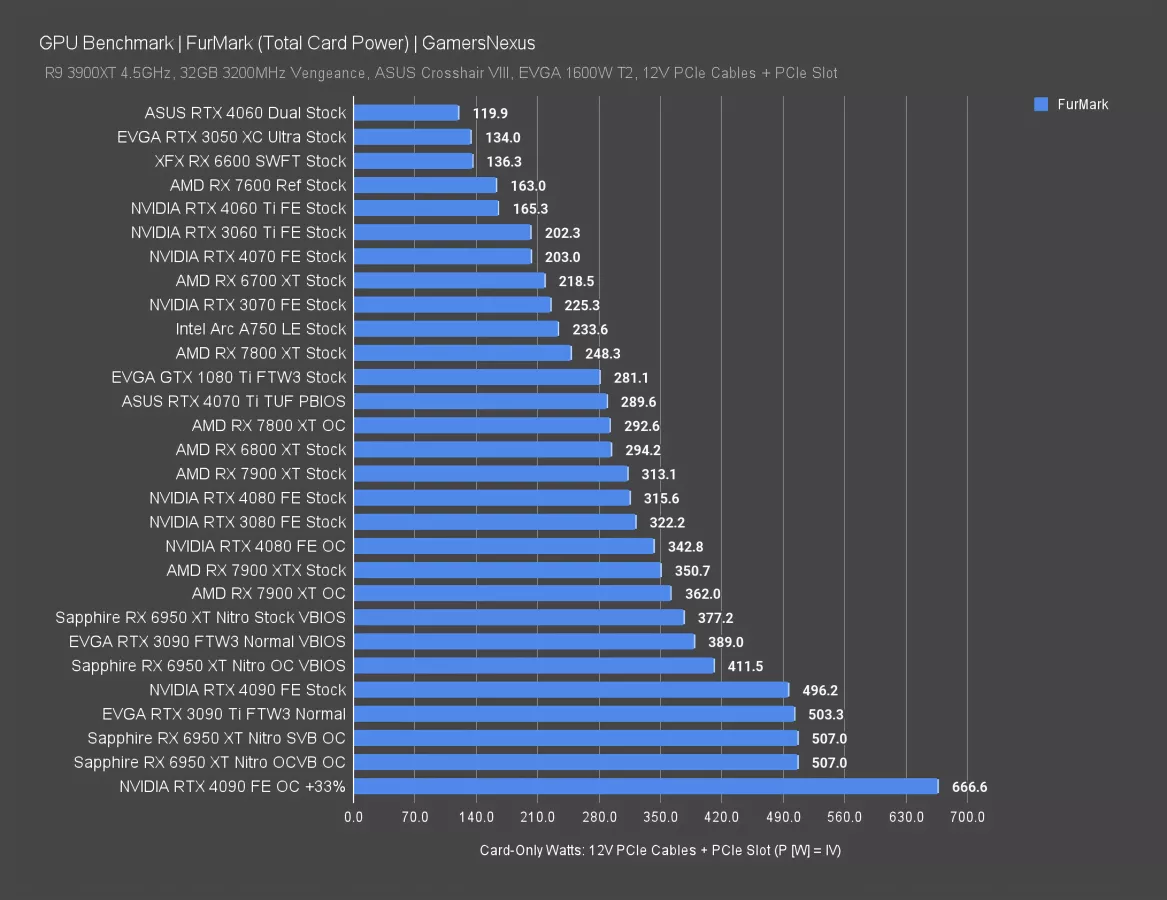
The RX 7800 XT pulled 248W when stock in a full workload. Overclocking it gave us headroom up to 293W. That has the stock 248W 7800 XT as more efficient than Intel’s A750. NVIDIA’s 290W 4070 Ti TUF pulled more power but also ran a higher framerate. Compared to the 6800 XT, the 7800 XT consumed about 50W less power in this workload.
Conclusion
We’ll defer to a new chart for some numbers. One important point with these summaries: In scenarios of a CPU bind, like some tests at 1080p, you’ll see little to no change. That’s expected. It’s because we were resource limited elsewhere in the system.
Another point is that we're trying to keep the percent math all in one direction where possible. Percent math can be tricky, so we mostly aim for a percent improvement. This means in the title of the chart, it's going to say "from A to B." That means from baseline card A, so let's say a 7800 XT to a 6800 XT, to B, we're looking at the percent improvement going in that direction.
NVIDIA RTX 4070 vs. AMD RX 7800 XT in Rasterization
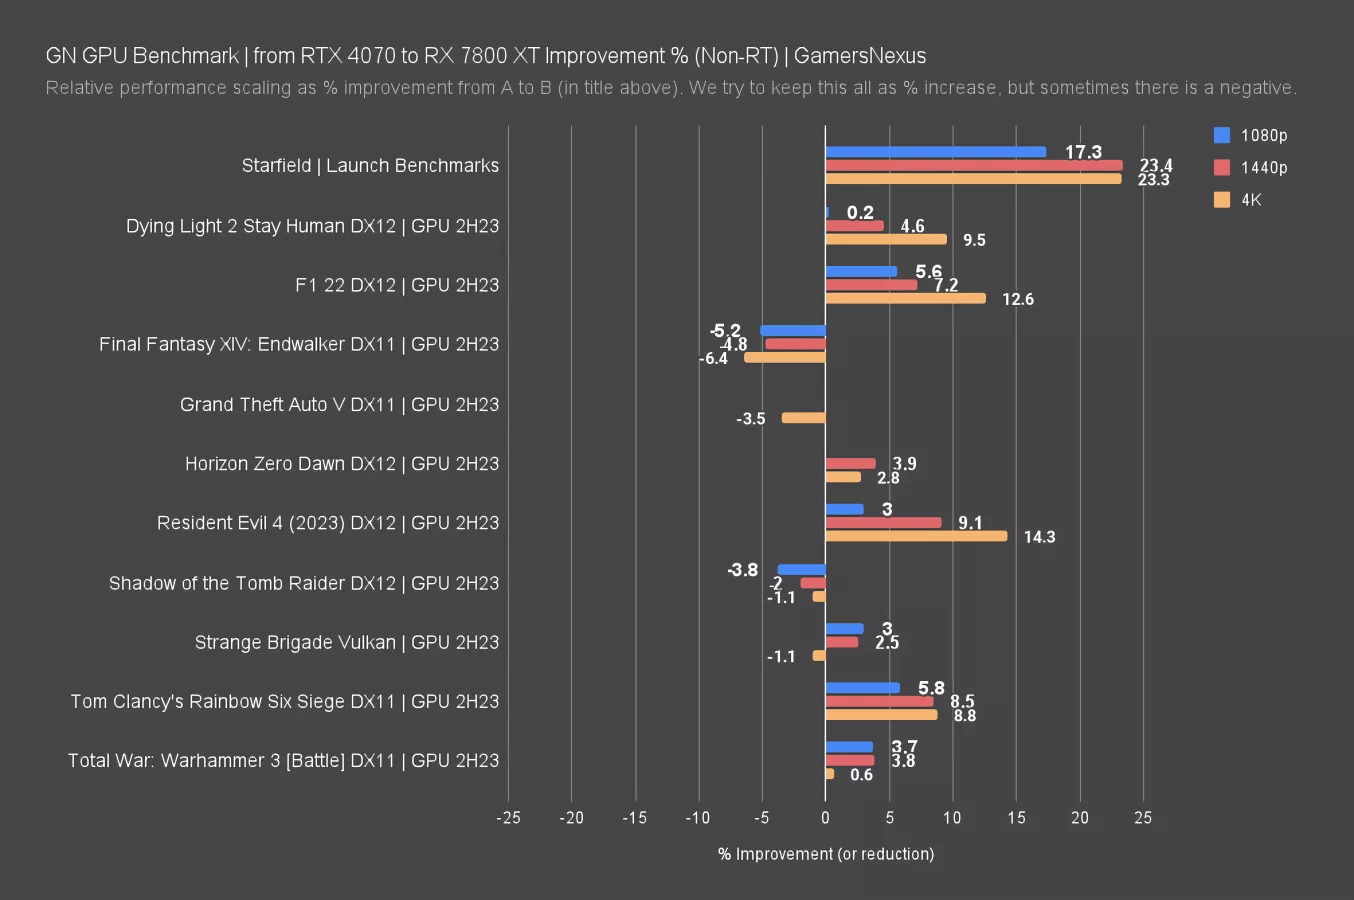
This first chart is for the 4070 versus the 7800 XT, and it shows the percent improvement from the 4070 to the 7800 XT. The 7800 XT generally bests the 4070, sometimes significantly. You see that especially at 4K. We already know the 40 series, like the 4060 Ti versus the 3060 Ti, has issues with these higher resolutions.
NVIDIA RTX 4070 vs. AMD 7800 XT in Ray Tracing
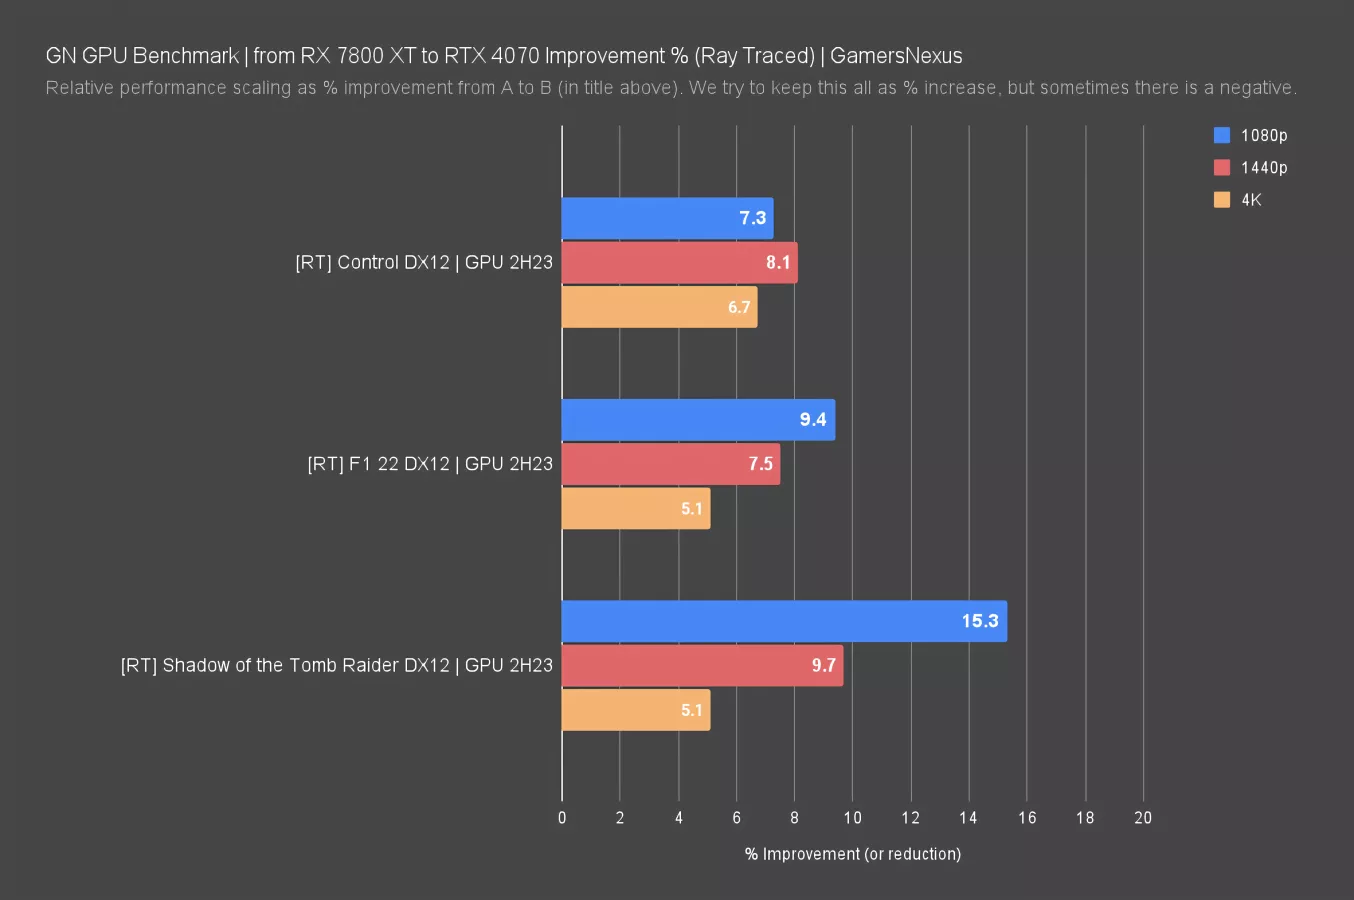
When ray-traced, the 4070 was a clear winner. It’s anywhere from 5% to 15% better in these charts with RT workloads.
AMD RX 7800 XT vs. AMD RX 6800 XT
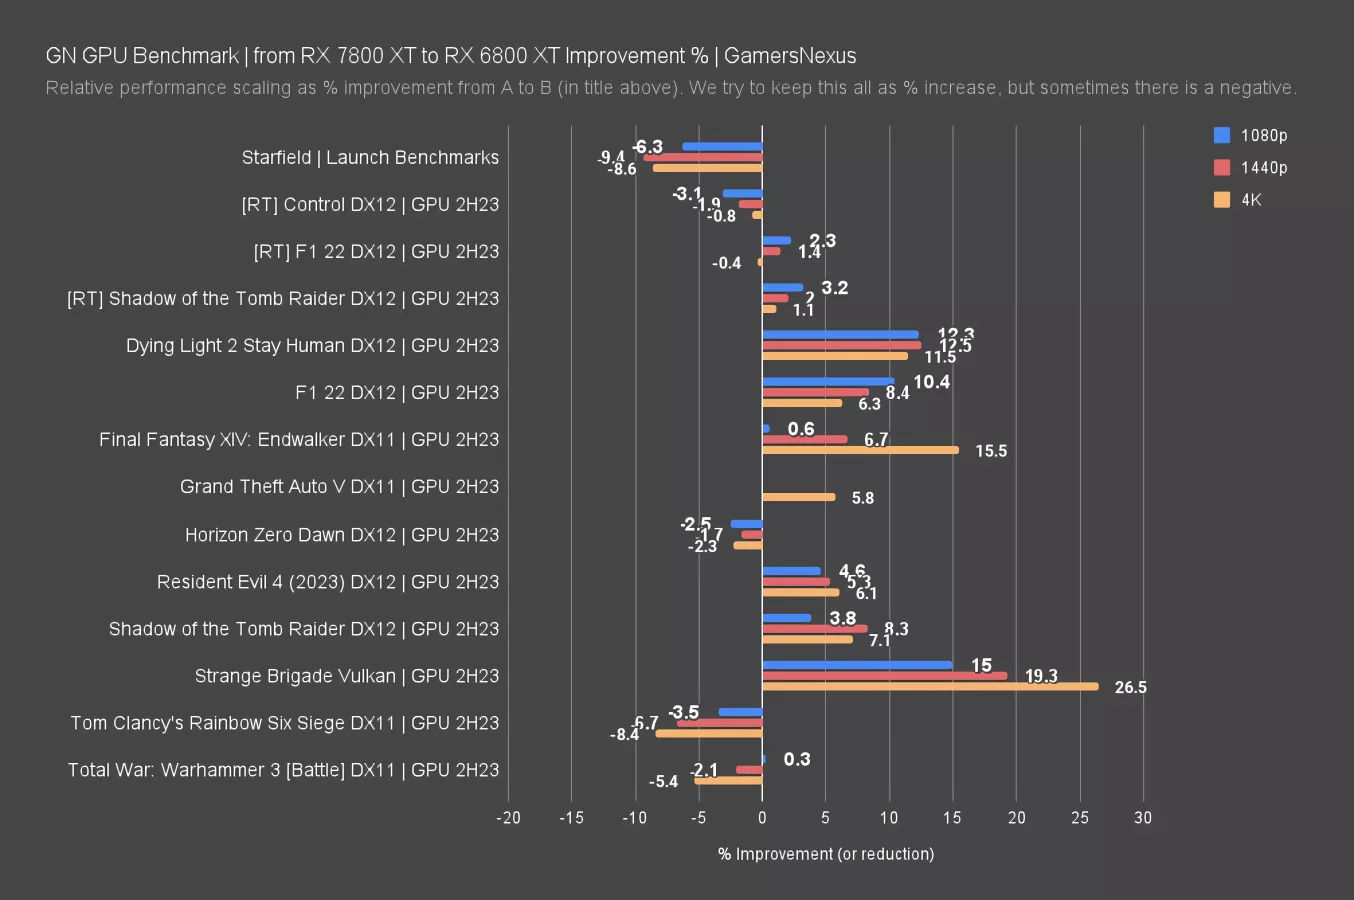
This summary chart looks at improvement from the 7800 XT to the 6800 XT, meaning that bars going in the positive direction, to the right, are the percentage advantage that the 6800 XT has over the new 7800 XT.
In most of our tested scenarios, the 6800 XT bests the 7800 XT. That’s embarrassing. Fortunately for AMD, the 6800 XT had a higher initial MSRP. Unfortunately for AMD, it’s readily available for cheap if used, or in a couple places we checked, about the same price. Some of the improvements are drastic, like Strange Brigade Vulkan at 4K or Final Fantasy at 4K.
NVIDIA RTX 4060 Ti vs. AMD RX 7800 XT
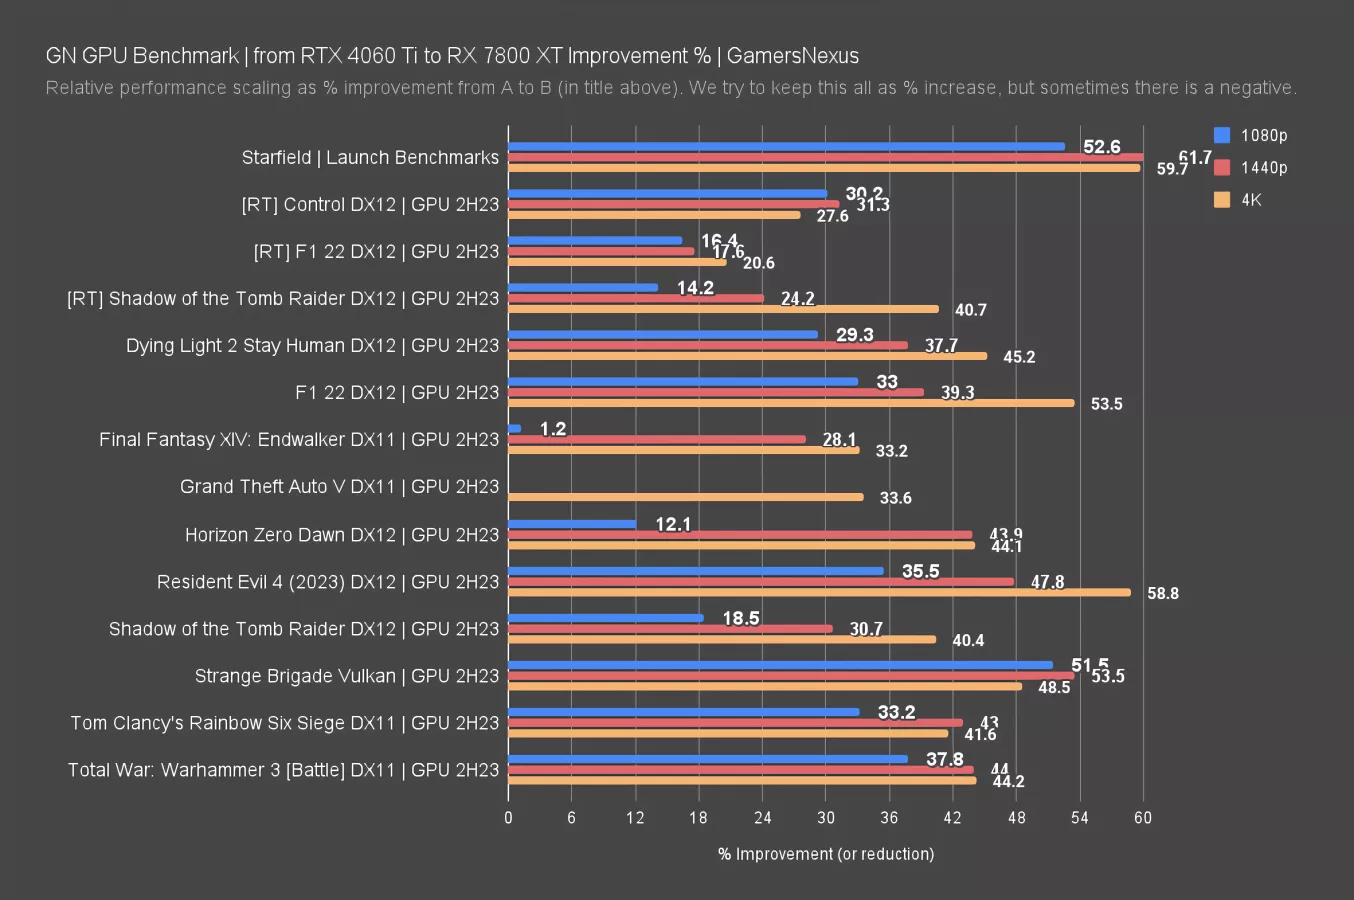
Here’s the chart for the 4060 Ti to the 7800 XT. In this one, the 7800 XT has it by a mile.
The 4060 Ti loses by a lot to the 7800 XT given the $100 price gap. NVIDIA’s 4060 Ti seems to be exactly where we left it, which is the trash.
The 6800 XT is compelling if you can find it, even as compared to the 7800 XT. NVIDIA struggles in terms of pricing or value, especially when looking at the 4060 Ti or the 4070. We expect another card to slide in between the 7900 XT and the 7800 XT, perhaps the 7800 GRE. But that's not official yet. AMD still has a gap in its pricing, but they've stated they're done launching GPUs for this generation with new ASICs. This leaves room for a potential refresh, and if they do make one, it'd be here.
Hopefully that helps you make a decision. We really wanted to package these results in a neater fashion to make it more approachable, especially because, frankly, it’s been a long week. You’ve got all the numbers, so you can make a decision now. Our main concern with the 7800 XT is the underperformance versus the 6800 XT in many cases, so we’d recommend that you check the remaining new stock. If you’re OK with used, that may be a good consideration (alongside the 3080).
Otherwise, you’ve got the numbers. Our 7700 XT review will be next.