The RX 7700 XT launched alongside the RX 7800 XT, with only a $50 gap between. But last-gen is promising.
The Highlights
- Past AMD launches indicate that these prices will diverge more as time grows on.
- Although the upsell makes more sense now -- especially to last-gen -- this card could become a mainstay once it drops in cost.
- Even still, the RTX 4060 Ti has now had its ass handed to it. Again.
- Original MSRP: $450
- Release Date: September 6, 2023

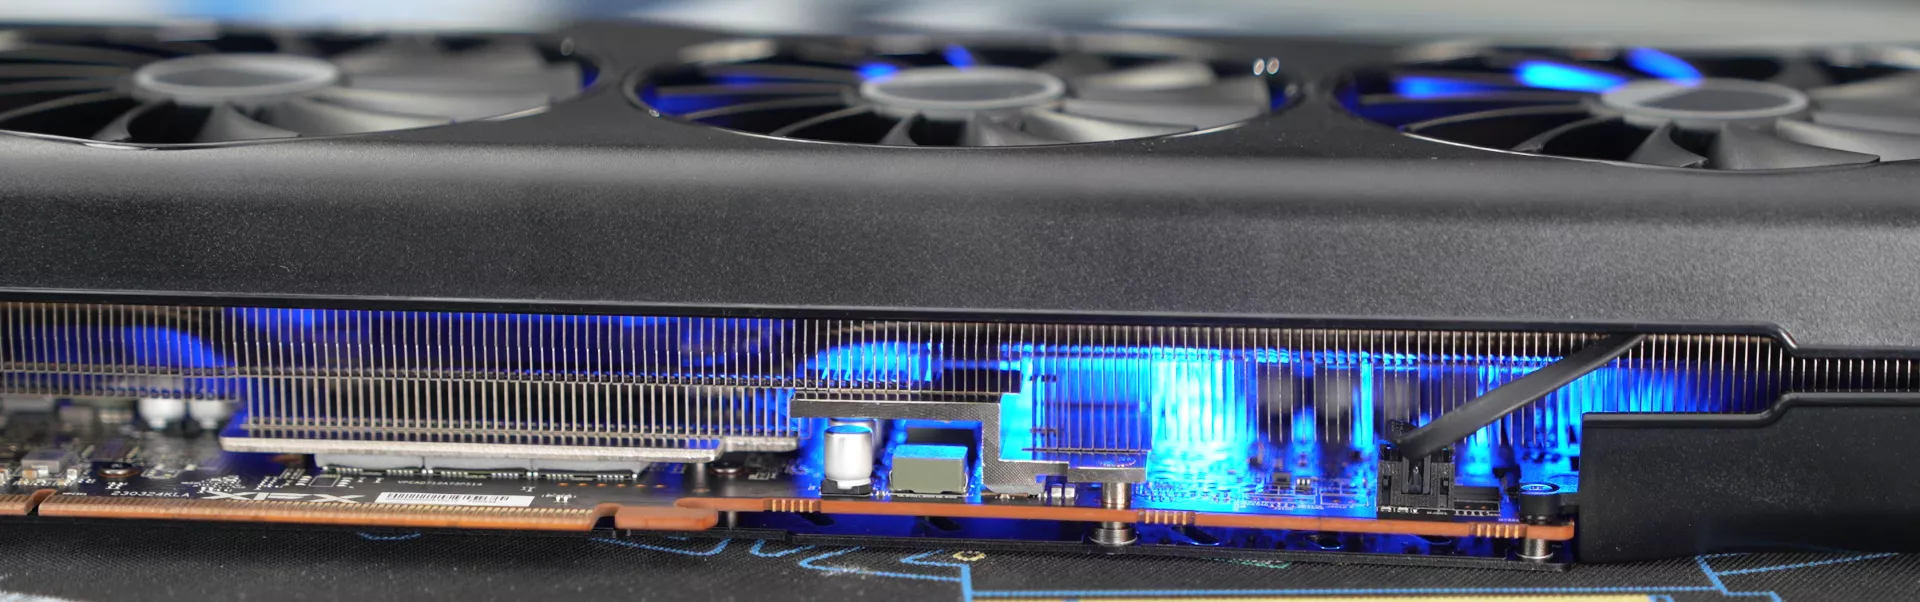
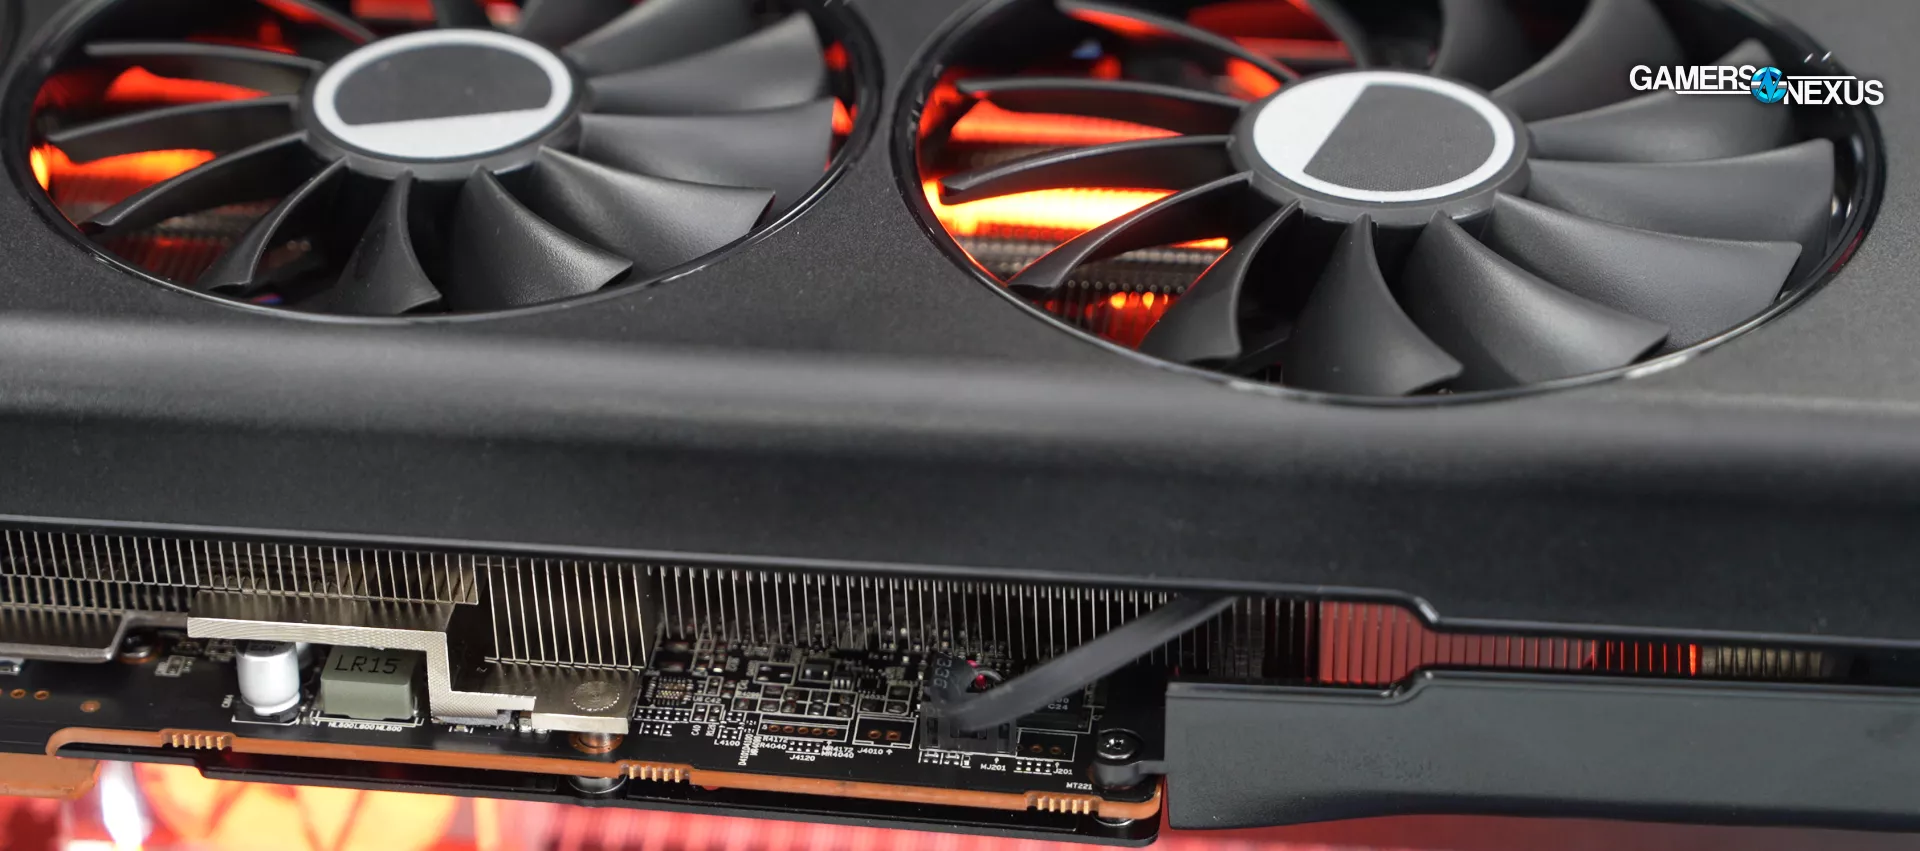
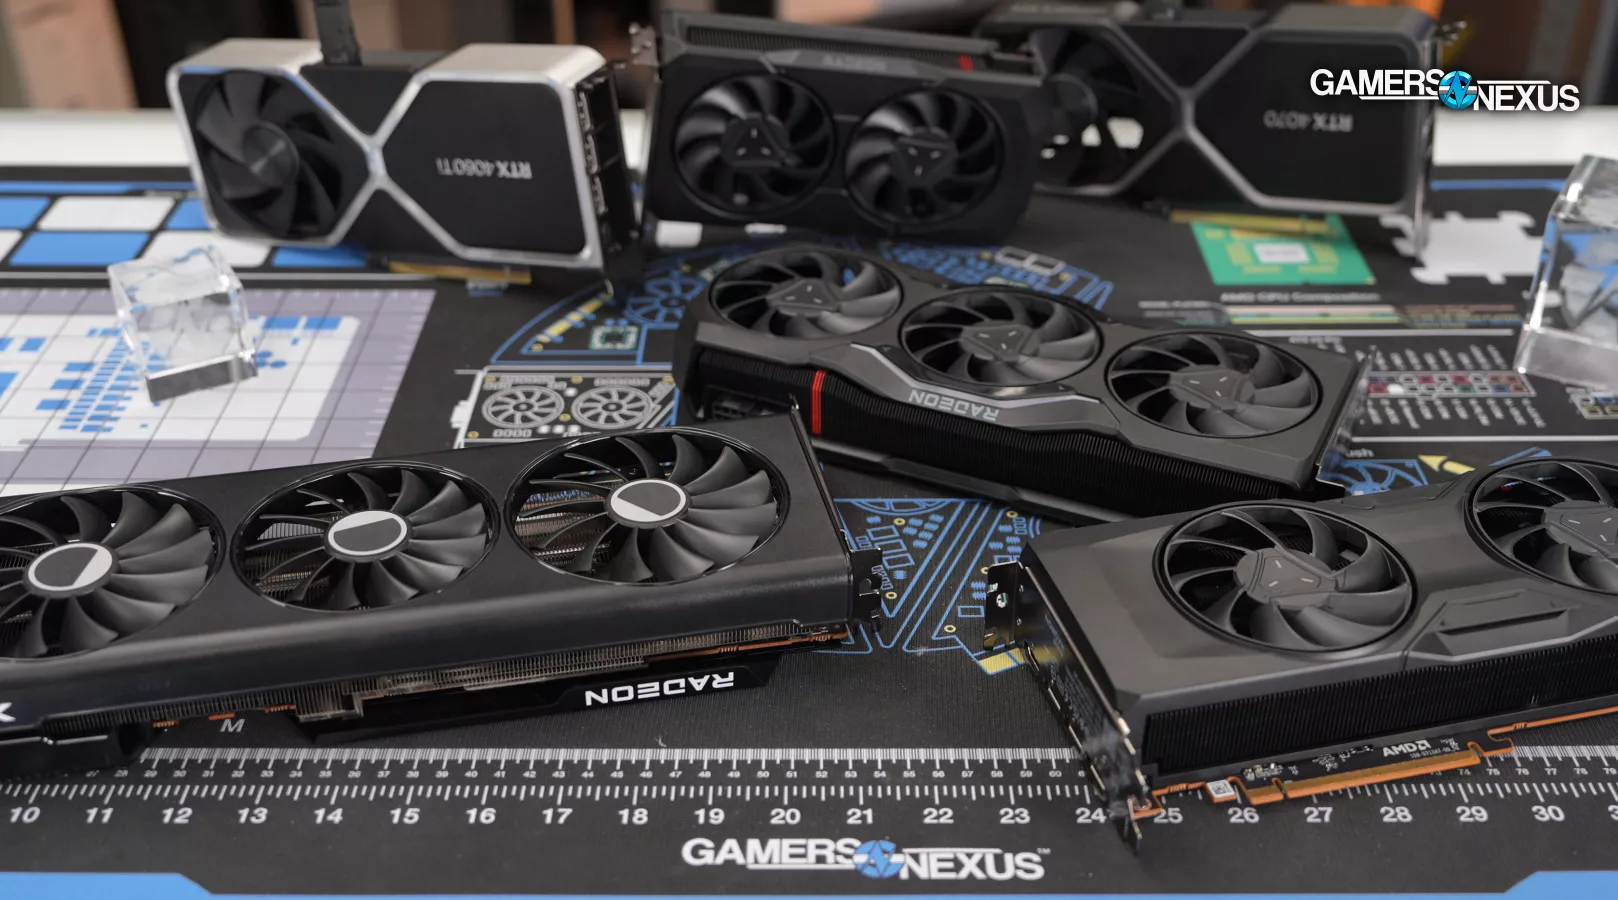
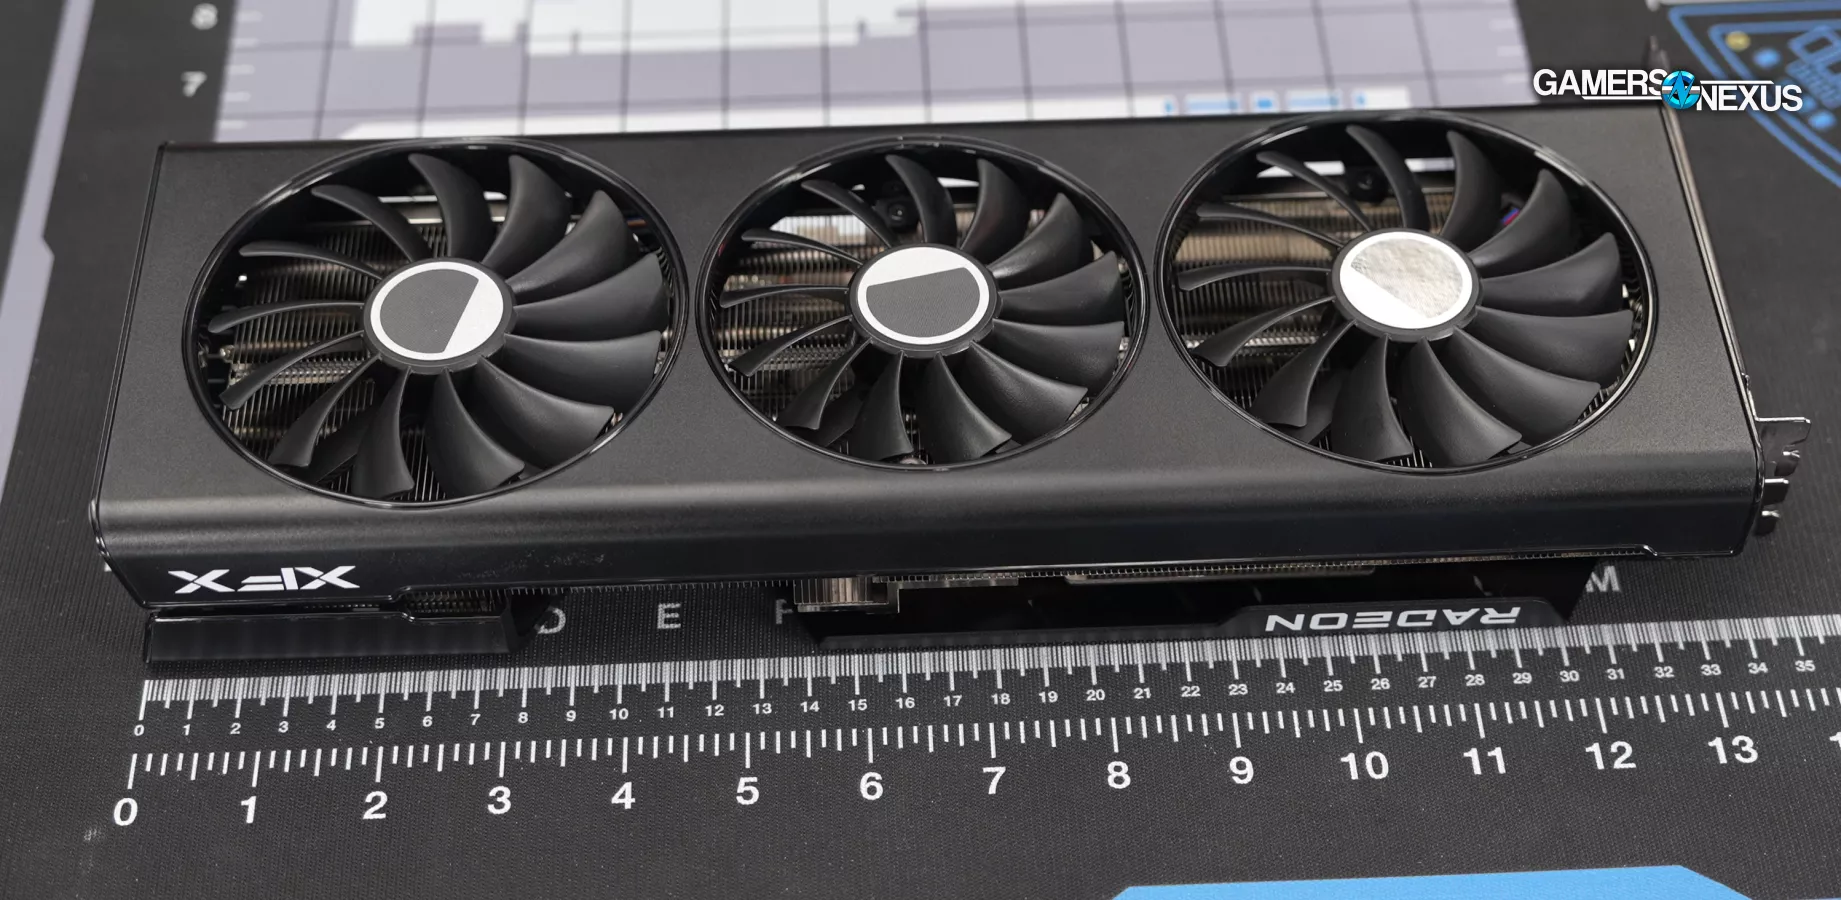
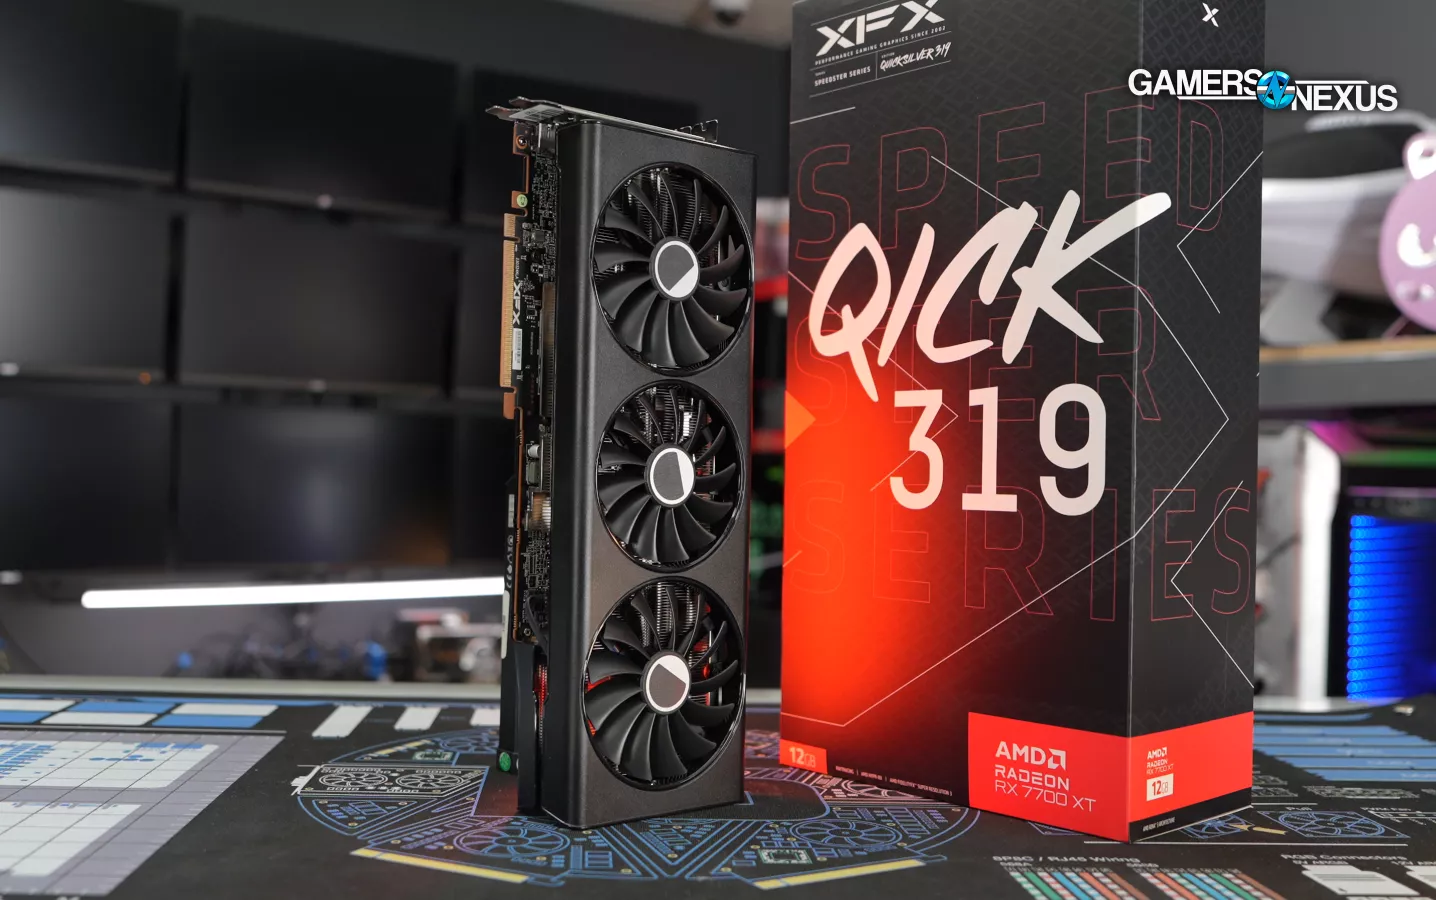
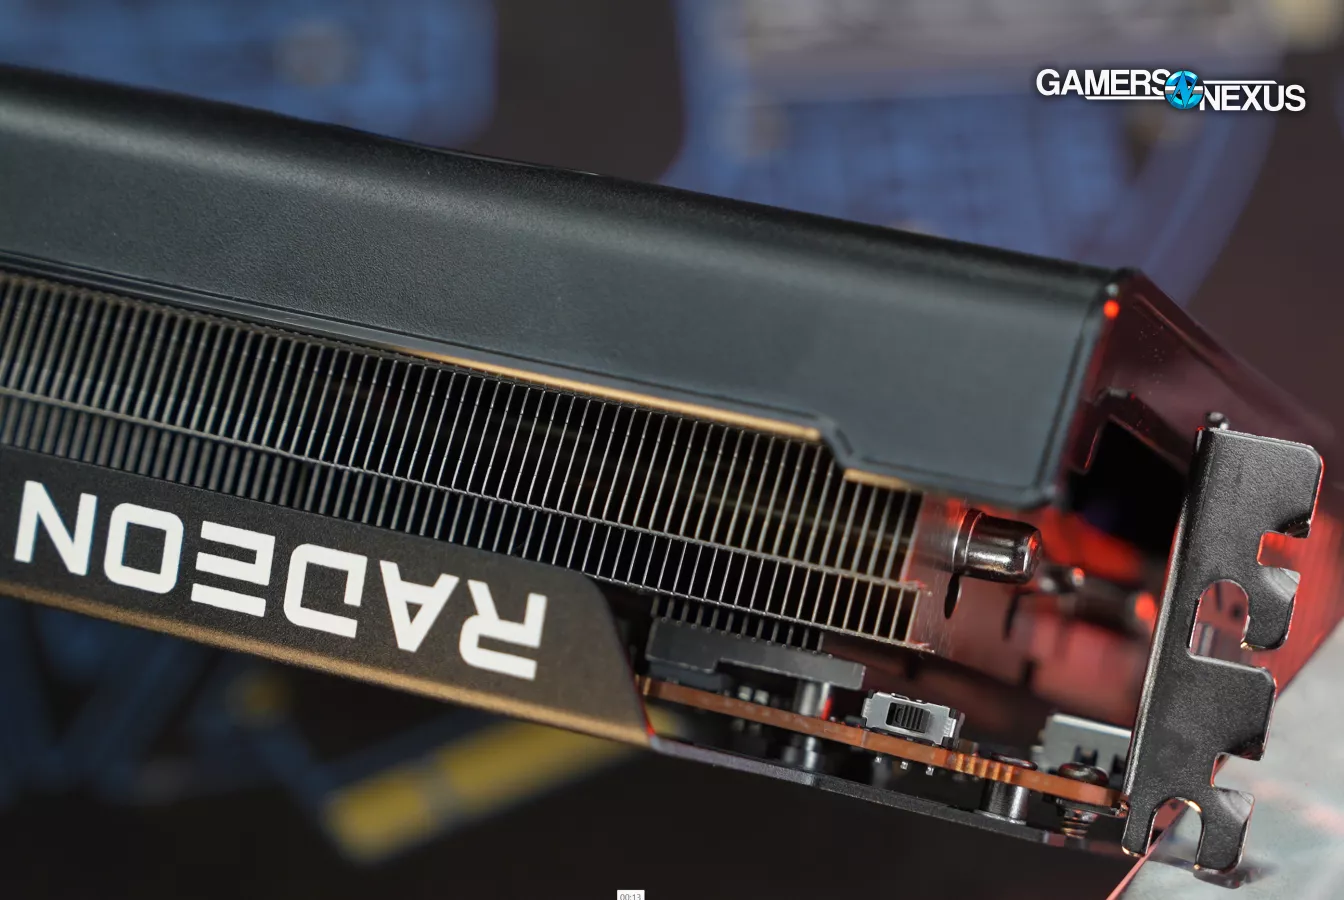
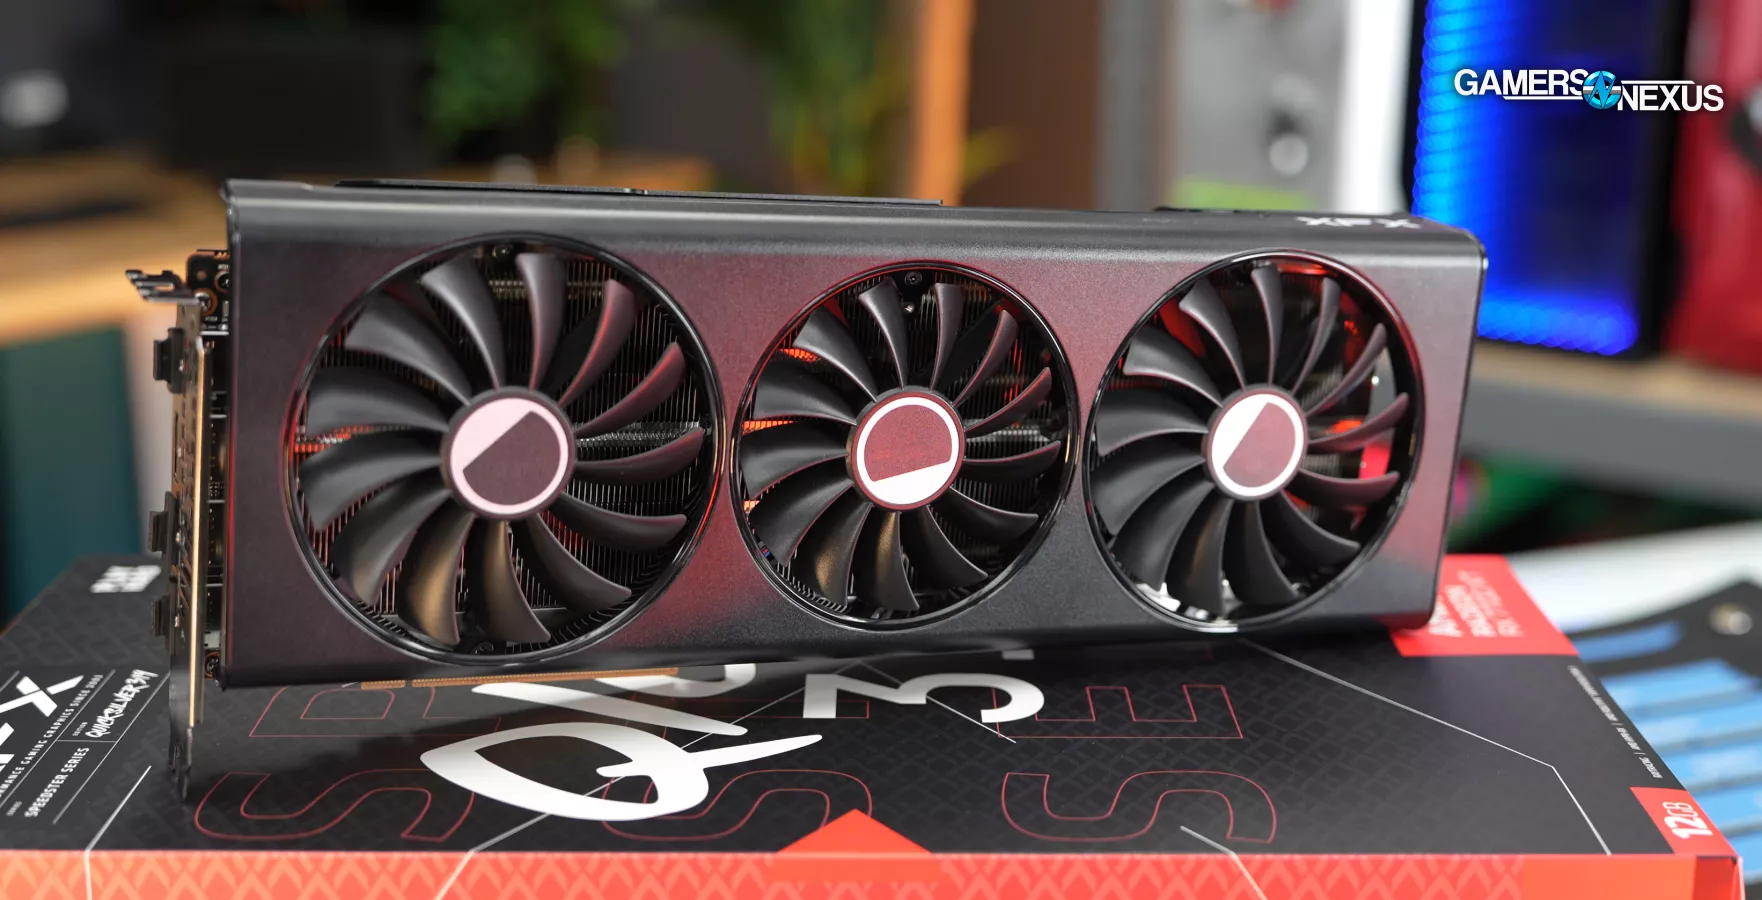
Now we're reviewing the AMD Radeon RX 7700 XT. We were sent an XFX AIB partner model, as reference models weren’t made for the RX 7700 XT series GPUs -- and the XFX model is comically large. We previously reviewed the AMD RX 7800 XT in a separate piece, but found that, compared to an RX 6800 XT (which are still available for competitive prices), it was overall lackluster. The 7700 XT stands to fill a gap in the middle.
The 7700 XT is a $450 card, up against the $500 7800 XT. The 6800 XT proved to be a better buy than the 7800 XT (based on our testing) if you can still get one at the same price as the 7800 XT. As that card fades and disappears though, the 7800 XT is at least not bad value -- it’s far better than we’ve seen from the RTX 4070 or especially the RTX 4060 Ti. The 7800 XT at least helped prove that the 4060 Ti 16GB is a massively greedy waste, priced the same as the 7800 XT and 6800 XT, and that the 4060 Ti 8GB remains suspect. The 7700 XT will likely further threaten the 4060 Ti’s existence, but it may be close enough to the $500 cards to skip if you can afford it.
Credits
Test Lead, Writing, Web Editing
Steve Burke
Testing, QC
Patrick Lathan
Jeremy Clayton
Mike Gaglione
Video Production
Vitalii Makhnovets
AMD RX 7700 XT GPU Specs vs. 7800 XT, 6800 XT
| RX 7800 XT | RX 6800 XT | RX 7700 XT | |
| Architecture | RDNA 3 | RDNA 2 | RDNA 3 |
| GPU Core | Navi 32 | Navi 21 | Navi 32 |
| Die Style | 1x GCD 4x MCD | Monolithic | 1x GCD 4x MCD |
| Process Node | 5nm/6nm | 7nm | 5nm/6nm |
| Core Configuration | |||
| Advertised "Game" Clock | 2124MHz | 2015MHz | 2171MHz |
| Advertised "Boost" Clock | 2430MHz | 2250MHz | 2544MHz |
| Compute Units (CUs) | 60 | 72 | 54 |
| Stream Processors (SPs) | 3840 | 4608 | 3456 |
| Ray Tracing Cores (RT Cores) | 60 | 72 | 54 |
| Texture Mapping Units (TMUs) | 240 | 288 | 216 |
| Render Output Units (ROPs) | 96 | 128 | 96 |
| L2 Cache | 4MB | 4MB | 2MB |
| L3 Cache | 64MB | 128MB | 48MB |
| Memory Configuration | |||
| Memory Capacity | 16GB | 16GB | 12GB |
| Memory Type | GDDR6 | GDDR6 | GDDR6 |
| Memory Bus Width | 256-bit | 256-bit | 192-bit |
| Memory Bandwidth | 624GB/s | 512GB/s | 432GB/s |
| Memory Speed | 19.5 Gbps | 16 Gbps | 18 Gbps |
| Power Configuration | |||
| Power Connectors | 2x 8-pin | 2x 8-pin | 2x 8-pin |
| TDP | 263W | 300W | 245W |
| Launch Information | |||
| Original MSRP | $500 | $650 | $450 |
| Launch Date | September 6, 2023 | November 18, 2020 | September 6, 2023 |
Quick recap of the prices — we went over these in the last review as well, but if you missed it: The 4070 Ti is around $800, the 4070 is about $600, the 4060 Ti is between $400 to $500 with the larger capacity, and then the 4060 is $300. That's Nvidia's immediately relevant current-gen lineup. AMD's lineup has the 7900 XT at $800, and then they've got everything from a 6700 XT at $330 up to a 6950 XT at roughly $630, with the 6800 XT somewhere in the middle at $500.
That's the setup. Now, let's get into the benchmark charts, and then we'll show you the summary chart at the end, just like with the 7800 XT.
GPU Test Bench
| Part | Component | Provided By |
| CPU | Intel Core i7-12700KF Overclocked (4.9GHz P-Cores, 3.9GHz E-Cores) | Bought by GN |
| Motherboard | MSI Z690 Unify | MSI |
| RAM | DDR5-6000 G.Skill Trident Z (manually tightened timings) | G.Skill |
| Cooler | Arctic Liquid Freezer II 360 @ 100% Fan Speed | Bought by GN |
| PSU | EVGA 1600W T2 Supernova Corsair AX1600i | EVGA Corsair |
| OS | Windows 11 | Bought by GN |
Starfield GPU Benchmarks
Starfield - 4K/High
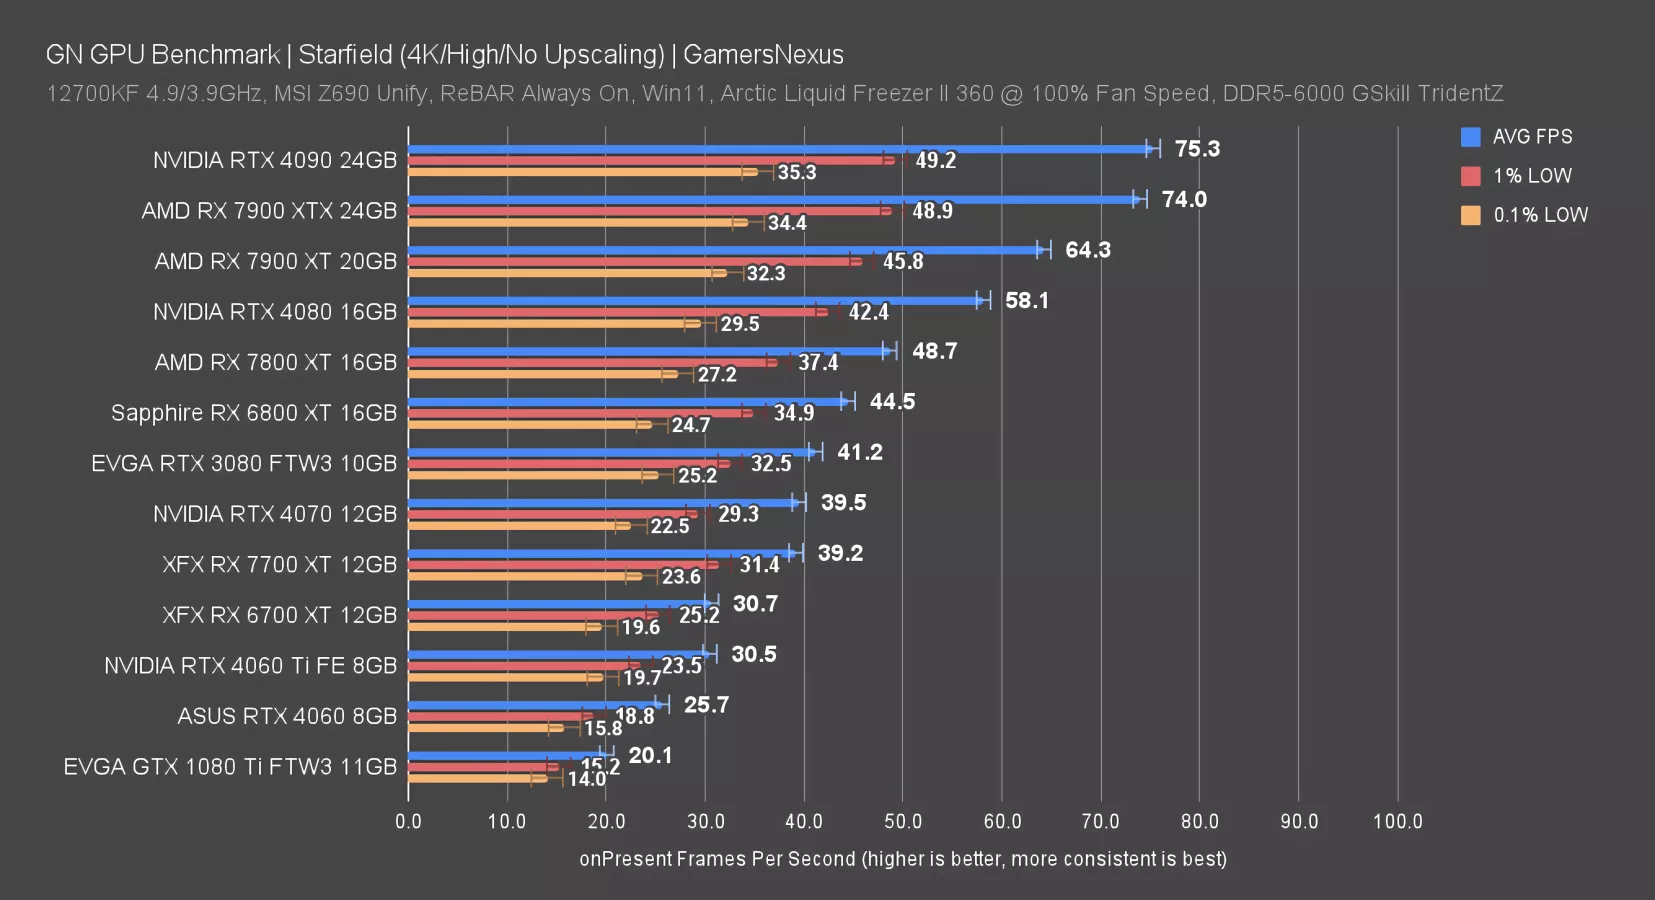
Just like with the 7800 XT review, we’ll start with Starfield. It’s new and it’s a very heavy workload, at least right now, and that makes it particularly relevant. To AMD’s benefit, Starfield is also currently running better on AMD cards price-to-price than NVIDIA cards.
At 4K/High, the RX 7700 XT ran at 39FPS AVG, 31 1% lows, and 24FPS 0.1% lows. That has the RX 7800 XT about 24% ahead of the 7700 XT while costing 11% more. We’re wondering if this is a classic upsell. The performance gap between them is larger than the price gap might otherwise suggest, and considering companies normally have two options in this position -- either have a tiny gap that allows the cheaper card to be the best value or a larger gap that creates an upsell -- we’re not surprised to see the latter.
Either way, compared to the 6700 XT, the 7700 XT leads by 28%. It also leads the RTX 4060 Ti, which is currently about $380-$400. The gap there is a 29% advantage for the 7700 XT. The 4070 is about tied, including in lows, allowing AMD a value advantage in this current game version. The 7800 XT would be the most obvious step up in terms of value to price gap.
Starfield - 1440p/High
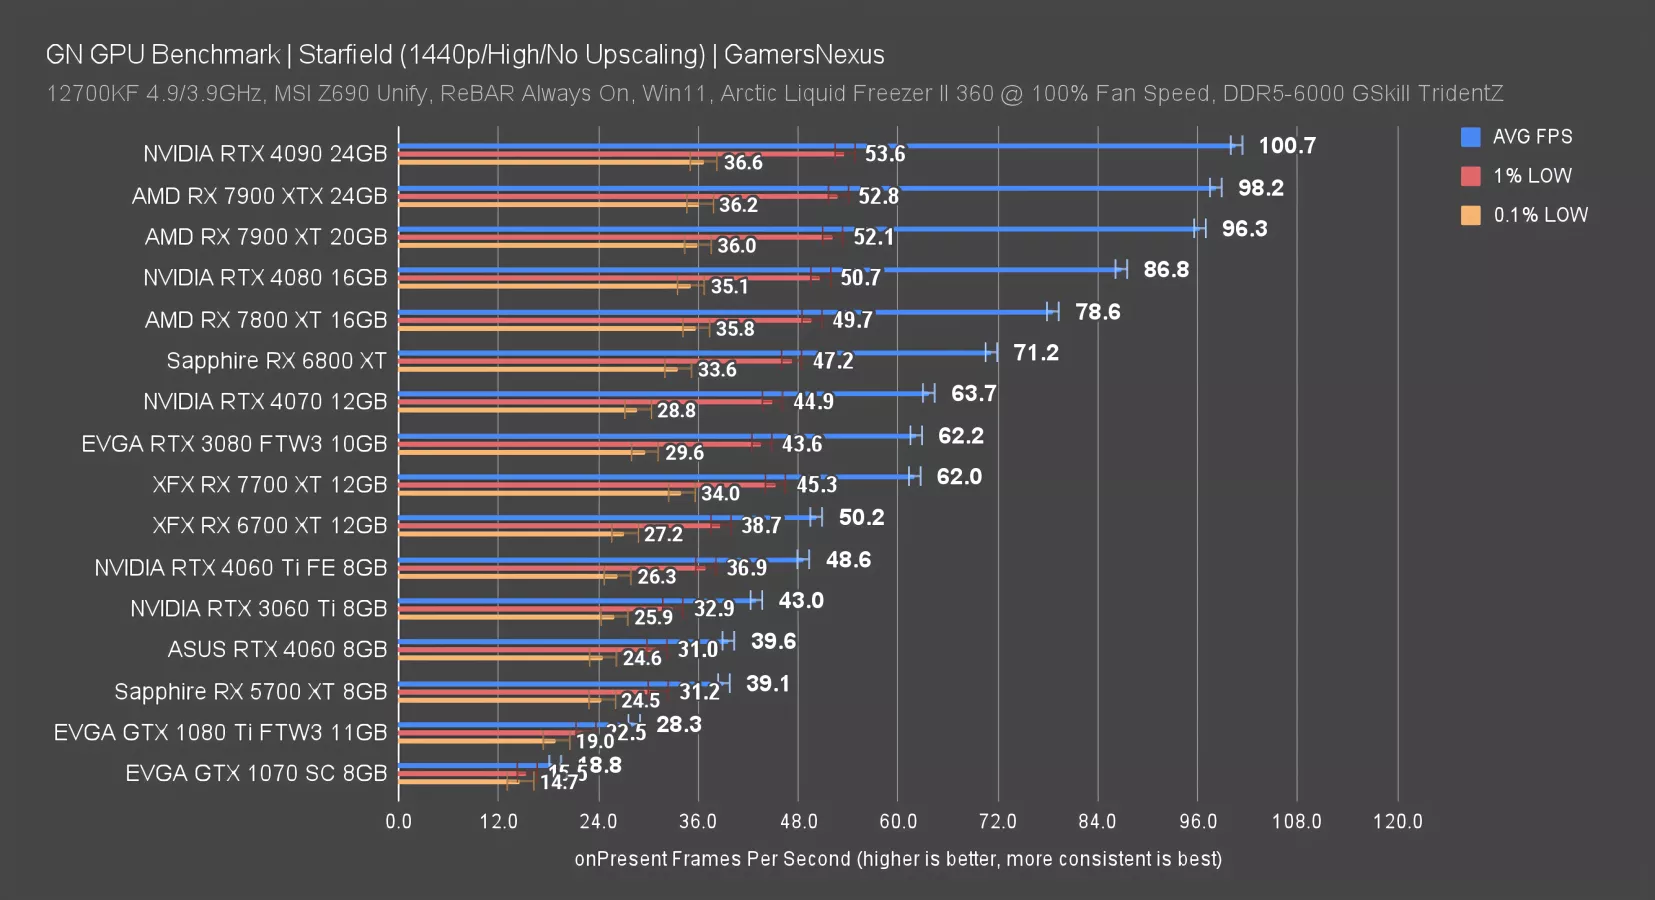
At 1440p/High, the RX 7700 XT roughly ties the RTX 3080 and outpaces the 6700 XT by 24%. The lead over the 4060 Ti is about 28%, similar to before. The 7800 XT’s extra $50 boost it by 27% over the 7700 XT. It’s more of a lead than at 4K. For other options, you could consider a used 6800 XT if willing to put-up with second-hand cards. In that case, it’d outperform the 7700 XT by about 15%.
Starfield - 1080p/High
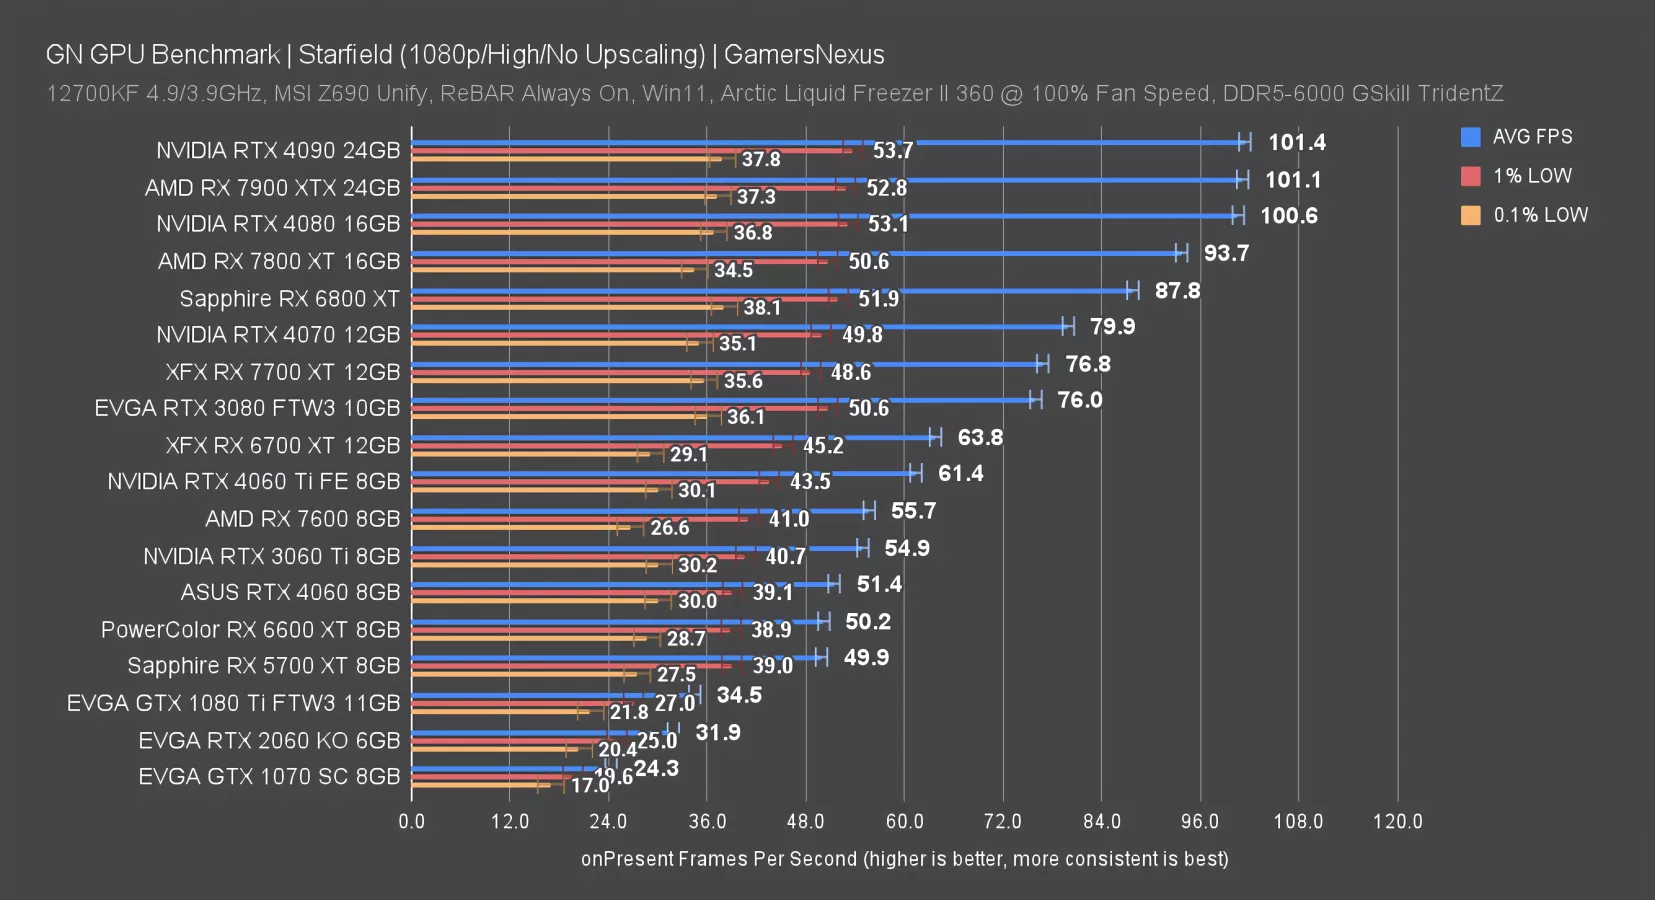
Finally, at 1080p/High, we start seeing a CPU bind at the top of the charts where the 7900 XTX, 4090, 4080, and to some extent (but a lesser one), the 7800 XT are all bouncing off of the CPU’s capabilities. The 7900 XT would be the same, hence why it wasn’t included. The 7700 XT is still far from that ceiling. The 7800 XT leads it by 22% despite occasionally hitting a ceiling. The 6800 XT is about 14% ahead of the 7700 XT. Generationally, AMD’s new card is about 20% ahead of the 6700 XT.
Dying Light 2 Benchmarks
Dying Light 2 - 4K
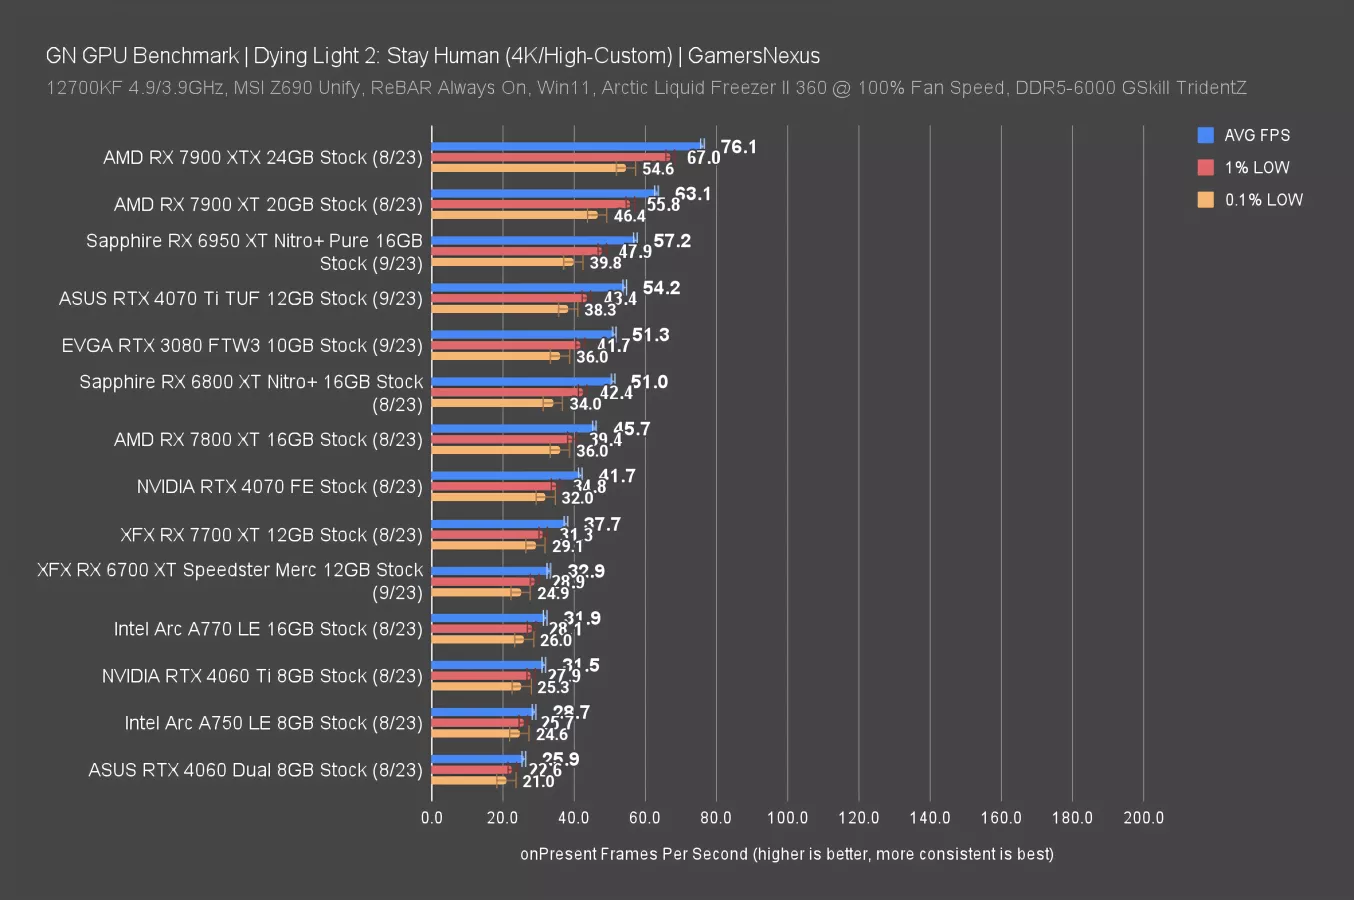
Dying Light 2 is new to our test suite, so the GPU list is more limited to what we could do between Starfield runs in the past two weeks. At 4K, the RX 7700 XT ran at about 38FPS AVG, allowing the RTX 4070 a lead of 11%. The 7800 XT had a lead of 21% over the 7700 XT. The 7700 XT improved by 15% over the 6700 XT, but the 7800 XT still manages to complicate the choice around the 7700 XT given its disproportionate improvement to price increase. The 4060 Ti is far enough down the stack to not be much of a consideration at this price range.
Dying Light 2 - 1440p
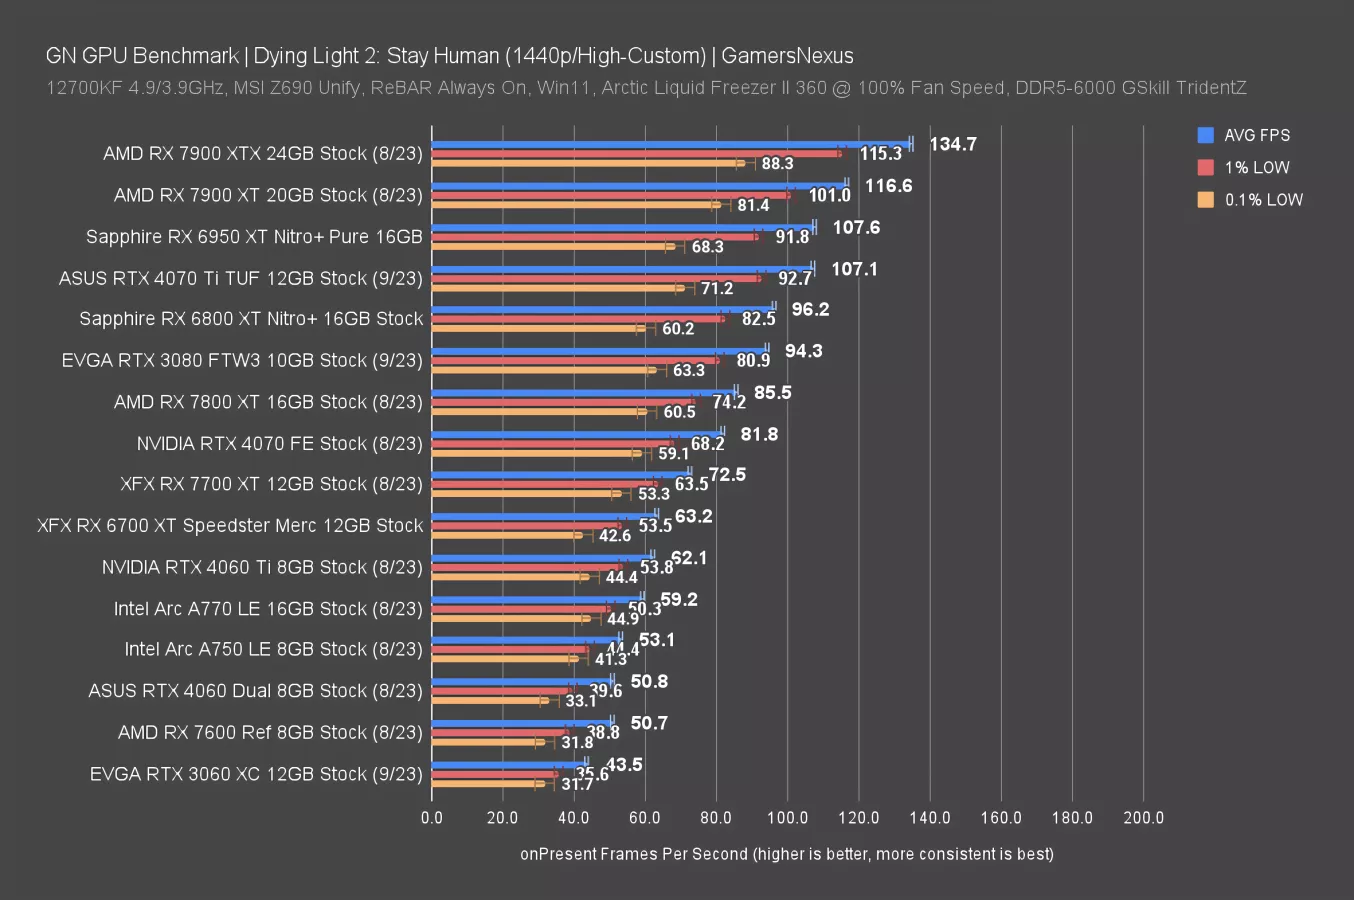
At 1440p, the 7800 XT’s lead drops to about 17-18%, down from 21%. As we’ve seen in the past, increasing the resolution can illustrate advantages of a GPU that emerge from higher CU counts or ROP counts.
The 4070’s lead also climbs, this time to about 13% from 11%. As for cheaper options, the improvement in the 7700 XT over the 6700 XT is 14%, or about the same against the 4060 Ti. Actually, Intel’s A770 is just below both of these. Intel still doesn’t have an Arc competitor in the upper ranks of GPU competition despite overall strengths in the more affordable market.
Dying Light 2 - 1080p
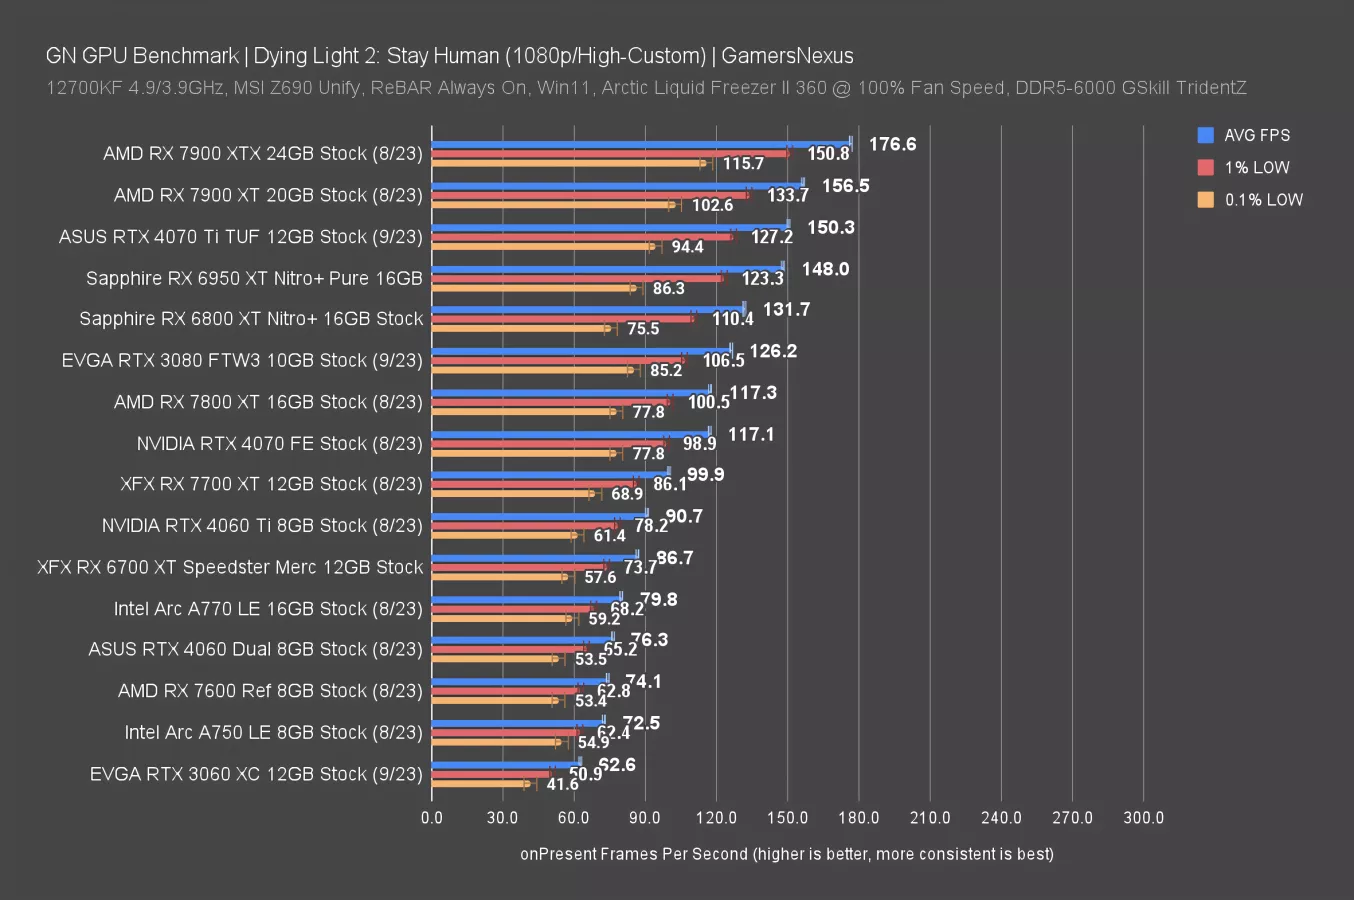
We’re still not bound by the CPU on the 7700 XT at 1080p. Here, the card ran at about 100FPS AVG, putting the 4070 17% ahead. The 4070’s lead is gaining as resolution decreases for this game, whereas the 7800 XT -- now at a similar lead of about 17% -- is seeing less significance as opposed to the 4K result.
Resident Evil 4 Benchmarks
Resident Evil 4 - 4K
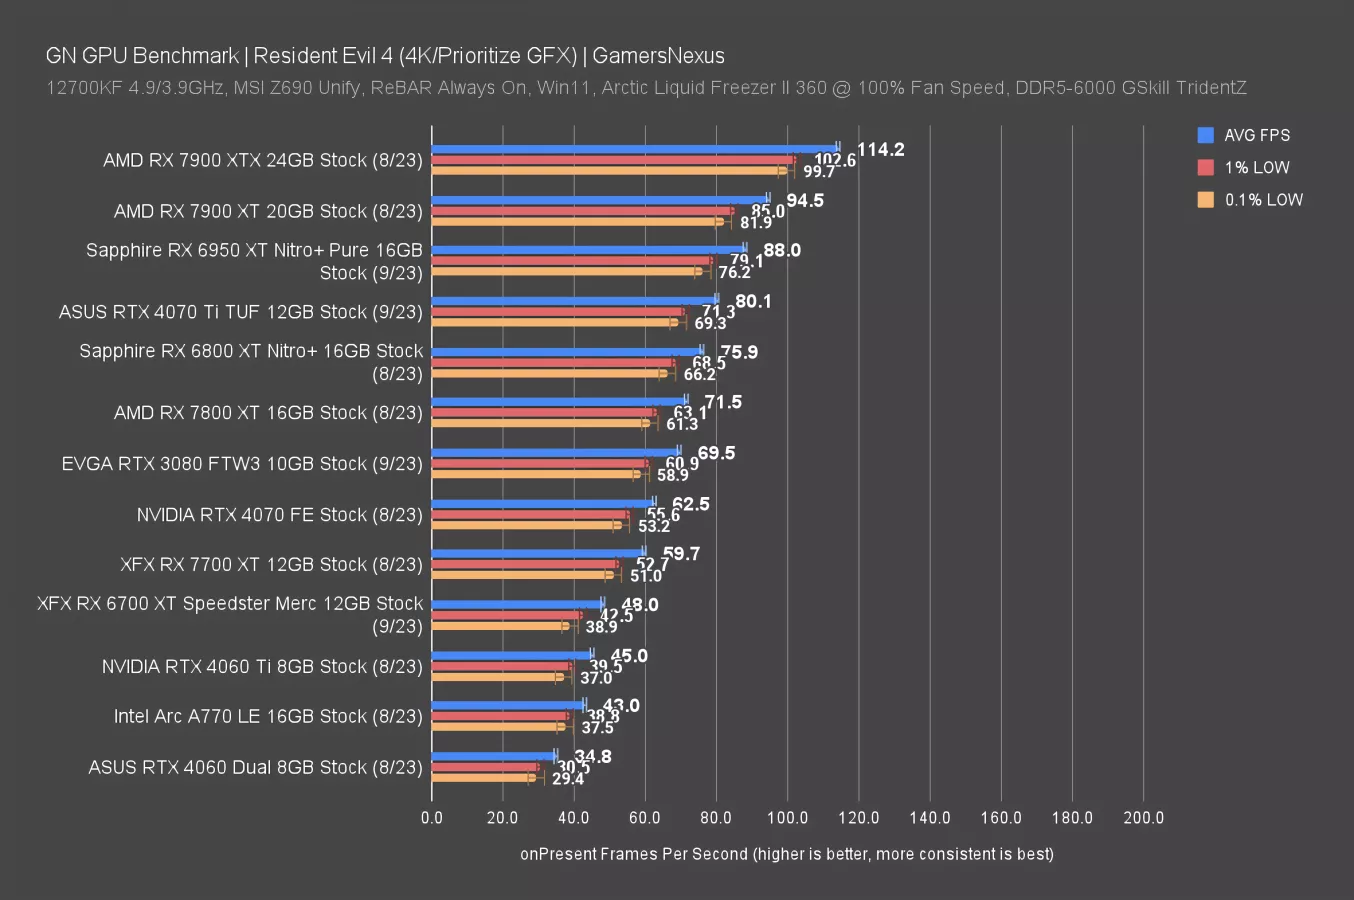
Up next, in Resident Evil 4 at 4K, the RX 7700 XT ran at about 60FPS AVG. That lands it just under the RTX 4070 at 63FPS AVG, allowing NVIDIA’s more expensive 4070 a lead of about 4.7% in rasterization here. The 6800 XT might be better value than either of the two new cards, depending on if you can still get it at around or under $500, as it manages to outperform the 7800 XT by 6% and the 7700 XT by 27%.
As for the 7800 XT, that’s ahead of the 7700 XT by 19.7%.
Resident Evil 4 - 1440p
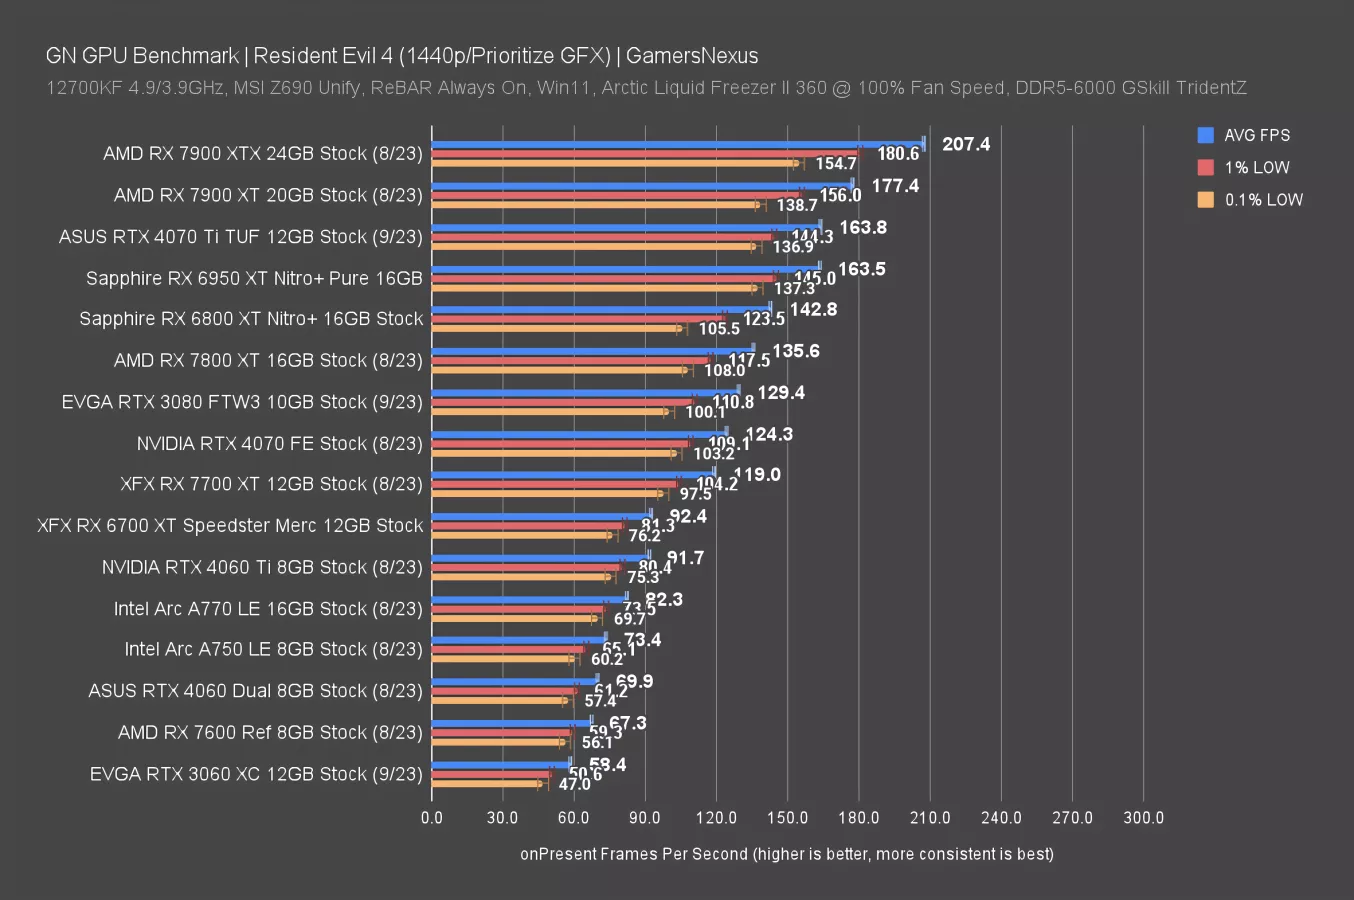
1440p has the 7700 XT at 119 FPS, the 7800 XT at 136 FPS, the 6800 XT at 143FPS, and the 4070 Ti at 164FPS. Respectively, that means these GPUs lead the 7700 XT by 14%, 20%, and 38%. Compared against the last generation, the 7700 XT is 30% ahead of the 6700 XT.
Resident Evil 4 - 1080p
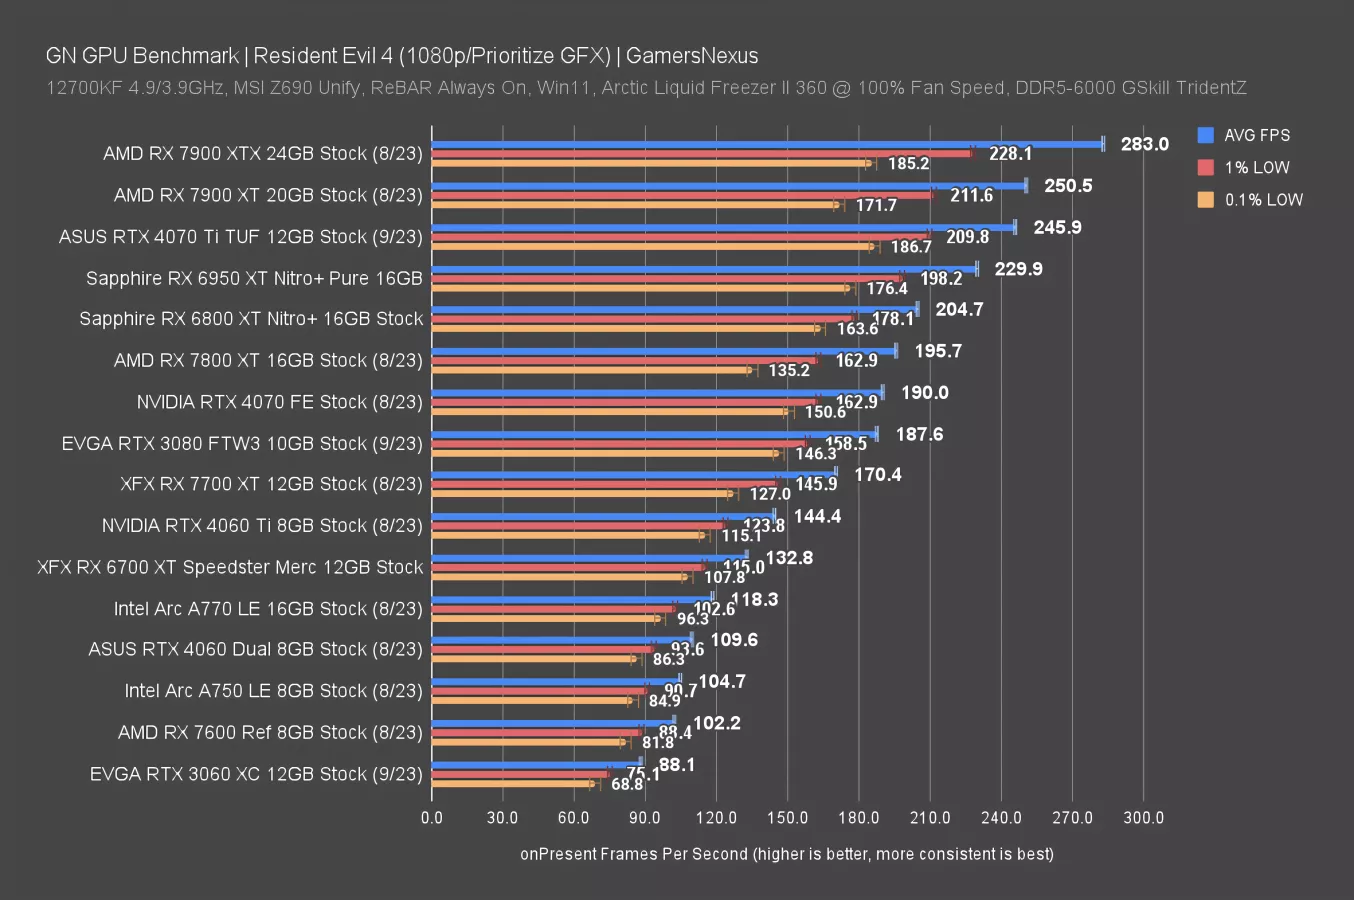
We won’t spend much time on 1080p. The 7800 XT led the 7700 XT by 15% here, with the rest of the GPUs scaling similarly to before.
Total War: Warhammer 3 Benchmarks
Total Warhammer 3 - 4K
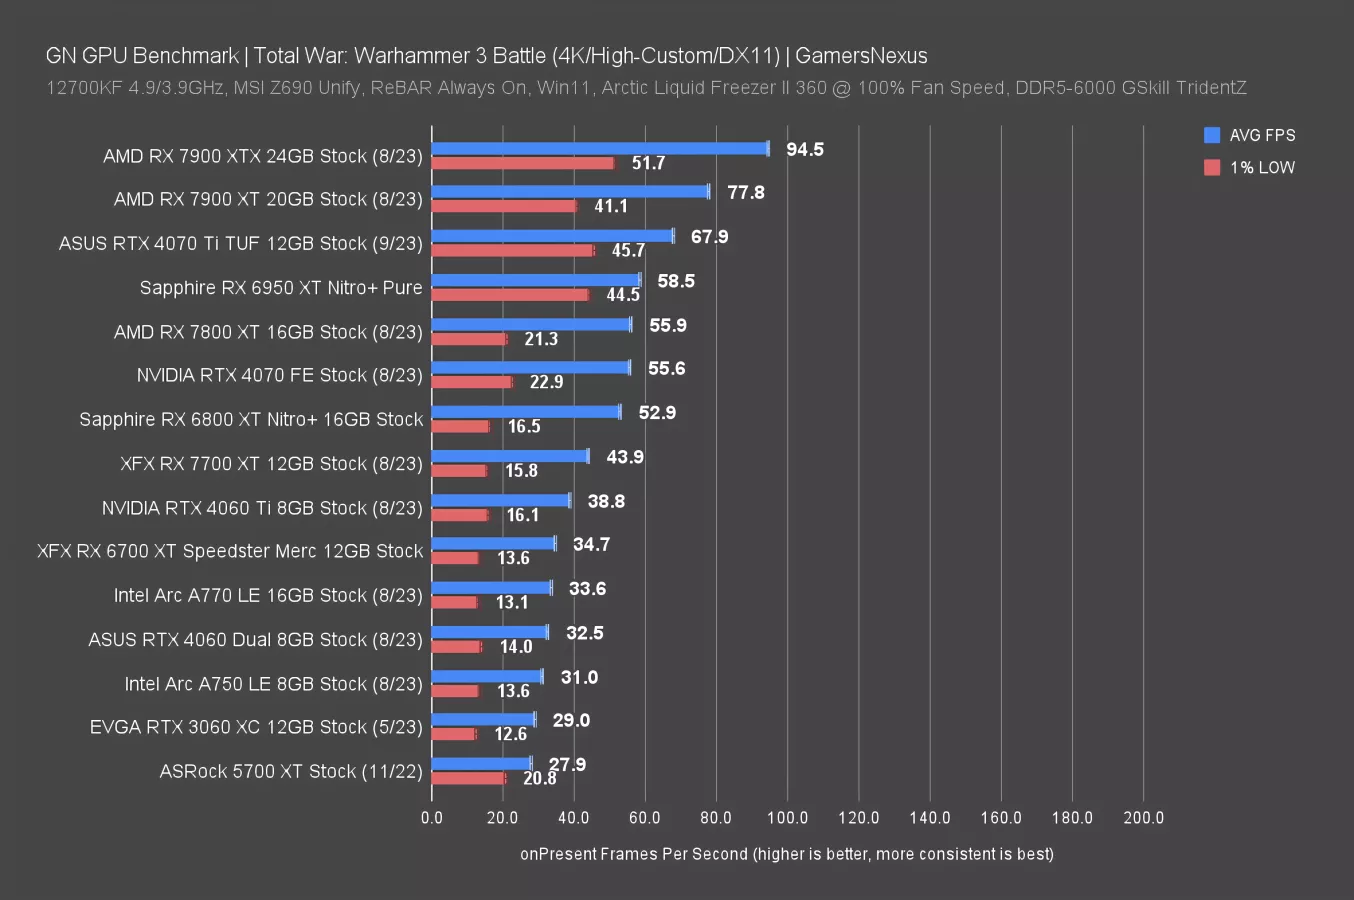
In Total Warhammer at 4K, the 7700 XT landed between the 6800 XT and 4060 Ti. It’s ahead of the 4060 Ti by about 13%, ahead of the 6700 XT generationally by about 27%, and ahead of the 4060 by 35% -- although pricing is a different story.
In the opposite direction, moving to a 7800 XT would push performance up by 27% in exchange for the extra $50. The 4070 would post about the same performance gain here, although for an extra $100 over the 7800 XT. AMD definitely positioned these two to force a hard choice.
Total Warhammer 3 - 1440p
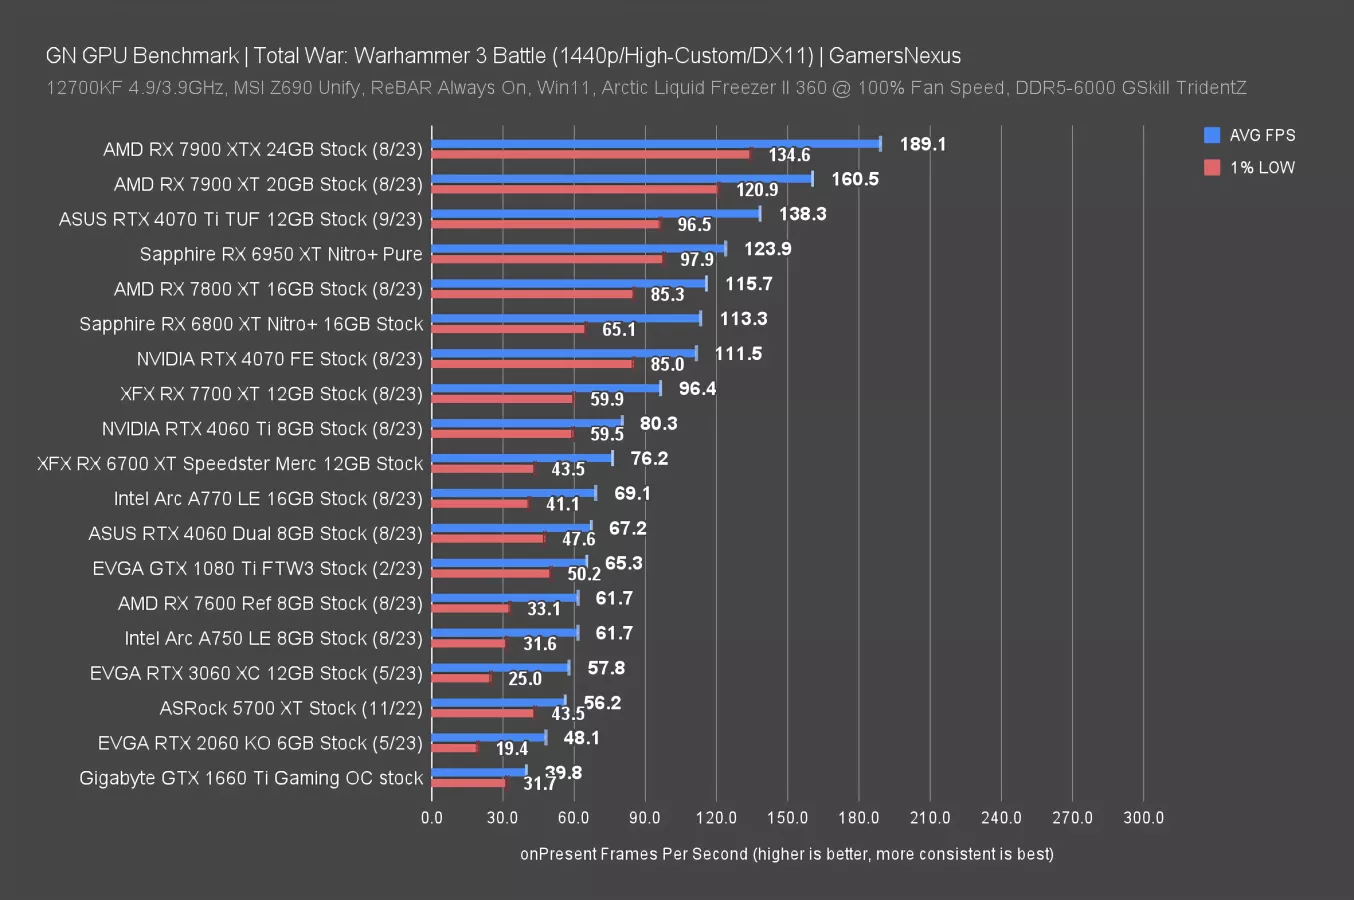
At 1440p, the RX 7700 XT ran at 96FPS AVG, allowing the 7800 XT to establish an advantage of 20%. That’s not as much as at 4K, so for at least this test, the 7800 XT has a disproportional benefit at the higher resolution.
Compared to other cards, the 7700 XT leads the 4060 Ti by 20% as well, with the lead over the last-gen 6700 XT at about 27%. Higher-end options could increase performance by 43% moving to the 4070 Ti and 66% at the 7900 XT level.
Total Warhammer 3 - 1080p
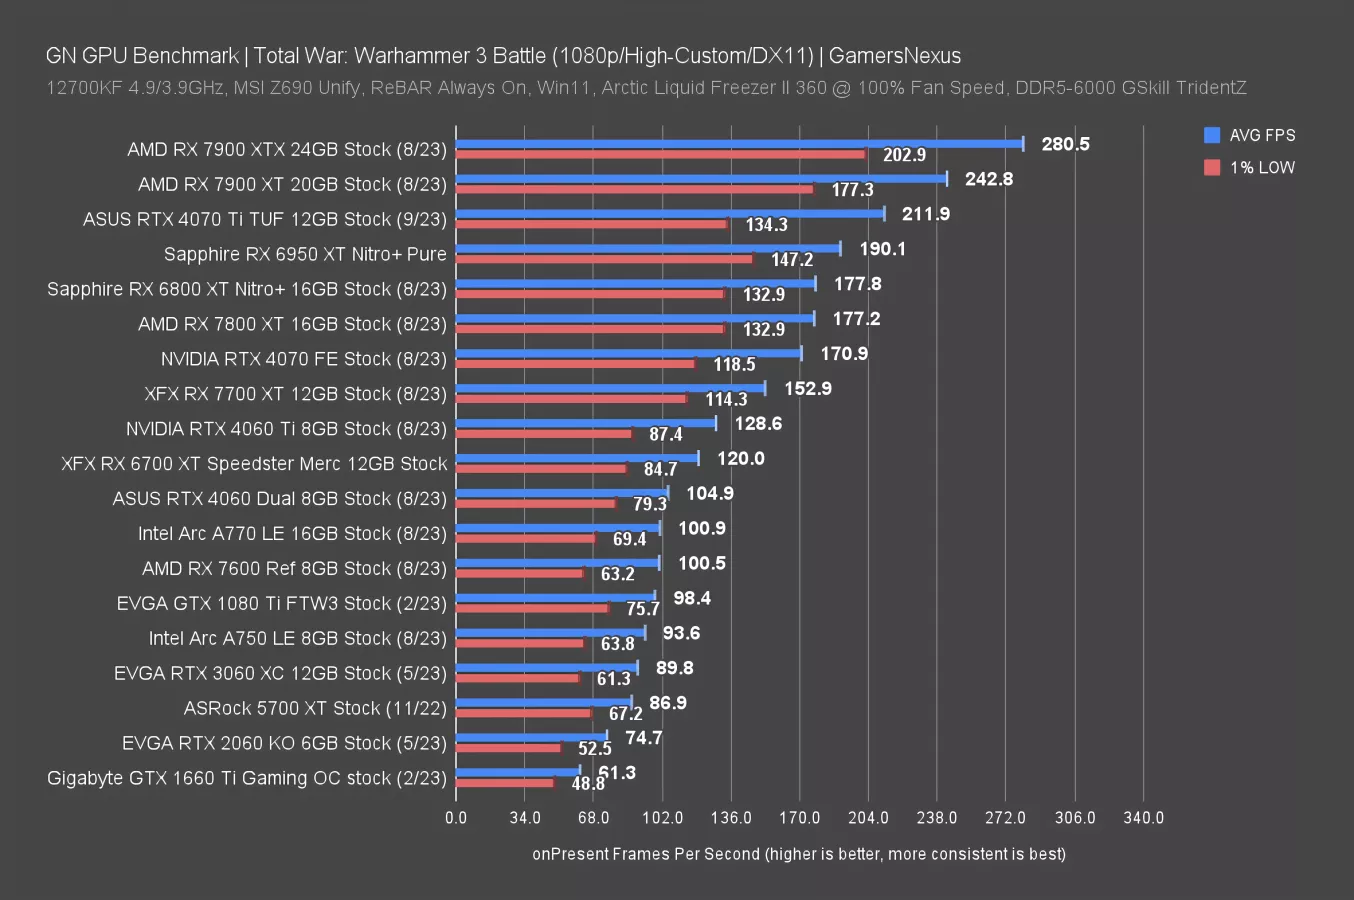
At 1080p for this game, we’re most interested in scaling against the 7800 XT. The higher-end option ran at 177 FPS AVG, leading the 7700 XT by 16%. That’s another reduction against what we saw at 4K and 1440p, so the lead diminishes and becomes less significant as resolution decreases. That’ll be important to keep in mind as we look at the rest of the tests.
For other comparisons, the scaling is more similar: The lead over the 6700 XT remains about 27%, with the lead over the 4060 Ti at about 18%. Not much has changed there.
Shadow of the Tomb Raider Benchmarks
Tomb Raider - 4K
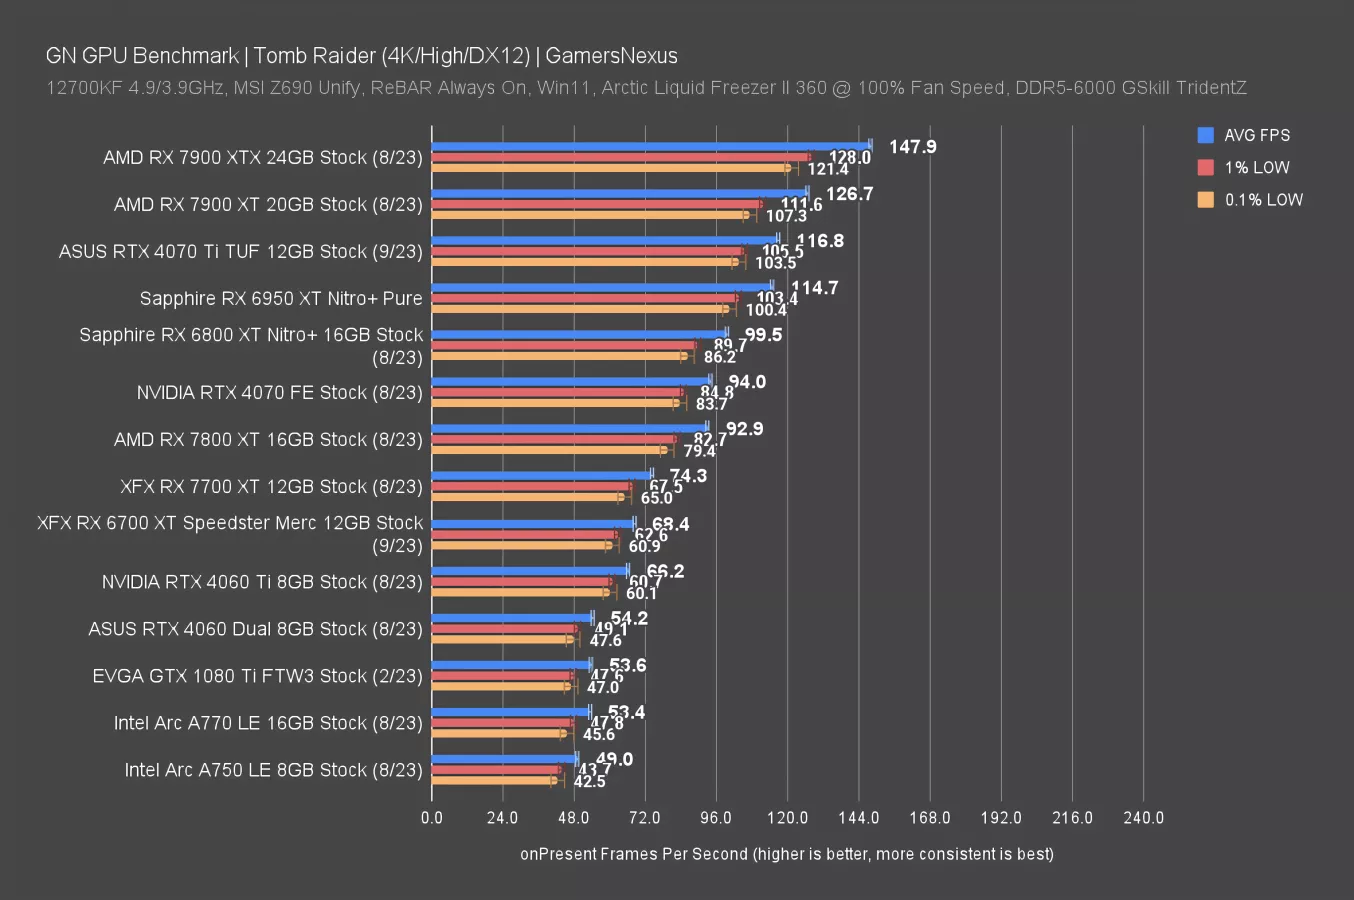
In Tomb Raider at 4K, the RX 7700 XT’s 74 FPS AVG has the 7800 XT 25% ahead. That’s pretty consistent with some of the previous games. Compared to the $400 4060 Ti 8GB, the lead is 12% by the 7700 XT, or 37% over the 4060 for 50% more money.
Tomb Raider - 1440p
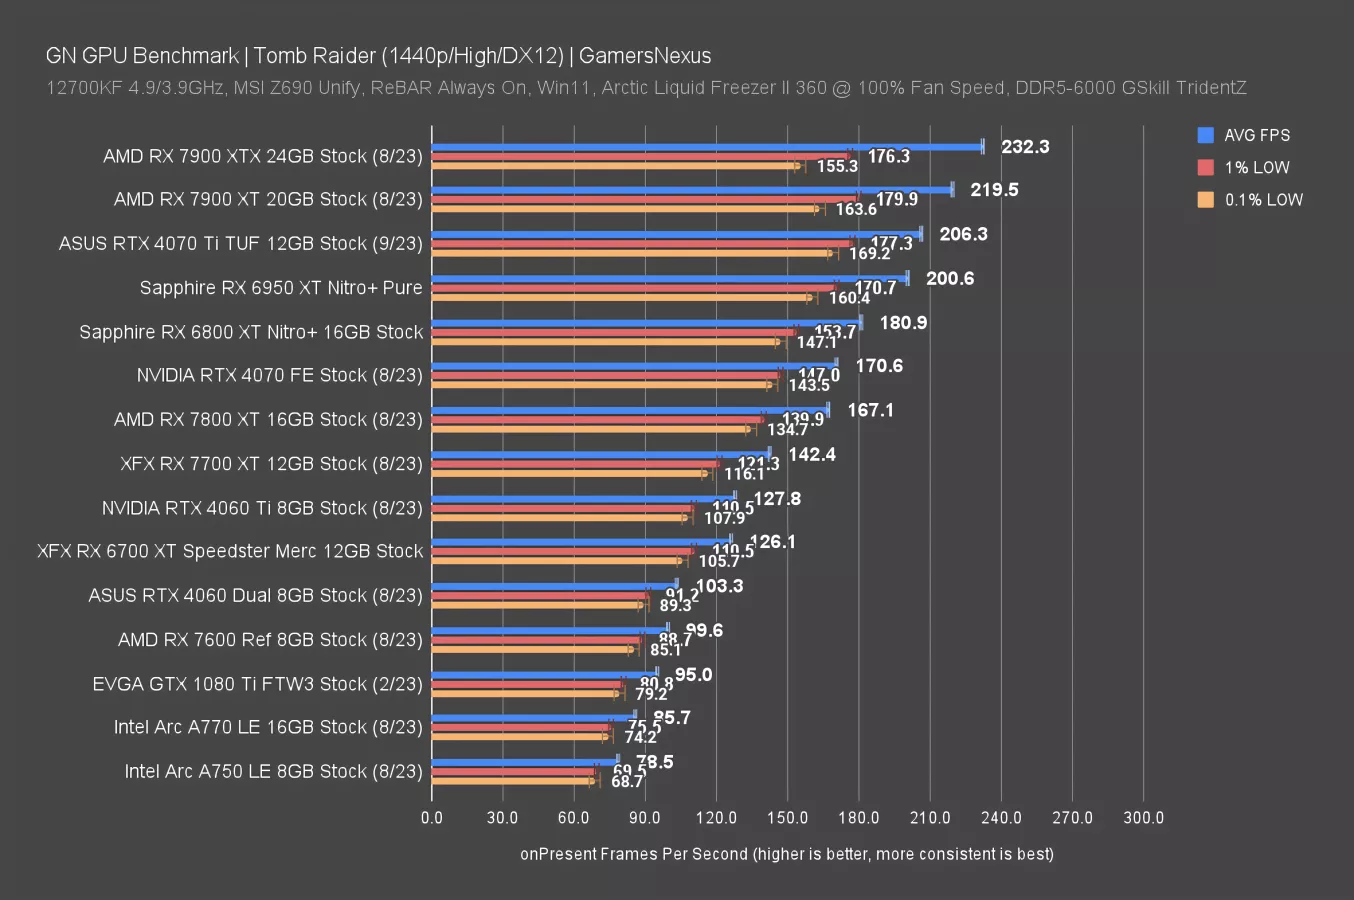
At 1440p, the 7800 XT leads the 7700 XT by 17%. That’s not nearly as good as we saw at 4K and also matches some of the previous scaling reduction as resolution falls. This is one of the more interesting stories emerging from this particular review -- the 7800 XT is often disproportionately more interesting as an alternative as your interest in higher resolution gaming increases. As for other comparisons, the 7700 XT leads the 4060 Ti by just 11% here. The lead over the last-gen 6700 XT was 13%.
Tomb Raider - 1080p
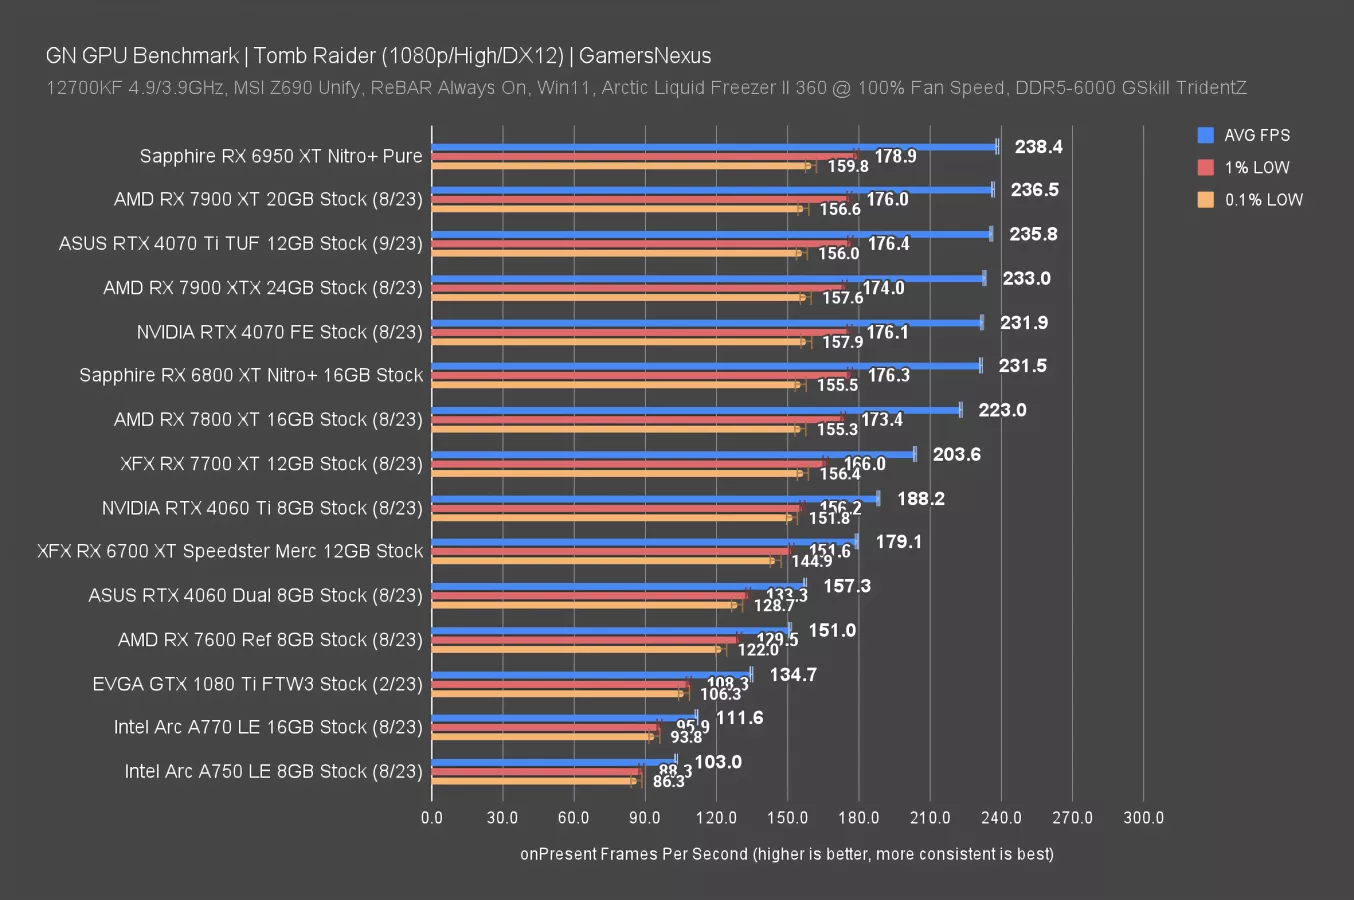
At 1080p, the 7800 XT only leads the 7700 XT by 10%, making it appear much less worth the $50. Part of that is because we’re approaching a CPU bind around 240FPS AVG, so some spikes are truncated, but part of it is because of the already-shown reduction in advantage alongside reduction in resolution.
Horizon Zero Dawn Benchmarks
Horizon Zero Dawn - 4K
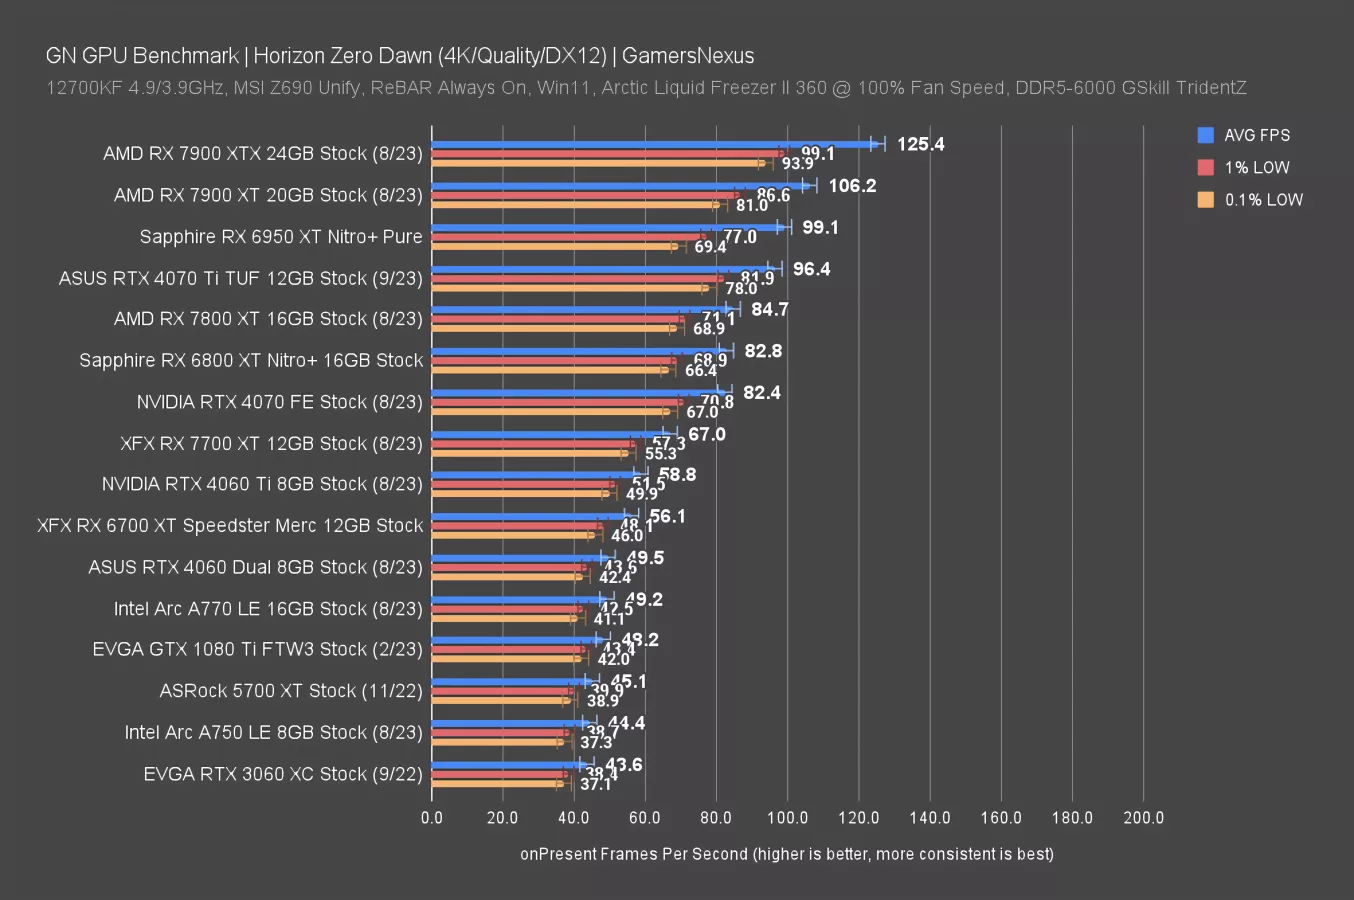
In Horizon Zero Dawn, the 7800 XT is back to its 26% lead when at 4K, at 85FPS AVG to 67FPS AVG. Low are proportional. The 7700 XT is capable of 4K gaming in some scenarios, like this one, and as for its generational improvement, we saw a 19% improvement over the 6700 XT. The 4060 Ti sticks close to its prior gap, where the 7700 XT holds a 14% lead.
Horizon Zero Dawn - 1440p
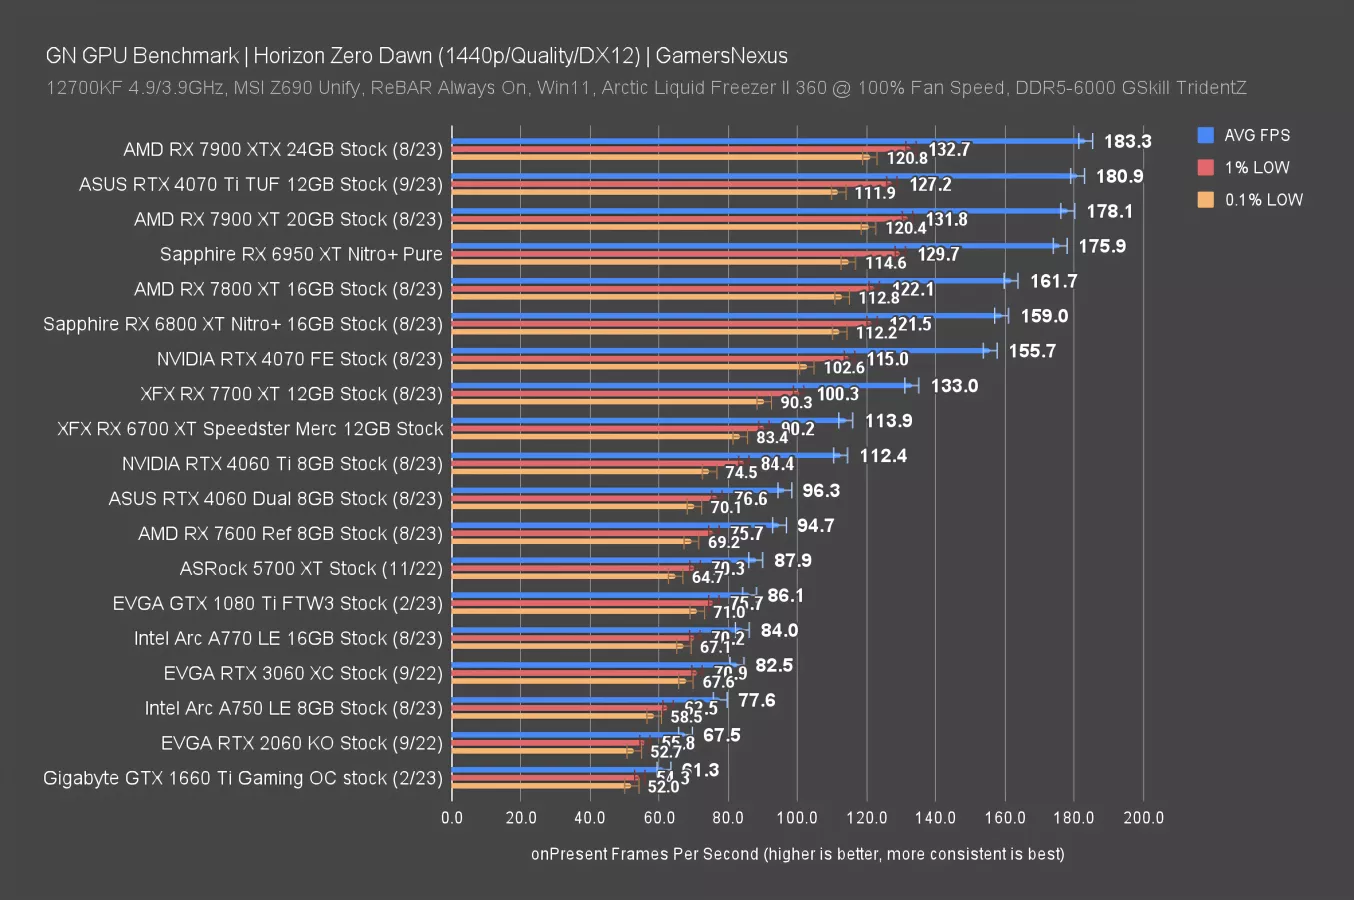
At 1440p, the 7700 XT runs at 133FPS AVG against the 7800 XT’s 162FPS AVG, establishing a lead for the 7800 XT at 22%. That’s a reduction of about 4 percentage points compared to the 4K test, so the pattern remains.
Final Fantasy XIV (FFXIV) Benchmarks
FFXIV - 4K
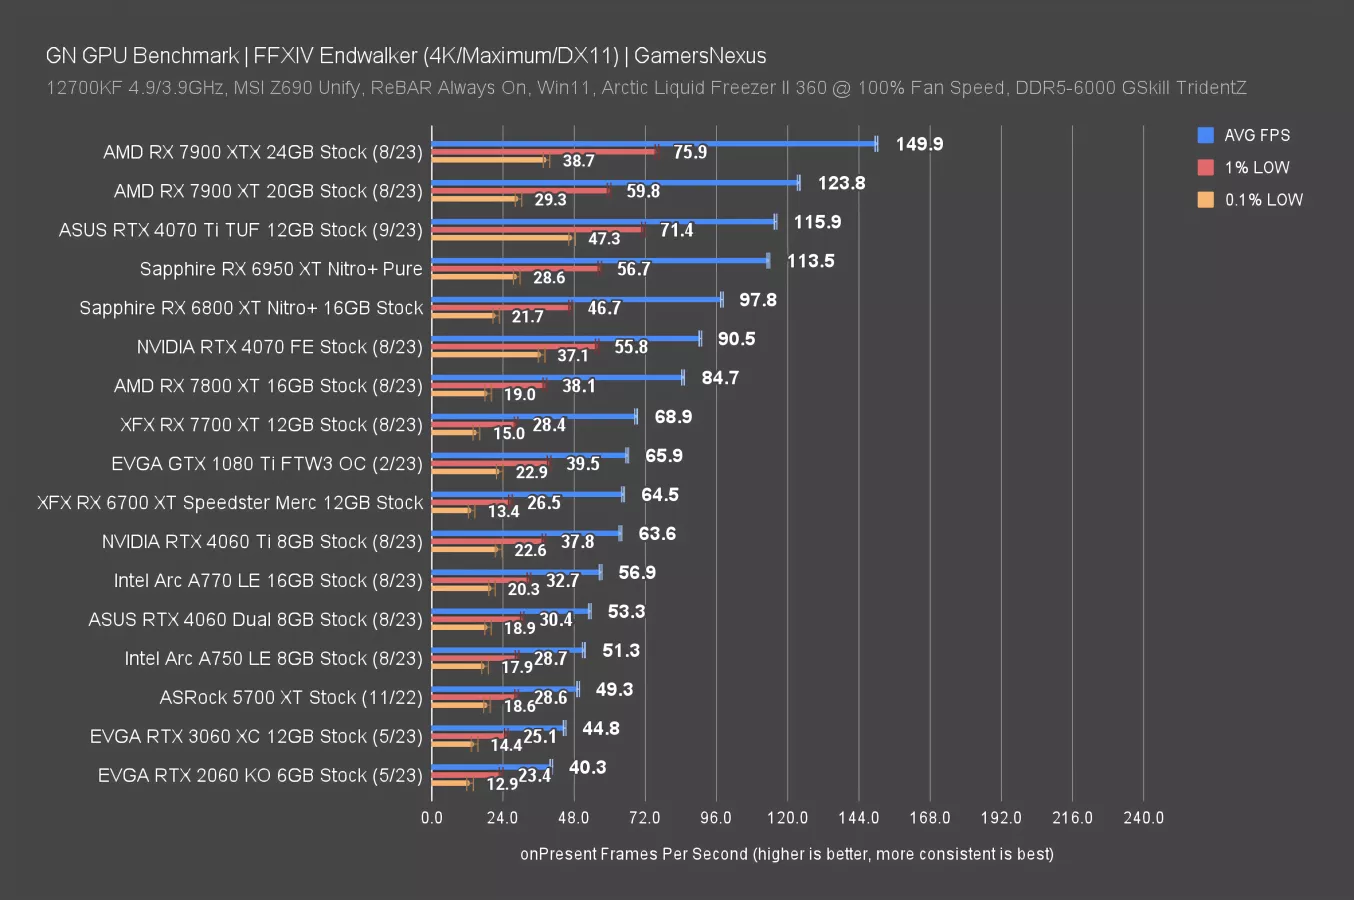
In Final Fantasy 14 at 4K, the 7700 XT runs at 68.9FPS AVG, putting it close to the old 1080 Ti and 7% ahead of the 6700 XT, or similar ahead of the 4060 Ti. The 7800 XT leads the 7700 XT by 23% here, similar to many of the other games now.
Real-Time Ray-Tracing Benchmarks
Ray Tracing - F1 2022 4K
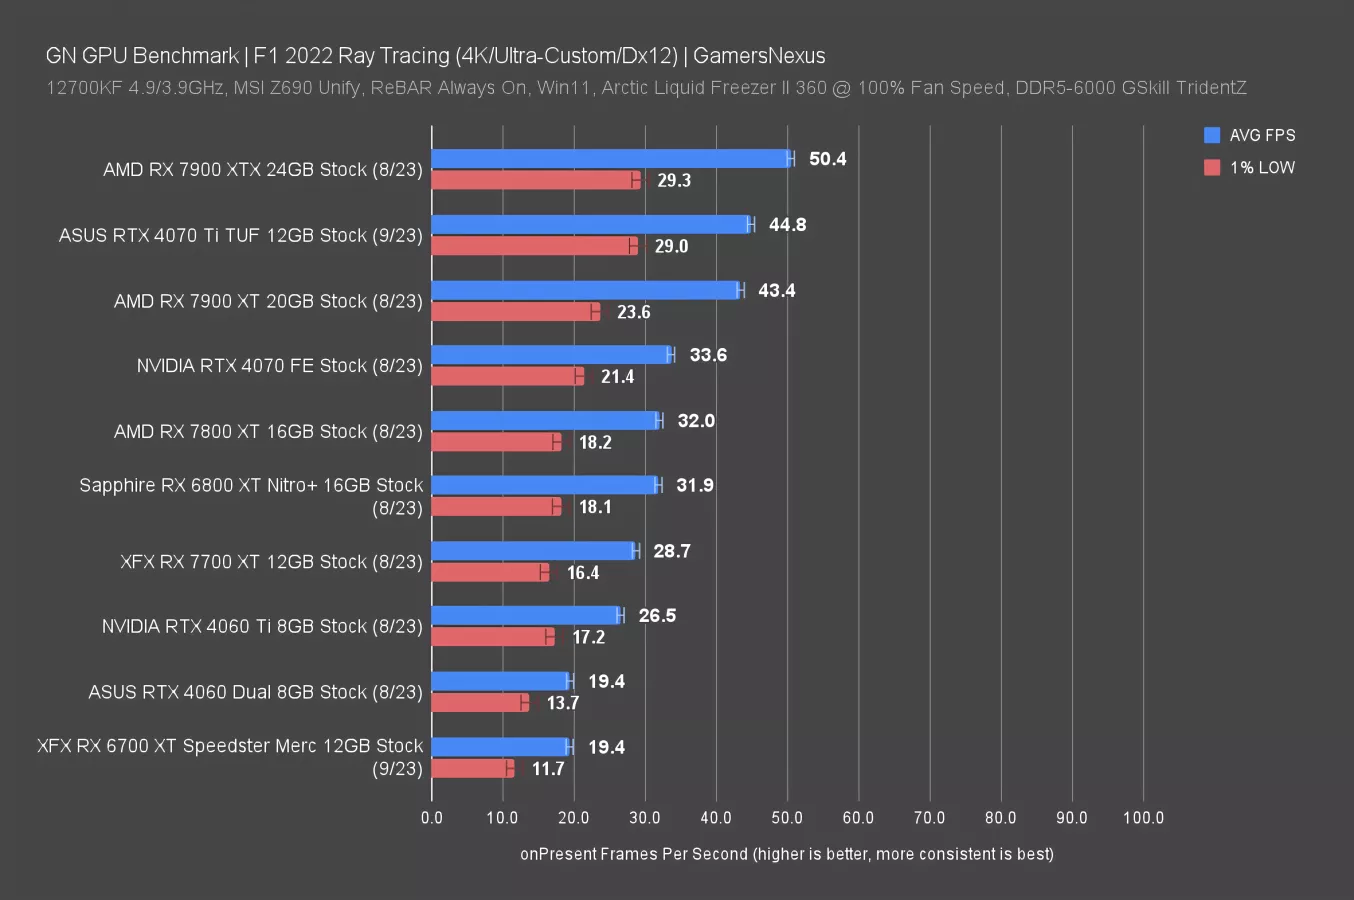
Ray traced testing is up next.
Starting with F1 22 with RT on, we found the 7700 XT to run at 29 FPS AVG without using any type of upscaling. Purely in the comparative, that has both the 6800 XT and 7800 XT about 11% ahead. The 4070 is now 17% ahead, so as usual, we see NVIDIA showing some more relative capability in its RT performance. The same shows up for the 4060 Ti, which closes the gap to 8% here. Let’s move to a more playable resolution.
Ray Tracing - F1 2022 1440p
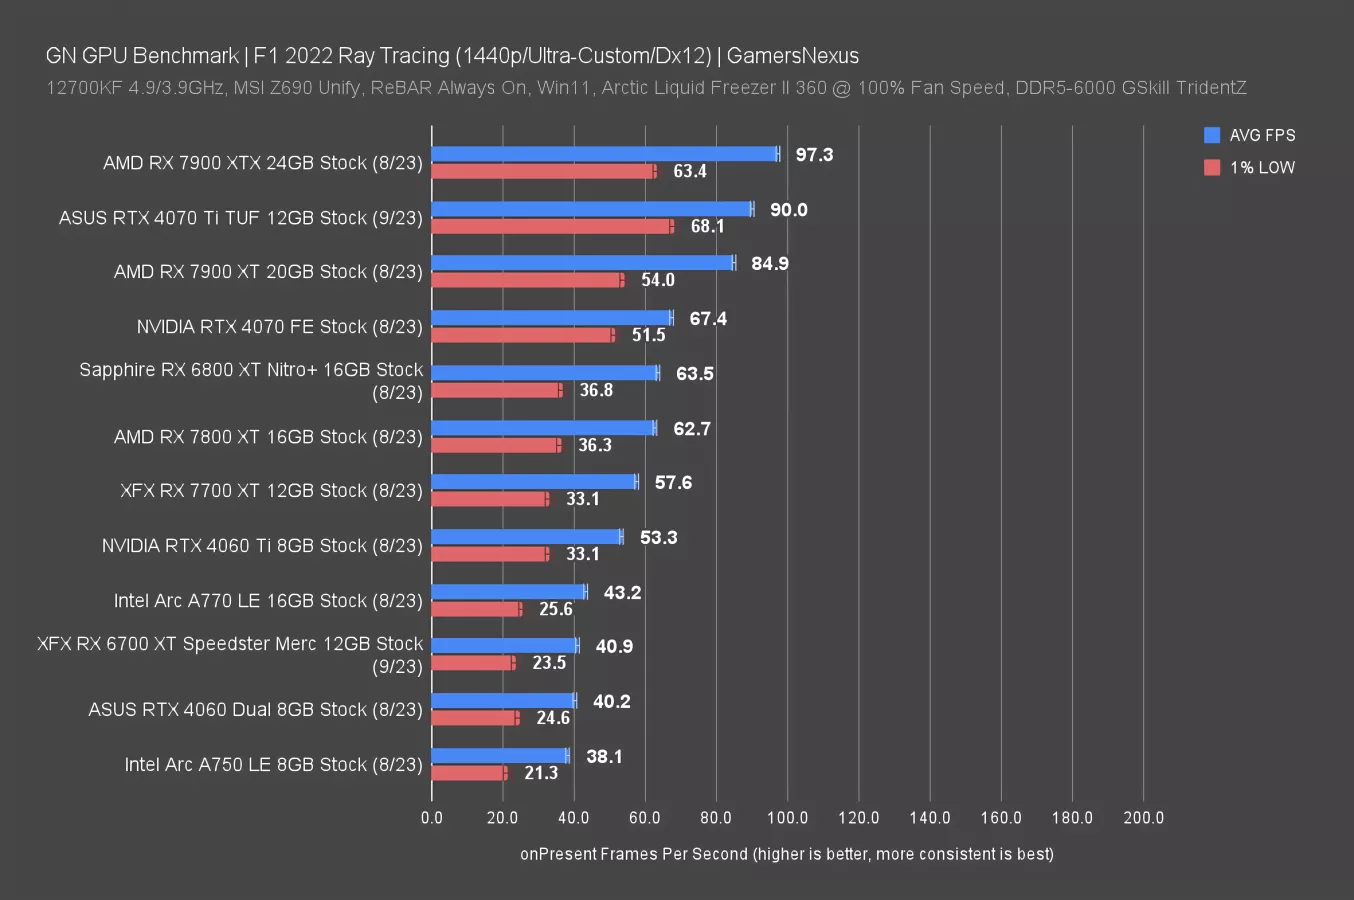
At 1440p, the 7700 XT runs at 57.6 FPS AVG. It’s still 8% ahead of the 4060 Ti, with the 7800 XT 9% ahead and 4070 still 17% ahead.
Ray Tracing - Tomb Raider 4K
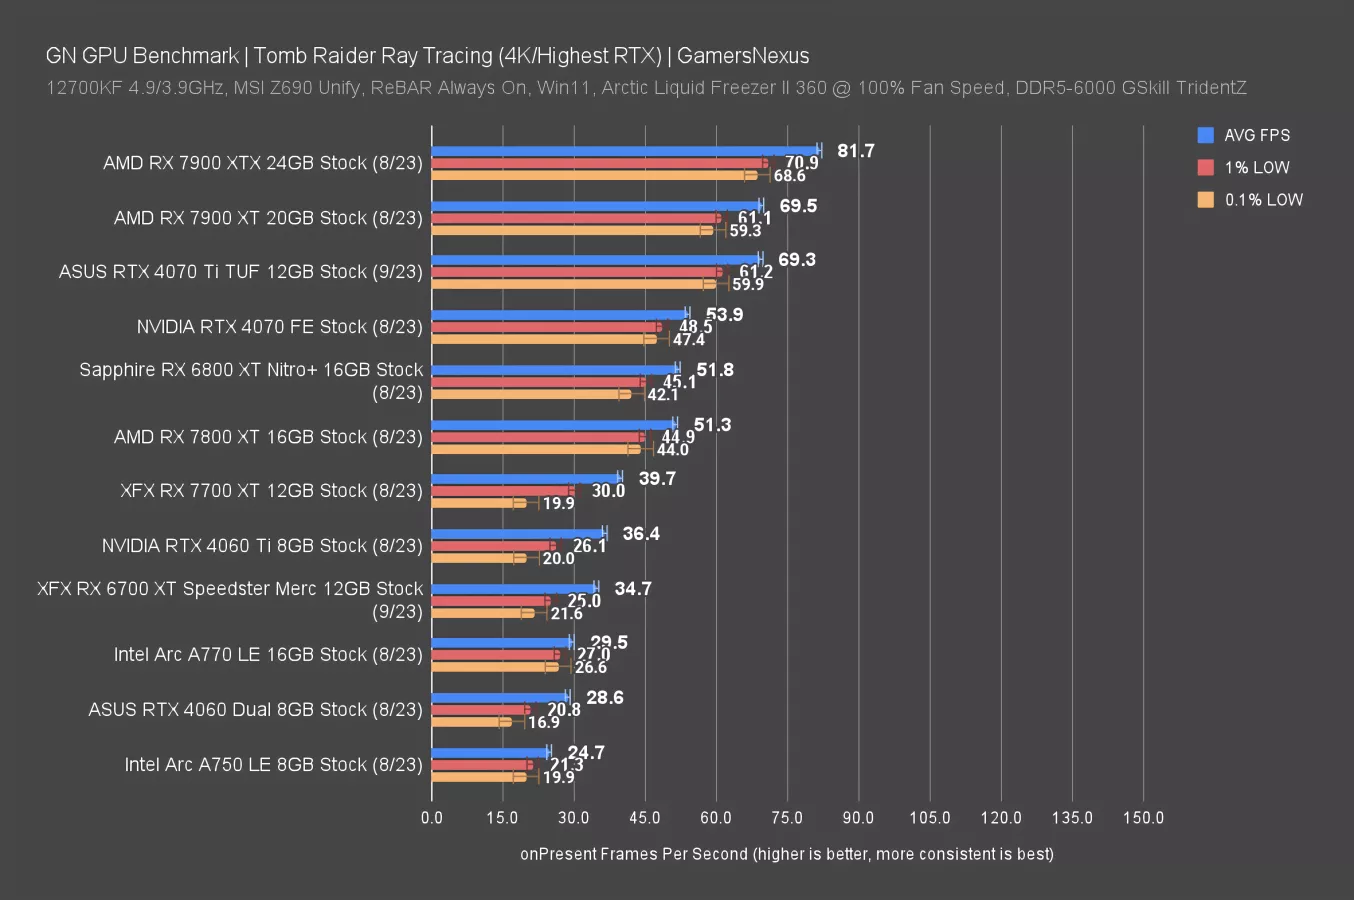
In Tomb Raider at 4K and with ray tracing -- so these results aren’t comparable to earlier -- the RX 7700 XT ran at 40FPS AVG. All we really care about is the percent scaling. The 7800 XT was 29% ahead here, with the 6800 XT about the same. The RTX 4070 expanded its lead to 36% in this title, with the 4060 Ti not too distant.
Ray Tracing - Tomb Raider 1440p
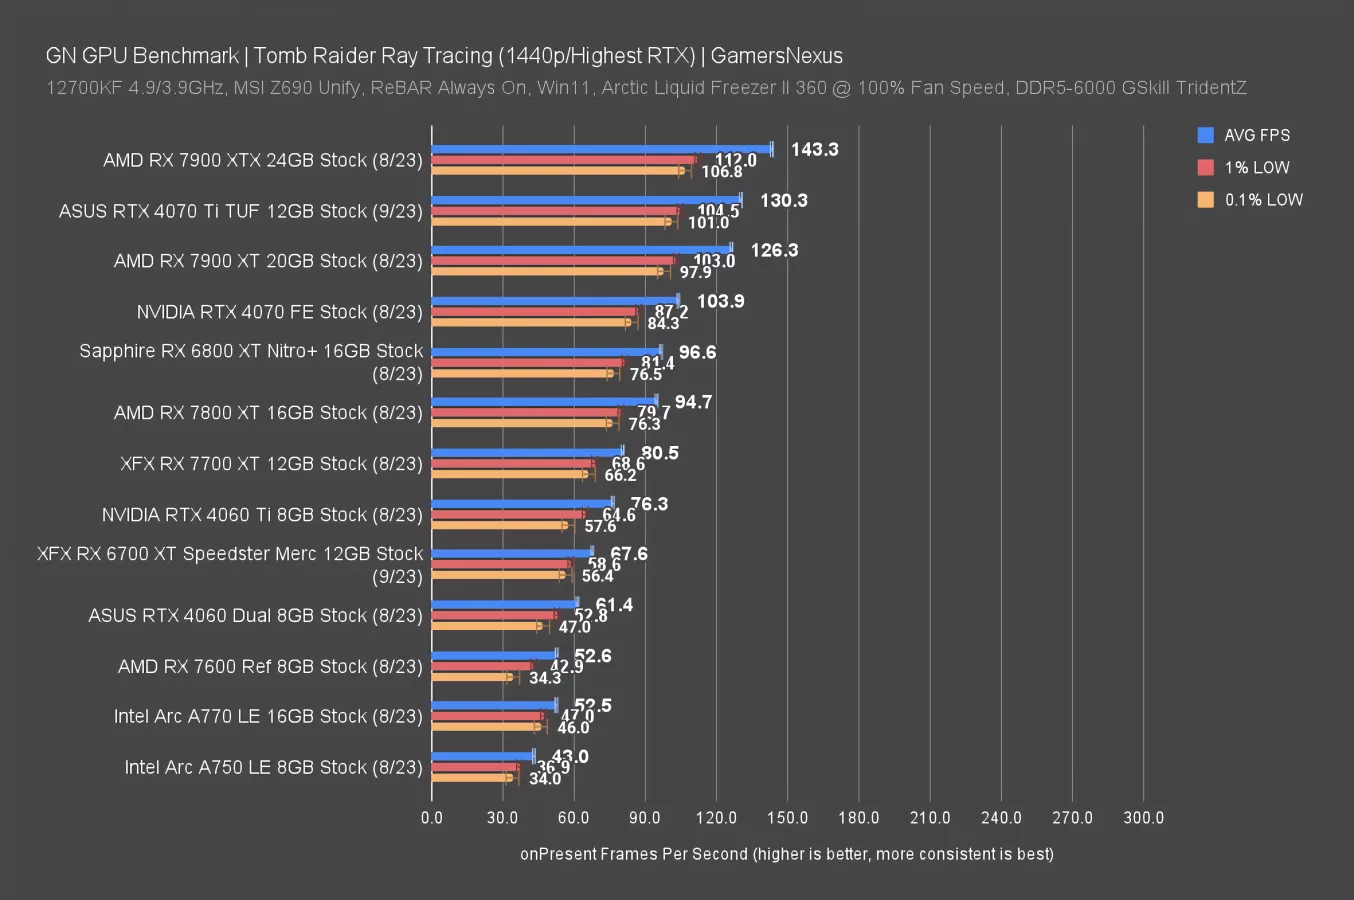
At 1440p, the 7700 XT moved to 81FPS AVG, reducing the 7800 XT’s lead to 18% and the 4070’s to 29%.
GPU Power Consumption Comparison
Power Consumption
Power consumption is up now. The RX 7700 XT that we have consumes more power than our RX 7800 XT. That’s a difference of model: The 7800 XT is a reference model from AMD, whereas our 7700 XT is an XFX unit with higher clocks and an increased power target. The 7700 XT ends up at 268W, or 308W when overclocked. That’s considerably less efficient than the 7800 XT reference model, given the lower performance in exchange for more power.
Conclusion
We talked in our 7800 XT review about our thoughts regarding competing options and last-gen options, so once again, we’re going to focus this particular conclusion just on the 7700 XT vs. the 7800 XT and 6800 XT.
We have some new charts. In the 7800 XT review, we showed a few % improvement charts that summarized the AVG FPS uplift from Card A to Card B. Percentage math can be unintentionally misleading if it goes both directions -- positive and negative -- so we try to present the cards in a way where it’s generally showing a positive uplift rather than mixing and matching. That said, as you approach 0 difference, the differences in the calculation become irrelevant.
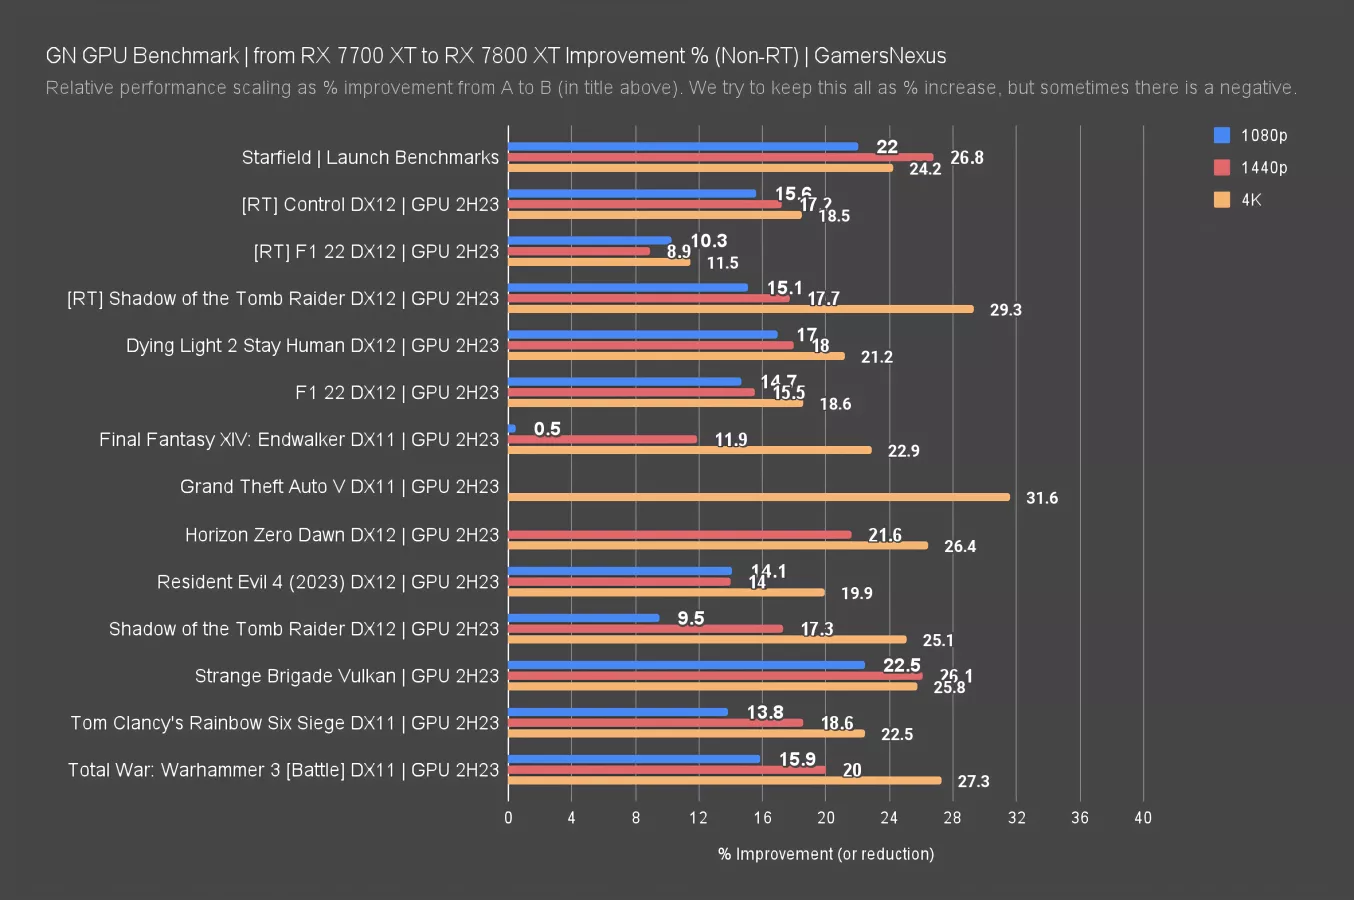
Generally speaking, moving to the 7800 XT from the 7700 XT would boost you by 20-30% at 4K, or 10-20% at 1080p, +/- a bit. Remember that CPU-bound scenarios, like Final Fantasy at 1080p, will show no difference. That’s not because there isn’t one, but because that scenario is limited by other components and can’t show the differences between the cards.
$500 is about 11% more money than $450, if you want to look at it that way, and so gaining in the 20s-30% more performance seems like, in a vacuum of these 2 cards, a good trade. If you can afford the $50 extra, we do think it’s better value to step up to the 7800 XT. What’s even better value though is stepping up to the 6800 XT, which is currently about the same price.
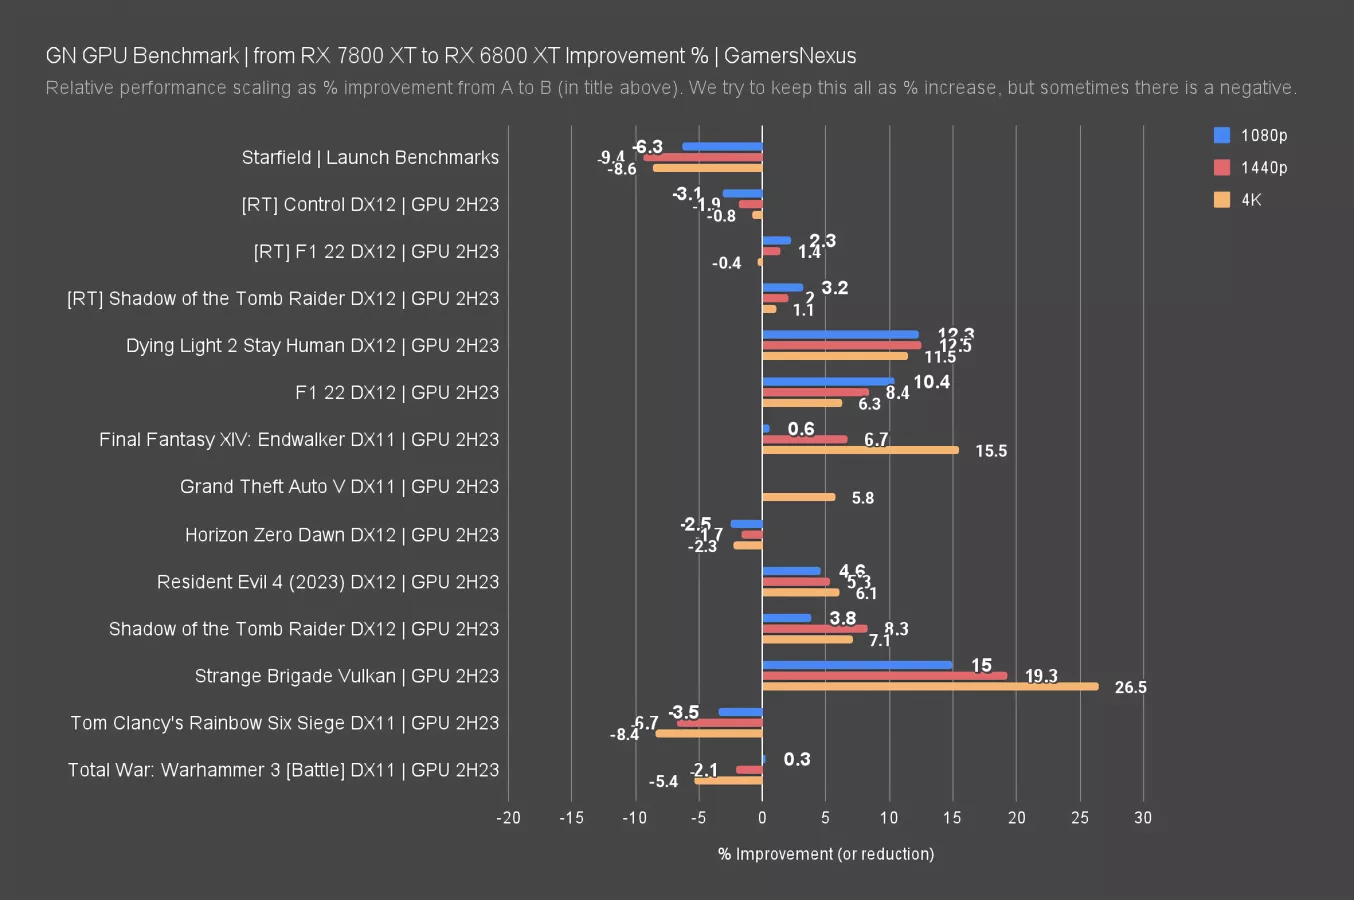
This is our 7800 XT to 6800 XT summary chart from the last review. In general, the 6800 XT is a better card when at the same price or similar. In this case, the jump from the 7700 XT to the 6800 XT would be even larger. You get more CUs for it too, which helps in some applications and some games.
AMD has a history of launching cards like this that don’t make a ton of sense immediately with close-by options also from AMD, but what we’ve noticed is that AMD tends to cut prices fairly early. We wouldn’t be surprised to see the 7700 XT and 7800 XT differentiate by closer to $100 as things settle and age, and it’s possible that the value of the 7700 XT climbs if that happens. Past behavior doesn’t indicate the future, but for these massive companies, it’s normally a good tool to estimate it.
What is clear is that, as we said in the 7800 XT review, the 4070 and 4060 Ti really just look bad here. The 4060 Ti in particular is an impressive abomination of bullshit at 16GB for $500 MSRP, and the fact that it’s already been cut in price in some places helps highlight that.
But strictly speaking to the 7700 XT, we’d say go up a step if you can afford it. It’s an upsell, and that’s a classic trick -- but it seems to make sense. We think the 7700 XT will make more sense later as prices diverge.