We’ve received a ton of positive feedback on our i5-2500K revisit, and we’ve received a similar amount of questions about including overclocked i7-2600K numbers in our benchmark charts. The solution is obvious: a full 2600K revisit using our modern benchmark course. As demonstrated with the 2500K, old K-SKU Sandy Bridge CPUs had impressive overclocking capacity--partly thanks to a better thermal solution than what Intel offers today--but the stock i7-2600K regularly outperformed our 4.5GHz 2500K in some tests. Synthetic benchmarks and games like Watch Dogs 2, both of which take advantage of high thread counts, are included in those tests showing favor to the 2600K.1
Although we ended the 2500K review with the conclusion that now is a good time to start thinking about an upgrade, i7 CPUs are considered as more future-proof. Today, we’re testing that conception to see how it holds up to 2017’s test suite. With Ryzen 7 now fully released, considering 2600K owners are likely looking (price-wise) at a 7700K ($345) or 1700 ($330), it makes sense to revisit SNB one more time.
Note: For anyone who saw our recent Ryzen Revisit coverage, you know that there are some fairly important changes to Total War: Warhammer and Battlefield 1 that impacted Ryzen, and could also impact Intel. We have not fully retested our suite with these changes yet, and this content was written prior to the Ryzen revisit. Still, we’re including some updated numbers in here – but it’s not really the focus of the content, we’re more interested now in seeing how the i7-2600K performs in today’s games, especially with an overclock.
Recapping the 2600K
It’s been a while. As a refresher, the Intel i7-2600K was Sandy Bridge’s 32nm flagship for the non-Extreme chips, utilizing the same 4C/8T core layout that Intel uses today. The 2600K shipped with a stock frequency of 3.4GHz, boosting up to 3.8GHz using Turbo Boost. Of interest, the chip was a particularly good overclocker, partially aided by the fact that many SNB chips were soldered to the IHS (today, Intel defers to TIM). Also of interest, some titles showed a slight performance hit with hyperthreading -- often 1-2% -- as a result of additional overhead and of the games not quite leveraging what they were working with. Today’s KBL CPUs, by way of comparison, show a major deficit with hyperthreading disabled.
The industry has shifted its testing focus since the 2600K launched. In 2011, the launch year of the 2600K, frametime testing was not yet ubiquitous. It was getting there -- Scott Wasson would launch his Inside the Second article in September, 2011 -- but the launch of Sandy Bridge would not be accompanied by widespread analysis of frametimes. Averages, minimums, and maximums still ruled most testing. Today, with new tools and with the industry’s renewed focus on other metrics outside of averages, the 2600K revisit stands to provide insight to an aging architecture.
CPU Testing Methodology
CPU Bench Updates (since the 2500K revisit)
We’ve added all three Ryzen R7 chips, Kaby Lake CPUs including the i3-7350K, and the FX-8370 to our charts since the 2500K revisit. We’ll add R5 chips when review embargo lifts and, at some point, we’ll inevitably have to update our CPU test suite and rerun every test. For now, we’re sticking with the current test methods and software until the R5 review cycle goes through, at which point we’ll look into new games and test cases.
We won’t be revisiting thermals or power testing with the 2600K, since none of that has changed since launch. The focus here is entirely on the gaming and render/synthetic performance.
Overclocking
As usual, we’re taking a fairly casual approach to overclocking: our goal is only to do what a typical user could safely do with an hour or two of experimentation, not to break any records. We did have some minor issues getting the Blender test stable, but resolved them with a vCore boost; we eventually completed all tests successfully at 4.7GHz and 1.35v (+/- 250mV for Blender) vCore. Overclocking capacity varies from chip to chip, and anyone intending to perform their own overclock should follow a guide--there are plenty available for the 2600K by now, making overclocking on SNB trivial.
Game Test Methodology
NVIDIA 376.33 drivers were used for benchmarking. Game settings were manually controlled for the DUT. All games were run at presets defined in their respective charts. All other game settings are defined in respective game benchmarks, which we publish separately from GPU and CPU reviews. Our test courses, in the event manual testing is executed, are also uploaded within that content. This allows others to replicate our results by studying our bench courses.
Windows 10-64 ending in b693 was used for testing. B970 was run for some of the updated R7 1700X tests & 1700 tests, but needs to be run (alongside TWW and BF1 updates) for the 2600K and other Intel CPUs.
Average FPS, 1% low, and 0.1% low times are measured. We do not chart maximum or minimum FPS results as we consider these numbers to be pure outliers. Instead, we take an average of the lowest 1% of results (1% low) to show real-world, noticeable dips; we then take an average of the lowest 0.1% of results for severe spikes.
Core Components (Unchanging)
- NZXT 1200W Hale90v2
- For DDR4 platforms: Corsair Vengeance LPX 32GB 3200MHz
- For DDR3 platforms: HyperX Savage 32GB 2400MHz (note: only 2133MHz was supported on our SNB platform)
- Intel 730 480GB SSD
- Open Air Test Bench
- Cooler #1 (Air): Be Quiet! Dark Rock 3
- Cooler #2 (Cheap liquid): Asetek 570LC w/ Gentle Typhoon fan (this is the one we used for this particular article)
- Cooler #3 (High-end): Kraken X62
- Video Card: EVGA GTX 1080 FTW1
- Note: fan and pump settings are configured on a per-test basis.
Z270 Platforms:
- MSI Gaming Pro Carbon
- i7-7700K (x2) samples from motherboard vendors
- i5-7600K purchased by GN
Z170 Platform:
- MSI Gaming M7
- i7-6700K retail
- i5-6600K
Z97 Platform:
- Gigabyte Z97X G1 WIFI-BK
- i7-4790K
- i5-4690K
Z77 Platform:
- MSI GD65 Z77
- i7-2600K
- i5-2500K
- i5 3570K
AM4 platform:
- ASUS Crosshair VI
Dx12 games are benchmarked using PresentMon onPresent, with further data analysis from GN-made tools.
Continue to Page 2 for the synthetic benchmarks & Blender tests.
Synthetic Benchmarks
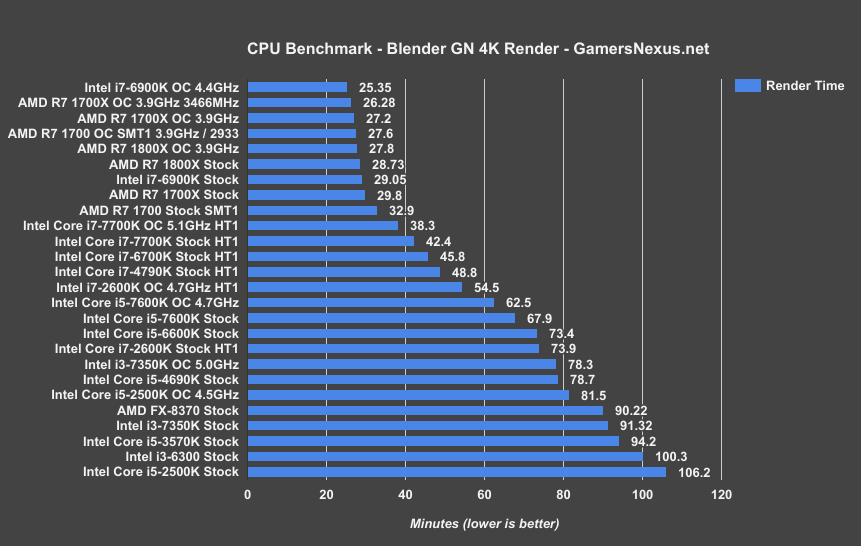
Intel i7-2600K Blender Benchmark 2017
At stock frequency, the 2600K took 73.9 minutes to render our Blender test. For comparison, that’s about 74.3% slower than the stock i7-7700K, which finished in 42.4 minutes. A 4.7GHz overclock proved a little unstable with Blender--as usual, it’s the longest and most stressful test we perform on CPUs, and the most likely to cause overclocks to fail. With the proper vcore boost, we did manage to complete the whole test at 4.7GHz, bringing render time down to 54.5 minutes on the 2600K. That’s a bit slower than the popular i7-4790K and actually faster than the 7700K without hyperthreading, thanks to Blender’s thread focus, and a 26.3% decrease in render time compared to stock. The 7700K itself only reduced render time by 9.7% through overclocking. Hyperthreading enables the 2600K to exceed any 4 core i5 in render performance, including the overclocked 7600K.
For owners of the 2600K who bought the chip originally for a cheap hedge between gaming and CPU production workloads, now’s not a bad time to upgrade if you’ve become dissatisfied with performance. The R7 1700 completes the same render task in 33 minutes without an overclock, for a time reduction of 40% over the overclocked 2600K. That said, if you only care about gaming, needs and recommendations change. We’ll get to that shortly.
Intel i7-2600K Cinebench 2017
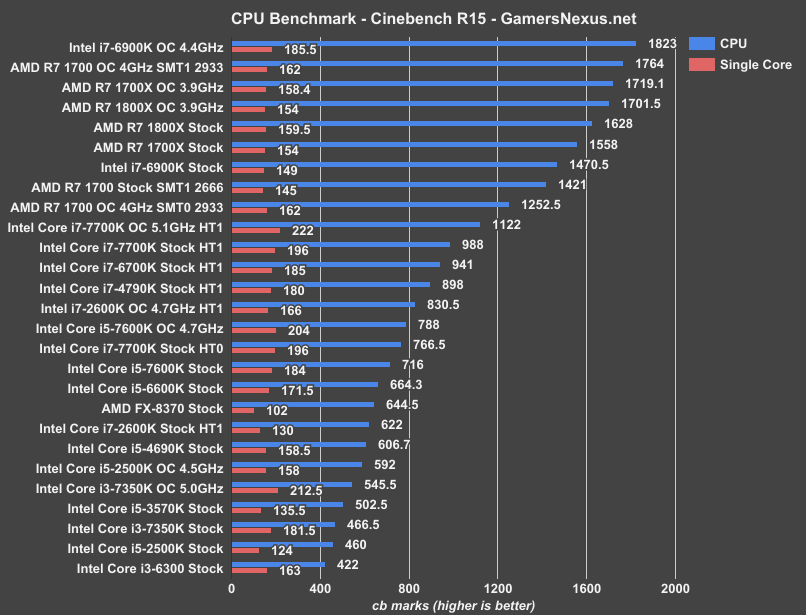
Cinebench multithreaded testing favors physical cores even more heavily than Blender. The overclocked 2600K scored 830.5, much higher than its original score of 622, but much lower than any modern 8-core. A more reasonable comparison to modern i5s reveals the 2600K over the i5-7600K, a 4-core processor released in 2017 that scored 5.1% lower, thanks to its lack of hyperthreading. Our highest scoring 4C/8T i7 (the 5.1GHz 7700K) exceeded the 2600K by 35.1% for a total score of 1122. The R7 1700 at 4.0GHz with 2933MHz memory scored 1764 in this same test, though with lower single-core performance than the overclocked 2600K.
i7-2600K in FireStrike
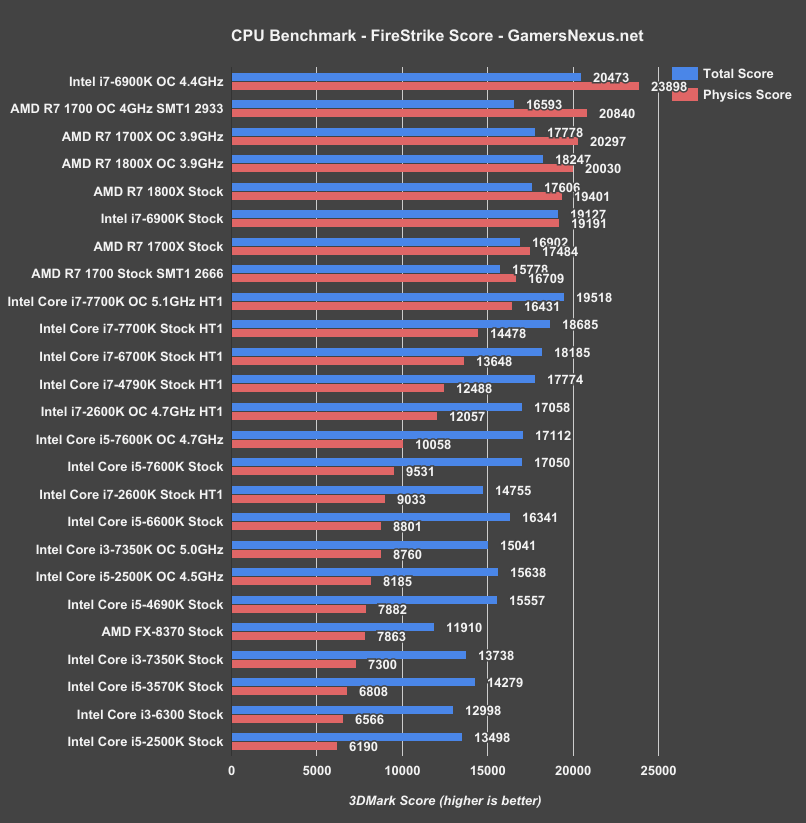
The 2600K’s original score in FireStrike’s demanding physics test was 9033, sandwiching it between newer i5s in our results. Although it managed to cling on and outperform the stock i5-6600K, the stock i5-7600K finally surpassed it. Once overclocked, though, the score leaped to 12057, just shy of the i7-4790K and higher than every i5 tested (overclocked or not).
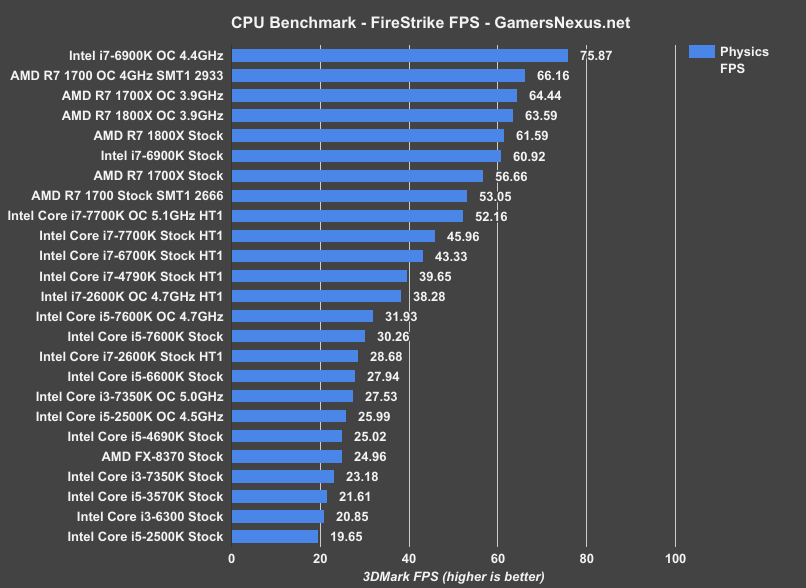
Looking at these metrics as FPS numbers rather than scores, the 2600K at 4.7GHz lands at 38.3FPS for the physics CPU test, whereas the stock 2600K runs at 28.7FPS. Between them, the i5-7600K and its overclocked variant land in the 30s, with the 4790K just above the overclocked 2600K. The R7 1700 stock with 2666MHz memory performs around 53FPS, with the newest-gen i7 at 46FPS.
Timespy
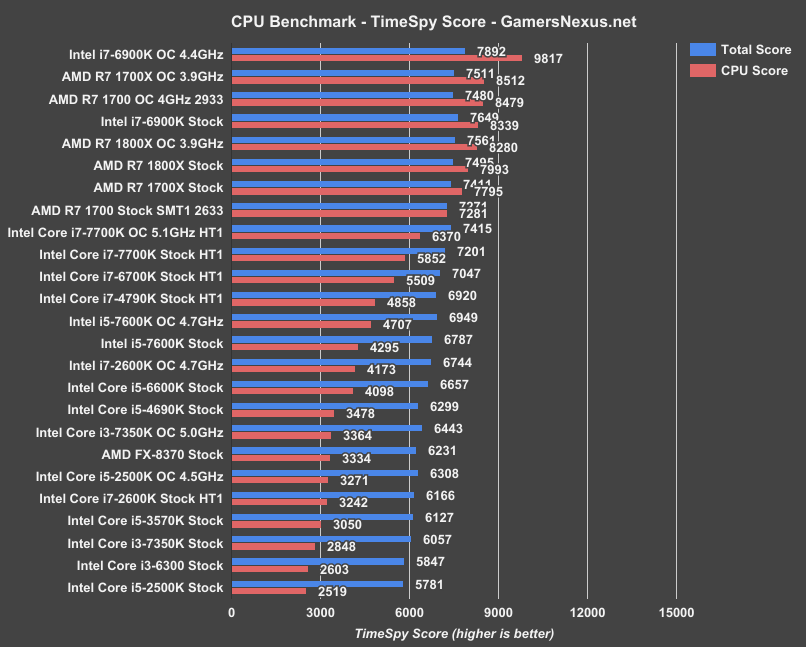
In practice, physical core count carries a greater weight than hyperthreading in TimeSpy, as with most synthetics. The trend of “better than most new i5s, worse than any newer i7” continues, but the stock 7600K did come out ahead in this case.
Continue to the next page for gaming benchmarks & the conclusion.
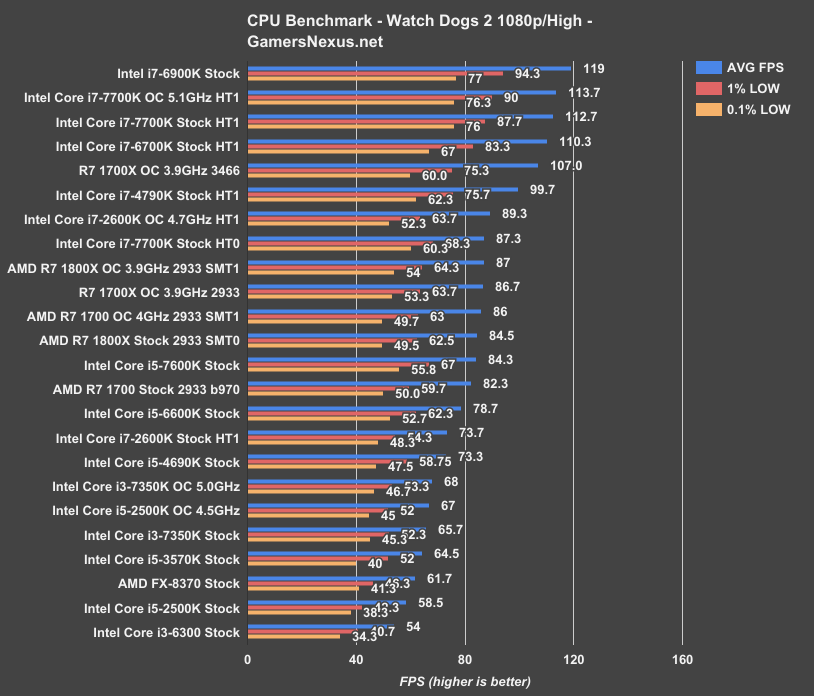
i7-2600K Game Benchmarks in 2017: Watch Dogs 2
Performance in Watch_Dogs 2 was one of the things that necessitated this article in the first place: in our 2500K revisit, the overclocked 2500K only managed to eke out 67FPS average, while the 2600K hit 73.7 with no overclock at all, and at 4.7GHz, the 2600K really stretched its legs. 89.33FPS is higher than the R7 1800X’s overclocked peak, both with comparable lows, and it’s higher than any non-hyperthreaded Intel CPU. That includes the 7700K with hyperthreading disabled. Watch_Dogs 2 is really a best-case scenario, since it takes advantage of the available threads while still leveraging clock speed.
The overclocked 2600K is performing right around where the overclocked 1700 performs, or about 21% behind the 7700K stock.
Watch_Dogs 2 is really a best-case scenario, since it takes advantage of the available threads. As far as WD2 goes, upgrading would involve buying a modern i7 or finding an especially robust R7 – none of these seem particularly worth it alone, but if you’re also upgrading for other reasons, like modernized IO or other games, then there’s more to consider.
i7-2600K Benchmarks in 2017: Total War: Warhammer
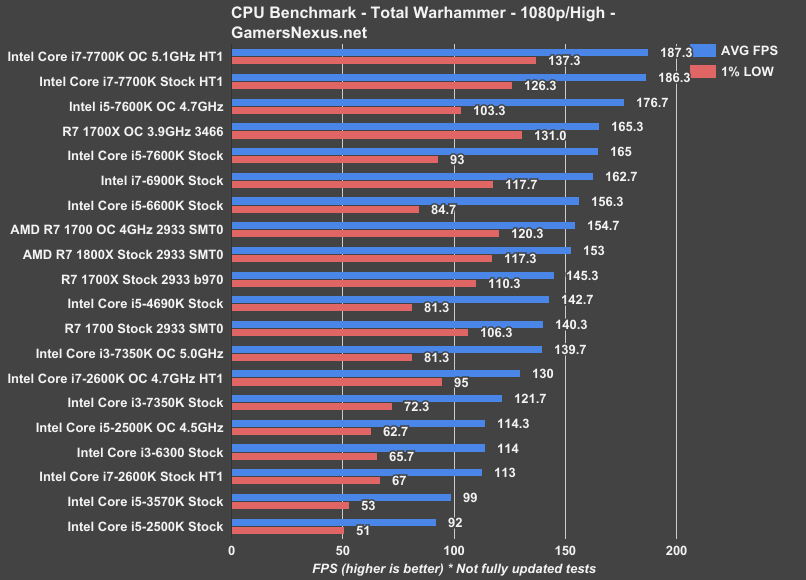
Improvements were slightly less impressive in Total Warhammer when compared to WD2, but a 15% increase in average FPS with overclocking is nothing to scoff at, especially considering the much-improved 1% and 0.1% lows (although these tend to vary a good bit). 130FPS still isn’t exactly competitive with modern CPUs of similar cost, with the 2600K even lagging behind the overclocked i3. It seems that, as we saw in our initial Ryzen reviews, TWW isn’t fully leveraging the number of threads available to it—that said, and this is really important, there’s since been an update to Total War: Warhammer that we found to improve Ryzen performance in an important way, and this might also hold true for the i7-2600K. We’ll be retesting some Intel chips in Total War: Warhammer with the new update in time for the R5 reviews.
i7-2600K Benchmarks in 2017: GTA V
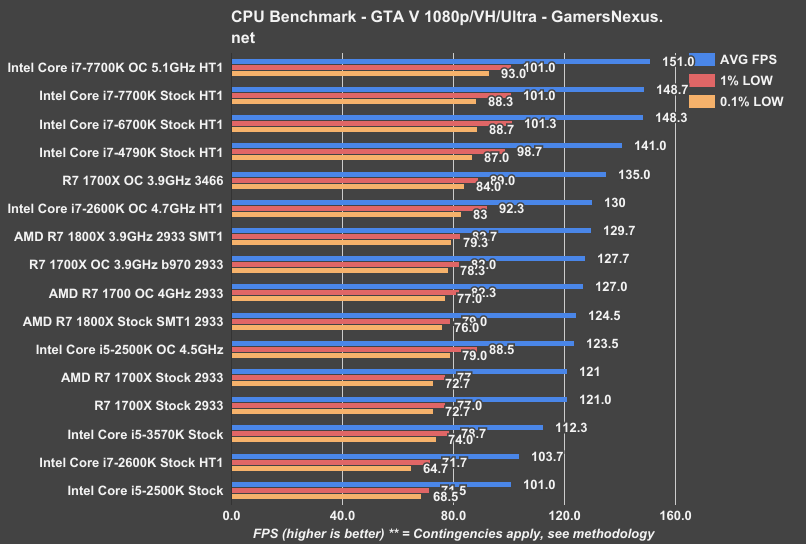
GTA also ran at 130FPS average, this time improving from 103.7FPS. GTA has engine constraints that exhibit themselves with high-performing i5s, so the 2600K is stuck with comparisons to R7s and i7s. The overclocked 2600K outperforms every R7 CPU and lands below the 4790K stock, falling short by 7.8%. The R7 1700X with a 3466MHz memory overclock and 3.9GHz core overclock is able to outperform the 2600K in average framerate.
i7-2600K Benchmarks in 2017: Ashes Of The Singularity
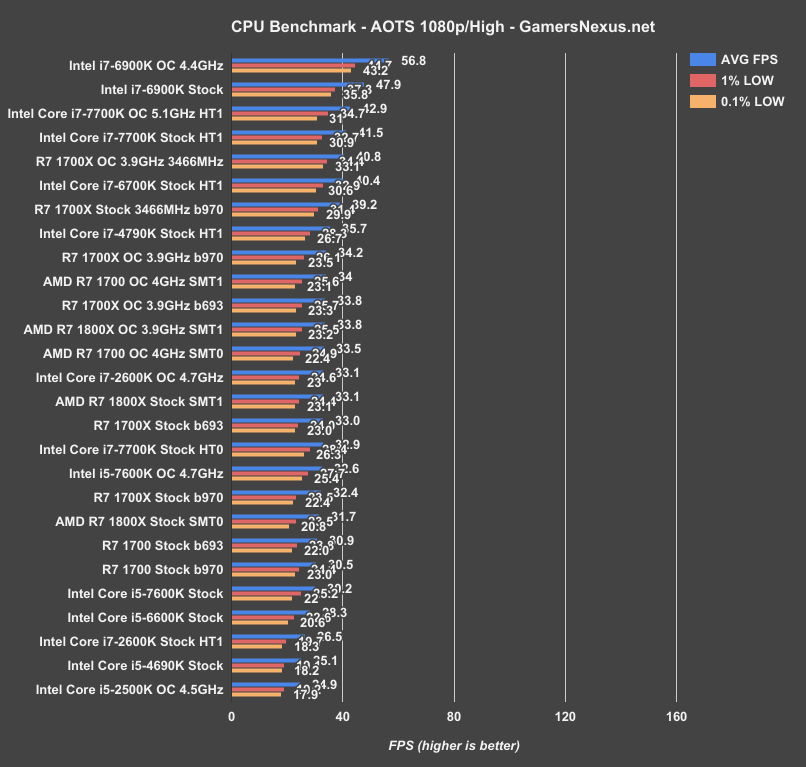
We are working on updating to Escalation for AOTS. For this revisit, we’re running on the previous version of AOTS. Escalation is known to offer a performance boost -- we’ll get there.
Ashes is another title which heavily favors high threadcount, although originally the 2600K landed way down on the list, below the 6600K and 7600K in spite of hyperthreading. When overclocked, it leaps up into the middle of the R7s, although still not at the level of the 4790K.
Metro: Last Light
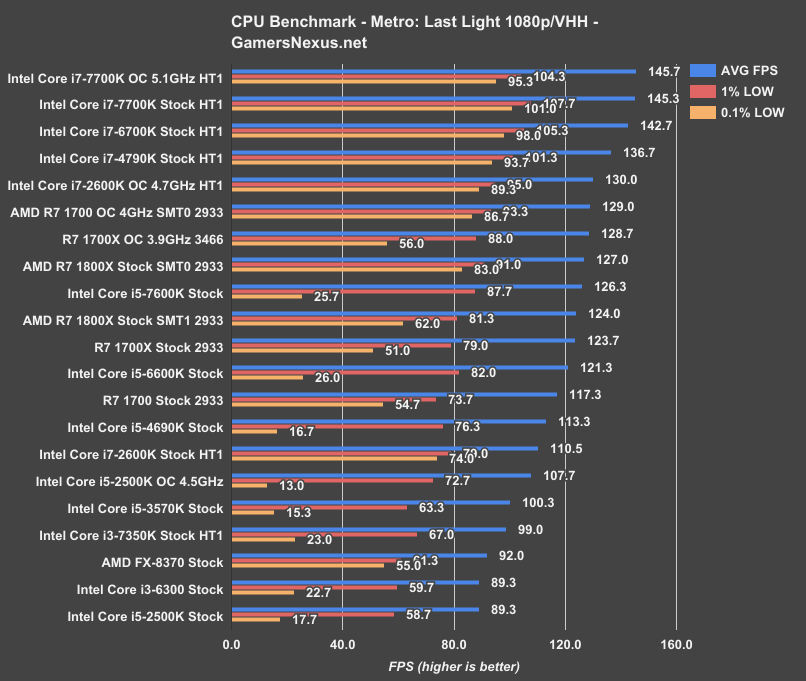
Metro follows the same trend as other titles: moderate improvement (again to 130FPS) that beats all i5s and even R7s, but can’t quite approach the 4790K. This could be due to memory being limited to 2133MHz, but regardless, it’s quite an achievement for a CPU that came out two years before Last Light was released.
Conclusion (Is It Worth Upgrading the 2600K?)
Sandy Bridge CPUs are an interesting case: although some advances in technology like M.2, NVMe, and USB 3.1 Gen2 have made them increasingly obsolete, more affordable coolers and increased ease of overclocking (abundant guides) have enabled them to keep pace much better than their modern counterparts. Since 2011, Intel and AMD both have become much more efficient at extracting maximum performance from their CPUs straight out of the box, leaving less headroom for overclocking. These revisits also require a different perspective from our normal reviews, since the question isn’t “should I buy it?” but “should I bother upgrading it?”
If “upgrading” means “overclocking,” then it’s absolutely worth it--the 2600K can massively improve performance in a way that’s becoming less common every year. Otherwise, it’s a matter of budget, how much newer CPU-bound tech matters to the user, and whether or not performance is becoming an issue. The biggest problem we saw during testing was Sandy Bridge’s limited memory speeds, as we could only run our memory at 2133MHz. The 2600K can’t come close to modern i7s, but at the end of the day, it’s still more than acceptable for 1080p 60Hz gaming and can compete strongly with modern i5s.
If you’re satisfied with performance and don’t need the new technologies afforded by today’s chipsets, then there’s not much point in upgrading. If your SNB system is feeling a little slow, we’d recommend price-linear upgrade paths to either the i7-7700K or R7 1700: the i7-7700K ($345) would be the go-to linear upgrade for pure gaming builds, particularly those focusing on high refresh; the R7 1700 ($330) would be the go-to for a price-linear upgrade that can run Blender-type production workloads in addition to reasonable gaming.
Sr. Editor, Tester: Patrick Lathan
Editor-in-Chief, Test Lead: Steve Burke
Video Producer: Andrew Coleman