The Windows 10 Fall Creators Update (FCU) has reportedly provided performance uplift under specific usage scenarios, most of which center around GPU-bound scenarios with Vega 56 or similar GPUs. We know with relative certainty that FCU has improved performance stability and frametime consistency with adaptive synchronization technologies – Gsync and FreeSync, mostly – and that there may be general GPU-bound performance uplift. Some of this could come down to driver hooks and implementation in Windows, some of it could be GPU or arch-specific. What we haven’t seen much of is CPU-bound tests, attempting to isolate the CPU as the DUT for benchmarking.
These tests look at AMD Ryzen R7 1700 (stock) performance in Windows 10 Creator’s Update (build 1703, ending in 608) versus Windows 10 Fall Creators Update. Our testing can only speak for our testing, as always, and we cannot reasonably draw conclusions across the hardware stack with these benchmarks. The tests are representative of the R7 1700 in CPU-bound scenarios, created by using a GTX 1080 Ti FTW3. Because this is a 1080 Ti FTW3, we have two additional considerations for possible performance uplift (neither of which will be represented herein):
- - As an nVidia GPU, it is possible that driver/OS behavior will be different than with an AMD GPU
- - As a 1080 Ti FTW3, it is possible and likely that GPU-bound performance – which we aren’t testing – would exhibit uplift where this testing does not
Our results are not conclusive of the entirety of FCU, and cannot be used to draw wide-reaching conclusions about multiple hardware configurations. Our objective is to start pinpointing performance uplift, and from what combination of components that uplift can be derived. Most reports we have seen have spotted uplift with 1070 or Vega 56 GPUs, which would indicate GPU-bound performance increases (particularly because said reports show bigger gains at higher resolutions). We also cannot yet speak to performance change on Intel CPUs.
As an aside: We began testing Shadow of War, but found that the game’s performance is variable enough to not presently be trustworthy for testing. The game was removed from testing.
Testing was conducted in a simple A/B fashion. We are only focusing on 1080p for today, dropping our usual 1440p benchmarks. Some data is from last week, tested with CU and 1703/608, but most is from the last 24 hours. We tested by imaging a drive with our Windows 10 – AMD CPU benchmarking build, then running the tests. We then updated the drive with FCU via the Windows official website, validating that FCU was properly installed with a simple winver. This was further validated by simply checking the interface, which has clear differences – like the Game Mode panel, which now applies on a per-game basis, rather than system-wide.
Some games, like Total War: Warhammer, were tested nearly a dozen times per configuration (in order to build enough data for relative confidence). Most games were tested 4-6 passes. We have compiled standard deviation based upon dozens of passes across our CPU test suite.
The system configuration is as follows:
| GN Test Bench | Name | Courtesy Of |
| Video Card | GTX 1080 Ti FTW3 | EVGA |
| CPU | AMD R7 1700 Stock | AMD |
| Memory | GeIL EVO X 3200MHz CL16 | GeIL |
| Motherboard | ASUS Crosshair VI Hero | ASUS |
| Power Supply | NZXT Hale90 V2 | NZXT |
| SSD | WD Blue SSD | GamersNexus |
| Case | Top Deck Tech Station | GamersNexus |
| CPU Cooler | NZXT Kraken X62 | NZXT |
Ashes of the Singularity: Escalation – DX12 Fall Creators Update Benchmark
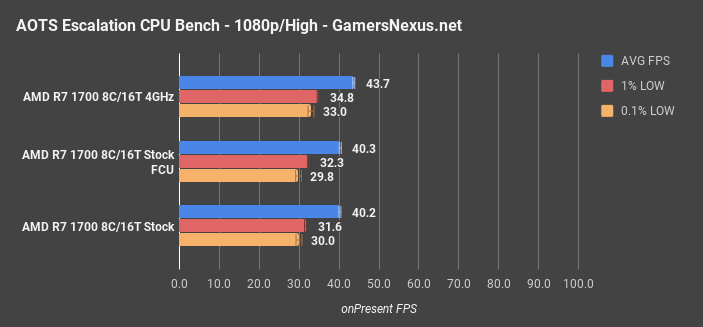
Starting with Ashes of the Singularity at 1080p, we measured the CU 1703.608 build at 40.2FPS AVG, with 1% lows at 31.6 and 0.1% lows at 30FPS. The FCU test planted the R7 1700 at 40.3FPS AVG, with lows at 32.3FPS 1% and 29.8FPS 0.1%. This is within standard deviation, which we measured at 0.5FPS for AVG and 1%, or 1.5FPS for 0.1%. We were not able to discern an appreciable performance change between CU and FCU, with data plotting the difference as within error and test variance.
AOTS Fall Creators Update Frametimes
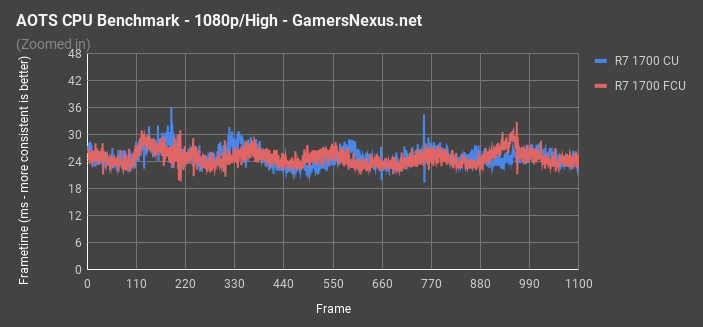
Here's a frametime plot between the two, just to show the differences in Ashes of the Singularity at 1080p/High.
Total Warhammer – DX11 Fall Creators Update Benchmark
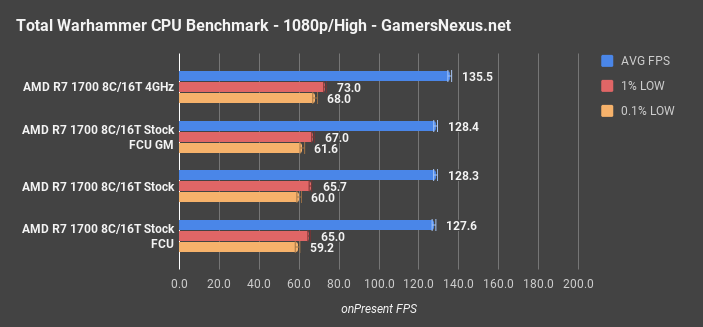
Total War: Warhammer at 1080p is next. For this test, our original R7 1700 CPU plotted an AVG FPS of 128FPS AVG, with lows at 65.7FPS and 60FPS. The FCU test had us at 127.6FPS AVG, 65FPS 1% lows, and 59.2FPS 0.1% lows. Enabling Game Mode in FCU plotted 128.4FPS AVG, 67FPS 1% lows, and 61.6FPS 0.1% lows. These results are all within standard deviation, which we’ve plotted as 1.9FPS AVG, 1.3FPS 1%, and 2.3FPS 0.1%. Again, we cannot determine statistically significant changes in performance from these numbers. Total War: Warhammer was run more than 10 times, and was the title we spent the most effort on. One outlier result was tossed from each test batch.
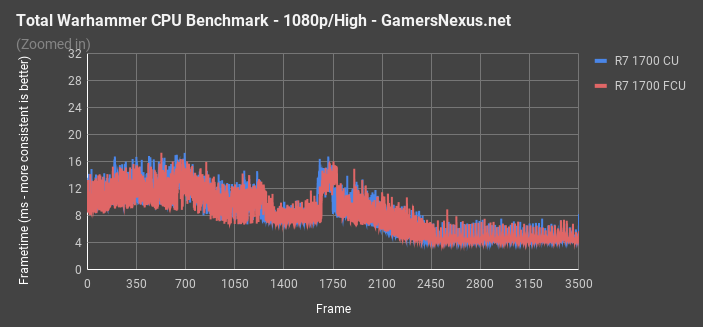
TWW Fall Creators Update Frametimes
Watch Dogs 2 Fall Creators Update Benchmark
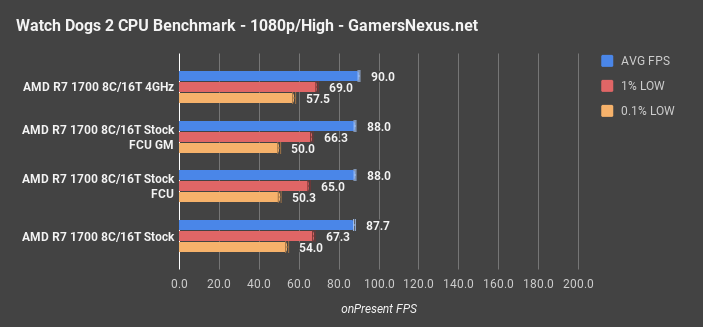
Watch Dogs 2 plotted the CU R7 1700 at 87.7FPS AVG when retested yesterday, with 1% low at 67.3 and 0.1% lows at 54FPS. The FCU test had us at 88FPS AVG. Game Mode also had us at 88FPS AVG. Standard deviation in this one is about 0.9FPS AVG, with the lows deviating by about 1.2 and 1.5FPS, respectively.
Project Cars 2 Fall Creators Update Benchmark
Project Cars 2 at 1080p plots our R7 1700 stock CPU from CU at 78.5FPS AVG, with lows at 62.5 and 58.5. FCU had us at 79.5FPS AVG, with lows at 62.8 and 56.8. Standard deviation is about 0.6FPS AVG, 0.7FPS 1% lows, and 2.6FPS 0.1% lows.
Civilization VI Turn Time Fall Creators Update Benchmark
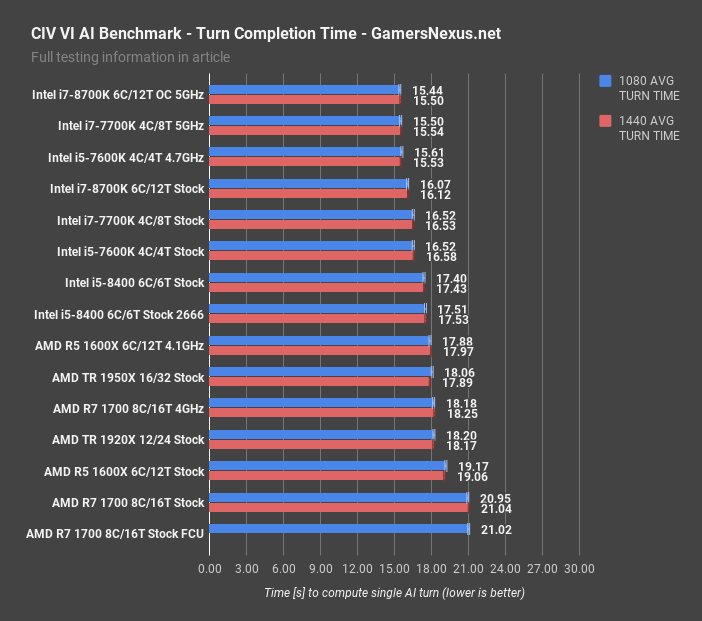
Civilization VI turn time completion is measured in seconds, not FPS. AVG FPS actually increases in Civilization with worse CPUs, because more time is spent with the screen unmoving and static. Faster CPUs process turns faster, and so the screen experiences more dynamism and therefore lower framerate.
The turn time completion for the stock R7 1700 with CU was 20.95 seconds, with FCU at 21.02 seconds. This is within error and variance.
GTA V Fall Creators Update Benchmark
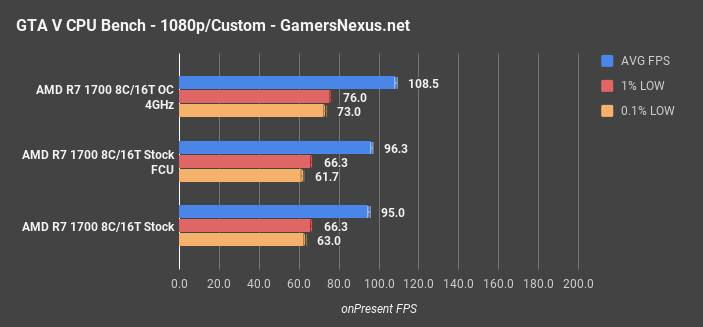
GTA V at 1080p is last. We’re at 95FPS AVG for the original tests with CU, 66.3FPS 1% lows, and 63FPS 0.1% lows. FCU plots us at 96.3FPS, 66.3FPS 1% lows, and 61.7FPS 0.1% lows. Again, this is within error.
GTA V Frametimes
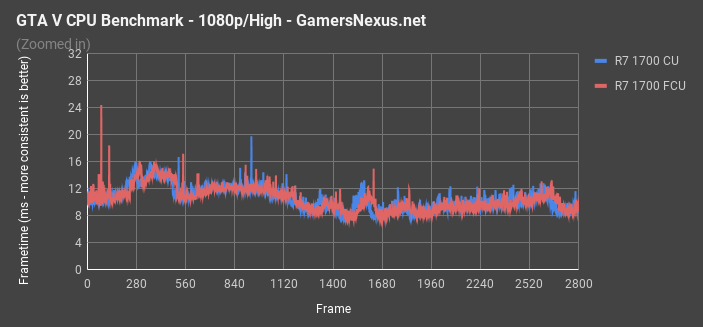
The frametime plot doesn’t show much difference between the two runs, once again, and demonstrates that frametime consistency is largely unchanged in our R7 1700 CPU-bound test.
Blender Benchmarks
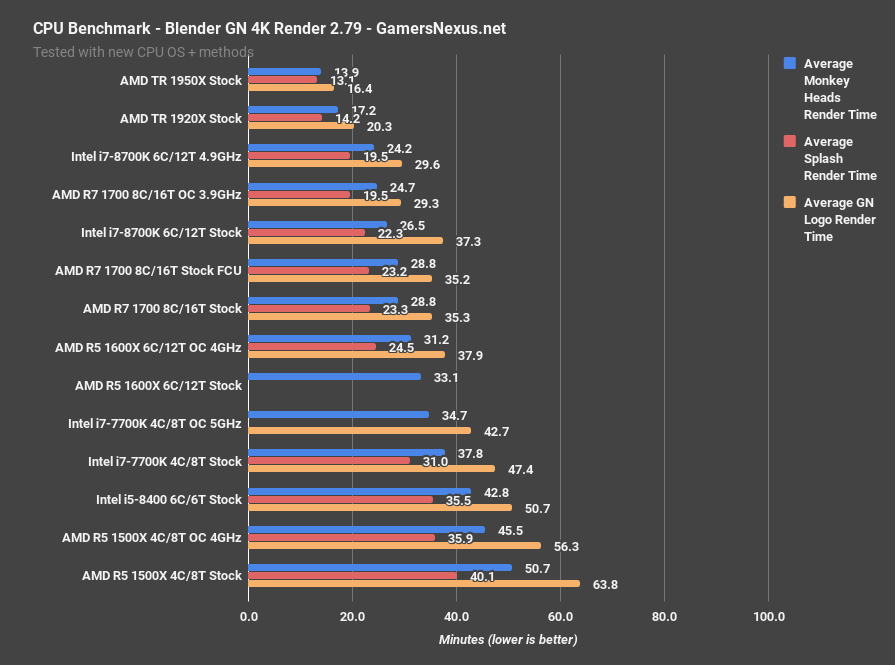
Blender has not presented any meaningful performance delta between CU and FCU, as we’ve highlighted above. Performance deltas are within test-to-test variance.
Conclusion: Initial Fall Creators Update Ryzen Benchmark
Let’s just reiterate the entire introduction, for those who skipped past 90% of the content, looked at a chart, and then started feeling a need to copy/paste that data elsewhere: This doesn’t mean you can’t or won’t see performance uplift. We’re not saying it’s impossible; in fact, we already said that performance uplift has been most visible in two scenarios: GPU-bound tests and adaptive synchronization tests, the latter representing FreeSync and Gsync. For a CPU-bound benchmark with an R7 1700 and a high-end nVidia card, the 1080 Ti FTW3, we are not presently observing performance uplift in gaming or in synthetic/production benchmarks. It is also possible that Intel could behave differently.
GPU-bound tests are different, and there are already many benchmarks for those – though we may investigate next week. This Fall Update seems primarily contingent upon GPU.
Editorial, Testing: Steve Burke
Testing: Patrick Lathan
Video: Andrew Coleman