We’re resurrecting our AMD RX Vega 56 powerplay tables mod to challenge the RTX 2070, a card that competes in an entirely different price class. It’s a lightweight versus heavyweight boxing match, except the lightweight has a gun.
For our Vega 56 card, priced at between $370 and $400, depending on sales, we will be shoving an extra 200W+ of power into the core to attempt to match the RTX 2070’s stock performance. We strongly praised Vega 56 at launch for its easily modded nature, but the card has faced fierce competition from the 1070 Ti and 1070. It was also constantly out of stock or massively overpriced throughout the mining boom, which acted as a death knell for Vega throughout the mining months. With that now dying down and Vega becoming available for normal people again, pricing is competitive and compelling, and nVidia’s own recent fumbles have created an opening in the market.
We will be working with a PowerColor RX Vega 56 Red Dragon card, a 242% power target, and matching it versus an EVGA RTX 2070 Black. The price difference is about $370-$400 vs. $500-$550, depending on where you buy your parts. We are using registry entries to trick the Vega 56 card into a power limit that exceeds the stock maximum of +50%, allowing us to go to +242%. This was done with the help of Buildzoid last year.
One final note: We must warn that we aren’t sure of the long-term impact of running Vega 56 with this much power going through it. If you want to do this yourself, be advised that long-term damage is a possibility for which we cannot account.
Test Methodology
Testing methodology has completely changed from our last GPU reviews, which were probably for the GTX 1070 Ti series cards. Most notably, we have overhauled the host test bench and had updated with new games. Our games selection is a careful one: Time is finite, and having analyzed our previous testing methodologies, we identified shortcomings where we were ultimately wasting time by testing too many games that didn’t provide meaningfully different data from our other tested titles. In order to better optimize our time available and test “smarter” (rather than “more,” which was one of our previous goals), we have selected games based upon the following criteria:
- Game Engine: Most games run on the same group of popular engines. By choosing one game from each major engine (e.g. Unreal Engine), we can ensure that we are representing a wide sweep of games that just use the built-in engine-level optimizations
- API: We have chosen a select group of DirectX 11 and DirectX 12 API integrations, as these are the most prevalent at this time. We will include more Vulkan API testing as more games ship with Vulkan
- Popularity: Is it something people actually play?
- Longevity: Regardless of popularity, how long can we reasonably expect that a game will go without updates? Updating games can hurt comparative data from past tests, which impacts our ability to cross-compare new data and old, as old data may no longer be comparable post-patch
Game graphics settings are defined in their respective charts.
We are also testing most games at all three popular resolutions – at least, we are for the high-end. This includes 4K, 1440p, and 1080p, which allows us to determine GPU scalability across multiple monitor types. More importantly, this allows us to start pinpointing the reason for performance uplift, rather than just saying there is performance uplift. If we know that performance boosts harder at 4K than 1080p, we might be able to call this indicative of a ROPs advantage, for instance. Understanding why performance behaves the way it does is critical for future expansion of our own knowledge, and thus prepares our content for smarter analysis in the future.
For the test bench proper, we are now using the following components:
GPU Test Bench (Sponsored by Corsair)
Component | Courtesy of | |
CPU | GamersNexus | |
GPU | This is what we’re testing! | Often the company that makes the card, but sometimes us (see article) |
Motherboard | ASUS | |
RAM | Corsair | |
PSU | Corsair | |
Cooler | NZXT | |
SSD | Plextor 256-M7VC | GamersNexus |
Sniper Elite 4 – Vega 56 vs. RTX 2070
Sniper Elite 4 is one of the best modern API implementations and leverages asynchronous compute command queuing to use hardware more efficiently without getting stuck waiting for as many synchronous instructions.

At 4K/High, we found that the stock Vega 56 Red Dragon performed at around 55FPS AVG, with the stock RTX 2070 at 64FPS AVG. That’s a marked lead, but one which we can take away. By allowing an uncapped power target of 242% on the Vega 56 card, and by pulling down significantly more power, we outperformed the RTX 2070 by – well, it’s within margin of error. They’re about the same, really, at 63.8FPS versus 63.6FPS AVG. That is well within our error margins, but we can still call it a victory. We’ve minimally managed to match the RTX 2070 with Vega 56, the latter of which costs about $370 to $400. The RTX 2070 costs about $500 to $600. For reference, Vega 64 ended up at around 62FPS AVG when stock.
F1 2018 – Vega 56 & 64 vs. RTX 2070
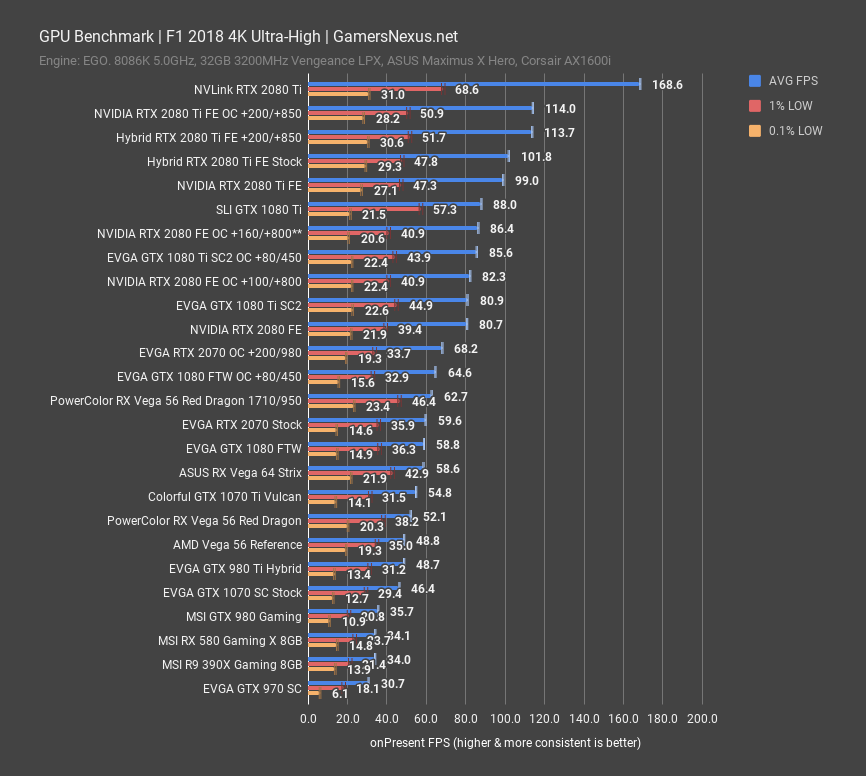
F1 2018 is up next. At 4K and Ultra-High, this one places the reference Vega 56 at 49FPS AVG when stock, compared to the stock RTX 2070 at 60FPS AVG. That’s a lead of about 22%. The PowerColor Red Dragon model operated at 52FPS AVG, closing the gap marginally already. When overclocking PowerColor Vega 56 card with a massive power offset of 242% maximum power, we surpassed the RTX 2070 stock card by 5.2%, reaching 62.7FPS AVG. That’s a tremendous jump of 28.5% over the stock Vega 56 card, or 20% over the Red Dragon stock card, possible only through this mod. For perspective, the Vega 64 card performs at around 59FPS AVG when left to stock settings. The RTX 2070 does outperform Vega 56 when both are overclocked, to be fair, reaching a new height of 68FPS AVG – but this gap is significantly smaller than the stock-to-stock gap of the RTX 2070 and Vega 56 cards. Even though the RTX 2070 is able to outperform Vega 56 with an overclock, we still have to commend the performance of the Vega 56 part. Further mods, like to BIOS, might gain us additional overhead and again equalize the score. Granted, power is way over 2070 usage, but we’ll look at that after the game benchmarks.

At 1440p, the stock PowerColor Vega 56 Red Dragon landed at 88.5FPS AVG, a marked gain over the stock Vega 56 reference card. It’s still significantly behind the stock RTX 2070, which performs at 102FPS AVG, leaving the Vega 56 Red Dragon to be outperformed by about 15% stock-to-stock. For reference, the Vega 64 Strix ran at 96FPS AVG. Pushing Vega 56 with our powerplay tables mod resulted in a framerate that again surpassed the RTX 2070 card. The modded Vega 56 pushes 104FPS AVG with significantly tighter frametime consistency than the RTX 2070, a result of never running into a power perfcap, and pulled ahead by 2%. That’s a remarkable feat for a card that costs around $270 to $400, considering the RTX 2070 costs $500 to $600. Still, overclocking the RTX 2070 allows it to gain on Vega 56 by another 10FPS, to be fair, but that’s becoming difficult to notice for the end-user, as framerate is already so high. This said, power is more noticeable, and we’ll talk power soon. We’re not saying this is the best approach given the insane power draw and mod we’re doing, but we are saying that it’s pretty damn cool to be able to push a cheaper card this far ahead with some tuning.
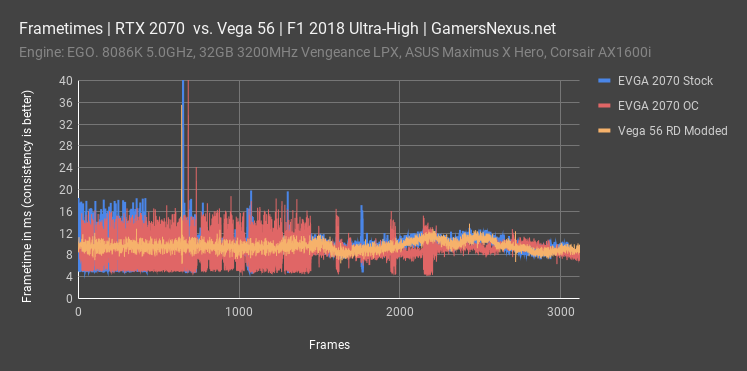
For perspective, here’s a look at frametime consistency at 1440p. Remember: Lower is better, but more consistent is better than lower. This kind of plot is far more valuable than framerate, as it gives you a truer representation of what you’re seeing. We’re looking at the frame-to-frame interval, or how long it takes for each frame to be drawn after the previous frame. Vega 56 is significantly better in this particular title than the NVIDIA devices, which may come down to game-level optimization. This is true for both the stock and overclocked 2070 cards. You’ll notice the overall increased frametime consistency on Vega 56, represented by its lack of spikey lines, and that’s something that can be seen in gameplay.

Finally, at 1080p, the Vega 56 card measured at 104FPS AVG on reference, or 115FPS AVG for the PowerColor model. This allows the PowerColor card to reach GTX 1070 Ti levels of performance, although its low frametime performance is measurably better. The stock RTX 2070 ends up at 136FPS AVG, and the massively overpowered RX 56 Red Dragon ends up at 134FPS AVG. That’s not bad, but does show that we’re running into other limitations at 1080p for Vega 56. Frametime consistency remains superior for the Vega cards, and somewhat noticeably so.
GTA V – Vega 56 & Vega 64 vs. RTX 2070
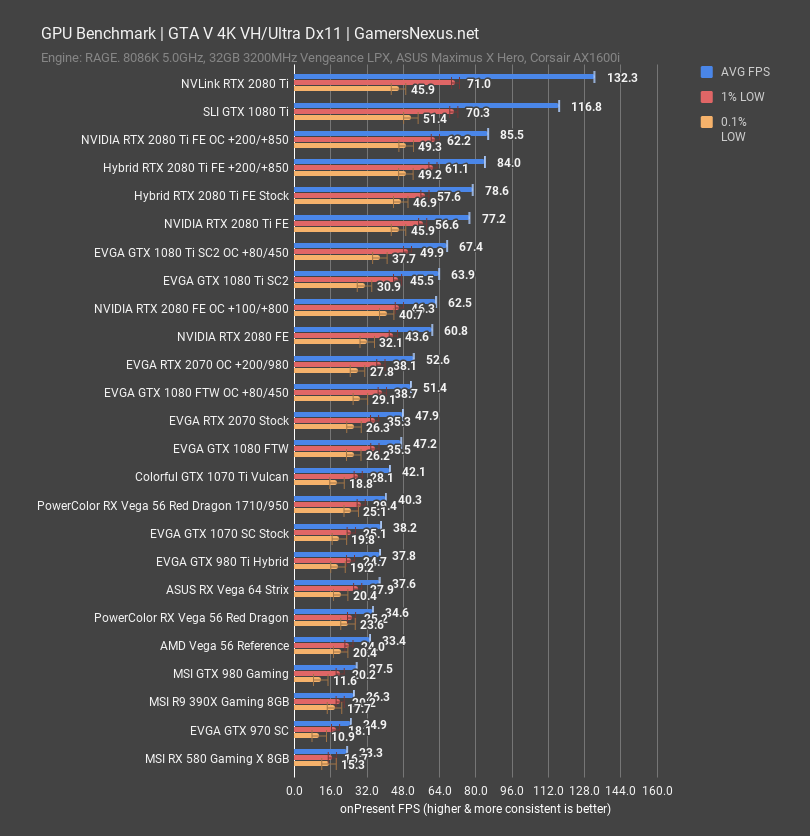
GTA V is less exciting: At 4K, the Red Dragon 56 card ran at 35FPS AVG, with the RTX 2070 at 48FPS AVG. That’s a lot of ground to gain, and it just couldn’t do it. Even with the power mod, the Vega 56 card ended up at 40FPS AVG, still behind the 2070’s 48FPS AVG. Overclocking the 2070 out of fairness, the gap widens to 53FPS AVG.
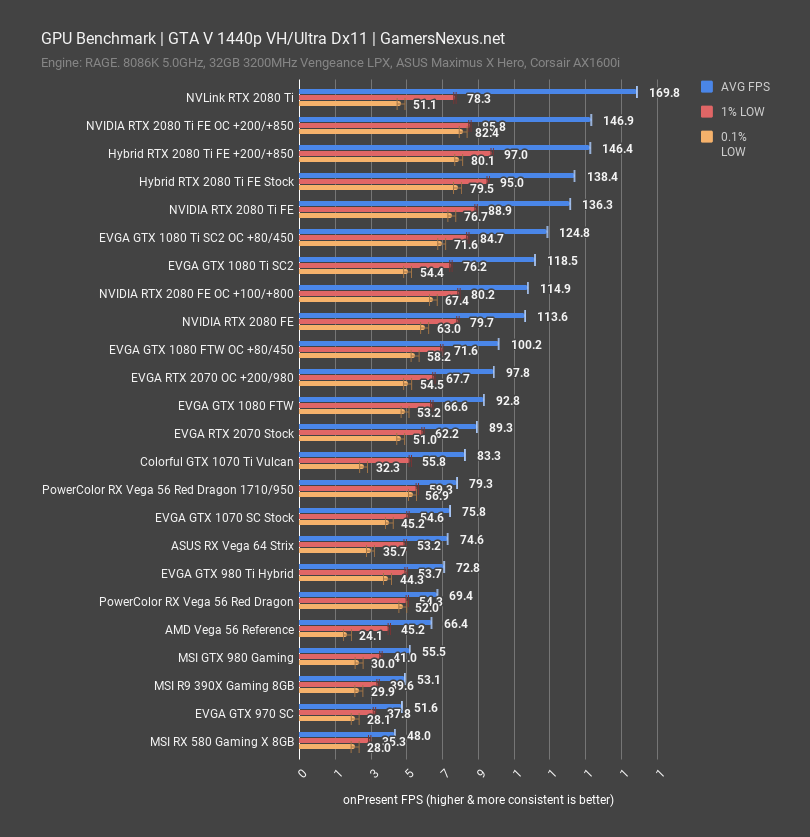
Looking instead at 1440p, the Vega 56 card pushes 80FPS when modded, improved over the stock Vega 56 Red Dragon score of 70FPS AVG. The RTX 2070 still holds a lead at 89 FPS, though, with the overclocked 2070 at 98FPS AVG. No hope for Vega 56 to pass the 2070 in this older Dx11 title. Let’s move on to the next game.
Far Cry 5 GPU Benchmark – Vega 56 vs. RTX 2070
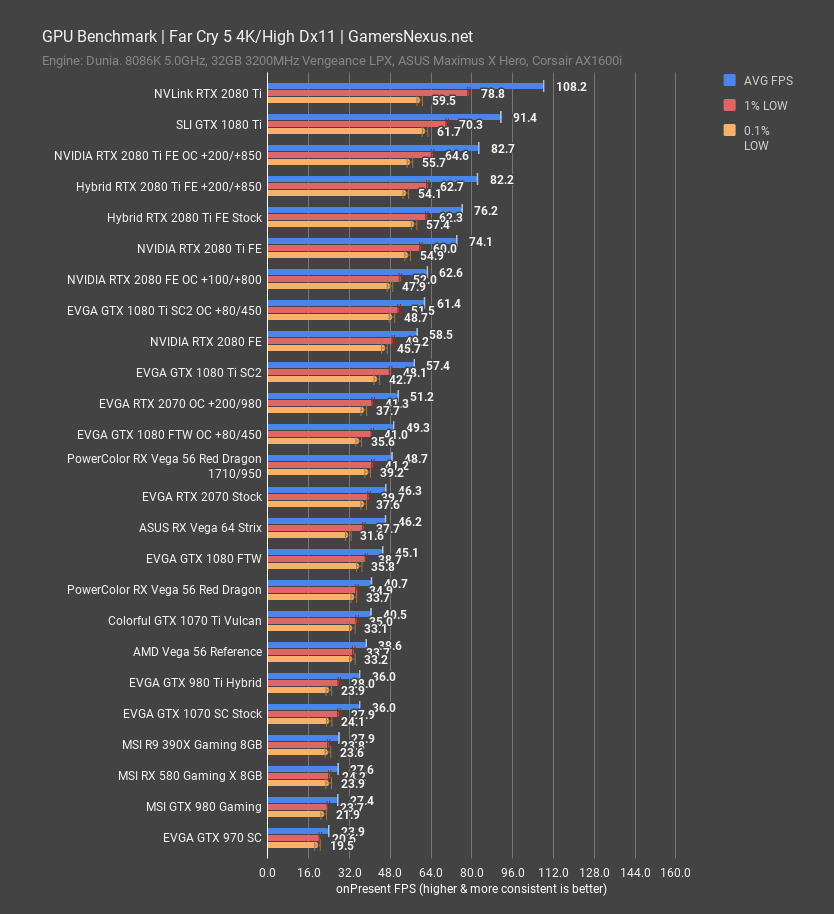
Far Cry 5 is up next. At 4K and High settings, we measured the RX Vega 56 Red Dragon stock card at 41FPS AVG, right around the 1070 Ti and behind the 1080 FTW. Modded with the power offset, the Vega 56 card surpasses the ASUS Vega 64’s 46FPS AVG by a couple FPS, landing at 49FPS AVG on the Red Dragon. This allows the PowerColor Vega 56 to beat the RTX 2070 by marginal gains, at 49FPS versus 46FPS AVG, while still maintaining tight frametime consistency. To be fair though, the RTX 2070 is equally smooth in frame throughput in this game. Overclocking the 2070 does allow it to surpass Vega 56, but by similar margins to Vega 56’s surpassing of the stock 2070 – it’s at 51FPS AVG versus 49FPS AVG. Again, this is pretty damn impressive for the Vega 56 card.
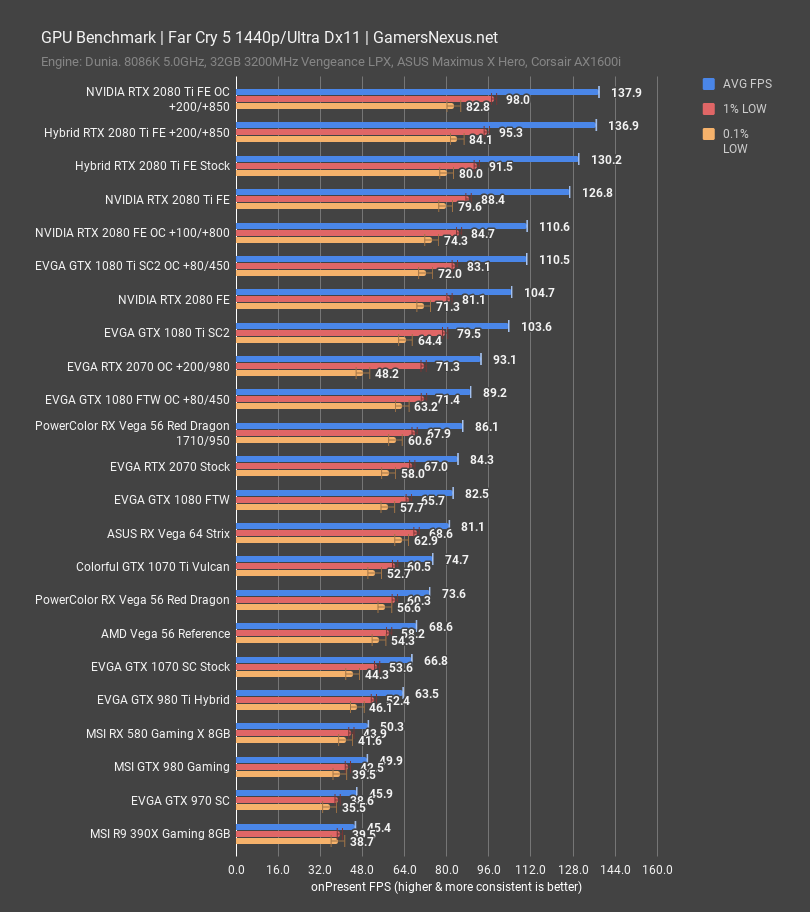
At 1440p, the Vega 56 Red Dragon measured at 74FPS AVG, a measurable improvement over the 69FPS AVG of the reference card. The RTX 2070 ends up at 84FPS AVG, and is just barely beaten by our modded Vega 56. Again, we have to be happy with the results of the mod – power is another story, one that’s pending overview momentarily, but the performance is impressive. At 86FPS AVG for the Vega mod, we’re looking at significant uplift over the stock performance. As expected, the 2070’s overclock allows it to re-take the lead at 93FPS AVG.
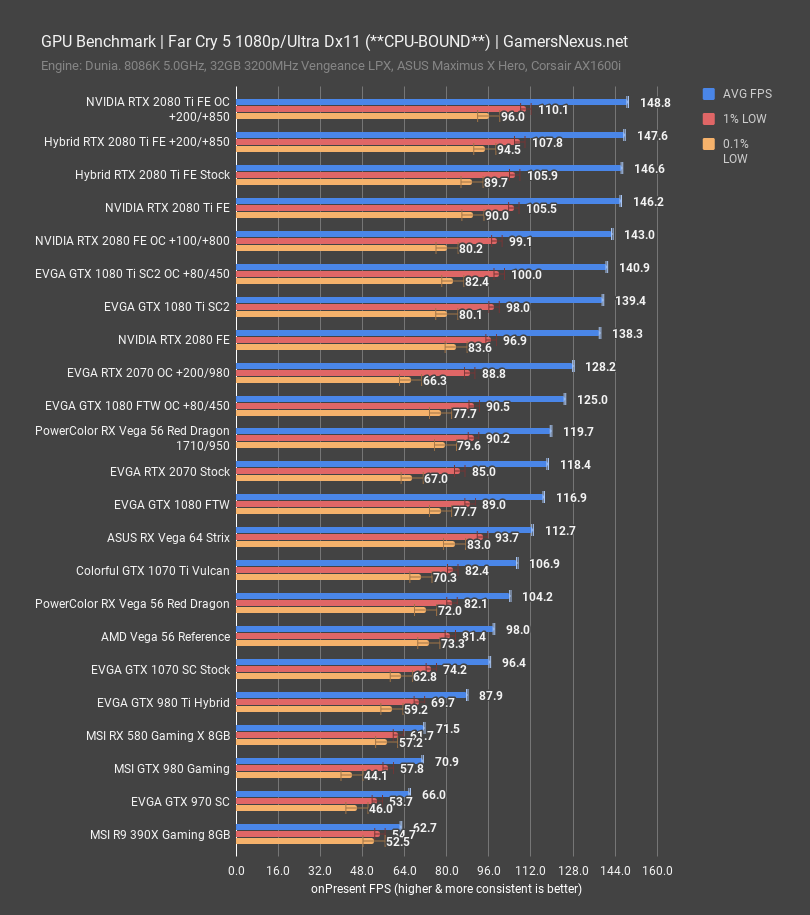
At 1080p, Far Cry 5 becomes CPU-bound at the absolute high-end, but dodges this complication with the parts we’re testing today. The Vega 56 reference card is decently behind the PowerColor model, plotting 98FPS AVG instead of 104FPS AVG. Power modding Vega 56 gets us to 120FPS AVG, a remarkable climb of just over 20%. The RTX 2070 is within margin of error, plotting 118FPS AVG. Once again, we’ve managed to minimally tie, or marginally outpace the RTX 2070 with a modded Vega 56. And also once again, if you’re willing to mod Vega 56, you’re probably willing to do a simple OC on the 2070. This OC gets the 2070 to 128FPS AVG, but the gap is again much smaller than previously.
Shadow of the Tomb Raider – Vega 56 & 64 vs. RTX 2070
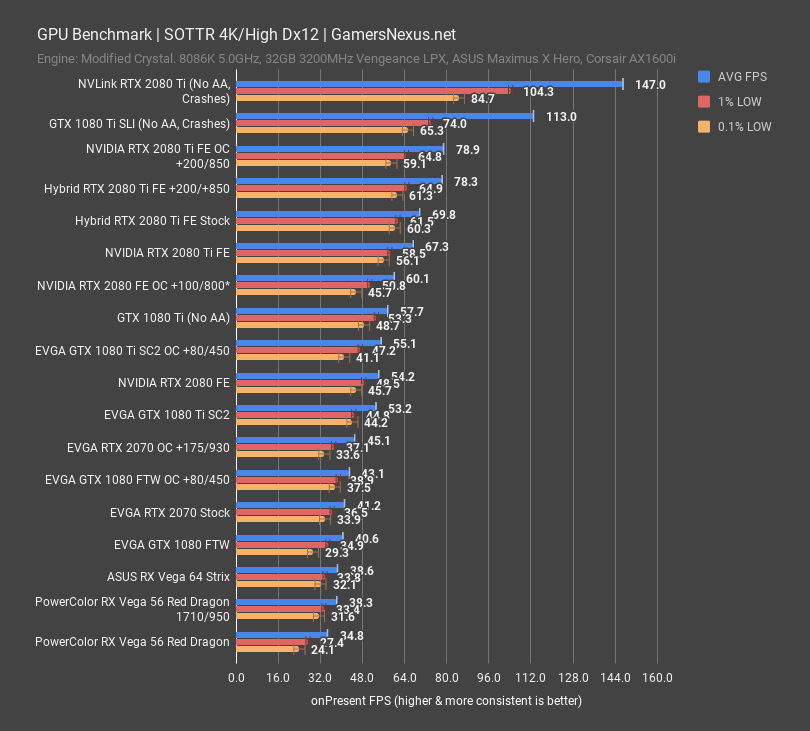
Shadow of the Tomb Raider is a significantly newer title that is still awaiting full RTX support. At 4K and high settings, using DirectX 12, we measured the Vega 56 cards at 35FPS and 38FPS for the stock and overclocked variants, respectively. This is a let-down, and allows even Vega 64 to remain in the lead.
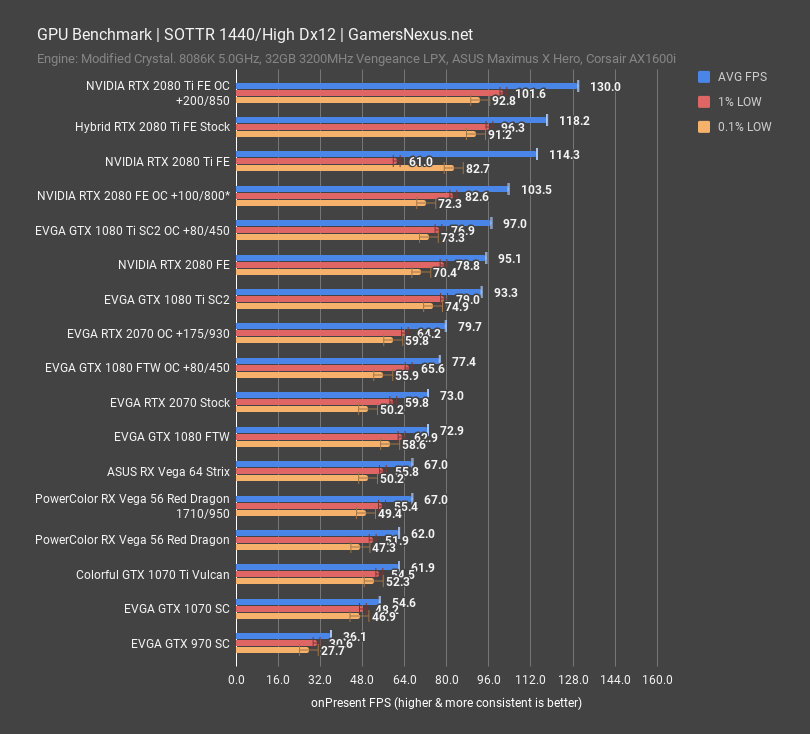
Changing to 1440p, we see the same performance stack. Vega 56 ties with 64, which is good for other reasons, but it does not meet the 2070. We’ve got a mixed bag for performance.
RTX 2070 vs. Vega Power Consumption
Here we go – we’re getting into power. For power measurements, we logged power during the entirety of our tests to plot total system power consumption during work. Again, this is total system power draw, but it’s the exact same platform with heavily controlled platform voltages across the board. We take total system draw instead of current clamping this, as AMD and NVIDIA have different power draw policies on the PCIe slots. We have perfectly synchronized our data so that it is easier to view the comparative run-to-run draw.
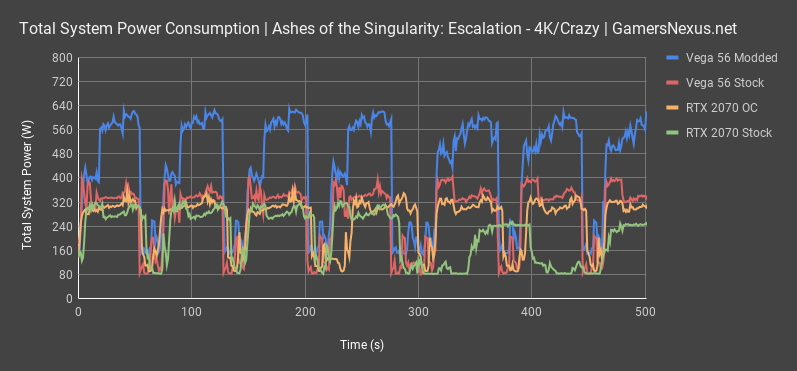
For Ashes of the Singularity, you can see our power consumption across multiple passes, including the peak total system draw at the most intensive part of the pass. The Vega 56 mod pushes up to about 600W total system draw during this stressing part of the benchmark, while the stock Vega 56 card peaks at around 400W total system power draw. We’re pushing about 200W more with the power offset in the mod. That’s a huge amount of extra power going to the core. As long as the VRM is well-cooled, and assuming the VRM is a decent one on the Vega 56 PCB in question, the VRM should be fine. What we are unsure of is how much the Vega GPU can take for a long period of time. For this reason, we don’t necessarily recommend this mod. It could kill VRM components if not done carefully and on good PCBs, and we don’t know what will happen to the GPU after a long period of time.
As for the RTX 2070, that’s around 300-315W total system draw during the heaviest load of the tests. Because this card is so power limited at all times, including only a 14% power offset on the $500 model we’re testing, the maximum power draw on the OC test never exceeds 357W. On average, it is closer to a 330W peak draw. The rest of the games follow a similar pattern, so we’ll leave that here. The RTX 2070 clearly has a power consumption advantage when stock or overclocked, with the overclocked version drawing slightly less power than Vega 56 – although it is largely insignificant here, at 397W peak versus 357W peak total system draw. It’s the modded Vega 56 that clearly loses in all power consumption needs, unless your goals to outperform the RTX 2070 also include heating your room.
Conclusion: Power Modding Vega 56
This mod absolutely loses in the power consumption department, but that was never really a question. It’s not difficult to install the powerplay tables mod (grab the registry files on overclock.net or somewhere similar), but it is potentially dangerous. For cards with lower quality PCBs, VRMs, and VRM cooling, it is feasible that the VRM could sustain long-term damage from significantly increased power throughput. An example might be some of the caps in the Vcore capacitor bank, where it would be possible to exceed 85-105C (depending on capacitor spec) on lower-end coolers, resulting in earlier deaths of those caps. For well-cooled cards with a good VRM, this is a non-issue and not a concern. The only remaining concern would be one of long-term impact on the Vega GPU. It is possible that such power input could kill the card early, but we simply don’t know without any endurance testing sample data to pull from.
It is fun, though, and it’s definitely possible to minimally match or marginally outmatch the RTX 2070 stock performance. This is definitely one of those enthusiast mods you do just to show you can, although the performance gains are real. The other side of the story, illustrated in some of these charts, is that the less-liked Vega variant – 64 – is able to compete with the 2070 when both are in stock configurations.
We still like Vega 56 a lot for its “mod-ability” and overclocking potential, and still believe it is one of the better cards at its price-point when considering the kind of enthusiast fun you can have with it.
One final note: We'd be able to achieve an even bigger overclock if we put Vega under a waterblock, like we did once before, but left them to air for this one.
Editorial, testing: Steve Burke
Video: Andrew Coleman