We previously deep-dived on MCE (Multi-Core Enhancement) practices with the 8700K, revealing the performance variance that can occur when motherboard makers “cheat” results by boosting CPUs out of spec. MCE has become less of a problem with Z390 – namely because it is now disabled by default on all boards we’ve tested – but boosted BCLKs are the new issue.
If you think Cinebench is a reliable benchmark, we’ve got a histogram of all of our test results for the Intel i9-9900K at presumably stock settings:
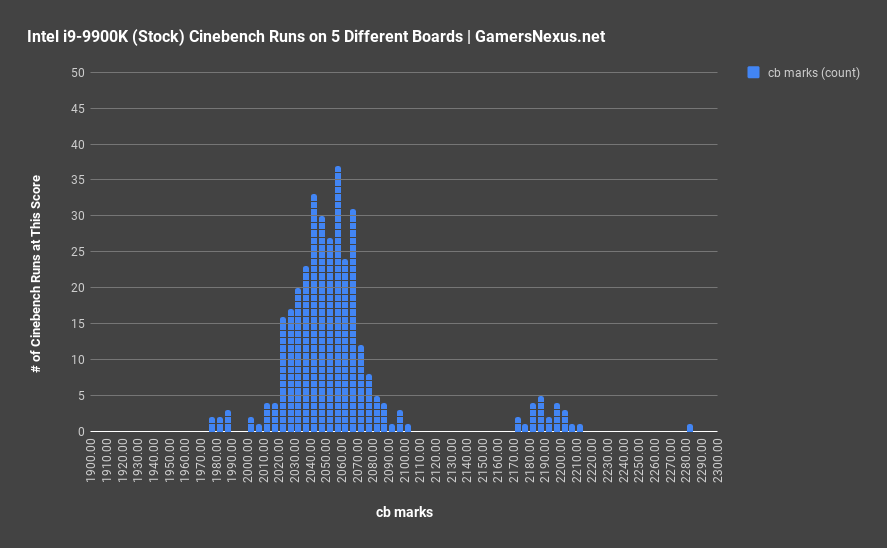
(Yes, the scale starts at non-0 -- given a range of results of 1976 to 2300, we had to zoom-in on the axis for a better histogram view)
The scale is shrunken and non-0 as the results are so tightly clustered, but you can still see that we’re ranging from 1970 cb marks to 2300 cb marks, which is a massive range. That’s the difference between a heavily overclocked R7 2700 and an overclocked 7900X, except this is all on a single CPU. The only difference is that we used 5 different motherboards for these tests, along with a mix of auto, XMP, and MCE settings. The discussion today focuses on when it is considered “cheating” to modify CPU settings via BIOS without the user’s awareness of those changes. The most common change is to the base clock, where BIOS might report a value of 100.00, but actually produce a value of 100.8 or 100.9 on the CPU. This functionally pre-overclocks it, but does so in a way that is hard for most users to ever notice.
Why BCLK Overclocking Affects Results
Base Clock impacts everything in the system. Increasing BCLK by even 1MHz will overclock the CPU by 50MHz in single-core Turbo, or about 47MHz in all-core Turbo. This will also increase the Ring/LLC clock, PCIe speed, memory frequency, and System Agent frequency. All of this contributes to overall faster performance, which is why we believe “stock” CPUs should be tested with a 100.00 BCLK. Anything higher (unless explicitly declared as an overclock) would be disingenuous to the CPU’s performance. If attributed instead to motherboard quality, it would again be disingenuous, just toward the motherboard makers instead. As long as any pre-overclocks are opt-in (not default) and are clearly disclosed, we are OK with pre-overclocking BCLK or multipliers. It is when they are increased quietly that problems emerge, and those problems are many-fold: (1) Review numbers will no longer match with user data if users (or reviewers, for that matter) miss a board that pre-overclocks the base clock; (2) power consumption will be measurably higher on boards which pre-overclock and run higher voltages to sustain these clocks; (3) stability becomes more of an issue – as users attempt to increase multiplier, assuming no knowledge of a natively offset BCLK, it is more likely that crashes are encountered; (4) as 3, except applied to memory – higher frequency memory will become less stable unless BCLK is increased to a point that memory dividers can be changed; (5) it is a slippery slope back toward MCE enablement by default, and will result in motherboard manufacturers playing games to appear better where no actual advantage exists.
We then must ask when natively higher base clocks are considered “cheating,” as opposed to a feature of the motherboard. This is something we’ll explore over the set of benchmarks below. We also discussed these choices with the manufacturers involved.
Test Platforms
For testing with this content, we are using the Intel i9-9900K with 16GB of Corsair Vengeance LPX 3200MHz CL16 memory. The power supply is an NZXT Hale90 v2 1200W 80 Plus Gold PSU, which is relevant in our EPS12V cable clamping tests. For the cooler, although irrelevant here, we are using our standardized NZXT Kraken X62 at full fan speeds. The motherboards are as follows:
- ASUS Z390 Maximus XI Hero
- ASRock Z390 Taichi Ultimate
- MSI Z390 MEG Godlike
- EVGA Z390 FTW
- Gigabyte Z390 Master
Z390 Motherboard Comparison & BCLK Differences
This testing primarily looks at BCLK differences, as this is a sneakier way to impact performance of parts without leveraging maxed-out ratios via MCE. This generation, all five of our boards ship with MCE disabled, so that’s great news.
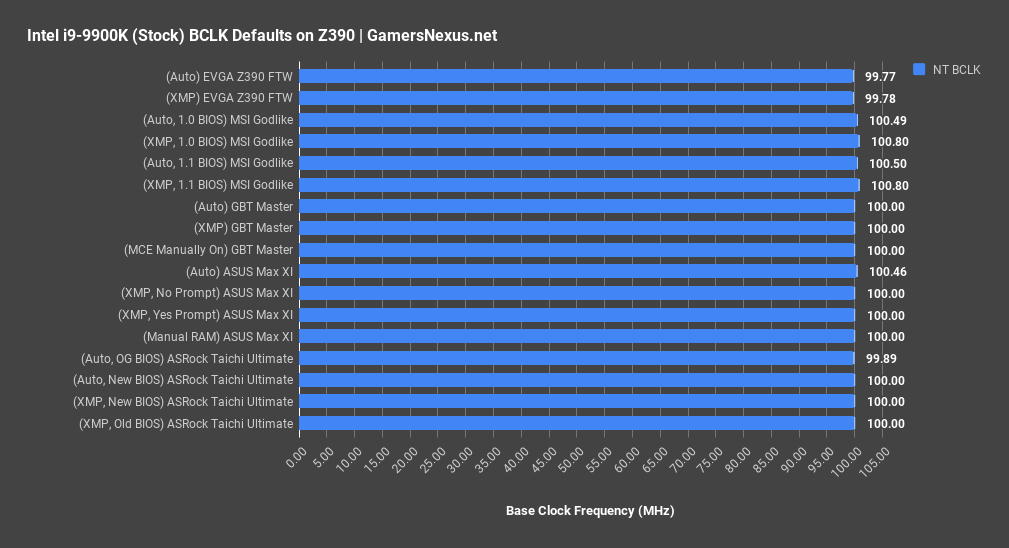
BCLK should be set to 100.0 by default for all motherboards. For the most part, the boards fall within this range. EVGA operates at around 99.8 and, although this might sound like a small reduction of only 0.2MHz, it does mean that all-core frequency ends up at 4690MHz instead of 4700MHz. Remember, this is the base number that the multipliers work against, ergo the difference multiplies. This isn’t really that big of a deal, though; 99.8 is close enough, and worst case is it’s undershooting, not overshooting. EVGA has some performance they could claw back if they wanted.
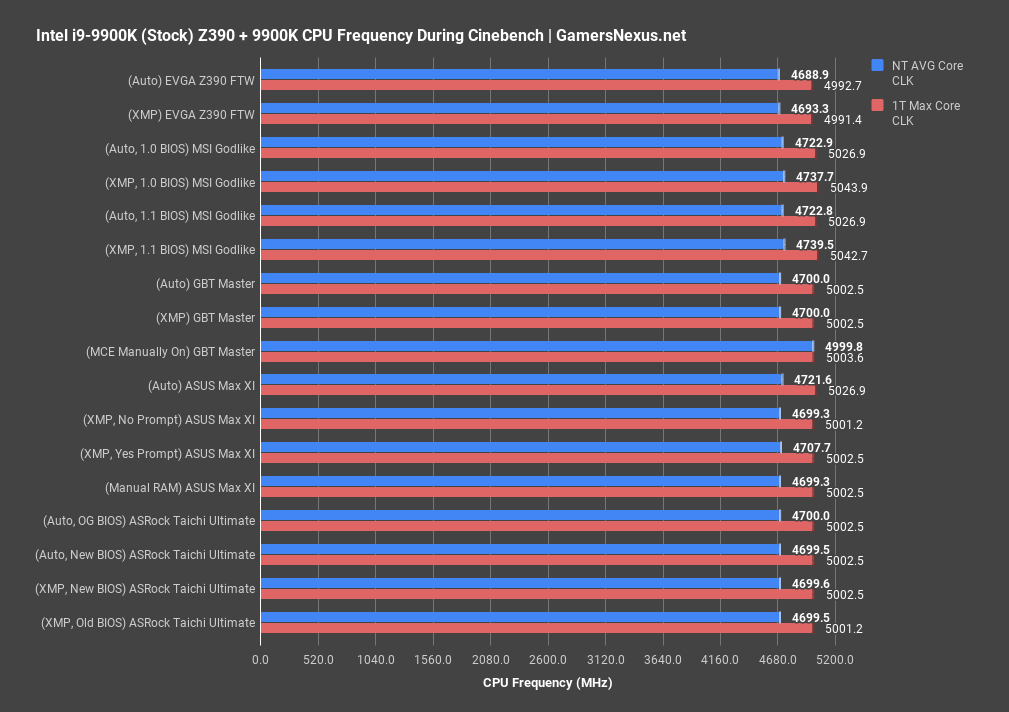
MSI really does some screwy stuff here. MSI maintains a 100.8MHz BCLK when XMP is enabled in either version of BIOS, or 100.5BCLK when the board is left to complete auto settings, i.e. out-of-the-box configuration. This means that the CPU runs about 40MHz higher natively, that RAM is also overclocked, PCIe is affected, Ring bus and SA are affected, and so on. MSI has boosted the numbers in a somewhat noteworthy fashion, and appears to be the only vendor doing this in such a sweeping way. We’ll come back to MSI in a moment, but let’s go through the rest of the boards first.
Gigabyte’s Master motherboard runs dead-steady at 100MHz in all our testing. Averaging thousands of cells of data, it’s about 99.999865, so we’d call that 100MHz. This is what the frequency should be, as 100MHz*47 = 4.7GHz. The ASRock board is also at around 100MHz in all tests, between both old and new BIOS revisions and with XMP on or off.
ASUS is the next of the boards that shows some questionable behavior: With XMP on or with settings manually adjusted, ASUS operates at 100.00MHz BCLK. That’s where it should be. With full default settings, ASUS operates at 100.5BCLK, which starts impacting performance results. Fortunately, this is only for full auto settings, and reviewers will almost always enable XMP. This eliminates most concern of data contamination. A good portion of users probably don’t know to enable XMP, though, and so will be running pre-overclocked unwittingly. 100.5 * 47 = 4724MHz. The ring clock runs at 4320MHz instead of 4300, system agent runs at 1005 instead of 1000, and single-core runs at 5027MHz instead of 5000MHz. Memory speeds are also affected.
We’ll come back to this more in a moment. To better illustrate how these BCLK changes impact performance, here’s a chart of multithreaded Cinebench scoring over all configurations.
Z390 Motherboard Impact on Cinebench Scores
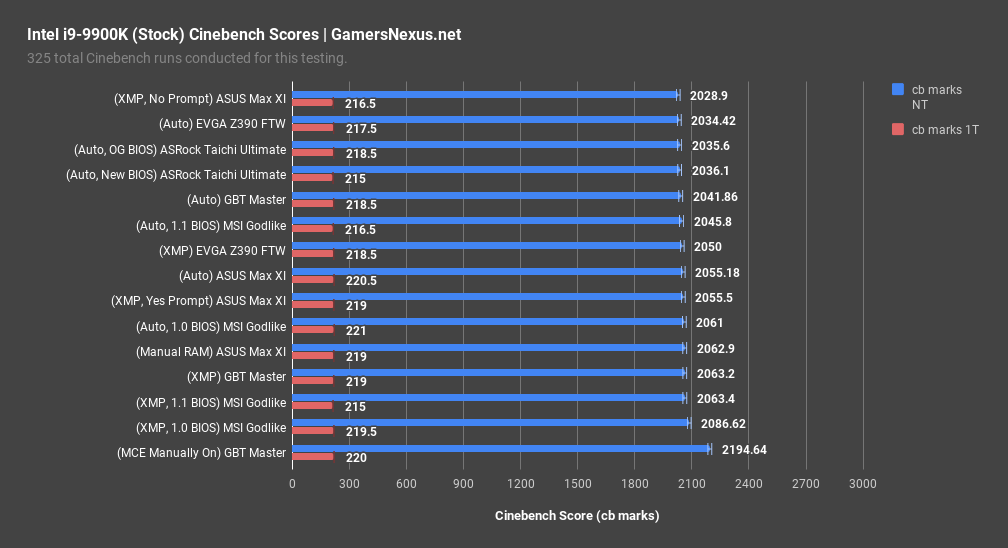
We should first point-out the outlier result: At 2195 points, Gigabyte’s Z390 Master motherboard is leveraging MCE to max-out all cores to the single-core Turbo of 5.0GHz. Here’s the thing: In this instance, MCE is OK, because it was a manual change made by us. Gigabyte does not try to trick MCE into being enabled under auto or XMP configurations. This is the correct way to do it, we think: they’re offering an option, but not sneaking it into a state of being on, and so we commend Gigabyte for this arrangement. ASUS does the same thing, for reference.
At the low-end, we have the ASUS Maximus XI Hero with XMP enabled and “no” selected when prompted for enhancement options. Performance is actually worse than depicted here, because the CPU is hitting ASUS power limitations on ICCMAX on occasion. We saw power throttling from 10.8A to 8.8A, or 129.6W to 105W, when running some Cinebench passes. It doesn’t always happen, but it power throttles enough to cause the low average score. The worst ASUS score was 1976 points, for reference. If we highlight the ASUS Maximus XI with Auto settings, you’ll see that it actually outperforms the board with XMP and “no” selected to the prompt. If ASUS is following power throttling to match Intel’s ICCMAX specification, they should probably also follow it under complete auto settings, not just with XMP on. We find this choice of behavior odd. Selecting “Yes” to the prompt results in a score of 2056 points, which is markedly higher than the 1976 to 2030 range we had with “No” selected, and roughly equivalent with the auto settings. That’s because the auto settings are using a 100.5BCLK, so it is able to achieve the same performance as with the memory under XMP.
Finally, MSI clearly holds an unfair lead. MSI’s BCLK of 100.8 is resulting in a 2087 score, significantly ahead of other boards that use lower base clocks. The next closest board is Gigabyte’s Master motherboard, which runs a BCLK of 100.
Z390 Motherboard Impact on Intel i9-9900K Power Consumption
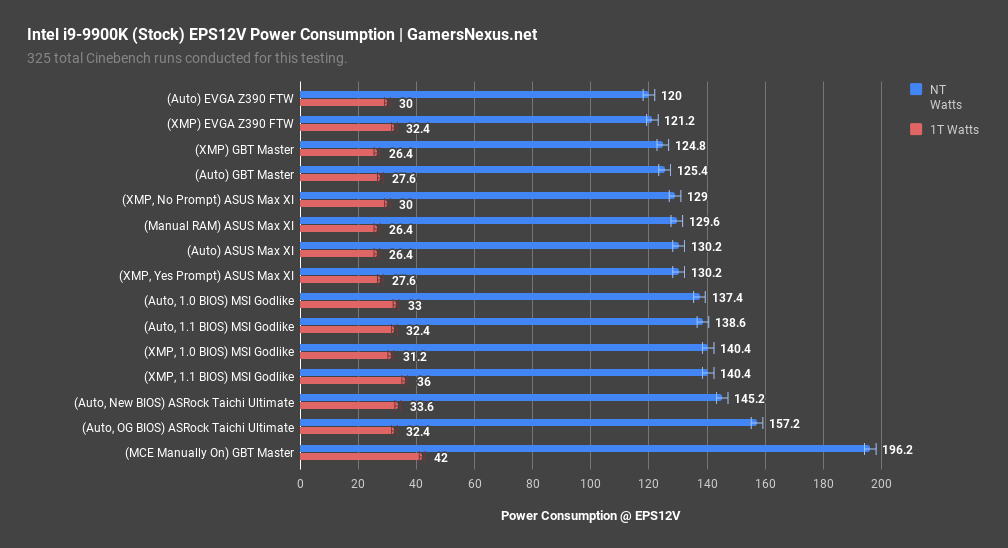
Power consumption is another major part of the story, and this one doesn’t carry the questionable variance and accuracy of Cinebench. For these tests, we are looking at clamped power draw down the EPS12V cables for each board.
EVGA runs the lowest power consumption, a consequence of also running lower voltages. The EVGA FTW operates a 120W EPS12V draw during both Auto and XMP tests. Gigabyte is adjacent at 125W, with all of the ASUS tests falling within range of 130W. Let’s again knock-out the outlier and address the 196W draw number: That’s from enabling MCE on the Gigabyte board which, again, is done manually by the user. Power consumption goes way up to support the 5GHz all-core overclock, as expected, and single-core power draw also increases. MSI draws significantly more power than the EVGA, Gigabyte, and ASUS motherboards, pushing upwards of 140W with its baseline configuration. This is a result of higher voltages sustaining a higher base clock, and this also contributes to temperature variance in results. We’ve talked about that in the past. Even still, ASRock’s board is aggressive in its power pulled down the EPS12V cables. With a 100BCLK and lower clocks than MSI, ASRock is blasting voltage unnecessarily and pulling 145W to 160W during tests. The updated BIOS is better by 12W, but still overkill when compared to everyone else. This board should be closer to EVGA and Gigabyte, and is overdrawing power.
Conclusion: Is It Cheating?
As in the intro to this piece, we noted that it’s not really “cheating” to natively boost BCLK so long as it is very clearly disclosed, and so long as it is an opt-in service to the end user. If this is enabled by default – and worse, if enabled by default and obfuscated – then it’s a problem. This is also true in MSI’s case, where the Godlike displays a “100” BCLK in BIOS, but is actually 100.8. ASUS is also implicated here, as the Auto setting on the Maximus XI Hero hides the BCLK field, but runs at 100.5. To ASUS’ credit, at least this is returned to a normal 100 value when XMP is enabled. Neither of these companies make it plain to the user that BCLK is being modified.
MSI claims that BCLK is set to 100.8 under its Z390 QVL (qualified vendor list) guidance for improving high-end memory support. This has merit in theory, but we are not sure that it does at the BCLK chosen. At 103, for instance, you would be able to use a lower memory multiplier in order to achieve a higher clock (like 4266MHz), but 100.8 does not provide that advantage. Memory is divisible and multipliable by fixed dividers and multipliers, e.g. 100/133/166, and so on. The math doesn’t work to support a 100.8 BCLK, although the clockgen may come into play here.
Either way, MSI admitted to us that running BCLK higher is a way to increase its competitive performance. One would think this might be a bombshell revelation, but MSI’s HQ team did not see the issue the same way we did: In its eyes, MSI is providing a competitive advantage, and so pre-overclocking BCLK to boost the CPU frequency is advantageous. We disagree, but would be curious what our readership and viewership thinks. Our concern is that this enters the precipice of a slippery slope, and one which could lead us back to default MCE enablement. It also could threaten stability at those higher memory clocks (despite the claims of increasing stability), as 100.8 * 42.66 is an overclock, and 100.8 * 41.33 is an underclock. Either way, it’s not the expectation of 100.00. That should be left to users to opt into, if desired. After all, this is a $600 motherboard. The user probably knows how to do such a thing.
The biggest problem is that of consistency of review data. Even in Principled Technologies’ scrutinized report, the company used MSI motherboards that (we now know) run a 100.8 BCLK. This means the PT tests had the Intel CPUs pre-overclocked by minimally 40MHz in some tests, and more in tests that are heavily pegging 1-2 cores (nearing a 50MHz offset). Other reviewers using MSI boards can control for this and might have, but the fact remains that it’s consumers who will end up confused. Manufacturers are slipping in sneaky pre-overclocks that affect performance, and are doing it in ways that are unexpected even by seasoned reviewers. The end result is a muddied pool of information for consumers, and that’s not good.
In our eyes, BCLK should be firmly 100.00MHz. In some instances of opt-in solutions with disclosures, a higher BCLK is acceptable (just like opt-in MCE is acceptable).