Today’s benchmark is a case study by the truest definition of the phrase: We are benchmarking a single sample, overweight video card to test the performance impact of its severe sag. The Gigabyte GTX 1080 Ti Xtreme was poorly received by our outlet when we reviewed it in 2017, primarily for its needlessly large size that amounted to worse thermal and acoustic performance than smaller, cheaper competitors. The card is heavy and constructed using through-bolts and complicated assortments of hardware, whereas competition achieved smaller, more effective designs that didn’t sag.
As is tradition, we put the GTX 1080 Ti Xtreme in one of our production machines alongside all of the other worst hardware we worked with, and so the 1080 Ti Xtreme was in use in a “real” system for about a year. That amount of time has allowed nature – mostly gravity – to take its course, and so the passage of time has slowly pulled the 1080 Ti Xtreme apart. Now, after a year of forced labor in our oldest rendering rig, we get to see the real side-effects of a needlessly heavy card that’s poorly reinforced internally. We’ll be testing the impact of GPU sag in today’s content.
Testing Notes
None of this uses any of our standardized test benches, as this is a one-off “feature” piece where we focus on a single aspect of a product – the sag, in this one. The bench was a real system for the last few years, with the 1080 Ti Xtreme since we reviewed it and retired it. The system uses two primary test configurations: For a dual-GPU test setup, we get to see the knock-on effect of GPU sag, primarily in that a secondary impact of a sagging GPU is that it is brought closer to the hardware below it; for the single-GPU setup, we get to see the result in the most traditional use case.
Note further that we are only testing with the one video card. These results cannot be extrapolated across all video cards, but should instead be looked at as a case study of a specific scenario, and one which can inform our understanding of how other cards will likely behave when sagging. We’ll talk about how the results can inform us in the conclusion.
Testing is heavily controlled, as always for our benchmarks. We set all system fans to 100% fan speed, with the primary GPU DUT fan to 55% (fixed). The lower GPU, when present, is set to 23% fan speed (the minimum) and performs no work. It is primarily a barrier to air access. FurMark is used as a power virus, with ambient temperature logged second-to-second with a thermocouple reader. We present data as Delta T over ambient in this dataset, although ambient is approximately 22C +/-1C for all tests. For the second round of tests, where thermocouples were mounted to a hotspot center MOSFET and a hot memory module (nearest the inductor line), note that GPU core thermal data is incomparable to the first round of tests. This is because the card had to be deconstructed, obviously, in order to mount the thermocouples, and so paste was cleaned and re-applied. We used the same paste that the factory used, so it’s close, but the difference is a year of age versus a new application. For this reason, the second test is intended to only be comparable against itself, useful for determining the impact of sag on VRAM or VRM temperatures.
Parts include:
- Gigabyte 1080 Ti Xtreme
- SilverStone PM01 with 3x intake + 1x exhaust stock fans (incl. with case) set to max speed
- Intel E5-2697 V2 CPU
- Thermaltake Big Water 3.0 cooler, top-mount, fans at max speed
- ASUS Rampage IV Extreme
- be quiet! Straight Power 11
Dual-GPU Sag Benchmark
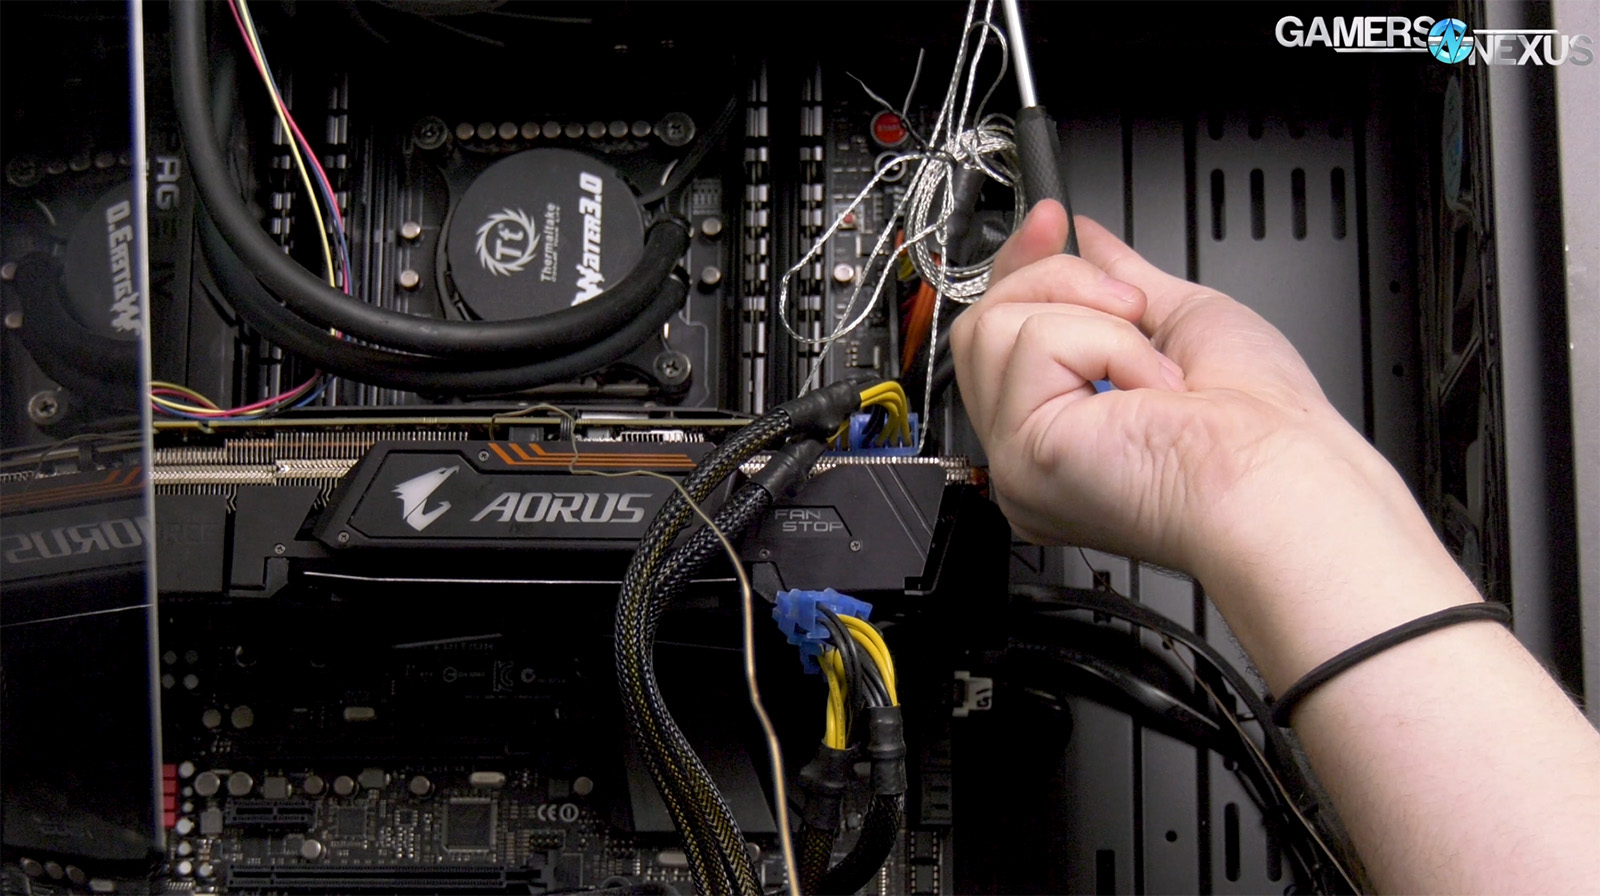
The first test is with two GPUs in our test system. We’ll show that system setup above, for the curious. Only the top GPU doing any work in our FurMark load, with the bottom GPU completely idle. Both GPUs are at a fixed fan speed, with the bottom at its minimum of 23% for the GTX 980 Ti reference card and the top at a fixed 55% fan speed. This is consistent for all tests beyond this point, too. The significance of a second card is that it creates an immediate barrier to the top card, and so sag will push the top card closer to said barrier.
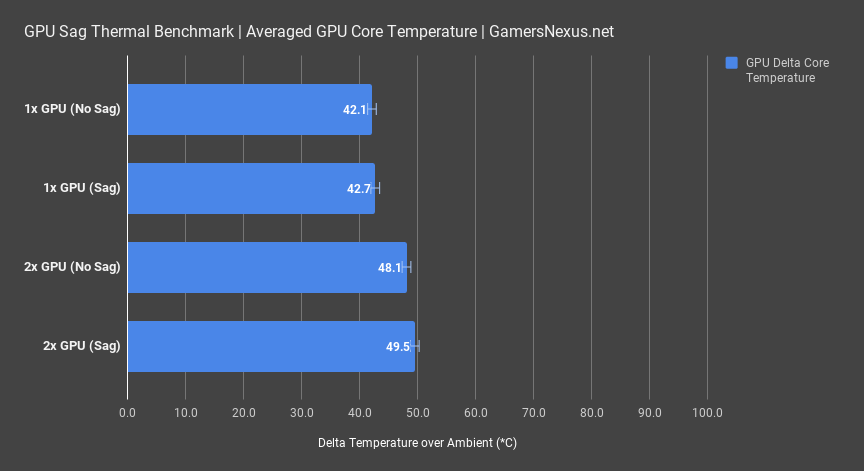
In the testing with two GPUs installed, we measured the performance when sagging at 49.5 degrees over ambient for the Gigabyte Xtreme 1080 Ti, or 48.1 degrees over ambient when sag is eliminated. This difference is outside of our error margins, but is overall insignificant. The same is true when looking at single-GPU numbers, where we plotted an average temperature of 42.7 degrees over ambient with sag, or 42.1 degrees over ambient without sag. This is within error margins and is not significantly different. As a sort of interesting aside, this chart consequently points-out how a second GPU, even when idle, will impact thermal performance of the primary GPU.
Keep in mind that this is just one GPU and that we cannot draw conclusions for all sagging GPU configurations from these numbers. Two other important factors come into play, both of which we’ll look at: First, NVIDIA’s GPU boosting algorithm is heavily thermal dependent, which means that we also must look at clock-rate to determine knock-on effects of changes to the environment; second, component temperatures, particularly toward the right-edge of the PCB, could be more affected than the GPU core temperature. We’ll attach thermocouples in a moment to look at MOSFET and VRAM thermals.
As for GPU frequency, this over-time plot will illustrate that pattern.
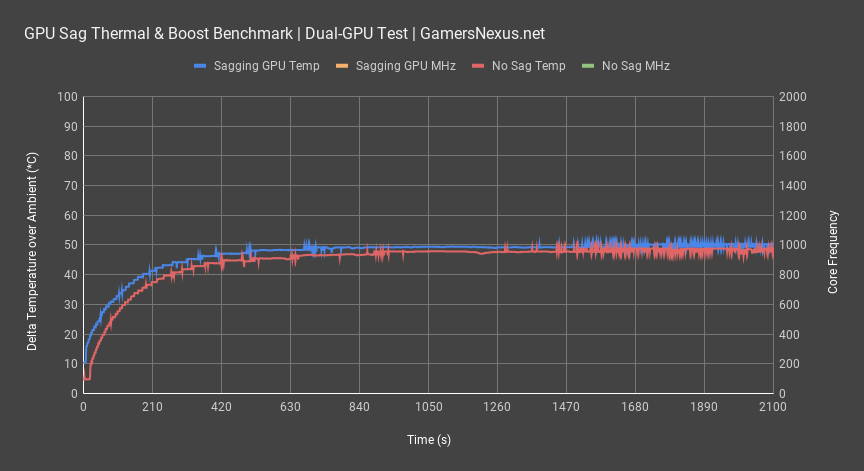
First, we’ll plot the GPU thermals again. Once we reach steady state, we begin averaging over 2000 cells of data for the numbers presented a moment ago. That data came from this distribution, though note that we’ve chopped the chart at 2100 seconds. The sagging GPU is consistently about 1-degree warmer than the non-sagging GPU, which makes sense when considering the distance between the first and second cards has increased, thus allowing more air to the primary card under test.
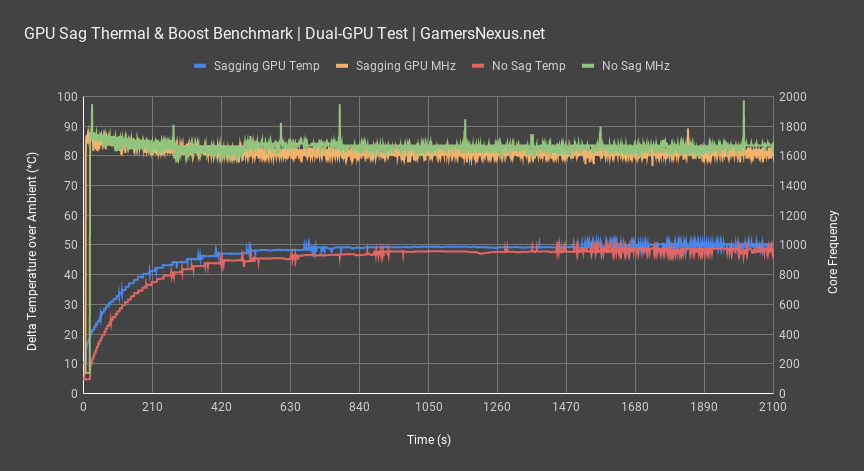
More importantly, here’s a look at the frequency for the sagging GPU. Overall, once steady state is reached, the average GPU frequency is exactly 1621.3MHz for the test. Again, that’s at steady state, so there is no further thermal movement. Next plotting the frequency line for the non-sagging GPU – after propping-up the same Gigabyte 1080 Ti Xtreme with an unobstructing block – we see an average steady-state frequency of 1656.9MHz exactly. The increase is about 35MHz, but our error margin for frequency measurement in this test is approximately 15MHz, so there’s not much significant change. Keep in mind that FurMark is also a power virus and that the frequency is instantiated differently than gaming scenarios, so overall frequency will be scaled below gaming frequencies. Realistically, this isn’t all that important. That’s basically the difference of one board partner’s overclock versus another, so you could make the case that a higher stock-clocked GPU that sags is about as useful as a lower stock-clocked GPU that doesn’t sag, but beyond that, it’s not a huge difference. It is, however, a difference, and so we are seeing real impact from the thermal hit caused by sagging closer to the second GPU. You’re talking maybe 1-3FPS AVG lost, depending on game, rendering the usefulness of this improvement sort of moot, but it’s still interesting data. We need to see how frequency looks when tested with a single GPU.
Single-GPU Sag Benchmark
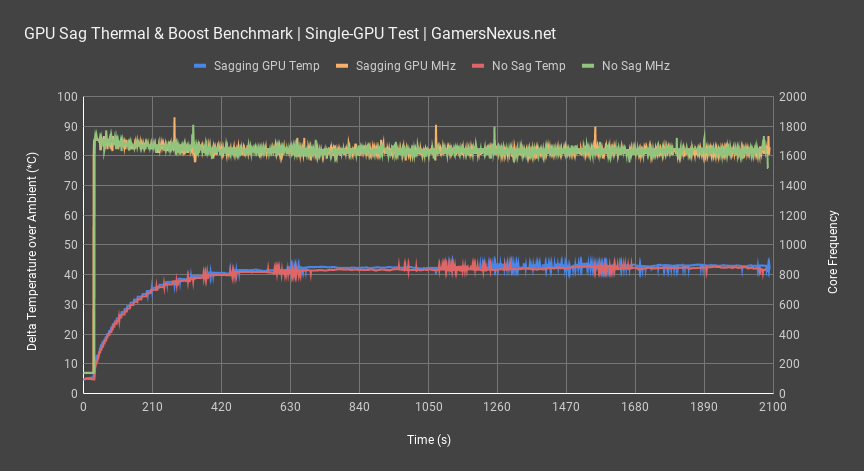
Plotted over time again, we see just how little variance there is between the thermal results on the single GPU configurations. Our scripting allows the testing to align almost perfectly in this plot and, with less than 1-degree delta second-to-second, we can call this a wash. It is well within error margins.
Adding frequency to the plot, we can also see that frequency variation is almost zero. Once at steady state, we averaged the frequencies to be 1632.2MHz for the sagging card and 1633.4MHz for the non-sagging card. We are within our rough 15MHz error margin and also within margin of the higher frequency for the dual-GPU test.
So far, there aren’t huge differences. The last place to check would be component temperatures, so we removed the GPU and disassembled it, then re-assembled it with thermocouples on a hotspot MOSFET and GDDR5X memory module. Keep in mind that this test data is incomparable to previous data as it required disassembly, and so new paste was applied. We ran two configurations: Single-GPU with sag and single-GPU without sag, comparable only to each other.
MOSFET & VRAM Thermals with GPU Sag
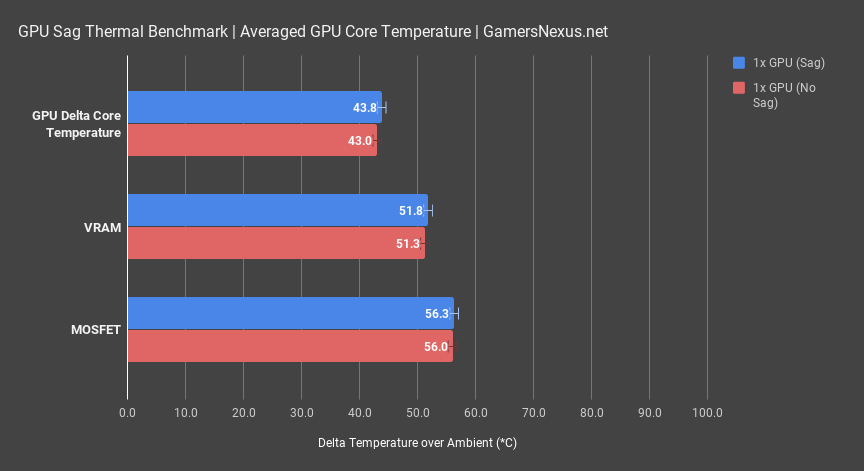
For this test, we measured GPU core thermals as within one degree of each other, yet again, placing within range of our first round of test results; note that these are incomparable as thermal paste changed, but the proximity to results is reassuring of test methodology.
For GDDR5X module thermals, we measured the sagging card at 51.8 degrees over ambient and the non-sagging card at 51.3 degrees over ambient. Both are well within spec and also within error margins, establishing no meaningful difference. MOSFET temperatures were within half a degree of each other, also well within error margins. Even when trying to find thermal differences in board components, like the MOSFET toward the right edge, we still could not establish any meaningful delta. The dual-GPU configuration produced the largest gap in thermals earlier, but even that was minor. This could also be used as a stand-in for cases where the PSU shroud is excessively close to the GPU.
Conclusion: Does GPU Sag Impact Temperature?
Keeping in mind that this is a case study in the truest sense of the word – a look at a single component configuration – we could not measure a meaningful thermal difference. This was a real-world test: We let a card sag naturally and over time, no synthetics or force involved, and then tested it in its home system. We’re not saying sag is good, but thermally, we don’t yet have evidence to support a massive thermal delta in this type of card. We still have concerns, some thermal, that relate to sag:
1 – Aesthetically, it just looks bad. That’s enough reason for some people to stay away from heavier or sagging cards.
2 – Over time, a card can pull itself away from the PCIe slot. It’s not like it’s going to fall out, as it’s still screwed in, but contact could become poor and eventually require a re-mount. We know of instances where users have lost display output because one of the pins wasn’t fully in contact with the slot. Not a catastrophic failure, but still something no one wants to troubleshoot.
3 – Over time, some cards that are particularly heavy on the right side, and which may have less right-side support than the 1080 Ti Xtreme we tested, could see further separation of thermal pads from the underlying components. This is something we’ve also seen online, but not something we’ve yet reproduced in the lab.
Our primary concern is that other cards, like those with a heavier cooler and a PCB which is well-supported, could see the cooler pulling away from the MOSFETs and right-side board components. That didn’t happen here, but if you’ve experienced it, let us know.
Overall, not as bad as we expected on this model. Thermals were fine. It’s just not particularly good-looking and might cause issues later on, but nothing today, and that’s one year on.
Editorial, Testing: Steve Burke
Testing: Patrick Lathan
Video: Josh Svoboda, Andrew Coleman