New CPU Bench Methodology - Best CPUs for Programming, Premiere, Photoshop, & 3D Art
Posted on
This is an exciting milestone for us: We’ve completely overhauled our CPU testing methodology for 2019, something we first detailed in our GamersNexus 2019 Roadmap video. New testing includes more games than before, tested at two resolutions, alongside workstation benchmarks. These are new for us, but we’ve added program compile workloads, Adobe Premiere, Photoshop, compression and decompression, V-Ray, and more. Today is the unveiling of half of our new testing methodology, with the games getting unveiled separately. We’re starting with a small list of popular CPUs and will add as we go.
We don’t yet have a “full” list of CPUs, naturally, as this is a pilot of our new testing procedures for workstation benchmarks. As new CPUs launch, we’ll continue adding their most immediate competitors (and the new CPUs themselves) to our list of tested devices. We’ve had a lot of requests to add some specific testing to our CPU suite, like program compile testing, and today marks our delivery of those requests. We understand that many of you have other requests still awaiting fulfillment, and want you to know that, as long as you tweet them at us or post them on YouTube, there is a good chance we see them. It takes us about 6 months to a year to change our testing methodology, as we try to stick with a very trustworthy set of tests before introducing potential new variables. This test suite has gone through a few months of validation, so it’s time to try it out in the real world.
Starter CPUs
Our goal for this testing was to get a relatively wide sweep of CPUs tested so that we could find any potential shortcomings of the testing approach. For this reason, we have an eclectic mix of CPUs, but did put most of our emphasis on testing the R7 2700(X), i9-9900K, and R5/i7 CPUs, as we know these are the most interesting to our audience. Here’s the list of initial CPUs we tested, with more to be added as we go:
- AMD R5 2600
- AMD R5 2600X
- AMD R7 2700
- AMD R7 2700X
- AMD TR 2990WX (in most benchmarks)
- Intel i5-8600K
- Intel i7-8700K
- Intel i7-9700K
- Intel i9-9900K
Most of these CPUs were also overclocked for a second pass through the entire test suite. A full run on the test suite, including games (not featured today), takes approximately 8 hours per CPU, plus another ~8 hours for the overclocked variant. We try to keep them running relatively non-stop and around the clock when we’re working on CPU content.
We are still adding CPUs. This is a 'pilot episode' of our new workstation testing!
CPU Test Methodology
Our CPU testing methodology is split into two types of benchmarks: Games and workstation workloads, but every CPU which is sufficiently high-end will go through both sets of tests. We are beginning to spend more effort publicly documenting the exact versions of our tests, hoping that this is helpful to those reading our tests. We are also detailing more explicitly the unit of measurement in text, although our charts typically do this as well. Our workstation benchmarks include the following tests:
- 7-ZIP Compression benchmark (version 1806 x64). Unit of measurement: MIPS (millions of instructions per second; higher is better)
- 7-ZIP Decompression benchmark (version 1806 x64). Unit of measurement: MIPS (millions of instructions per second; higher is better)
- 7-ZIP dictionary size is 2^22, 2^23, 2^24, and 2^25 bytes, 4 passes and then averaged. Thread count equals the CPU thread count.
- Blender 2.79 GN Logo render (frame from GN intro animation, heavy on ray-tracing). Unit of measurement: Render time in minutes (lower is better)
- Blender 2.79 GN Monkey Heads render (CPU-targeted workload with mixed assets, transparencies, and effects). Unit of measurement: Render time in minutes (lower is better).
- GNU Compiler Collection (GCC) version 7.4.0, compiling 8.2.0 on Windows 10. Unit of measurement: Render time in minutes (lower is better). Run with Cygwin environment.
- Chaos Group V-Ray CPU Benchmark (1.0.8). Unit of measurement: Render time in minutes (lower is better)
- Cinebench R15 (used for internal validation). Unit of measurement: CB Marks (higher is better)
- TimeSpy Physics. Unit of measurement: 3DMark points & FPS (higher is better)
- Adobe Photoshop CC 2019 (Puget 18.10). Unit of measurement: Average score (higher is better)
- Adobe Premiere & AME CC 2019 (GN test suite: 1080p60 convention shot; H.264, 35Mbps, 5.2, High profile, AAC+Version 2, Audio 256K). Unit of measurement: Render time in AME (lower is better). CUDA enabled.
- Adobe Premiere & AME CC 2019 (GN test suite: 4K60 aroll+broll; H.264, 35Mbps, 5.2, High profile, AAC+Version 2, Audio 256K). Unit of measurement: Render time in AME (lower is better). CUDA enabled.
- Adobe Premiere & AME CC 2019 (GN test suite: 4K60 charts; H.264, 35Mbps, 5.2, High profile, AAC+Version 2, Audio 256K). Unit of measurement: Render time in AME (lower is better). CUDA enabled.
All tests are conducted multiple times for parity and then averaged, with outliers closely and manually inspected. The number of times tested depends on the application and its completion time. We use an internal peer review process where one technician runs tests, then the other reviews the results (applying basic logic) to ensure everything looks accurate. Any stand-out results are reported back to the test technician and rerun after investigation. Error margins are also defined in our chart bars to help illustrate the limitations of statistical relevance when analyzing result differences. These are determined by taking thousands of test results per benchmark and determining standard deviation for each individual test and product. Any product that has significant excursions from the mean deviation will be highlighted in its respective review.
GN CPU Test Bench 2019
| Product | Courtesy Of | |
| CPU | This is what we're testing! | GN, Intel, & AMD |
| Motherboard | See article, changes per CPU | Various |
| RAM | Corsair Vengeance LPX 4x8GB 16-18-18-36 | Corsair |
| Video Card | EVGA RTX 2080 Ti XC Ultra | EVGA |
| PSU | EVGA SuperNOVA T2 1600W | EVGA |
| CPU Cooler | NZXT Kraken X62 280mm | NZXT |
| SSD | Samsung 860 EVO 250GB | GN |
| Project/Game SSD | Samsung 860 PRO 1TB | GN |
Motherboards used are varied based upon platform. Where compatible, we used the following:
- ASUS Maximus XI Hero Z390
- ASUS Crosshair VII Hero X470
- MSI MEG X399 Creation
Although we’d all love to run numerous test benches simultaneously, we have determined that GPU silicon variance can significantly alter results even within the same video card model. As such, we only one run bench at a time, and we always use the same GPU. Driver version 417.71 is used. Adaptive sync is not used in testing.
MCE is always disabled on test platforms, ensuring that turbo boost durations should be running within specifications set by the CPU manufacturer. We also try to keep an eye out for other motherboard trickery, like MSI’s oft-boosted BCLK, and then reset to stock settings when applicable. XMP is used on the Corsair memory in our test benches.
GNU Compiler Collection
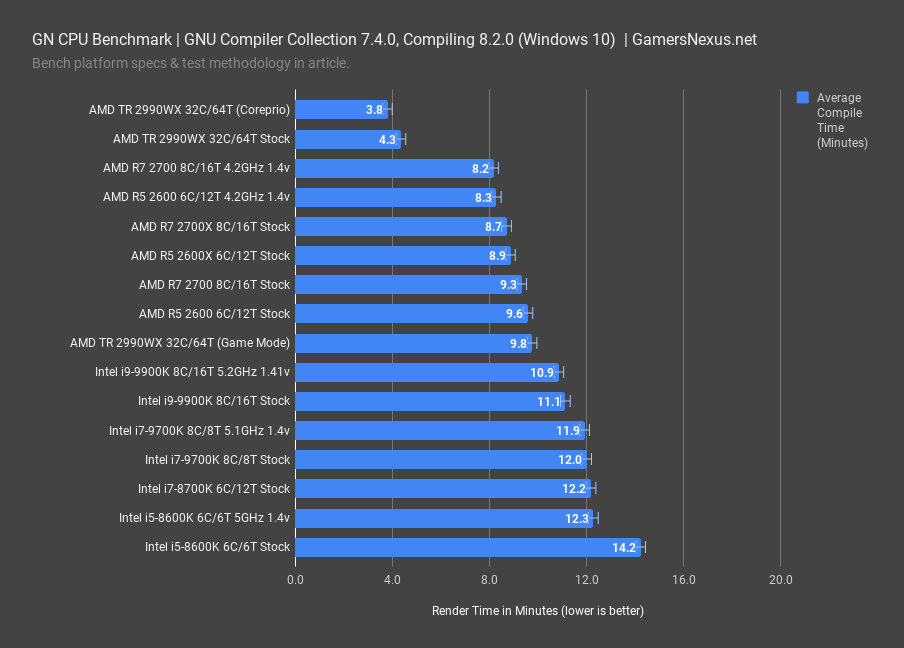
We had a lot of requests to add compiler benchmarks to our test suite, so we finally did. For this, we’ve added the GCC Benchmark, which involves compiling the GNU Compiler Collection version 8.2.0 with GCC version 7.4.0. We set a flag to allow it to spawn as many threads as possible, so the compilation process involves both some single-threaded and heavily multi-threaded parts. Interestingly, the results for this test are the inverse of many of the gaming tests that we’ll next publish, with all the AMD chips on top and all the Intel chips at the bottom. The 2990WX with Coreprio enabled logged the fastest time and an 11% time reduction versus the stock 2990WX. The AMD chips below this are ordered predictably: the 4.2GHz 16-thread 2700 is at the top, allowing the 2990WX a time reduction of about half, with the R5 2600 at 4.2GHz following the 2700. This shows that frequency still matters, as it outpaces the 2700X stock CPU marginally. The R7 2700X’s 8.7-minute compile time leads the 9900K stock CPU by 22%, a meaningful improvement. The 9900K leads the Intel CPUs, and again the order is predictable: other than the AMD/Intel divide, the CPUs are logically ordered by the highest frequency/core count parts, with the stock 8600K at the very bottom. Frequency and core count are important factors, but they aren’t everything, and this is one real-world workload that shows it.
Note that other compilers may behave differently, and also that linking is a factor worthy of consideration. If using linkers that are typically single-threaded, this can pose a bottleneck. We are also doing all of our testing on Windows, and so Linux workloads would further exhibit different behavior.
7-Zip Compression / Decompression CPU Workstation Benchmark
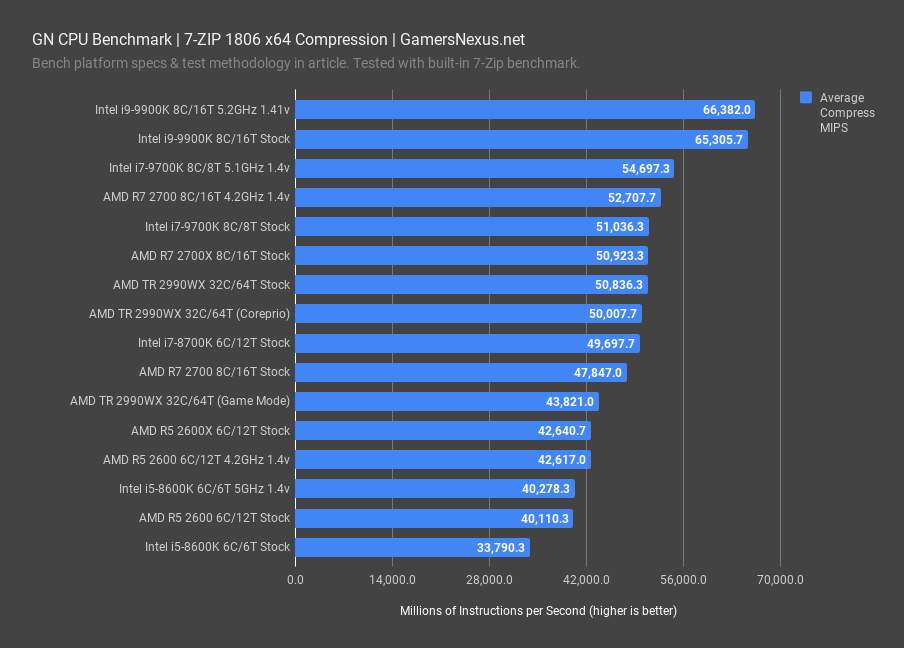
7-Zip includes a built-in benchmark that can generate scores for both compression and decompression measured in millions of instructions per second. Interestingly, decompression appears to be more thread-dependent than compression. The 9900K leads in compression by a good margin, with 21.4% more instructions per second than the 9700K when both are overclocked, so threads still do affect the score. The worst performer in this category is the stock i5-8600K with only 6 cores and 6 threads, but the 32 core/64 thread 2990WX only lands in the middle of the chart. We seem to be constrained to some extent by single-threaded performance.
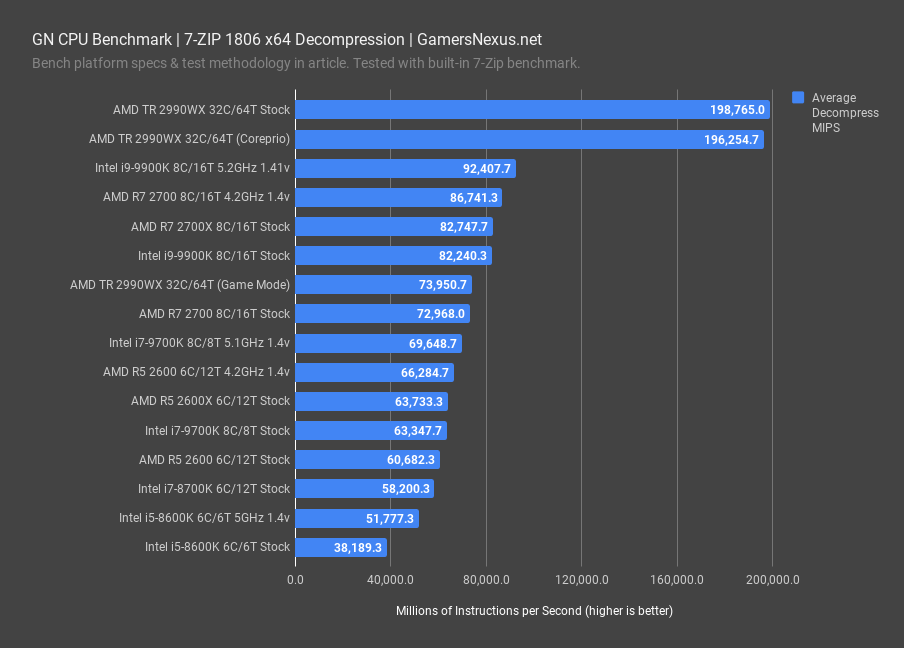
In decompression, however, Threadripper tears ahead of anything else with 115% more instructions per second than the overclocked 9900K. The stock AMD R7 2700X and overclocked R7 2700 actually manage to beat-out the stock i9-9900K, although overclocking to 5.2GHz does allow it to regain the lead at the expense of power. The stock 2700 outperforms the overclocked 9700K at 5.1GHz, illustrating a limitation in the i7’s thread count as the R7 gains a 5% lead. Even the R5 2600 at 4.2GHz nearly keeps-up with the OC 9700K.
Adobe Photoshop CC 2019 CPU Benchmark
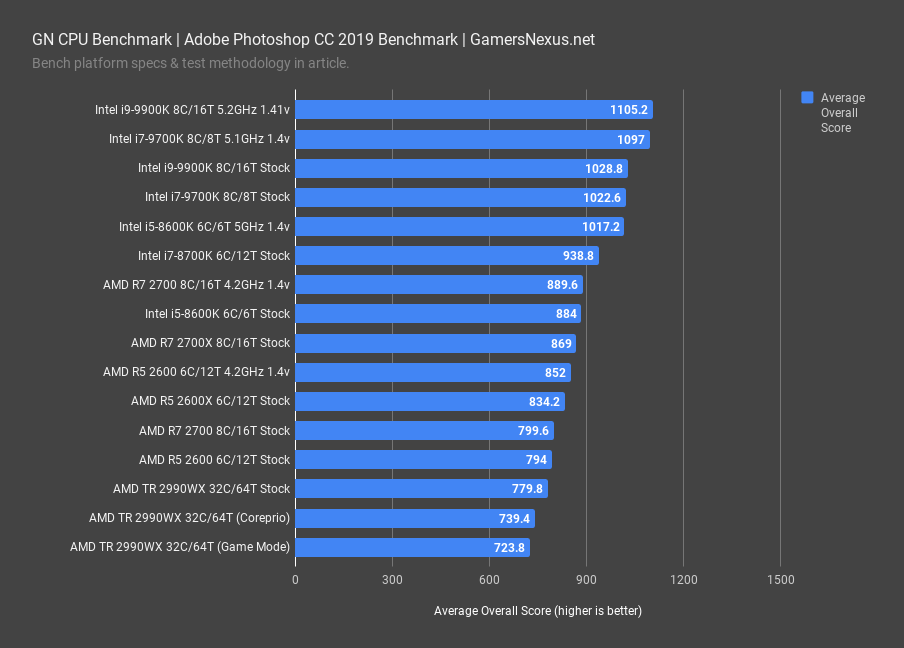
We’re now using Puget Systems’ Photoshop benchmark. It recommends 32GB of system memory, which is the main reason we now use four 8GB sticks of RAM for all of our tests rather than just for CPUs that can run memory in quad-channel. We run the extended version of the benchmark, which produces seven scores as well as an overall score to summarize them. Thread-count isn’t much help here, and the 5.2GHz 9900K tops the chart again. The chart is roughly ordered by CPU frequency, with the 2990WX scoring slightly worse than the stock R5 2600, even with game mode or Coreprio. The ordering by frequency is further illustrated by the 8600K at 5GHz outperforming a stock 8700K, or the 9700K at 5.1GHz outperforming the stock 9900K. Photoshop appears to be frequency-bound in these tests, which include the application of various filters, transforms, resizes, photomerges, and more.
Blender CPU Benchmarks
Blender benchmarking has also changed with this round. We’re keeping our in-house made benchmark scenes, using realistic workloads with ray tracing, movie-ready render settings, and realistic effects. We’ve eliminated the Blender 2.78 monkey head render testing and the temperamental 2.79 Splash render, leaving only the Blender 2.79 monkey head and GN logo renders. The monkey heads are a varied workload, while the logo hammers the CPU and is typically the test that causes unstable overclocks to reveal themselves. Blender is an important test to us because we actually use it, and it directly benefits us to know which CPUs handle it best.
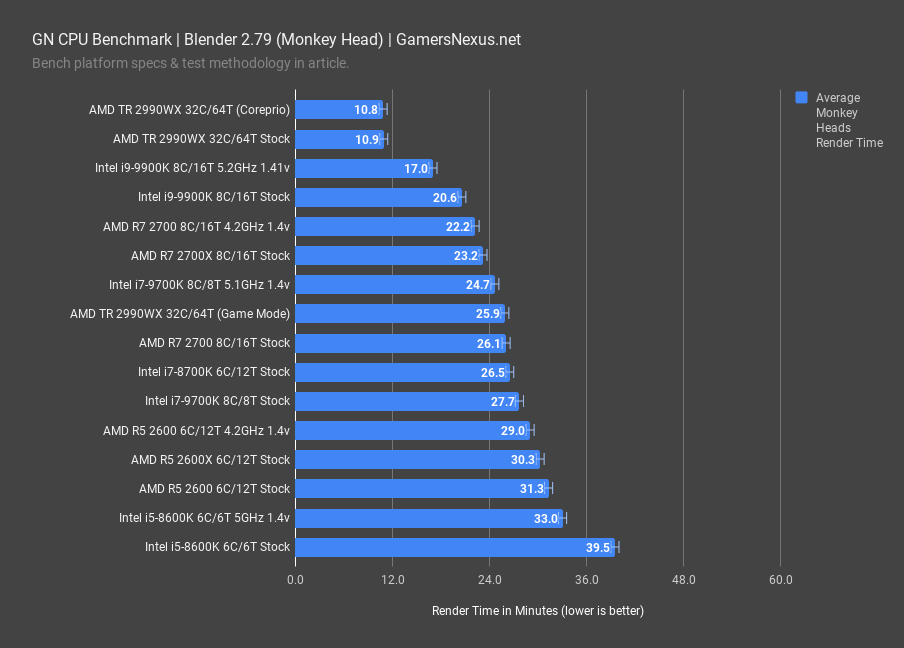
Let’s start with the monkey head render. The 2990WX takes this test handily with its 64 threads, and the rest of the stack lines-up in a similar order to other thread-bound workloads, with the 9700K being the only CPU breaking the more cores/higher score pattern. The 2990WX finished testing in 10.9 minutes stock, roughly the same with Coreprio, and demonstrates clear value to professionals who work in tile-based rendering applications like Blender. The biggest value add is when high system memory requirements exist, as this can rapidly exit confines of GPU memory allotment, thus limiting usefulness of CUDA. We still need to retest our HEDT Intel CPUs, so Threadripper remains relatively isolated for now.
![]()
The 9900K at stock completes its render in 20.6 minutes, a time reduction of 11% from the stock R7 2700X’s 23-minute render time. The 2700X comes close, given the price difference, and that’s because Blender tends to favor thread count since it spawns one tile per thread.
For the GN Logo render, the TR 2990WX obviously still leads, and will until further updates to the chart. The 9900K stock CPU roughly equates an overclocked 2700 at 4.2GHz, although outperforms the stock 2700X with a 6% render time reduction. The stock 2700 and stock 9700K also end up roughly tied, with the 8700K approaching both of these CPUs.
Adobe Premiere CC 2019 CPU Benchmarks
Premiere is a test that we’ve done in the past, but haven’t kept up with faithfully due to the amount of manual setup required. Our last Adobe Premiere test was with our old test methodology, where we showed the Intel 28-core 3175X proving genuinely good when overclocked. It drew a hell of a lot of power, but it also managed the fastest render times, even outperforming the 9980XE. We haven’t retested that with our new test suite just yet, but we do have the more mainstream CPUs tested for today.
We’ve streamlined the process and we’re now rendering three videos: one at 1080p60, one at 4K60, and one 4K video consisting entirely of charts. H.264 is our codec for these for now, with a high profile and 35Mbps output. We have video clips of these in our video embedded above, in case you want to see what they're rendering.
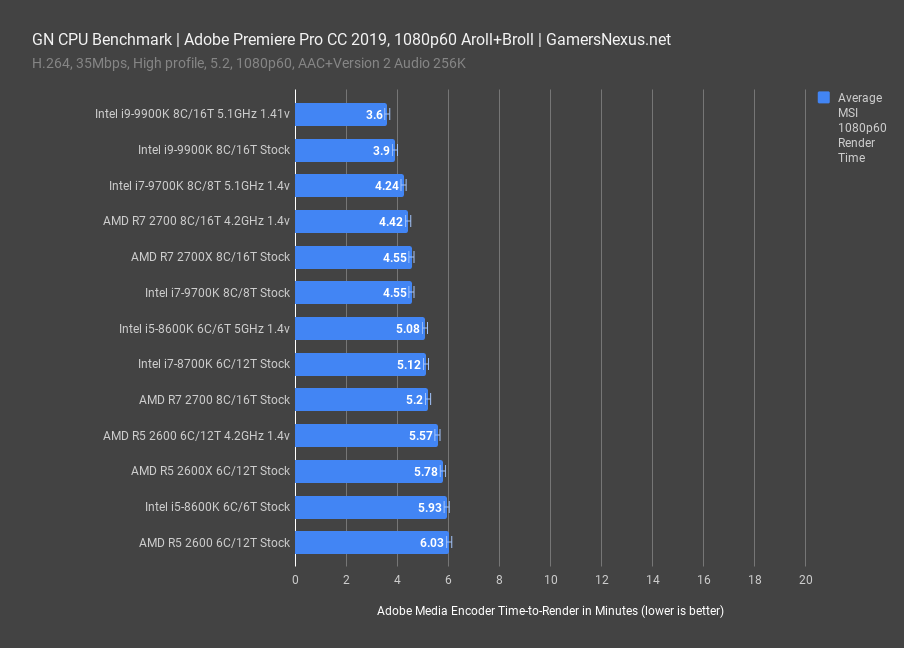
Starting with the 1080p60 a-roll and b-roll footage from a convention, where we used clips entirely off of our Panasonic UX180 and recorded through our Zoom audio devices, we get the chart on the screen now. We haven’t yet put the 9980XE or 3175X on here yet, but they’d probably outpace the 9900K’s 3.9-minute render. Render times reduced by nearly 8% with an overclock to 5.1GHz. The 9700K at 5.1GHz shows that, despite being frequency-locked with our chart-topping 9900K, the extra threads are beginning to help more as Adobe Premiere Pro CC 2019 updates. The 9900K at 5.1GHz holds a lead of 15% over the 9700K, advantaged by its double thread count. AMD’s R7 2700 at 4.2GHz and 2700X finish the render in about 4.4 to 4.55 minutes, landing roughly equal to the stock 9700K. Despite increasing thread utilization, Premiere still likes higher frequencies. This much is proven by comparing the 2700 stock result of 5.2 minutes to the OC result, where we see a reduction of 13% versus baseline.
The R5 2600 at 4.2GHz does exceptionally well when considering its more budget-oriented positioning, although professionals who use Premiere every single day may still want to consider the higher-end options at the top of the chart.
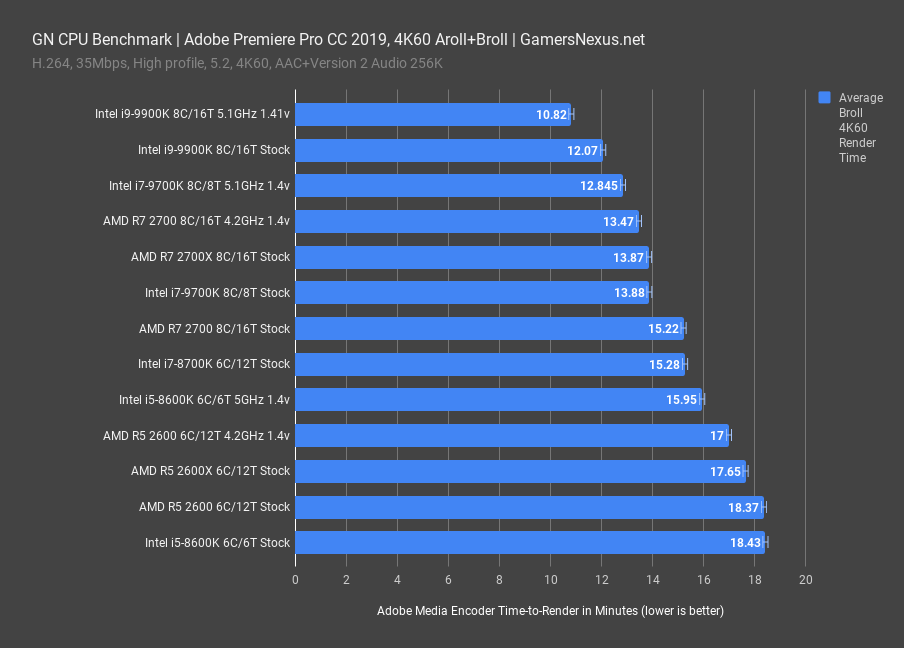
Our 4K60 aroll+broll render was more intensive, clearly, as it’s dealing with a higher quality output. The 9900K OC finishes this render in 10.8 minutes, which is a render time reduction of 10% from baseline. The stack is almost exactly the same for these tests, except the 2700 stock and 8700K reshuffle, but they’re within error margins of each other in both tests. The difference between a 2700X and a 9900K, both stock, is that the 9900K finishes its render in 13% less time.
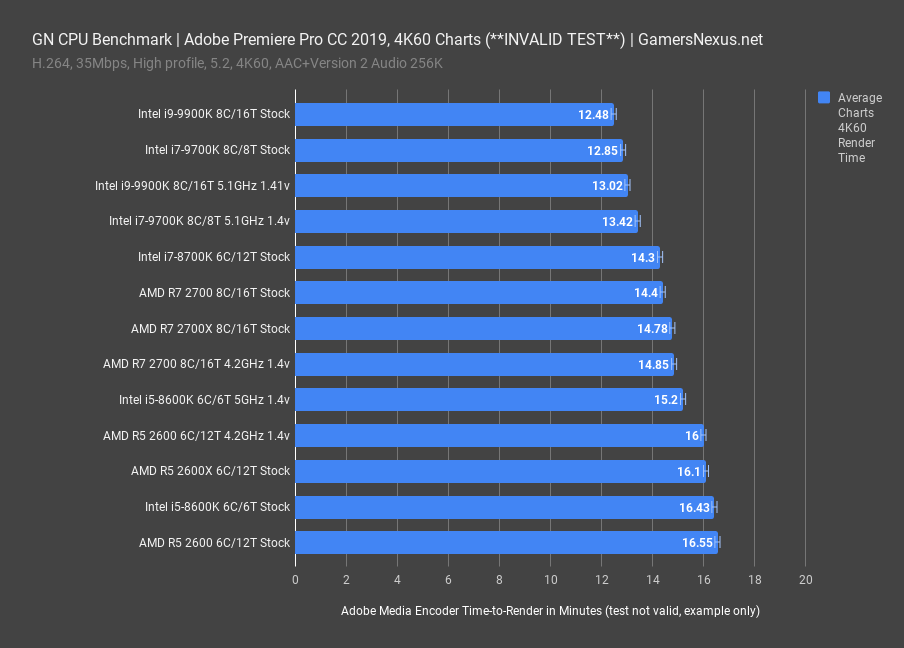
Above: Invalid testing found as a result of shifting workload to other components.
The chart render in particular seems to be a lighter workload, and we will be scrapping it moving forward. This is an illustrating of a workload that isn’t as heavily reliant upon the CPU, and we see CUDA kicking-in to help more frequently with our chart renders. That’d be what you’re seeing on the screen now. Because of how scattered these results are, especially with how unreliable the differences are, we must scrap it in the future.
V-Ray
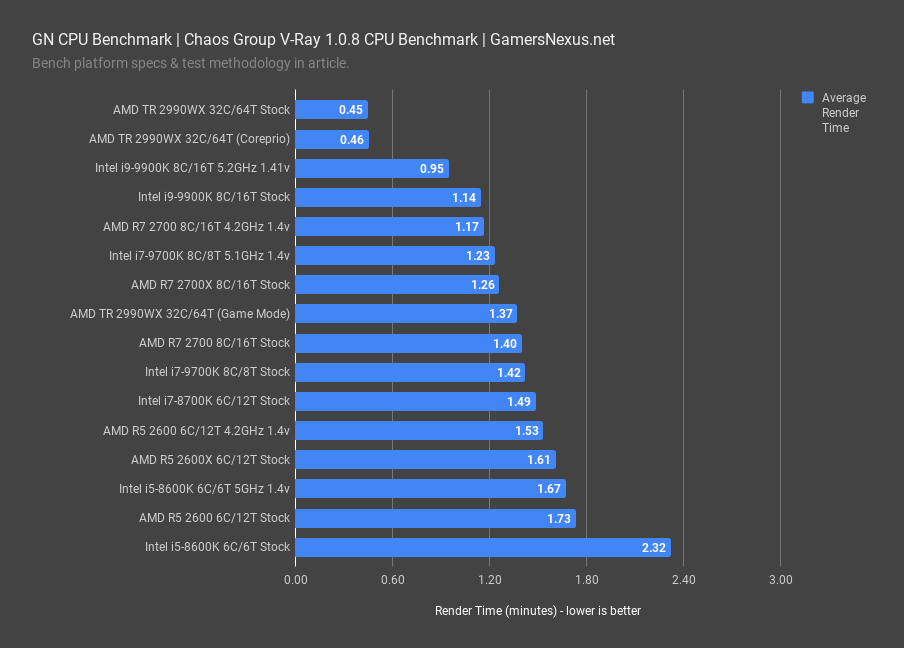
Chaos Group’s V-Ray benchmark includes a GPU and a CPU test, but we use the command line interface and only run the CPU one. It takes between 1 and 2 minutes to complete on most of our CPUs, and the results align closely with the Cinebench and Blender render benchmarks, with the higher thread-count CPUs like the 2990WX and 9900K heavily advantaged, leaving the stock 8600K in dead last. Until we retest our HEDT Intel CPUs, the 9900K at 5.2GHz is Intel’s highest result on our chart. This one completes the workload in 0.95 minutes, allowing the 2990WX a time reduction of about 52%. This demonstrates that V-Ray actually leverages the threads available to it and, although the 9900K does well to keep up with an HEDT part, extra threads do win-out in this test. The 2700 at 4.2GHz outperforms an overclocked 9700K, demonstrating again the thread advantage, but is barely beaten by the 9900K stock CPU. Price is a factor, granted, and the 2700 comes in about $265 cheaper. The R5 2600 at 4.2GHz lands at 1.53 minutes, putting it within range of the 8700K stock CPU.
Conclusion
As stated earlier, this is more meant to debut our new workstation test cases. We have a big list of additional testing ideas, but for now, we’ll start with this benchmark assortment. Gaming benchmarks are next due for publication, with our target being before end of April. We should easily hit that target.
These tests better show the differences between core count and frequency scaling than previously, as we only ever really used Blender for workstation-class testing in the past. With the new additions, we can see where some software, like Adobe’s, benefits more from a high-end mainstream desktop CPU than from an HEDT CPU, whereas Blender or 7-Zip decompression workloads benefit heavily from higher core counts. GCC tests also give some insight into what programmers deal with, albeit from our Windows test environment.
We still have more to do, but we’re happy with this list for now. Keep an eye out for our revamped CPU gaming benchmarks as we continue to work on them.
Editorial, Test Lead: Steve Burke
Testing: Patrick Lathan
Video: Josh Svoboda