One of our most popular videos of yore talks about the GTX 960 4GB vs. GTX 960 2GB cards and the value of choosing one over the other. The discussion continues today, but is more focused on 3GB vs. 6GB comparisons, or 4GB vs. 8GB comparisons. Now, looking back at 2015’s GTX 960, we’re revisiting with locked frequencies to compare memory capacities. The goal is to look at both framerate and image quality to determine how well the 2GB card has aged versus how well the 4GB card has aged.
A lot of things have changed for us since our 2015 GTX 960 comparison, so these results will obviously not be directly comparable to the time. We’re using different graphics settings, different test methods, a different OS, and much different test hardware. We’ve also improved our testing accuracy significantly, and so it’s time to take all of this new hardware and knowledge and re-apply it to the GTX 960 2GB vs. 4GB debate, looking into whether there was really a “longevity” argument to be made.
Note further that this becomes a discussion of image quality in addition to performance, as higher framerates can be had by silently (but often noticeably) reducing image quality in the game. Not all games do this, although some will lower texture quality or object detail against the player’s settings, meaning that a comparison may not be truly head-to-head if changes silently happen.
For this testing, we locked the memory frequencies and GPU clocks to be identical. Because this is Bosot 2.0 and doesn’t use modern thermal-dependent GPU boosting, it’s easy to get the clocks 100% matched between two different models. The only difference becomes the memory capacity. As a further reminder, people often reference Windows Task Manager or GPU-Z for “memory consumption,” or OSDs, but these only show the memory allocated to or requested by the software, not necessarily the literal memory in use. Applications often request far more than they need, which means we can’t rely on a straight “memory utilization” figure to determine if 2GB vs. 4GB is sufficient; instead, we have to look at image quality comparisons and frametimes.
GPU Test Bench
Component | Courtesy of | |
CPU | GamersNexus | |
GPU | This is what we’re testing! | Often the company that makes the card, but sometimes us (see article) |
Motherboard | ASUS | |
RAM | Corsair | |
PSU | Corsair | |
Cooler | NZXT | |
SSD | Plextor 256-M7VC | GamersNexus |
Sniper Elite 4

Sniper Elite 4 is the absolute best example to start with, and it’s because the FPS numbers completely betray what’s happening on the screen. If we look at our GPU bench chart at 1080p in Sniper Elite 4, you’ll see that the GTX 960 Strix 2GB card actually posts a 57FPS AVG, with lows well-spaced at 41FPS and 39FPS. Comparatively, the GTX 960 SSC 4GB card is within margin of error, at 58FPS AVG. Lows are also within our wider error margins for the smaller datasets of 1% lows. As a framerate, it looks like there’s no difference, and that the 4GB card might actually be “overkill,” as you could postulate that the rest of the GPU doesn’t keep-up enough for the memory capacity to matter. In reality, we need an image quality comparison.
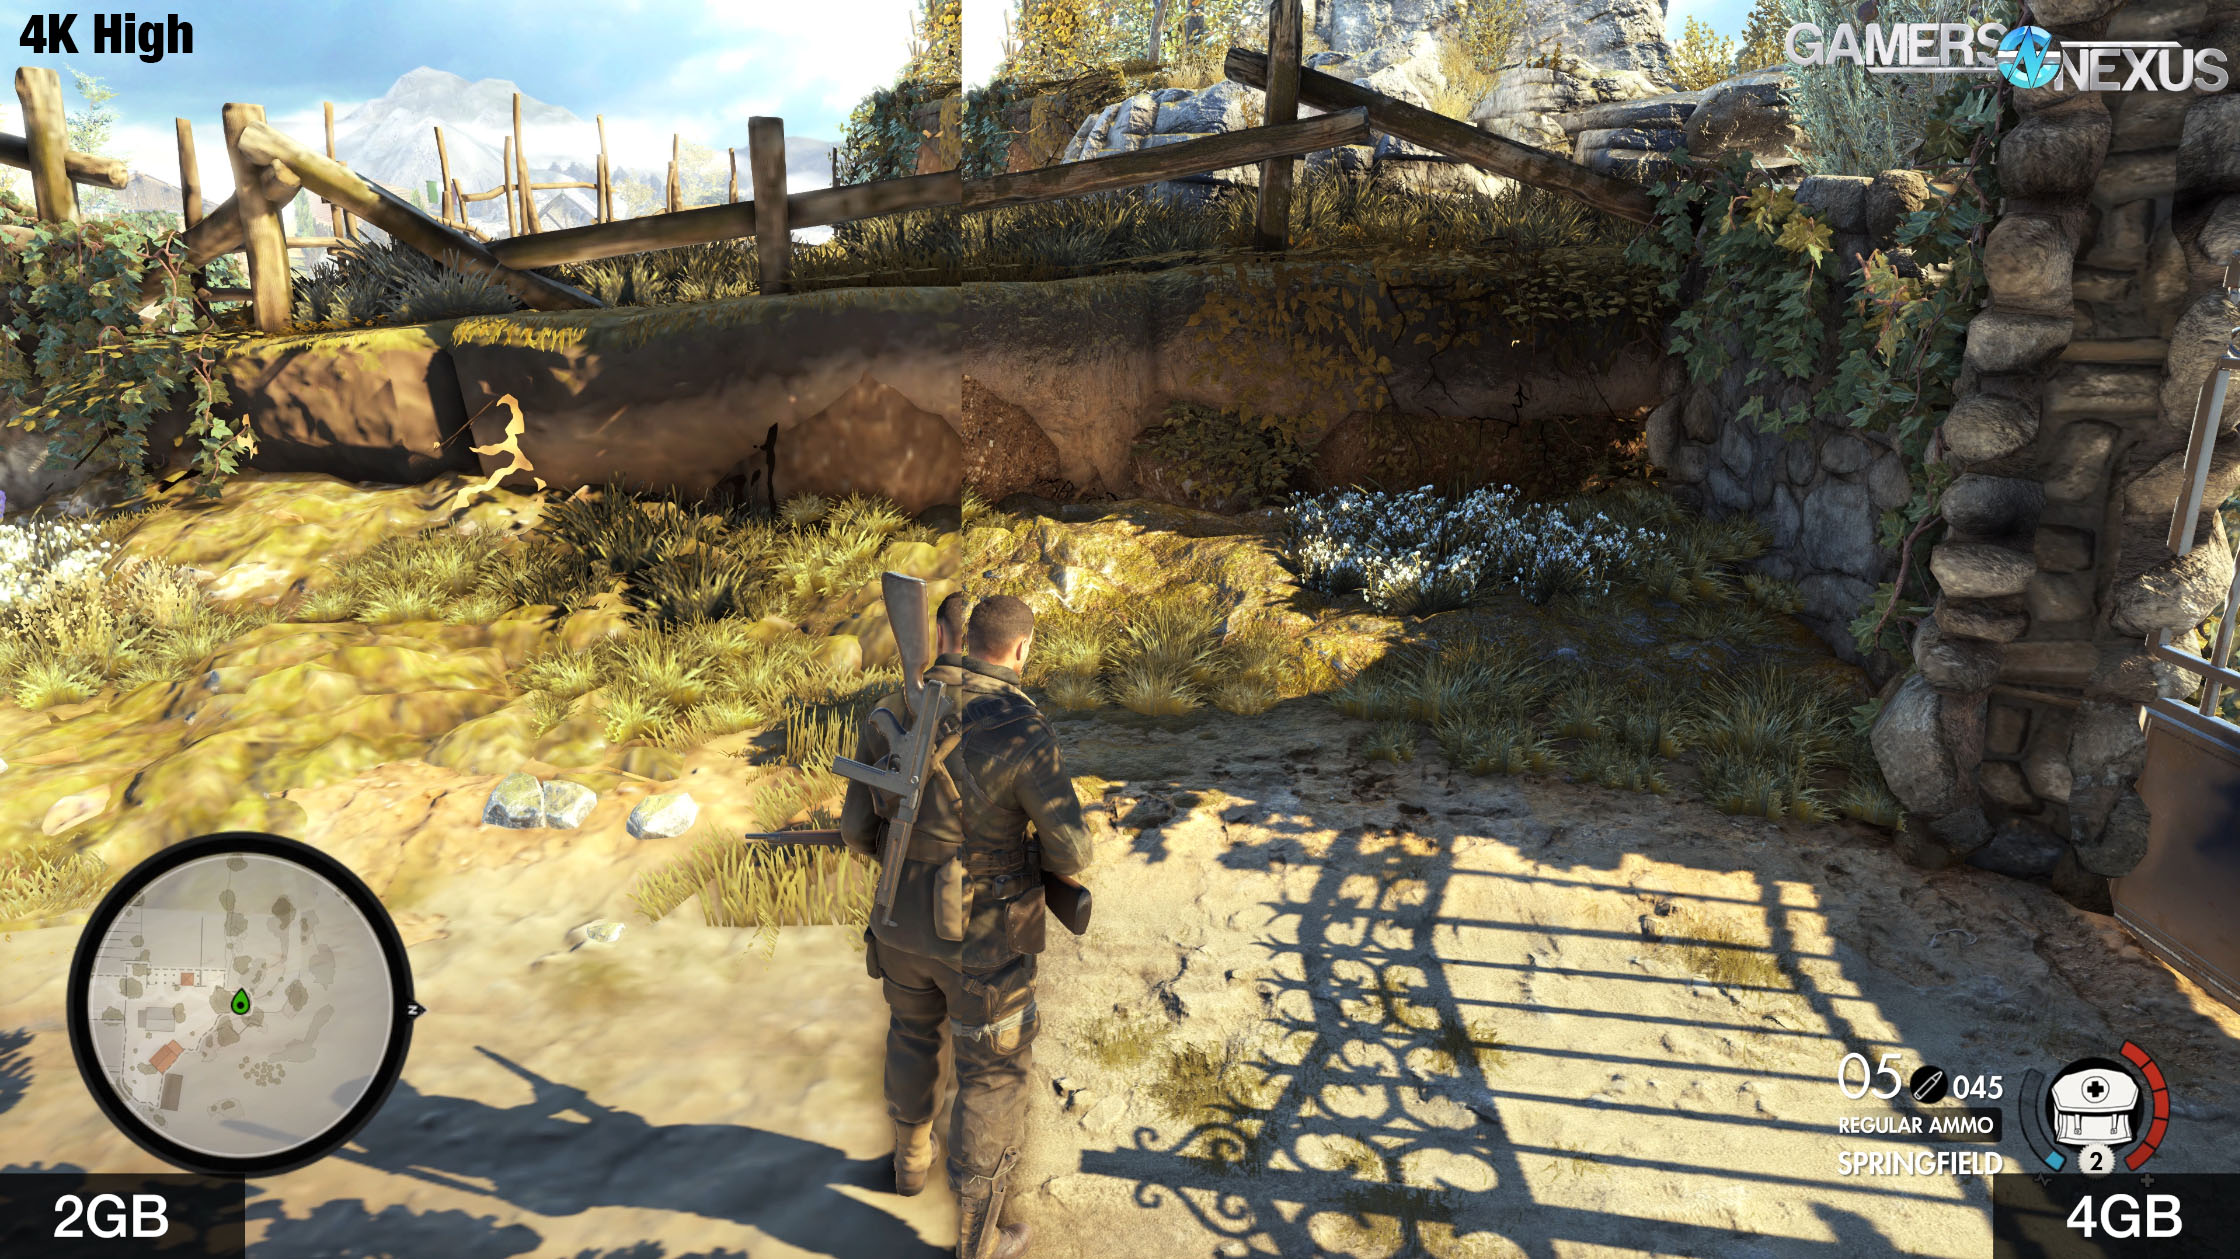
Above: 4K, worst case. Very unrealistic but demonstrates the issues
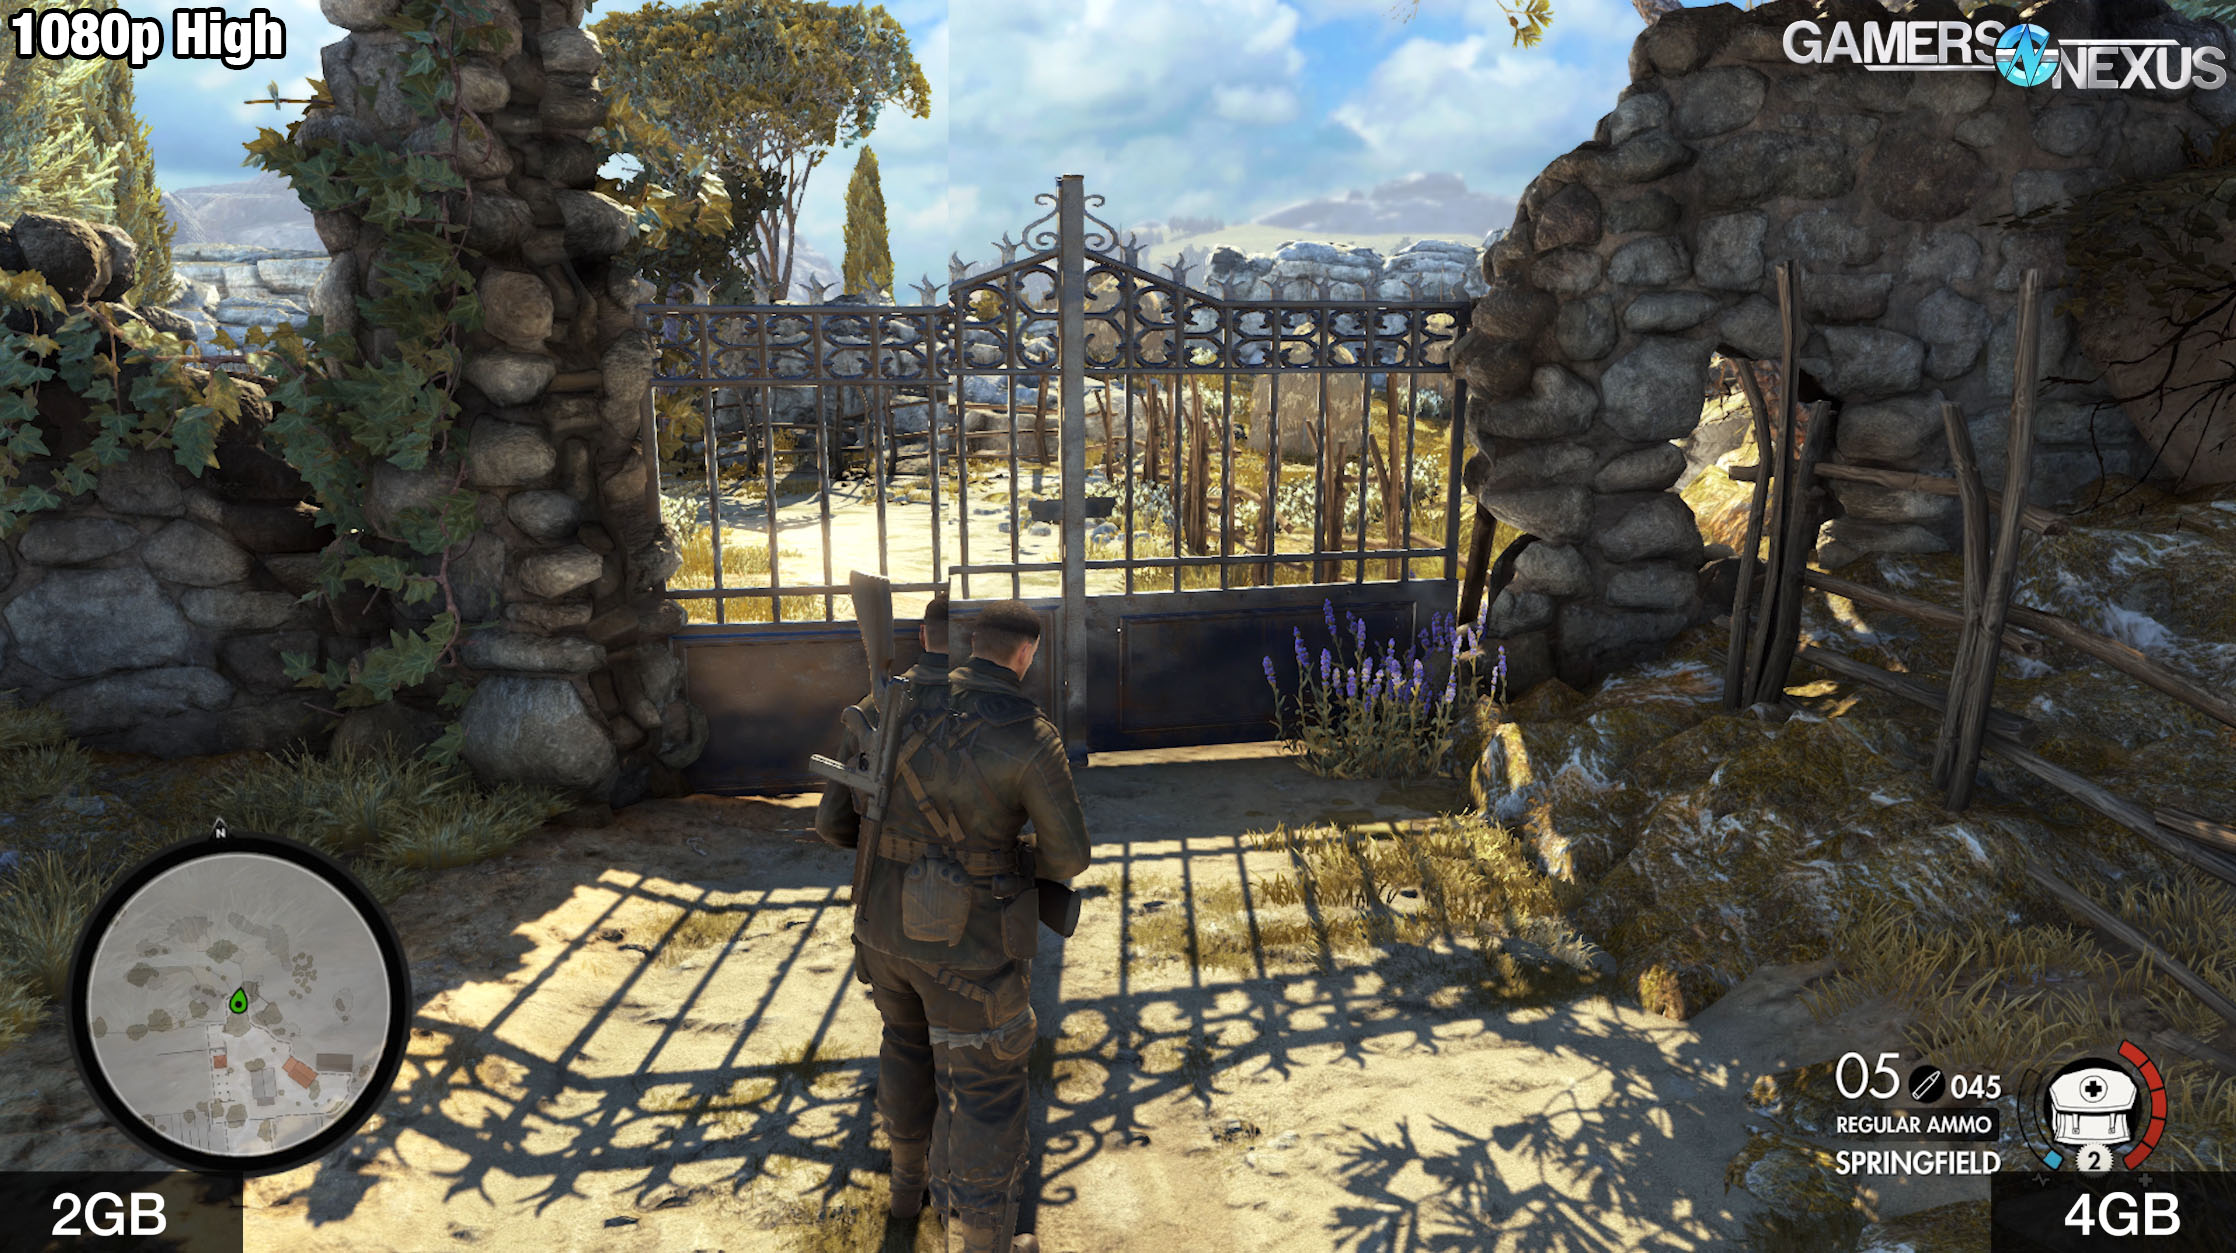
Above: Differences don't emerge in 1080p unless playing bigger/more complex levels for a longer period of time
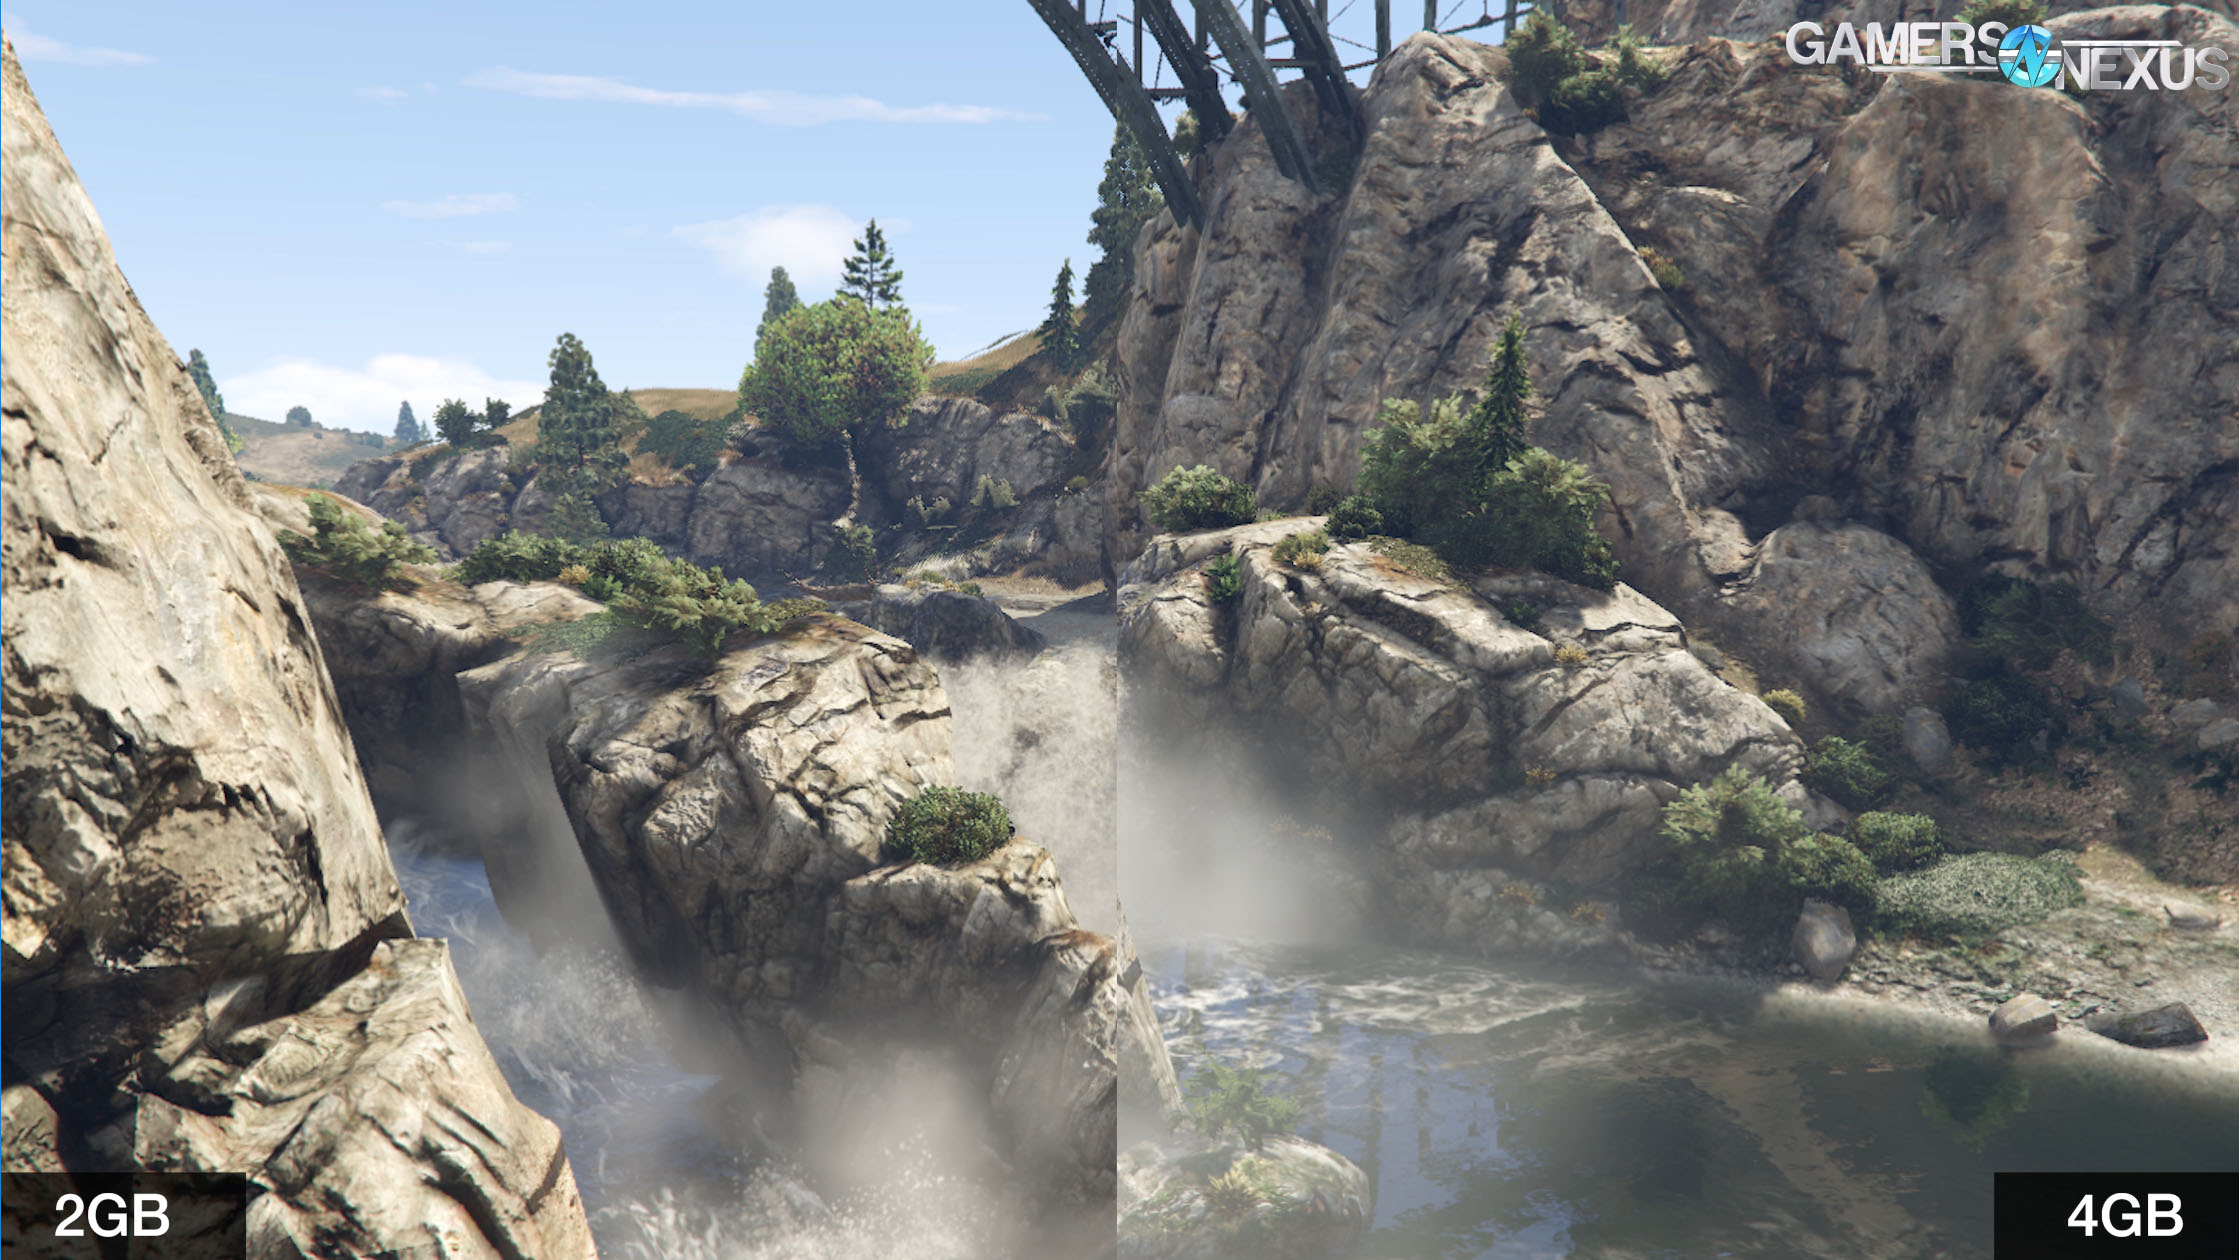
All games will handle this in their own way, but Sniper Elite 4 handles VRAM limitations by just silently – although obviously – tanking texture resolution and quality to compensate for overextension on VRAM consumption. This is immediately visible, even without a side-by-side comparison. As such, the framerate results are clearly invalid, as they aren’t testing the same thing. This game doesn’t ignore VRAM limitations and so will fit the memory capacity it is allotted, thus resulting in an unequal comparison. The answer, then, is that the GTX 960 2GB card is immediately becoming limiting for us. At around 60FPS, the GTX 960 4GB is actually still fully playable today in Sniper Elite 4, even at high settings and 1080p resolution, but 960 2GB purchasers would be looking for upgrades at this point. Some of our image quality comparisons are at higher resolutions, just to further stress the VRAM and demonstrate the loss of shadow quality, texture quality, and mesh quality to accommodate the VRAM limitations.
Apex Legends
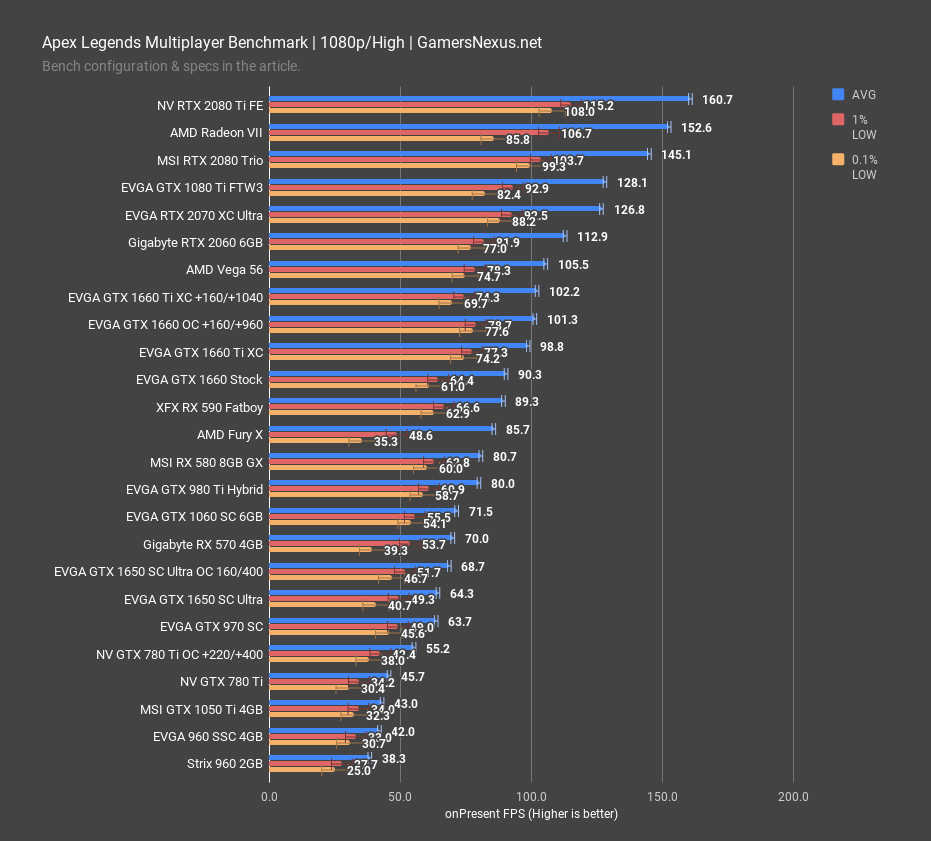
Apex Legends at 1080p positions the GTX 960 SSC 4GB at 42FPS AVG when clock-matched with the Strix 2GB card, running lows in the range of 30FPS. Note that we could improve performance with lowered settings, clearly, but the goal is more to focus on head-to-head comparisons. The 4GB card leads outside of margin of error, claiming a 10% gain.
GTA V
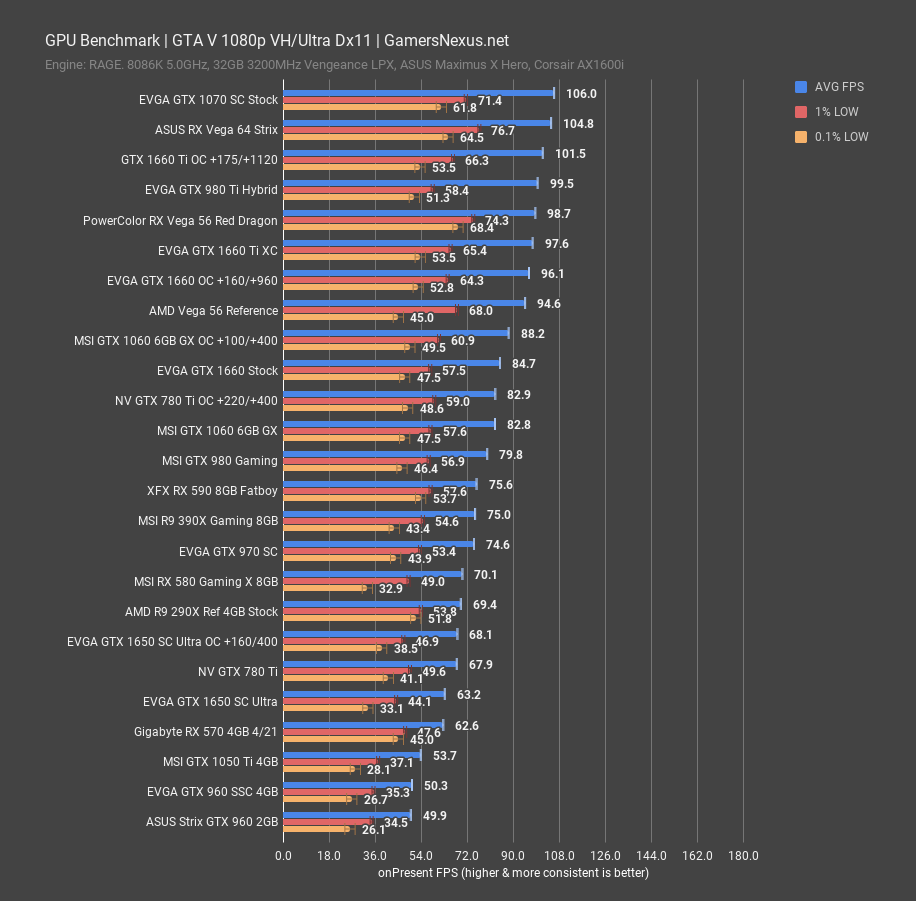
GTA V was released after the GTX 960s launched by just a few months, so it’s the closest-to-launch comparison. At 1080p, the GTX 960 2GB card ends up at 50FPS AVG, and is well within error margins when compared to the 960 SSC. These are about as close as you can get.
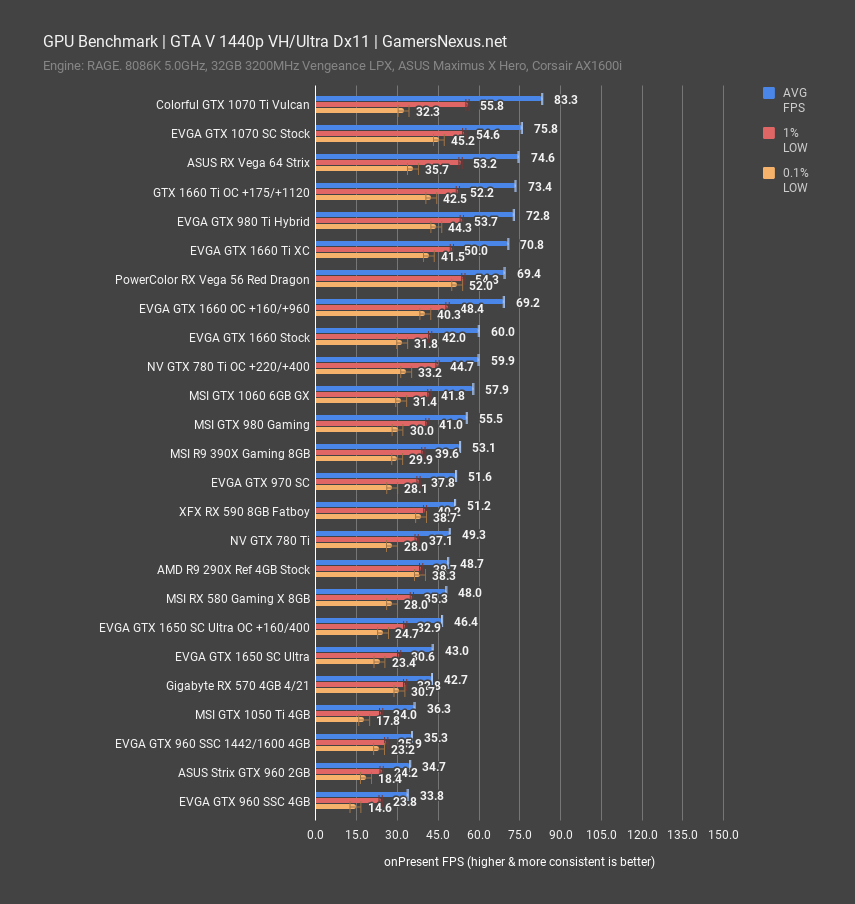
At 1440p, we see the same results: The two cards are within margin of error of each other, and so we can declare that they are functionally the same in this test; at least, that’s true with regard to performance.
GTA V image quality doesn’t show the same change Sniper Elite 4 did, which is again logical with the lack of equality in framerate performance. The two images have the same texture quality.
F1 2018
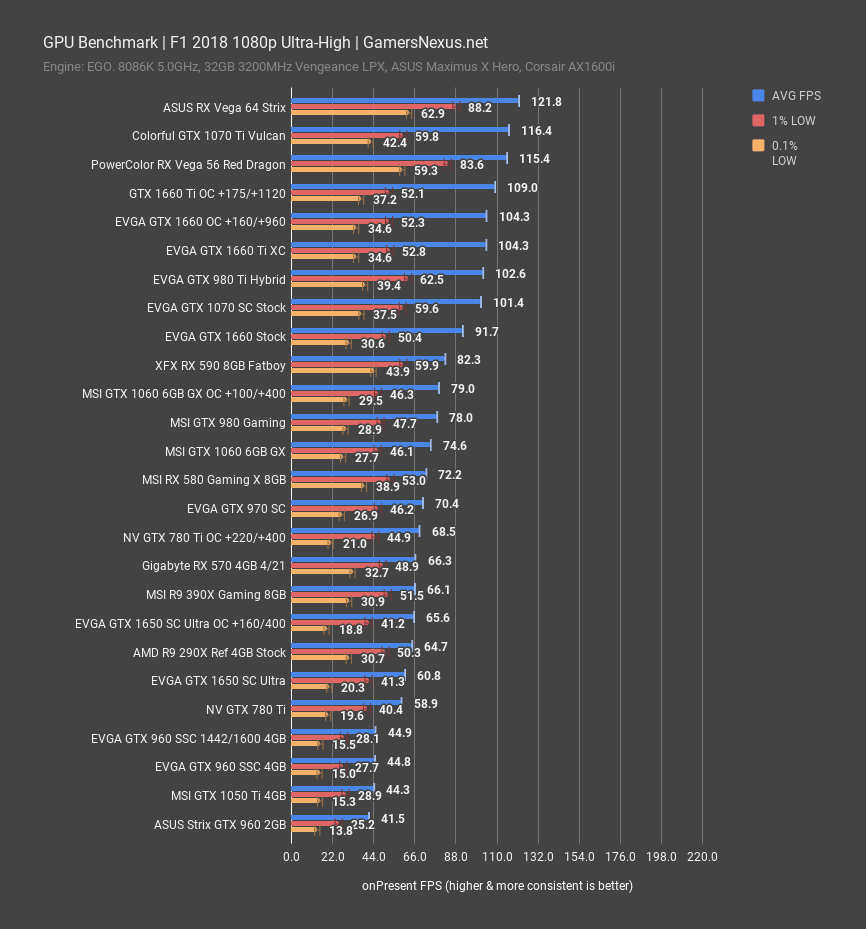
F1 2018 at 1080p positions the GTX 960 SSC 4GB card at 45FPS AVG when frequency-locked, with lows at 28FPS and 16FPS 1% and 0.1% lows. The GTX 960 Strix 2GB card did about 42FPS AVG, enabling the 4GB card a lead of 8.2%. This difference is outside of our run-to-run error. We did have one test pass that had an excursion from the mean, but even if we eliminate this test pass, the lead of the 4GB card remains at 5.5% and is outside of error margins.
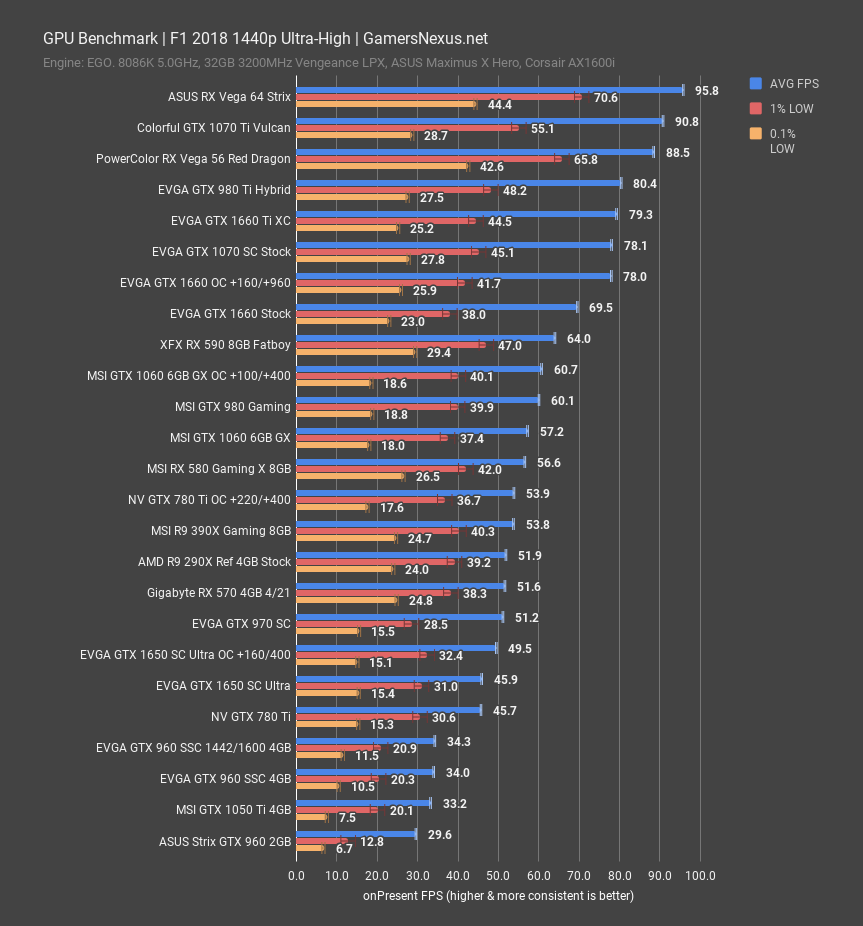
At 1440p, our existence of the stock 960 SSC and the clock-locked one helps illustrate that test results are outside of error margins, as these two devices represent different test settings that are still advantaged by extra memory. The test range is +/-0.5FPS AVG for these cards. The Strix 960 2GB card hits 29.6FPS AVG, permitting the clock-locked 960 SSC at 1442 MHz a lead of about 16% at 1440p. This is substantial and, although 1440p isn’t a particularly good experience on these cards, the important part is that it stresses VRAM and illustrates limitations. These are further illustrated with the significantly lower 1% and 0.1% lows on the 2GB card, demonstrating frametime variance and inconsistency.
Even at 1440p, F1 2018 image quality remains the same between the 2GB and 4GB devices. We drop performance from swapping in and out of video memory more aggressively, but don’t seem to have a reduction in mesh quality or texture quality.
Far Cry 5
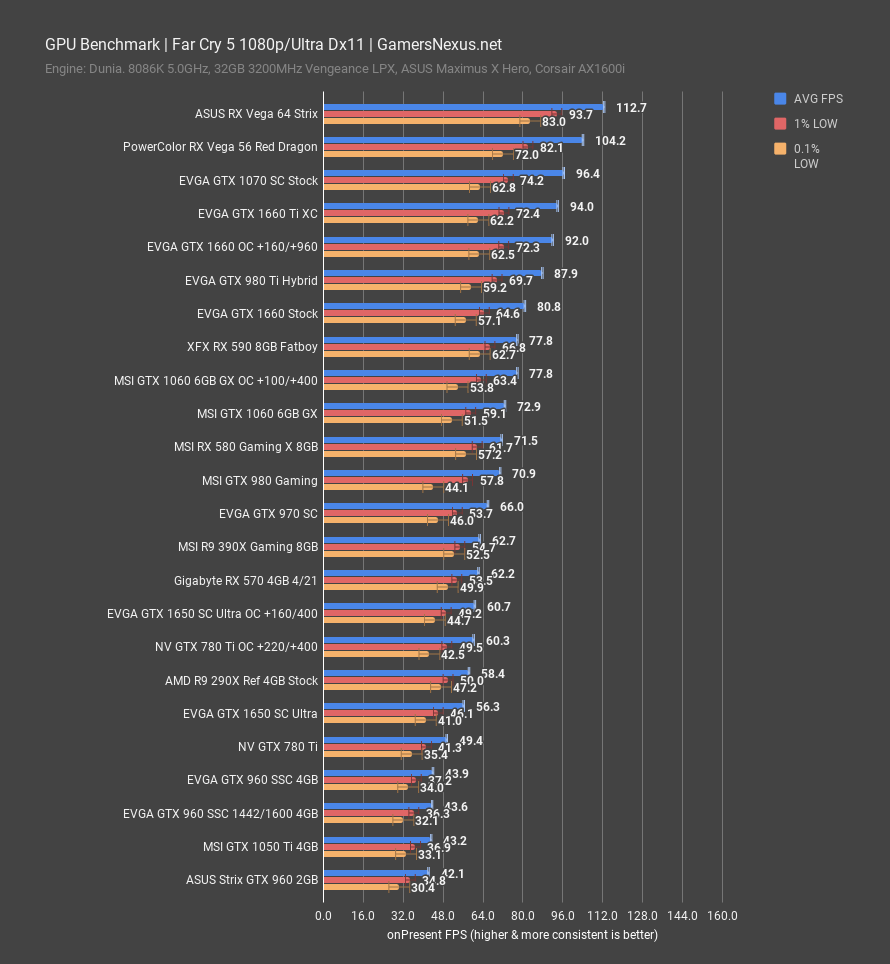
Far Cry 5 at 1080p doesn’t illustrate differences of any major margin. We’re at 44FPS AVG for the 960 SSC 4GB variants, with the Strix 960 2GB card at 42.1FPS AVG. These are nearing error margins, although the range technically does exit them just barely.
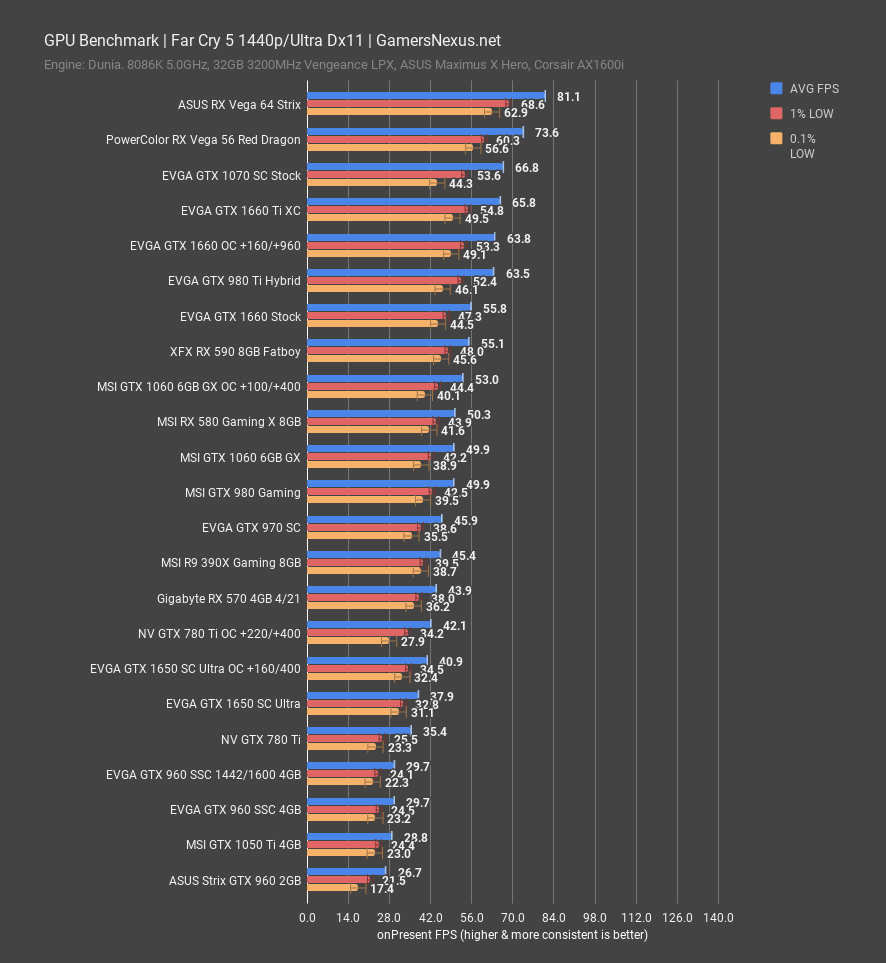
At 1440p, the differences emerge with greater resolution. The 960 4GB cards maintain a lead of about 11%, since each frame at this rate is meaningful, and the 0.1% lows also show some gains on the 4GB card.
Far Cry 5 also doesn’t suffer an image quality reduction, which is largely illustrated by the framerate difference in performance. We’d likely see an image quality reduction accompanied with a framerate increase, which is not observed here.
SOTTR
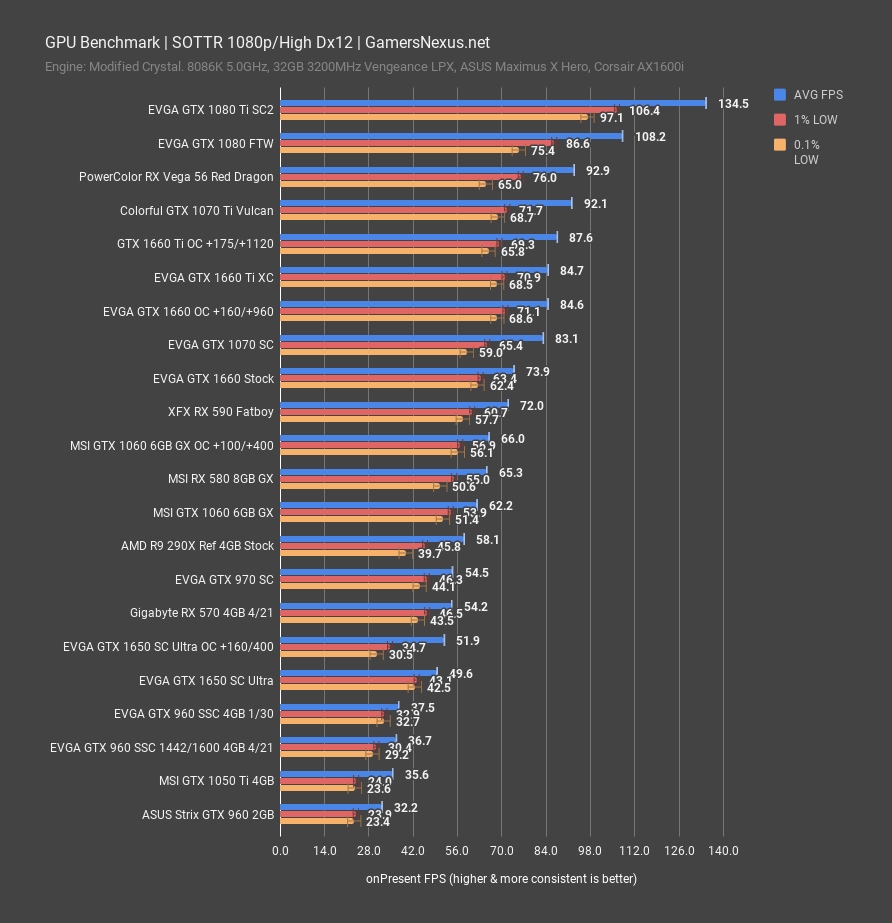
Shadow of the Tomb Raider at 1080p places the frequency-locked 960 at 36.7FPS AVG, allowing it a lead of about 14%. Every single test pass for the 960 4GB was between 36.6 and 36.8FPS AVG, marking this benchmark as highly reliable and with minimal variance. The 960 Strix demonstrated more variance, with results between 31.7 and 33.1FPS AVG.
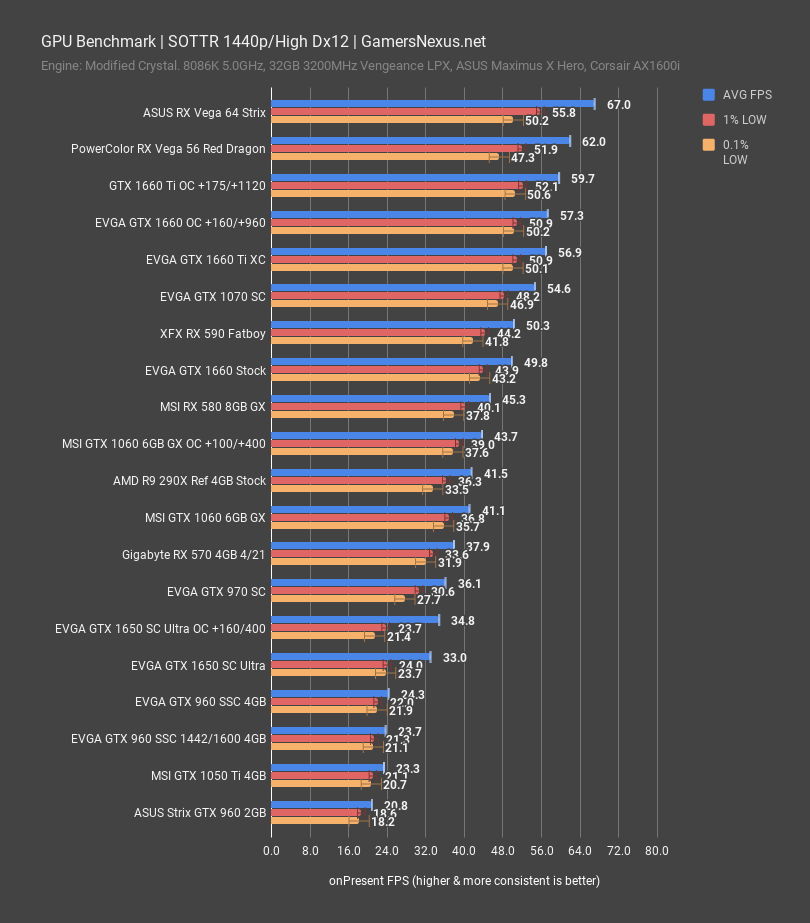
1440p shows the same scaling we’ve seen before, with the 4GB card pulling ahead in a measurable way, but again, we’re at a point where you wouldn’t be playing on either card. It’s still important to show the difference, just not particularly meaningful to the user.
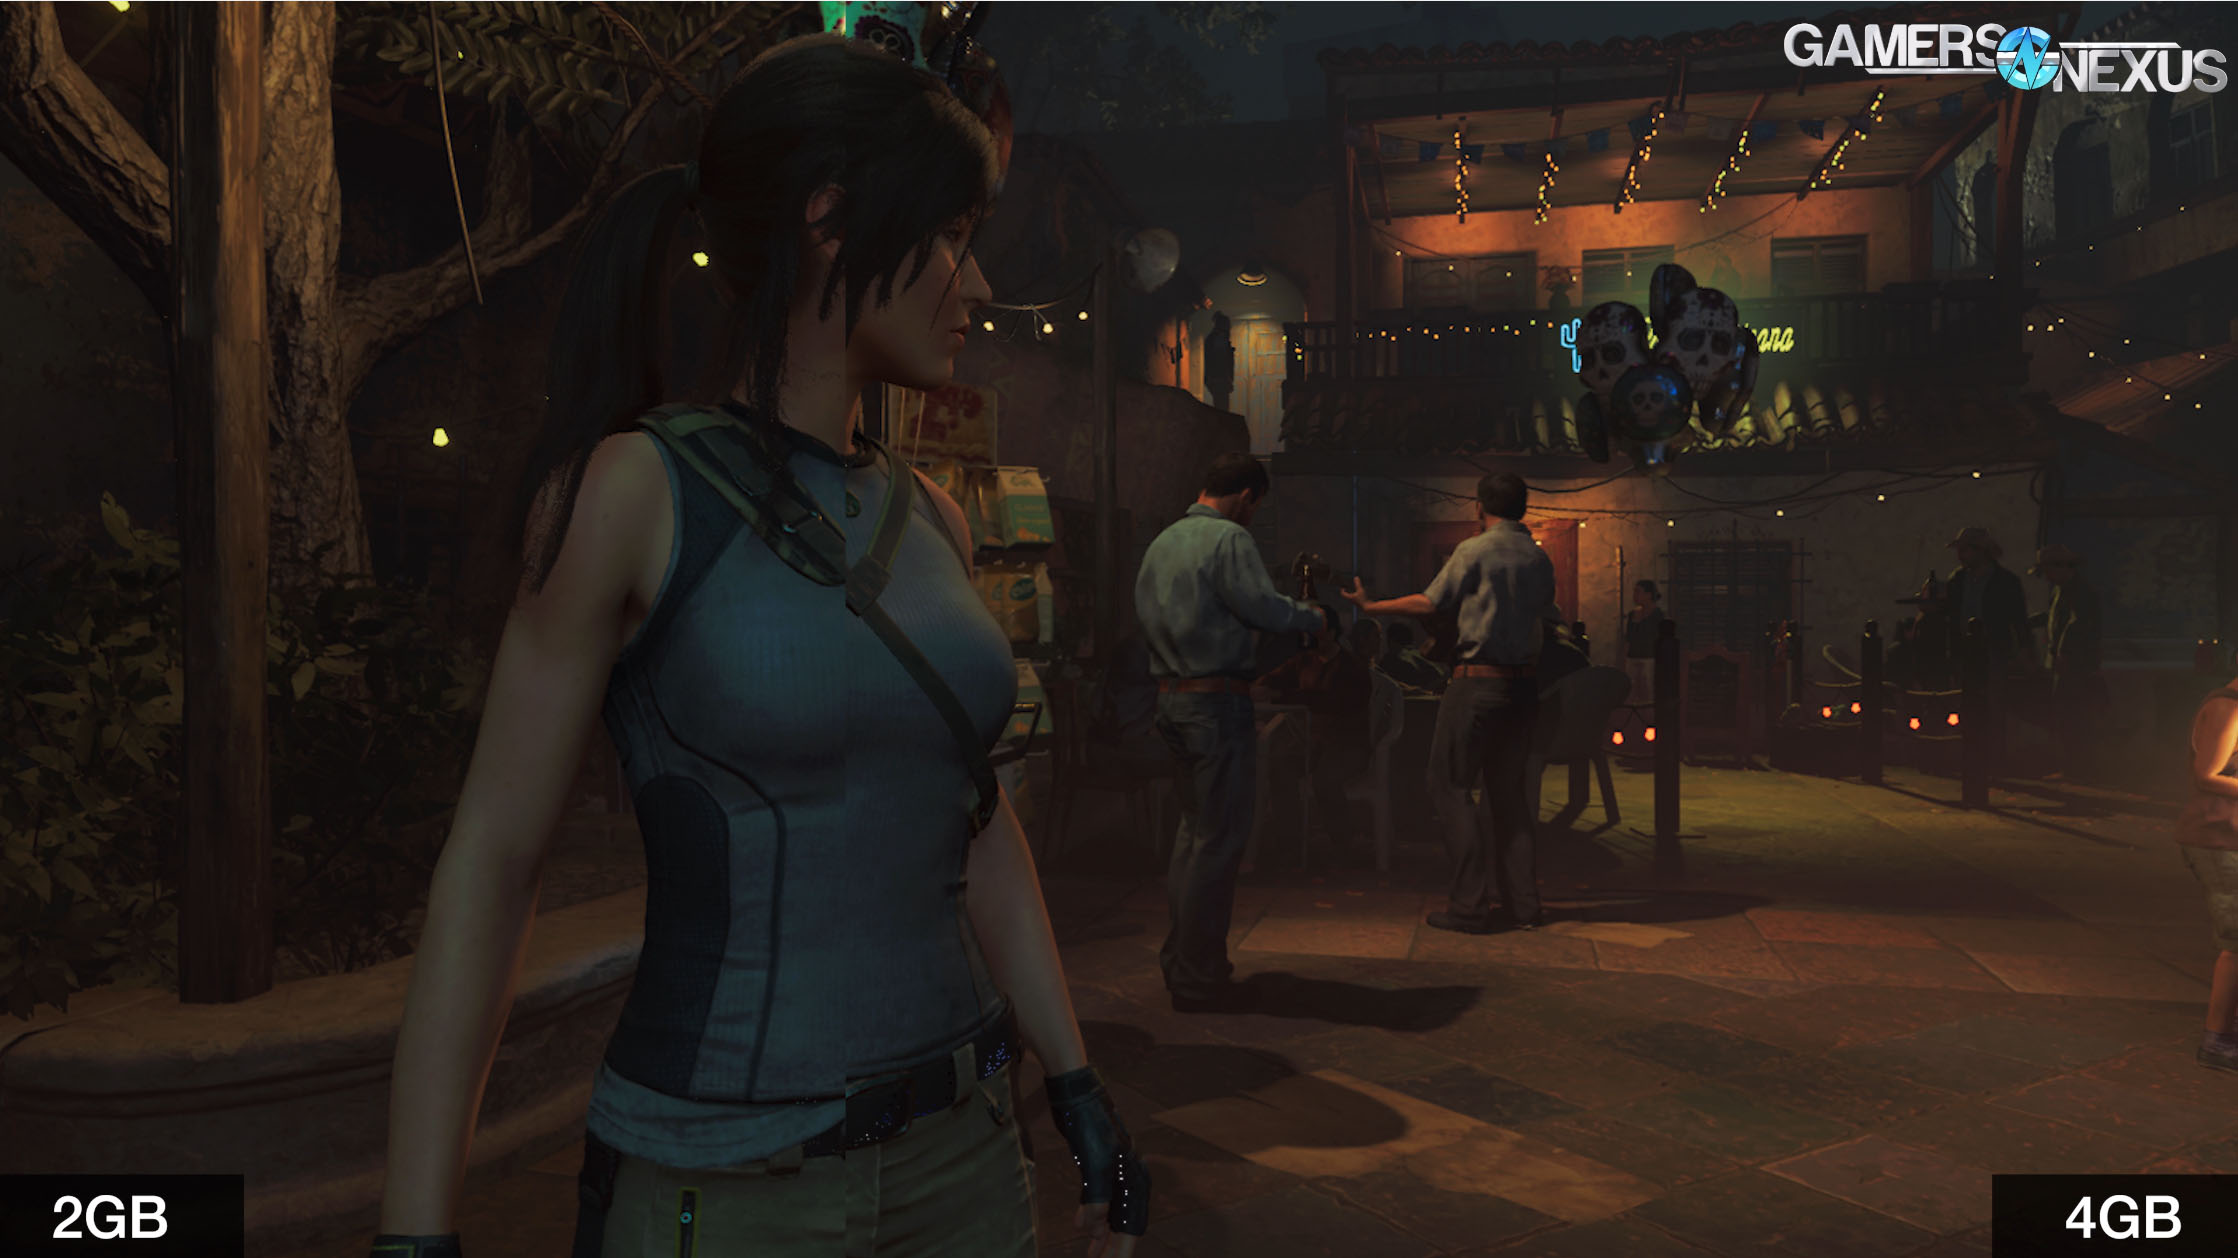
Shadow of the Tomb Raider’s image quality also looks the same between two. Some characters randomly generate, but looking at floor tiles, we see the same texture quality and resolution. The same is true for Lara Croft, who has the same texture and mesh quality in each scene. The tree and pole behind her also have the same image quality.
Conclusion
As we stretch into scenarios of general unplayability on each device, e.g. 26FPS AVG vs. 30FPS AVG, we do start to see differences which are “significant” from a pure percentages standpoint. This makes sense, as the numbers are becoming smaller and so the delta looks wider, but the reality is that a player would likely be equally unhappy at 26FPS and 30FPS. For differences to really start showing large percent deltas between 2GB and 4GB cards (in our tested games), we have to push settings to a point where neither device would be particularly good to use, giving us an academic exercise rather than a practical comparison. The most meaningful difference was in Sniper Elite 4, although this didn’t occur in other games we tested (but it is a feature in games we didn’t test, so that’s worth considering). Sniper had image quality reductions at higher settings that became not only apparent, but painful to look at. This made for an objectively and significantly worse experience on the 2GB card, despite relatively similar framerate numbers. Once again, though, we begin entering territory where neither device is particularly playable at the settings used (but could be made playable), and so the usefulness of this comparison straddles more on the side of “interesting” rather than “practical.”
Editorial, Testing: Steve Burke
Video: Josh Svoboda, Andrew Coleman