Our viewers have long requested that we add standardized case fan placement testing in our PC case reviews. We’ve previously talked about why this is difficult – largely logistically, as it’s neither free in cost nor free in time – but we are finally in a good position to add the testing. The tests, we think, clearly must offer some value, because it is one of our most-requested test items over the past two years. We ultimately want to act on community interests and explore what the audience is curious about, and so we’ve added tests for standardized case fan benchmarking and for noise normalized thermal testing.
Normalizing for noise and running thermal tests has been our main, go-to benchmark for PC cooler testing for about 2-3 years now, and we’ve grown to really appreciate the approach to benchmarking. Coolers are simpler than cases, as there’s not really much in the way of “fan placement,” and normalizing for a 40dBA level has allowed us to determine which coolers have the most efficient means of cooling when under identical noise conditions. As we’ve shown in our cooler reviews, this bypasses the issue where a cooler with significantly higher RPM always chart-tops. It’s not exactly fair if a cooler at 60dBA “wins” the thermal charts versus a bunch of coolers at, say, 35-40dBA, and so normalizing the noise level allows us to see if any proper differences emerge when the user is subjected to the same “volume” from their PC cooling products. We have also long used these for GPU cooler reviews. It’s time to introduce it to case reviews, we think, and we’ll be doing that by sticking with the stock case fan configuration and reducing case fan RPMs equally to meet the target noise level (CPU and GPU cooler fans remain unchanged, as these most heavily dictate CPU and GPU coolers; they are fixed speeds constantly).
The “standardized” case fan test is much more difficult, as there are many instances where standardizing case fans or case fan placement will actually make performance worse than stock. An example would be the NZXT H500 GPU thermals, as we showed in our H500 review, where the natural case airflow pattern causes a pressure system to build near the GPU. Pressure inside the system under test wants to reach equilibrium with pressure outside, and so with a negative pressure configuration, the GPU would pull air in from the PCIe slots (and every other hole in the back of the case), thus improving its thermals by way of being immediately adjacent to a ‘cold’ air source. Cold relative to ambient, anyway. Other issues with “standardizing” case fans is that, obviously, this means some cases will get a potential downgrade in fan count, which could potentially worsen them (and if it doesn’t, that means the manufacturer is using cheaper or weaker fans than we’ve replaced them with). Because not every case is the same, we must choose a fan count and size that will be compatible with the largest number of cases. Just randomly filling every slot will almost assuredly worsen performance in a lot of instances, so it must be done carefully. An example of worsening airflow with more fans would be adding top exhaust, where users of tower coolers will often draft cool intake away from the CPU tower cooler before it ever reaches the cooler. In this scenario, CPU thermals would worsen with an extra top exhaust fan (if in the top-front), whereas top-rear might improve things.
It’s a quagmire, clearly, and one we explain in more depth in the video included for this article. We’ll defer you there for more examples of how this gets complex quickly and has potential shortcomings, but for now, let’s get through the methodological changes and the results.
GN Case Testing Bench
| Component | Courtesy Of | |
| Video Card | MSI GTX 1080 Gaming X (OC Mode) | MSI |
| CPU | Intel i7-6700K @ 4.4GHz | GamersNexus |
| CPU Cooler | MSI Core Frozr L | MSI |
| Motherboard | MSI Z170A Gaming M7 | MSI |
| Memory | Corsair Vengeance LED 32GB 3200MHz | Corsair |
| SSD | Samsung 850 EVO 120GB | Samsung |
| PSU | Corsair RM650x | Corsair |
| Cables | CableMod Pro Mesh Cables | CableMod |
| Case | This is what we're testing! | - |
The video card is configured to run at 55% fan speed at all times.
Prior to load testing, we collect idle temperature results for ten minutes to determine the unloaded cooling performance of a case's fans and air channels. Thermal benchmarking is conducted for 1400 seconds (23 minutes), a period we've determined sufficient for achieving equilibrium. The over-time data is aggregated and will occasionally be compiled into charts, if interesting or relevant. The equilibrium performance is averaged to create the below charts.
Load testing is conducted using Prime95 LFFTs and Kombustor “FurMark” stress testing simultaneously. Testing is completely automated using in-house scripting, and executes with perfect accuracy on every run.
We recently validated our test methodology using a thermal chamber, finding our approach to be nearly perfectly accurate. Learn more here.
Standardized Fan Placement
We originally disagreed with the idea of standardizing a set of fans for case tests for reasons that will partially become clear in our GPU results section, but it remained the single most requested test in every single case review. We recognized the merits of potentially adding this test, and ultimately, we take great pride in expanding and improving by listening to community interests.
For this testing, we’re using two Noctua NF-A14 fans in the front, with one NF-F12 in the rear. It is of critical importance that anyone doing this controls where each individual fan is placed – even though we’re using two of the same model fan in the front, we have marked which one goes in the top slot and which goes in the lower of the two front slots. This is because fan RPM varies by +/-10% from unit-to-unit, so blindly switching these can drastically impact results in a way that creates wide error margins. Being blind to these important differences in fan speed could lead a tester astray when analyzing results. We control where each fan is placed, and always place the 120mm option in the rear slot. We noted that almost every single ATX case we test has at least two 140mm front positions and one 120mm rear position. Unfortunately, in some cases, this means reducing the fan count, but we can’t test with more or we begin to enter scenarios that eliminate more cases from testing by way of insufficient fan mounts. We must also note that just filling a case with fans at random does nothing, and can actually make performance much worse.
At the end of the day, it’s important for us to continue doing one-off testing per case, not comparatively, like our panel-less tests and our tests where we add one fan, as a user might do when buying just one extra fan with a case. Still, though, these standardized results can teach us about some of the case designs. It’s not as simple as “lowest temperature best,” because that case might actually be better in its stock configuration. We ask that you please exercise your brain and actually think about the results and why they are what they are – don’t just look at the chart and then post all over forums about how X is better than Y. One chart is not sufficient to make such a claim, especially since it exits stock configuration.
Anyway, it’s still useful and can teach us a lot, so let’s get into those results.
Standardized Fan Results – CPU
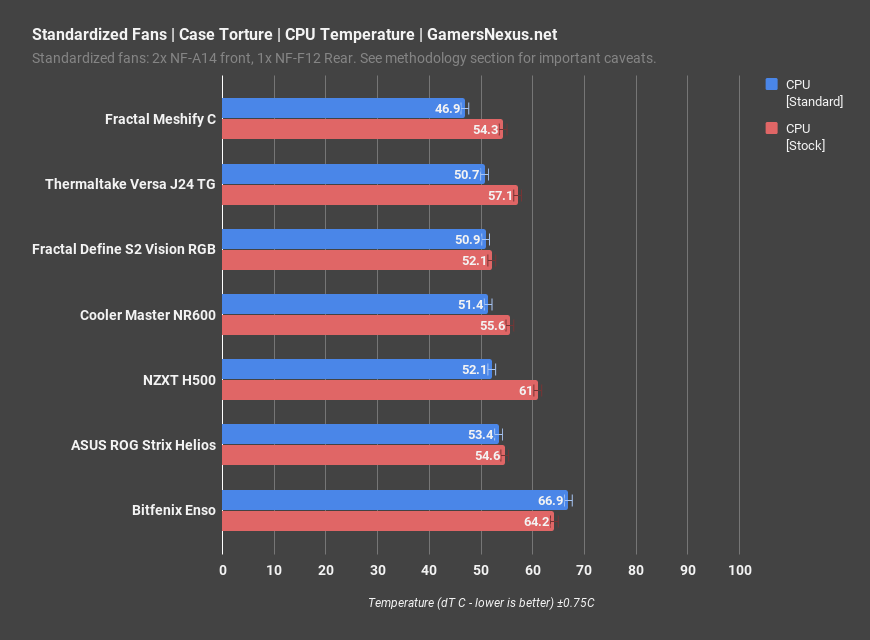
Standardized fan results are up first. We’ve split these into two bars per case, one representing the standardized results and one representing the full stock results. A quick glance reveals one immediate apparent outlier, and that’s the Bitfenix Enso. Getting this one out of the way first, note that both the standardized and stock results were up against CPU throttling, and so this is actually an identical result between the two; the CPU is throttling here, and so we can’t see the true temperature because the frequency is shifting around in a less predictable manner. Further, we previously proved that the Bitfenix Enso will recirculate its own hot air when installing fans in the front, which you can learn more about in our Enso review. There’s a reason this is one of the worst cases we’ve ever reviewed.
Moving on from this, the NZXT H500 sees the most immediate benefit from standardizing the fans in the CPU test, but this will change later for the GPU test. The H500 saw an improvement of about 9 degrees for air forced straight through the CPU tower cooler. The Meshify C actually did the best here and, by looking at the Versa J24’s results, we can learn part of why: The Meshify C and Versa J24 are the smallest cases on these charts, positioning the front fans closer to the components. This impacts performance in a noticeable way, as the higher velocity air is dissipating heat more quickly. Second, both cases have relatively punched-through front panels, allowing for more airflow than in some of the competition. The S2 Vision doesn’t change much, which isn’t surprising when considering its 4-fan stock configuration, and the NR600 sees some improvement in results. ASUS’ Helios remains nearly identical, which is a testament to how much a sheet of glass will inhibit performance.
Standardized Fan Results – GPU
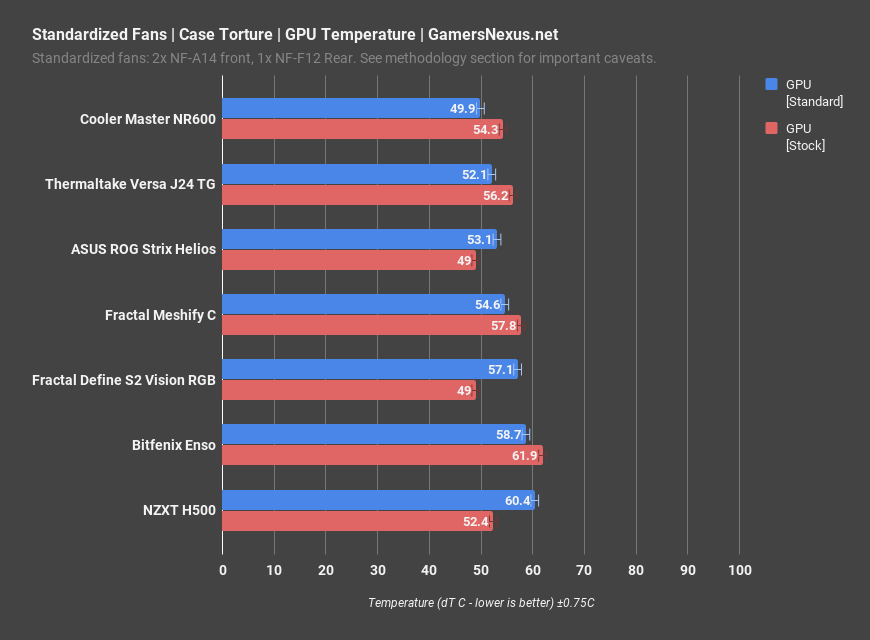
The standardized fan results for GPU temperature are much more interesting – they’re more varied and take some additional thought to understand, but they do make sense once explained and explored.
Let’s start with an obvious one: The NZXT H500 sees worse GPU thermals in this configuration than in our original benchmark, and posts the opposite scaling from what we saw with the noteworthy CPU thermal improvement previously. This is for a few reasons that were detailed in our original H500 review: First, the H500 is configured in a negative pressure setup for out of the box thermals testing, which means that air finds its way in through every single hole in the case. This includes small perforations at the front, of course, but critically includes the rear PCIe slot covers and grills near the back of the case. The GPU fans are therefore able to pull air in through an immediate access to cool, ambient temperature air, right from the back of the case. By switching to a positive pressure setup, we take this away from the H500 and highlight a potential shortcoming in this section of test methodology. Because the case exits an optimal configuration, it is perhaps unfair to test it in this way – we see CPU performance uplift, but GPU performance decay, and so it’s important to try and keep these factors in mind. Regardless, the H500 does worse here, despite actually holding a top-three result when under its stock conditions, represented by the red bar.
Moving on, the NR600 does well in this test, which is entirely a result of the weird positioning in this case. The NR600 claims it supports 140mm fans, but it doesn’t really properly do so, as discussed in the review. That said, the upside for this test was that our fans ended up directly benefiting the GPU. It all comes down to positioning. The J24 and Helios end up in the same area, though we should note that the Helios actually did very well overall for its GPU thermal results in the initial review. The Meshify C isn’t as impressive here, which is because the fans end up biased toward the CPU. The GPU receives more air across its backplate than the front of the card, which doesn’t amount to much aside from better CPU cooling. The S2 also sees worse results with the standardized testing, as its included four fans did better align heavy airflow directly under the GPU shroud.
This set of tests illustrates shortcomings in just standardizing fan placement and size, because some cases are simply built or equipped better out of the box. We can’t go too high in fan count because we’d then eliminate the ability to standardize for smaller cases, making this difficult to do.
More discussion on this later. Let’s move on to noise-normalized results.
Noise Normalized Testing Explanation
We’ve been running noise normalized tests in our CPU cooler reviews for over two years now, so they’re certainly nothing new for GamersNexus. We introduced these tests when we realized that CPU coolers were lacking a critical component of their reviews, which was to illustrate performance when controlling for the variable of noise. It’s not very fair if a cooler performs the best on the chart by being the loudest, as you could have a cooler at 60dBA that beats everyone else’s 45dBA coolers when measured at 20”, but that doesn’t count for much. What counts is how well our hypothetical 60dBA cooler does when leveled to the same noise level as everyone else, and so we normalize for 40dBA at 20” in our cooler test system. This is in a room with a noise floor of about 26dBA.
For cases, it’s the same story: If someone wins in thermals by being loudest, but the two results are isolated on different charts, it becomes hard to quantify and illustrate the actual difference between cases with different strengths. We first demonstrated this with cases in our be quiet! versus RL06 benchmark, which we can show on the screen now, when we found that the better-ventilated RL06 was able to outperform the be quiet! case in both thermals and acoustics. This was because the RL06 could run its fans slower and draw more air in, a result of the mesh, whereas the be quiet! case had to run fans faster to overcome its own noise damping material.
For these, we’re measuring at 36dBA at 20” from the front of the case. The rest of the testing uses our standard torture test with controlled power consumption by the CPU and GPU for the whole test.
Noise Normalized Results
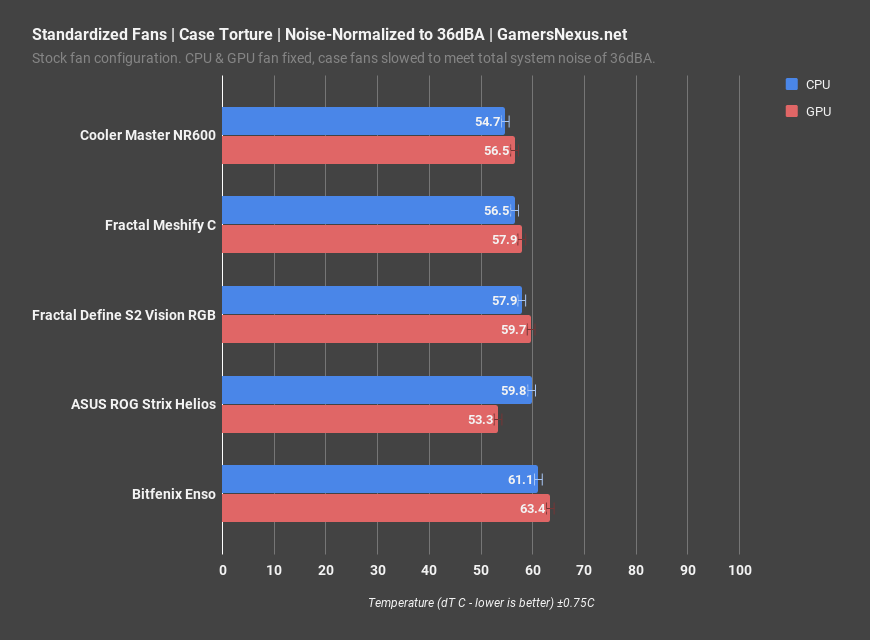
The noise normalized results are on the screen now. For these, the only outlier in the performance scaling is the Helios, which breaks pattern with a stronger GPU performance than the other cases. This is due to positioning of the fans, as we learned before, and because of the quantity of fans; note that we’re back down to the stock fan configurations, just tuned for 36dBA. The Versa J24 doesn’t make this chart as its front fans cannot be controlled, and so its noise levels can’t be reasonably normalized.
For these results, the Cooler Master NR600 does the best. Thanks to its ultra-fine mesh front, CPU performance leads all other cases we’ve tested thus far. The Meshify C comes in next, followed by the S2 Vision and its full assortment of fans spun-down to the targeted noise level. The Helios leads everyone in GPU performance, and the Enso is doing what it does best: Throttling hard.
Conclusion
Our conclusion was largely stated in the intro: It’s complex to just “standardize” case fan placement, but we’ve done a good job at demonstrating where it’s useful and where it has shortcomings. The noise normalization for thermals will get wider-spread use in our case reviews going forward, as we think this is the most useful of the new metrics explored today. Case fan standardization has also proven useful for finding weaker stock fan configurations, or finding unique airflow patterns, but our concern is one of responsible reporting. We’ll have to carefully remind everyone that some cases worsen with this approach, perhaps unfairly, and the concern is that users often ignore what we say, jump to this conclusion paragraph (hi), and glance over charts. Those same people often copy and paste the charts, maybe with one out of context sentence, onto reddit and various forums. At that point, any of our warnings about shortcomings will be circumvented, and misinformation can begin to spread to no real fault of our own. We’ll try to present these numbers as there is legitimacy to the request by viewers, but we ask that you all don’t use our charts to “win” internet arguments with each other. Remember, cases are complex, and they are also one of the least scientifically testable things in the space. Case performance depends so heavily on how the testing is done that, although we standardize testing well for balance, it is likely that significantly different configurations could perform differently.
Anyway, check the video for more discussion on this topic, as it was better suited to off-the-cuff and experience-based commentary. Besides, we’ve just landed in Taiwan and need some sleep.
Check back for more soon! Thanks for all the test requests!
Editorial, Test Lead: Steve Burke
Testing: Patrick Lathan
Video: Josh Svoboda, Andrew Coleman