GPU Silicon Quality & OC Lottery Test: Differences of Each Video Card's Frequency
Posted on
Silicon quality and the so-called silicon lottery are often discussed in the industry, but it’s rare for anyone to have enough sample size to actually demonstrate what those phrases mean in practice. We asked Gigabyte to loan us as many of a single model of video card as they could so that we could demonstrate the frequency variance card-to-card at stock, the variations in overclocking headroom, and actual gaming performance differences from one card to the next. This helps to more definitively strike at the question of how much silicon quality can impact a GPU’s performance, particularly when stock, and also looks at memory overclocking and range of FPS in gaming benchmarks with a highly controlled bench and a ton of test passes per device. Finally, we can see the theory of how much one reviewer’s GPU might vary from another’s when running initial review testing.
We borrowed 7 of Gigabyte’s 1070 Ti cards for this testing and have demarcated which card is which by the final digits in the serial number, something you’ll see in the game charts later. We already know that GPU boosting frequency is dictated by parameters defined by both AMD and NVIDIA, but they primarily share that power, voltage, and thermal limitations are among the immediate limiters. Silicon quality is another consideration in NVIDIA’s boosting behavior, with each card being assigned a slightly different V-F (volt-frequency) stepping depending upon the GPU’s quality. It’s no longer surfaced to board partners, but NVIDIA is capable of reading silicon quality levels on each chip, which can then be used to dictate that GPU’s boosting behavior. This isn’t a manual process, at this point, and all happens at the factory-level.
All of this means that, even ignoring overclocking lotteries (already known to exist), stock card performance can also vary from one GPU to the next; in fact, the variation is great enough that it could be equivalent to a manufacturer’s pre-overclock on a card. Benchmarking today was done with our older GPU test games list, pre-Super, and mostly uses gaming workloads and 3DMark to establish behavior in each card. We have dozens of test passes per device, narrowing-down error margins to be as slim as achievable while still running real tests. Some of our error is down to 0.1FPS AVG, for instance, and so we can more accurately look at how each GPU might perform slightly differently in accordance with its silicon quality.
Limiting standard deviation and run-to-run excursions from the mean were a big focus of this testing, and so each device had a minimum of 5 test passes per game per resolution, with some tests constituting 15 test passes per device.
Test Methodology
We have overhauled the host test bench and had updated with new games. Our games selection is a careful one: Time is finite, and having analyzed our previous testing methodologies, we identified shortcomings where we were ultimately wasting time by testing too many games that didn’t provide meaningfully different data from our other tested titles. In order to better optimize our time available and test “smarter” (rather than “more,” which was one of our previous goals), we have selected games based upon the following criteria:
- Game Engine: Most games run on the same group of popular engines. By choosing one game from each major engine (e.g. Unreal Engine), we can ensure that we are representing a wide sweep of games that just use the built-in engine-level optimizations
- API: We have chosen a select group of DirectX 11 and DirectX 12 API integrations, as these are the most prevalent at this time. We will include more Vulkan API testing as more games ship with Vulkan
- Popularity: Is it something people actually play?
- Longevity: Regardless of popularity, how long can we reasonably expect that a game will go without updates? Updating games can hurt comparative data from past tests, which impacts our ability to cross-compare new data and old, as old data may no longer be comparable post-patch
Game graphics settings are defined in their respective charts.
We are also testing most games at all three popular resolutions – at least, we are for the high-end. This includes 4K, 1440p, and 1080p, which allows us to determine GPU scalability across multiple monitor types. More importantly, this allows us to start pinpointing the reason for performance uplift, rather than just saying there is performance uplift. If we know that performance boosts harder at 4K than 1080p, we might be able to call this indicative of a ROPs advantage, for instance. Understanding why performance behaves the way it does is critical for future expansion of our own knowledge, and thus prepares our content for smarter analysis in the future.
For the test bench proper, we are now using the following components:
GPU Test Bench (Sponsored by Corsair)
Component | Courtesy of | |
CPU | GamersNexus | |
GPU | This is what we’re testing! | Often the company that makes the card, but sometimes us (see article) |
Motherboard | ASUS | |
RAM | Corsair | |
PSU | Corsair | |
Cooler | NZXT | |
SSD | Plextor 256-M7VC | GamersNexus |
All memory timings are completely controlled for our new GPU testing, which has significantly tightened our error margins. Windows is version 1903. Note that some games, like GTA V and Hitman 2, have been manually tuned outside of a simple preset to ensure we have a proper benchmark. GTA V uses 2x MSAA in our testing, as it runs into engine frame limits at 187.5FPS and triggers engine-level bugs. Hitman 2 has crowd simulation and sound simulation settings that we tune back to the 4-core setting, as running higher than that creates a CPU bottleneck (and more of a CPU benchmark, as a result).
Stock 3DMark AVG Frequency
Doing an over-time frequency chart with this many GPUs would be impossible to read – as you can see in this quick example – because GPU Boost on NVIDIA cards means that there’s almost never a flat line. It happens, but it’s rare. For the most part, each card will fluctuate based upon thermal, power, and voltage limiters, and so we end up with this mess when plotted with so many devices.
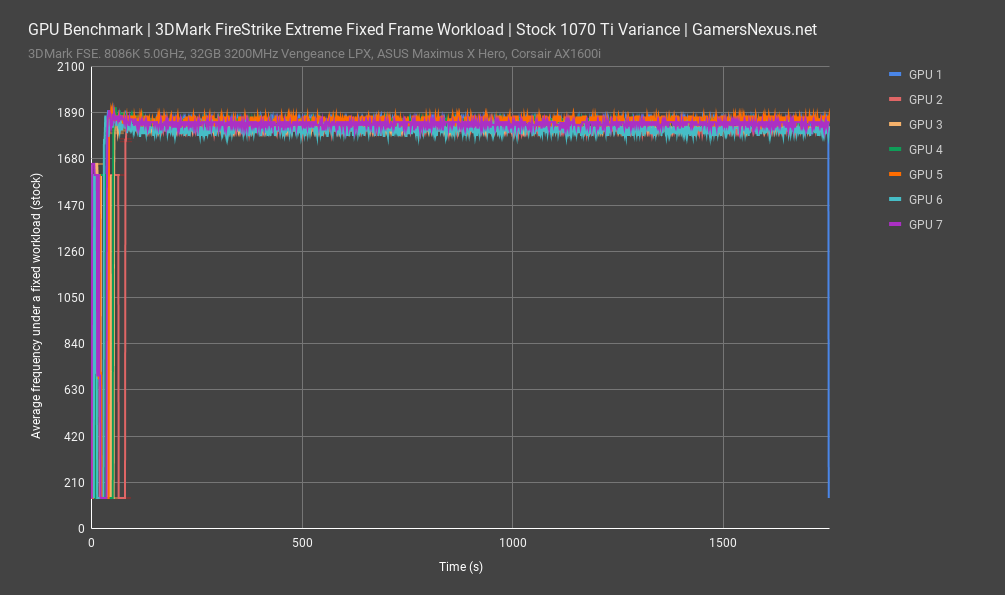
Instead resorting to a simple bar chart with averages across 1500 cells of an identical load scenario, we get a much more readable format. The out-of-the-box performance establishes a stock frequency range of about 45MHz. We controlled ambient temperature and other variables, so this comes down to actual silicon quality and variance of the GPU. For each GPU, a volt-frequency table is generated that is used to establish the frequency stepping under NVIDIA’s boost parameters. It’ll run at very slightly different voltages and frequencies. Clocks can’t dial-in down to 1MHz, so you typically see a range of about 10-12MHz steps. The best GPUs on this list, in terms of out-of-box stock frequencies, are GPUs 4, 5, and 1. The worst is GPU2, although we’ll later show that GPU3 is defective, making it actually the worst.
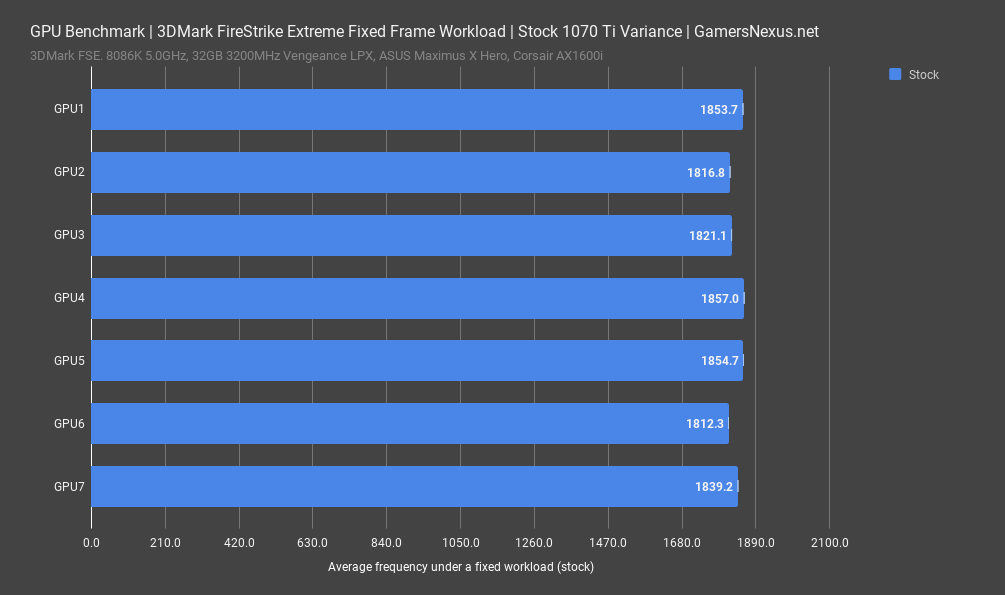
Note that the best stock GPU doesn’t mean the best overclocker, and the best overclocker on air doesn’t mean the best overclocker on liquid nitrogen, as Kingpin of EVGA has told us in the past.
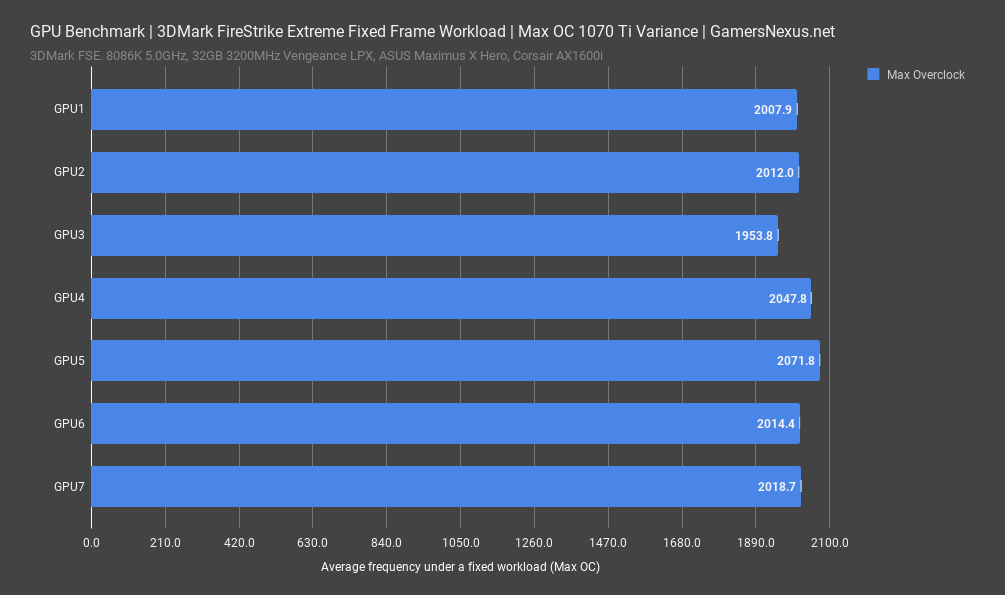
The next chart shows the maximum overclock for each card, beginning to establish the start of the silicon lottery demonstration. The maximum stable GPU frequency was on GPU5, running at an impressive 2072MHz for the 1070 Ti. The next best was GPU 4 at 2048MHz, then GPU7 on 2019MHz. Note that GPU1 had a higher stock frequency than GPU7, but GPU7 has a higher overclocked frequency. Also note that this is the stable frequency after a few hours of burn-in, so it’s an aggressive bin rather than a review duration bin. GPU3 has some serious issues, but they’re deeper than frequency. GPU1 would be disappointing in the face of GPU5, as 70MHz is actually beginning to be significant for benchmark performance. Perceptually, in terms of gameplay, you won’t notice much or anything, but it’d show up on charts.
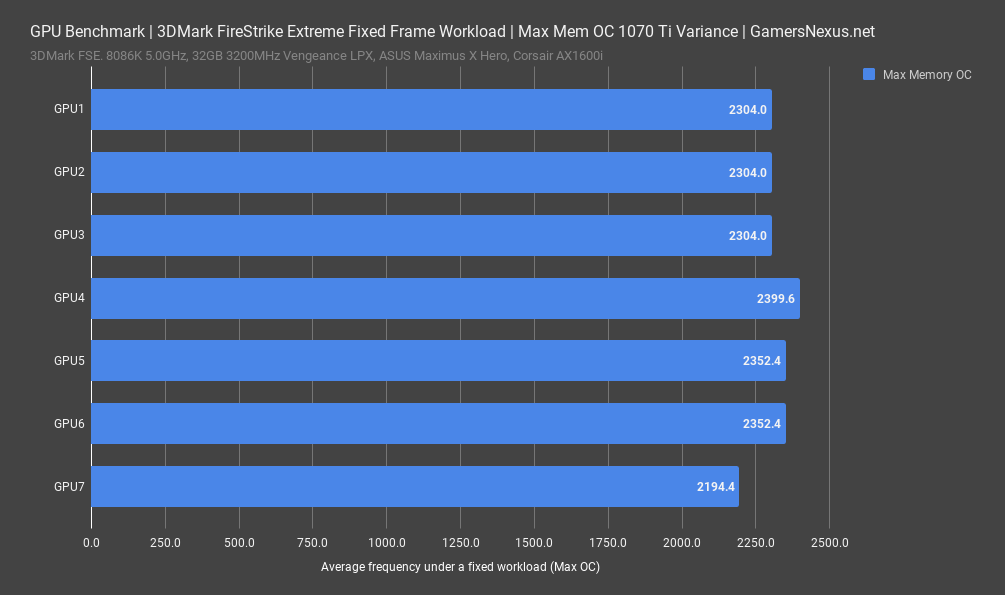
Finally, for maximum memory overclock, we ended up stuck around the same 600MHz offset for each set of VRAM. GPUs 1, 2, and 3 hit 2304MHz, with GPUs 5 and 6 getting a bit higher, landing at 2352MHz. GPU4 managed 2400MHz, impressively, and GPU7 got stuck at a measly 2194MHz, a definitive worst. Note that you’d have to multiply this by 4 to get the effective speed, as we’re showing actual speeds.
Game Results
GTA V
The frequency tells most of the story for this comparison, but games will help illustrate the rest. Knowing now what our stronger performers are in an average frequency over time chart, we can see if any of those differences correlate with benefits that exceed test variance.
Note again that these are from our old GPU test bench results as they were tested before RTX Super or Navi came in.
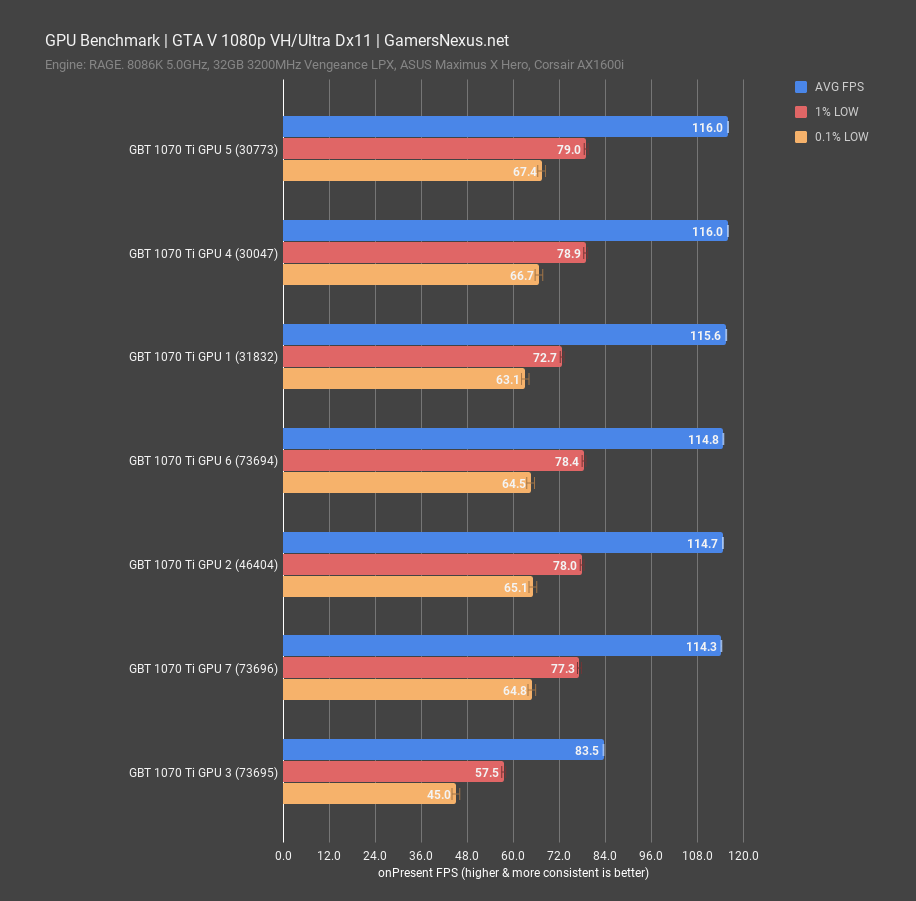
For GTA V at 1080p, we measured the average results to be within a range of 1.3FPS of each other once subtracting the outlier. GPU number 3 is an RMA unit and, it seems, there’s good reason for it to be an RMA unit. It looks like this one has a defect in the GPU, despite being comparable in clock speed. We retested this one three times and came up with the same results. Stripping the outlier, the FPS range is close enough that it’s within test error. As for whether the better-performing GPUs correlated with the higher FPS, GPUs 1, 4, and 5 had the highest stock clock speeds, and these GPUs also ended up with the highest framerate in game. The data consistency here is excellent to see, and our test-to-test variance has low standard deviation, so accuracy is good. Even the 0.1% lows are within test error and standard deviation. With about 5 test passes per GPU per resolution, we can start to see slight deviation from card-to-card based on those earlier clock speeds, but it doesn’t amount to much when stock.
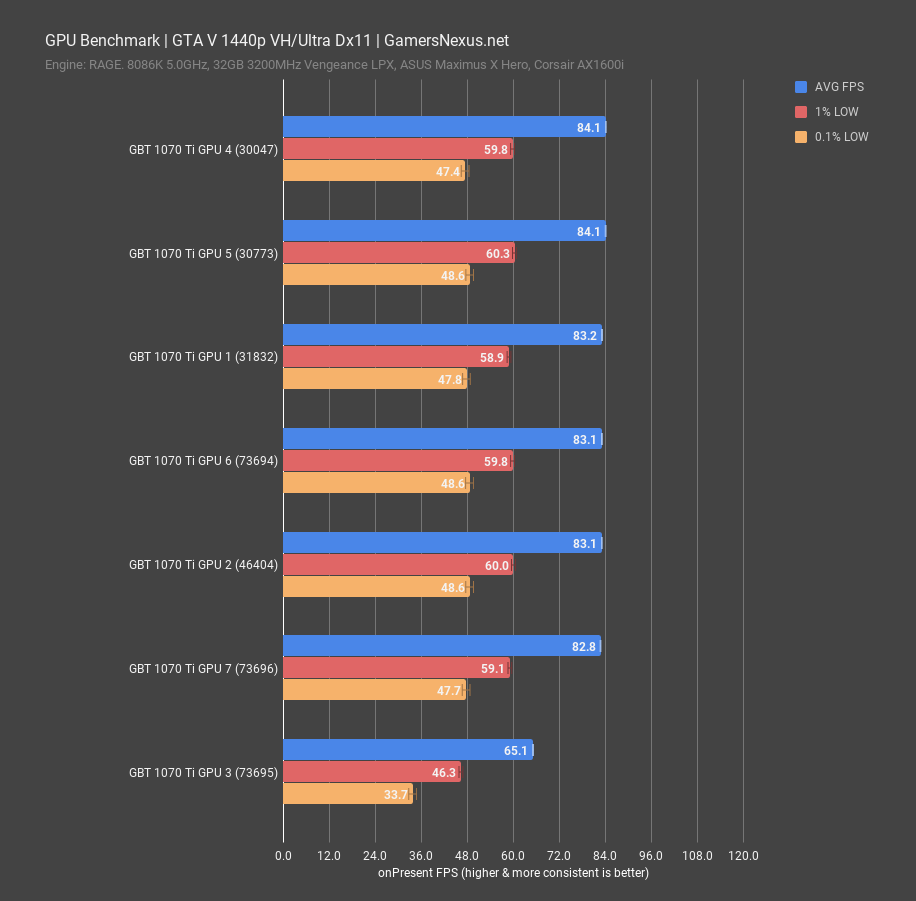
At 1440p, the stack remains very similar: GPU 5 and 4 again tie for first, differentiated only by error margins in the 1% lows, and GPU 1 follows these, with GPU 6 next in the list. Our top 3 performers for clock speed remain the top 3 for stock FPS, predictably, and GPU 3 again is shown to be an outlier.
Our standard deviation is 0.1FPS AVG across 35 test passes, 0.5FPS 1% lows, and 1.05FPS 0.1% lows.
F1 2018
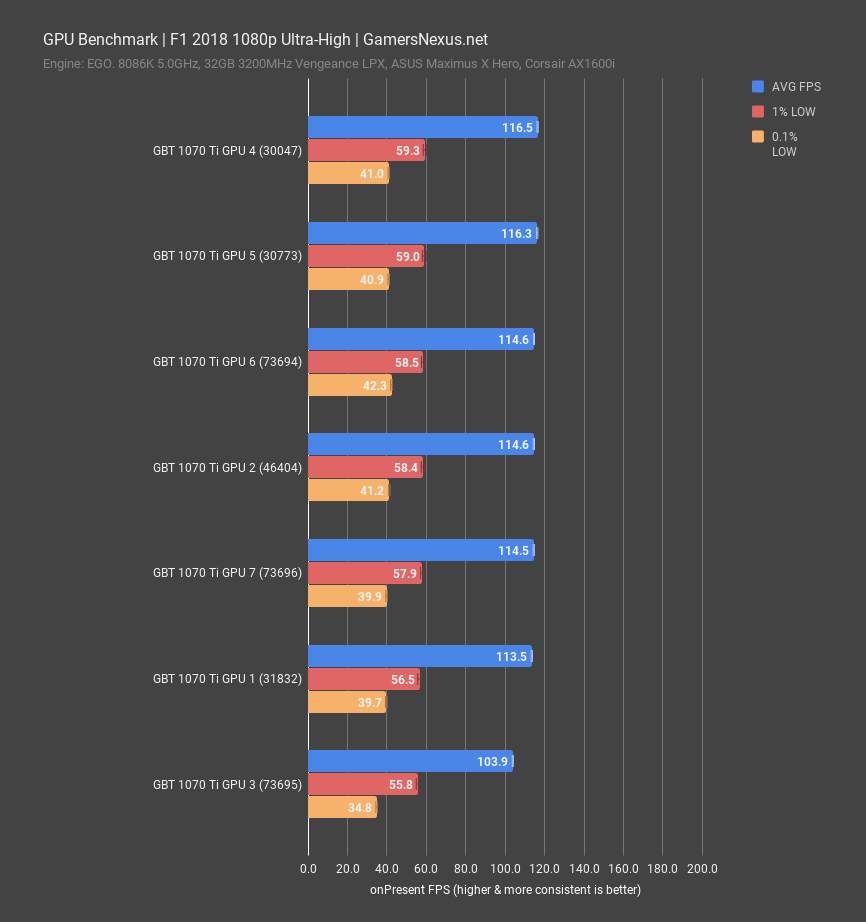
For F1 2018 at 1080p, our results range is 2.7FPS AVG, with standard deviation at about 0.3FPS AVG, 1.6FPS 1%, and 0.6FPS 0.1% lows. Performance lands GPUs 4 and 5 again at the top, with the next three all roughly tied. 1% and 0.1% lows are all within test variation, with only GPU 3 standing as an outlier – but at least it’s consistent. The top-to-bottom range here is 2.6% improvement from GPU 1 to GPU 4 and, with an AVG FPS deviation of 0.1FPS, that’s dead-on for each card. 2.6% isn’t a huge deal from a consumer standpoint, but can be a big issue for reviewers. This is why it’s best to either use a single GPU for CPU test benches or to use custom software to control your GPU speeds. GPU 1 was one of the better three clockers in 3DMark, but that performance doesn’t necessarily carry 1-to-1 to every type of workload. For reference, GPU 1 scored between 113.4 and 113.8 FPS AVG in all test passes, with GPU 4 scoring 116.56 to 116.77FPS in all test passes.
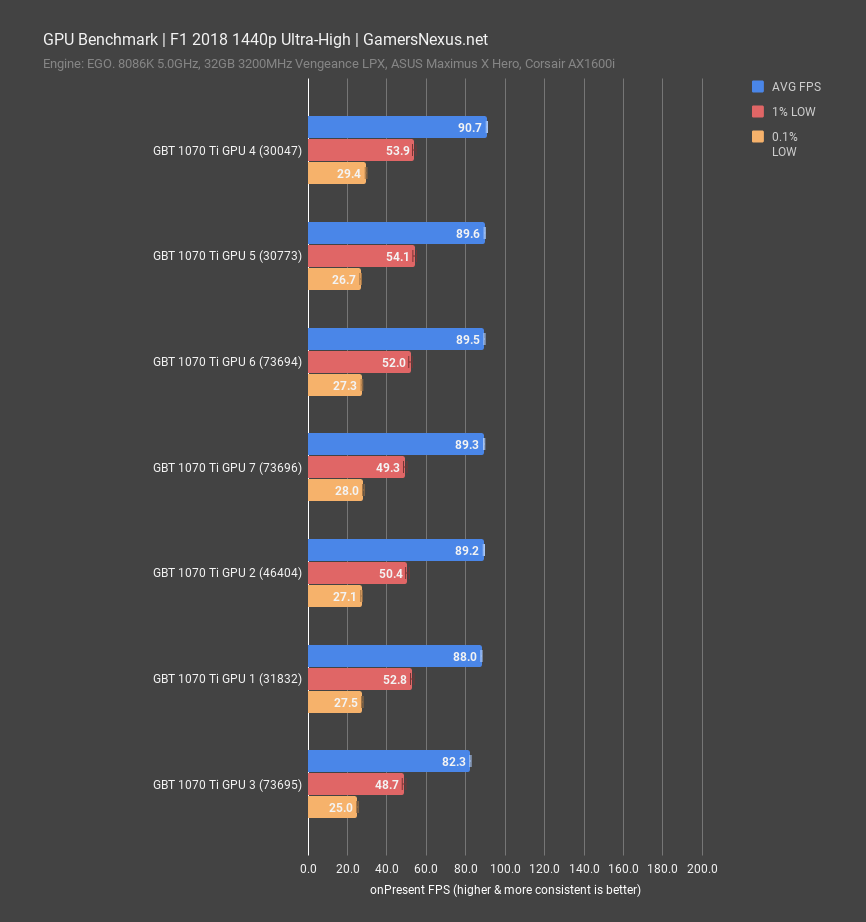
At 1440p, the test results show a range of 2.7FPS AVG, or a maximum percent increase from bottom-to-top of 3%. Consistently, GPUs 4 and 5 are at the top of the list, although GPU 1 remains lower than we might have expected based on the previous results.
Far Cry 5
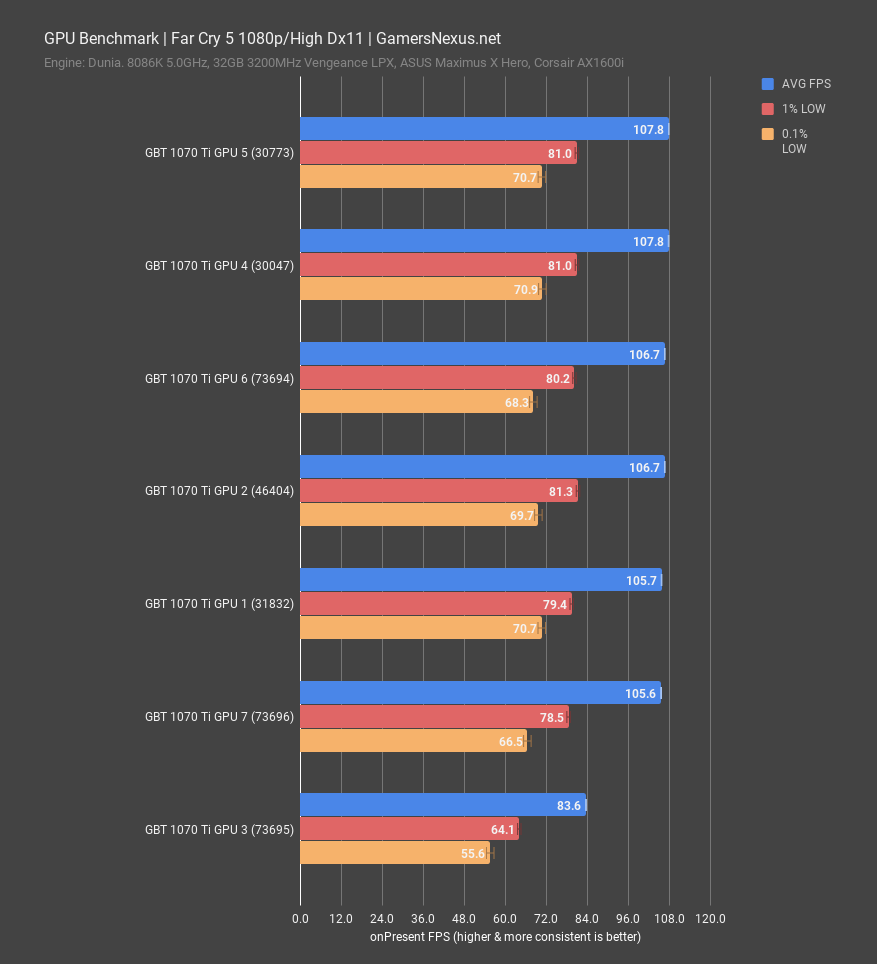
Far Cry 5 at 1080p is next. For this one, our range is 105.6 to 107.8, ignoring the obviously broken outlier. Bottom-to-top, that’s an increase of 2%, or a range of roughly 2FPS AVG. Results are still consistent for GPUs 4 and 5, which are tied and within even the smaller error of this test. They’re actually almost identical, and GPUs 6 and 2 are within our standard error for these tests.
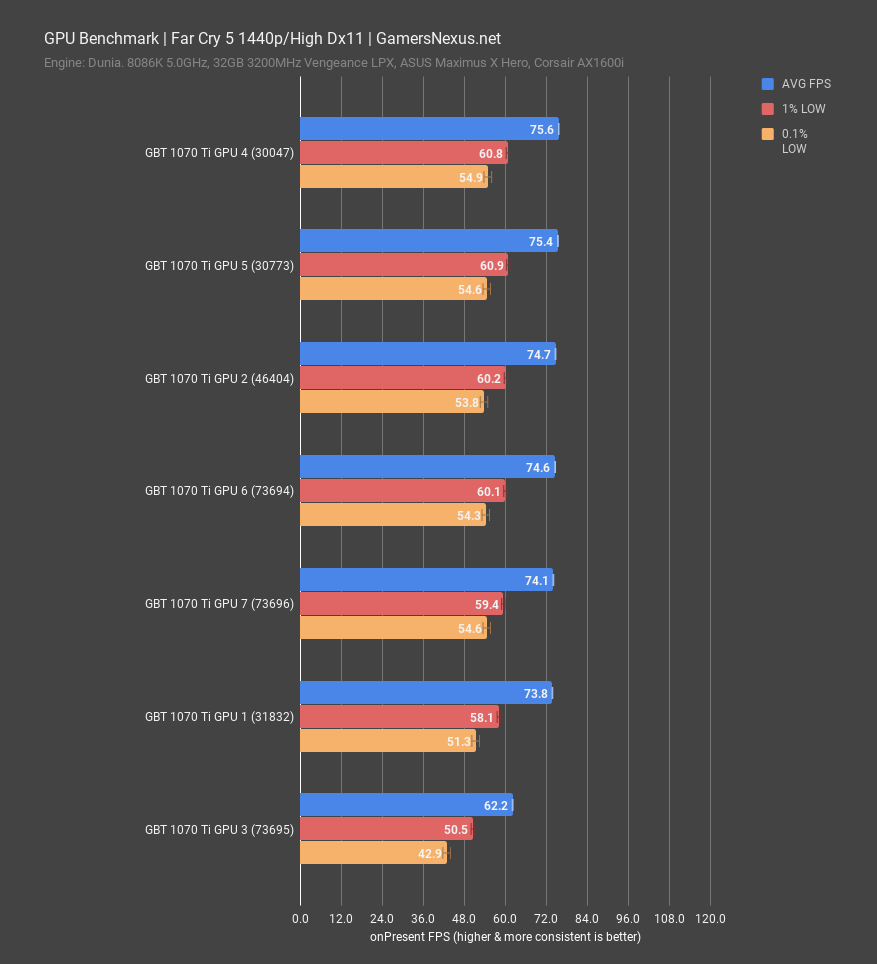
1440p shows almost the same stack, except GPUs 7 and 1 trade places and GPUs 4 and 5 trade places.
SOTTR
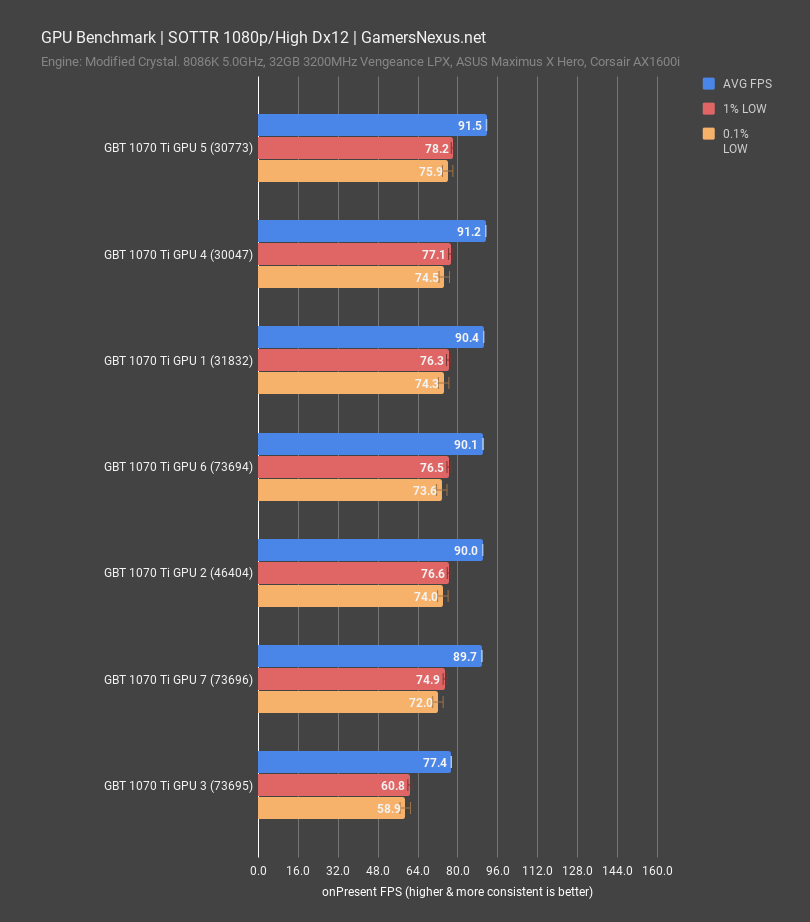
Shadow of the Tomb Raider is the last one we’ll look at. At 1080p, the range of performance is 1.8FPS AVG total, with GPUs 4 and 5 remaining consistent in placement throughout all of these tests. We can see that there’s at least some direct, real-world correlation to the higher average clock speed, but it’s not enough of one that you’d ever notice without a large sample size and highly controlled testing. The only difference on this chart that a user might observe would be a defective GPU, like unit number 3. The rest are all well within average test variance in less controlled environments than our own.
Conclusion
At the end of the day, against our sample size here, it wouldn’t much matter one card to the next as long as you don’t get a total lemon, like GPU 3, which clearly has a defect and shows good reason for its RMA. Even if reviewers got “golden samples,” which we have more evidence contrary to than in support of, minimally the stock performance would be within error of what anyone else would get. Overclocking performance has some range, but that’s not news to anyone. What is interesting is seeing the range illustrated on the same model card, where we scale from 2072MHz at the high-end all the way down to 1954MHz, which is a massive range. 100MHz in overclocking headroom can have an impact on framerate and definitely on benchmark scores, but if you fall within the mean – say closer to 2030MHz – it’d be hard to differentiate any actual perceptual differences versus the top-end clock. The memory overclock with the 1070 Tis also spanned about 300MHz, although this will behave differently with GDDR6 and HBM2, clearly.
So, with regard to whether “golden GPUs” exist, the answer is one we already knew: Yes, it’s just that now we can actually illustrate the degree to which clocks change even when fully stock. This is especially important for reviewers, and demonstrates why you need special controls to ensure GPUs are comparable in non-GPU test benches.
Editorial, Testing: Steve Burke
Video: Josh Svoboda, Andrew Coleman