Diving into GN's methods for testing CPU coolers (2020 - 2023 Test Methodology)
The Highlights
- GN's cooler testing has evolved over a decade and thousands of tests
- Normally, automatic variables must be controlled for
- Your computer or monitoring software may be lying to you

NOTE: This methodology is for our 2020-2023 CPU cooler test bench. Much of this information will remain relevant even as we move to refresh our cooler bench at the end of 2023; however, parts of it will change when we switch to new methods. This was originally written in 2020 and remains representative of all cooler reviews published between 2020 and November of 2023 for GN, and most of it will remain representative after that, but with changes to the core components.
The biggest rule in testing coolers is to never trust anything: Don’t trust the numbers, don’t trust the software, don’t trust firmware, and don’t trust the test bench. Every step of the way is a trap lying in wait to sabotage data accuracy. We’ve spent the last 3 years refining our liquid cooler bench and the last 6 months refining our new testing that will feature air coolers and liquid coolers alike. With millions of cells of data, we now know enough to have identified every relevant hidden pitfall in testing on this platform and finally feel confident in providing a full picture for accurate CPU cooler performance. But that's the key phrase: This platform. With our future cooler testing methods, we'll have to revisit all of this again.
Credits
Writing, Testing
Steve Burke
Video
Keegan Gallick
Josh Svoboda
Andrew Coleman
Web Editing
Jeremy Clayton
The Problem with Cooler Testing
The upside is that we can finally start really collecting data. This write-up will cover the most common and the most obscure landmines for testing, laying a plan for our CPU cooler reviews and helping establish a baseline for quality and data accuracy. We promised a CPU air cooler round-up back at the end of 2016 or 2017, and we’re finally getting around to it and will be publishing a lot of cooler content over the next month or so. We’ll start with an A500 review after this methodology piece goes live, then we’ll break for our factory tour series, then we’ll be back to coolers.
This content is detailed and specific to CPU cooler testing methodology and processes. We will be using this as a reference piece for years, as it will establish testing practices to ensure accurate data. Most user data out there regarding CPU coolers is flawed in some way or another, especially the stuff posted in random reddit comments, but the trick is minimizing flaws to the extent possible while remaining real-world, because total elimination of variables and pitfalls is impossible on PC hardware. Users will often randomly post a temperature number and say something like, “my Spire is at 70 degrees,” but the trouble is that this doesn't mean anything. Not only is the CPU a (key) variable, but even how that CPU is configured by the board is a big variable. The performance is completely dependent on each configuration, and so unless the testing is looking at relative performance by swapping coolers in a controlled environment, it isn't very useful as a barometer. Even with alternative coolers tested on the same user's platform, variable workloads (e.g. if someone tests in game that has a bursted load pattern) can cause issues with drawing comparisons. The same is true for motherboards that automatically adjust voltages in ways which may not be sensible.
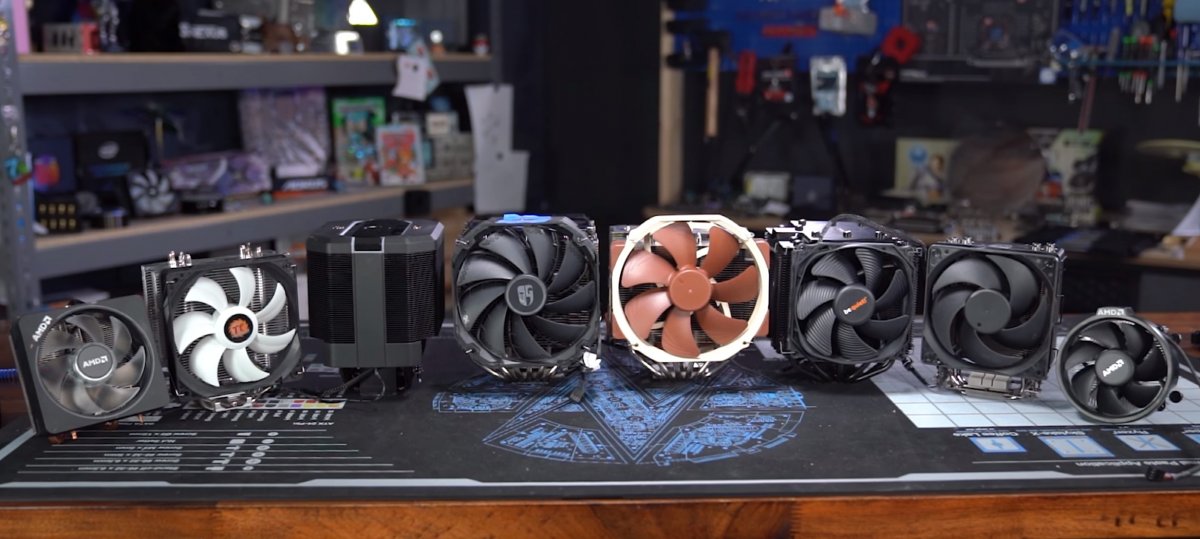
In this content, we’re going to show you 6 months of rigorous testing adventures that we’ve embarked on, including several months’ worth of discovering flaws in testing, common and uncommon errors, and bad data that could invalidate most comparisons without the tester ever even knowing. Several of these issues will exist in other reviewer configurations without technician knowledge, but the trick is to have the right tools to flag errant testing. These concepts will range from extremely basic to advanced.
Within a couple days, we’ll be publishing a mini round-up of coolers, then we’ll add to it one cooler at a time over the next few weeks. Expect a lot of cooler content from us in the immediate future. It’ll mostly kick off after our factory tour series in Taiwan, which begins this week.
Automated Testing, Test Setup, & Definitions
We’ve nearly fully automated our testing procedure on both the real-world and the dummy heater test benches. Our dummy heater is something we’ll talk about more in a separate piece and briefly here, but the main focus today is on outlining the pitfalls of real-world testing and how we’ve circumvented most of them.
A lot of bad test results arise from mounting pressure deviation or only testing a single mount. Other technician error can also produce variance in results, but generally, once the platform is set and the SOP is defined, most bad results are related to a bad mount.
As part of our automated testing, we’ve introduced automated system monitoring and have built software and spreadsheets that will flag us with warnings if any number exits expected results or standard deviation (or even a fixed value) in the testing, depending on which numbers we’re looking at. Red flags alert technicians that human oversight is needed, and that although the result may be accurate, it needs a closer look before it’s passed to content production. We collect hundreds of thousands of data points for every single cooler and have at least 45 final numbers (averages) that we evaluate for each one tested, most of which are for data accuracy validation. At the end, 5 averaged sets of averages – so these numbers average thousands of rows of steady state data – are produced for each of the four primary charts that we’ll be publishing.
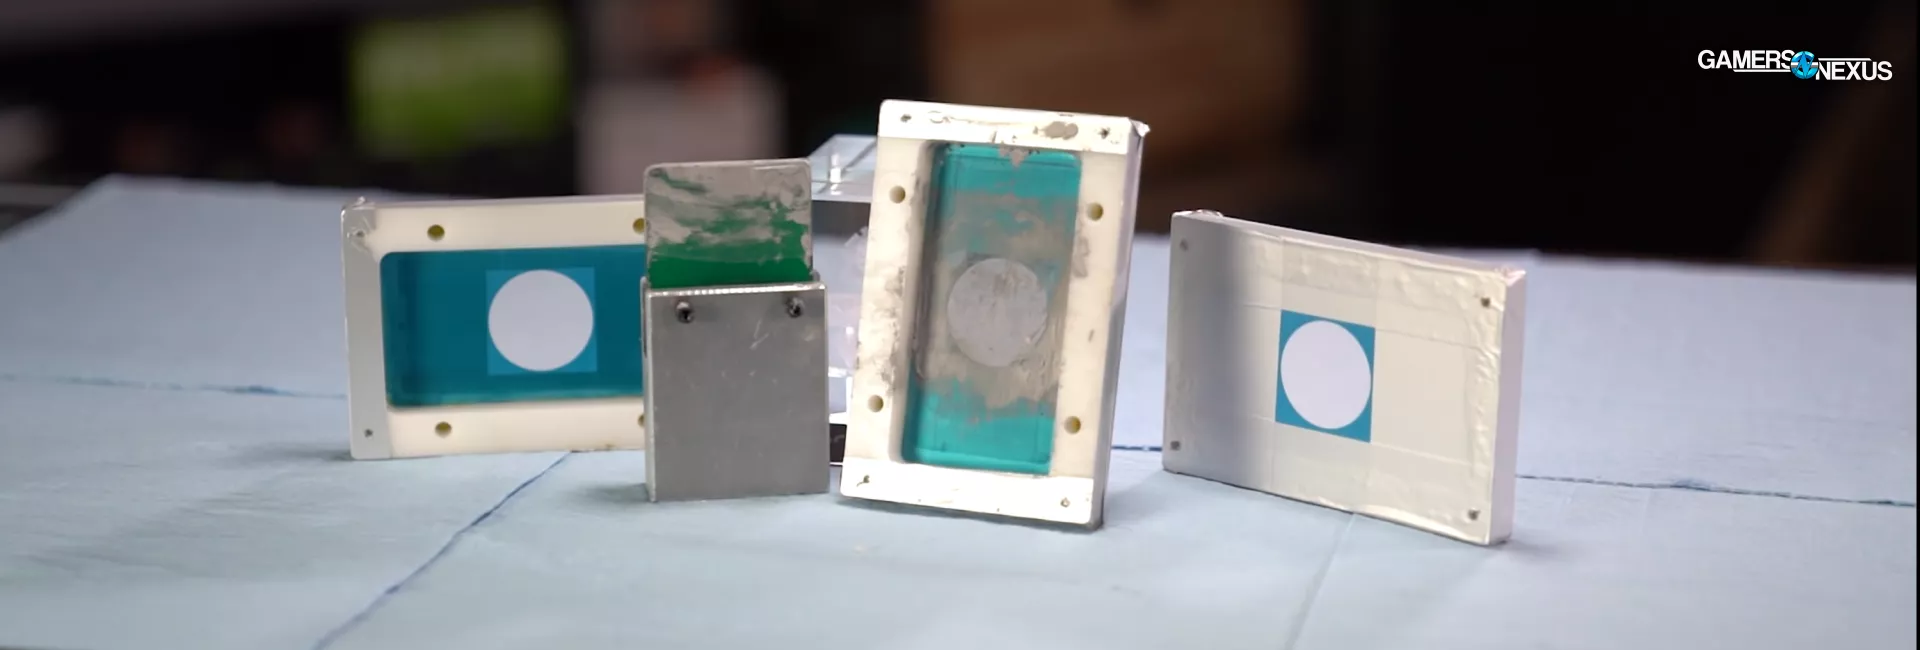
Cooler Test Validation & Prototyping: Intel Dummy Heater (TTV)
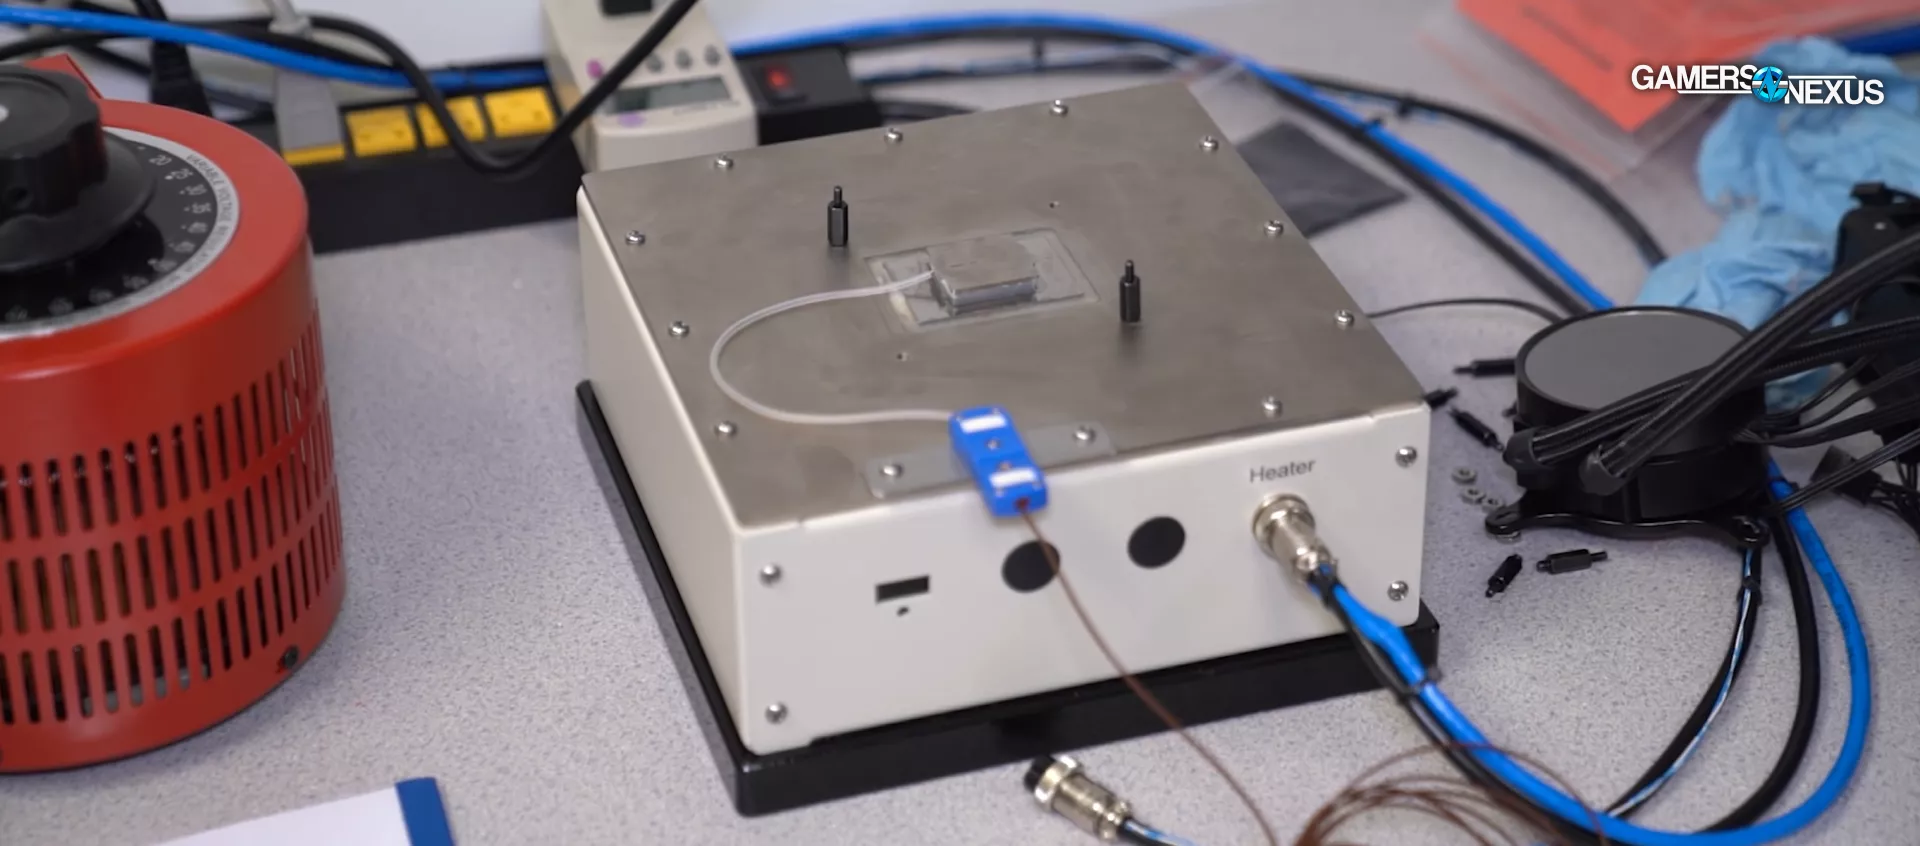
Our dummy heater is currently used for internal validation and is primarily useful for checking the hierarchy of the data. The numbers won’t be identical in an absolute sense, because it’s a difference of Tdie versus Tcase, but the scaling and positional orientation will match. We also use our dummy heaters for rapid prototyping of concepts, like that of scaling more power without needing to find “stable” CPU settings. We have one LGA115X-style heater and one AM4-style heater, both designed to GN’s spec.
CPU Cooler Test Validation: Custom-Made AM4 Dummy Heater
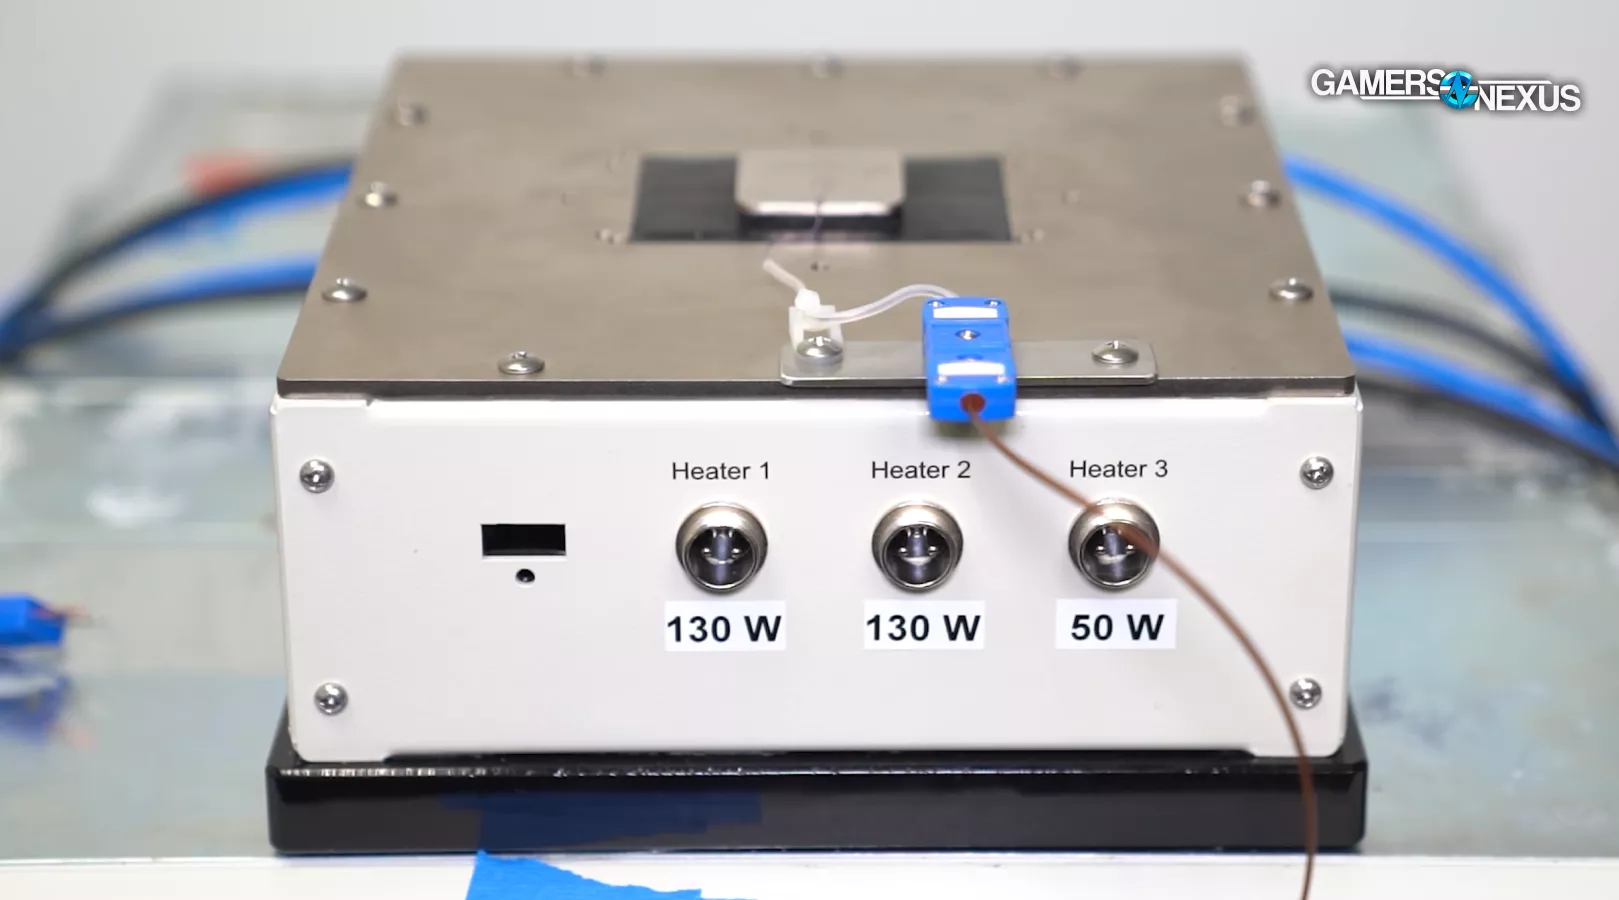
The AM4 heater is special: For this one, we designed it such that resistors are in roughly identical locations to AMD’s three chiplets on AM4 DT CPUs, so we’ve got resistors representing an IO die and two core chiplets. These can be powered in any configuration, so if we want to simulate a 3800X, we can pull power from the second core chiplet and power only the IO die and first chiplet. We use $10,000 worth of benchtop power supplies, monitoring equipment, and custom dummy heaters to do all of this, and we thank our Patreon backers and GN store customers for making this possible. We always reinvest into the business and testing procedures heavily, and this wouldn’t be possible with only advertising revenue.
Anyway, the heaters can be dialed to specific heat loads to simulate processors and eliminate all the variables incumbent in a motherboard or computer. We still need real-world testing and largely rely on it, but dummy heaters eliminate any question in our minds about if our hierarchical scaling is accurate and free of technician or test error. We’ll save the rest of the details on this for now.
Common Mistakes & Errors in Cooler Testing
This section will break-down our analysis of some of the most common or likely errors that could be encountered during the course of CPU cooler benchmarking. Trying to find the "best" CPU cooler is difficult, and it'll vary for every platform (so AM4 can't represent LGA115X precisely, for instance), but we can get as close as reasonably possible with some careful controls.
Since this will be a reference piece for a long time and we expect some of our readers are new to PC hardware reviews, we'll start with some fundamentals: Terminology, then the hardware.
Key Terminology & Definitions
We'll refer to several of these during cooler reviews and this methods piece:
- Ambient: We use the short-hand "Ambient" to refer to the local air temperature during the testing. We typically control ambient ("room") temperature to about 21C, +/- 1C, and we log ambient every second of the test.
- Steady State: This is used to refer to the temperature reaching equilibrium and leveling with the workload and the ambient temperature. For example, if a CPU takes 23 minutes to reach 70 degrees Celsius, then it stays stuck to 70C and does not move (but while the workload persists), we would call that "70C at steady state."
- Platform: There are technical definitions for this word within computing; however, for our purposes, we use it to refer to the total system on which the testing is being conducted. That most directly means the motherboard, but in test bench terminology, we also mean the rest of the fixed (unchanging) components.
- Delta T over Ambient: When referring to delta (change) in T (temperature) over ambient, we are referring to the remainder when subtracting the ambient temperature from the steady state temperature. For example, if the CPU is at 70C and the ambient is at 21C, and neither is moving, then we might say "with this cooler, the CPU ran at 49C delta T over ambient."
- TTV: Thermal Test Vehicle, commonly referred to as a "dummy heater."
- DMM: Digital Multi-Meter
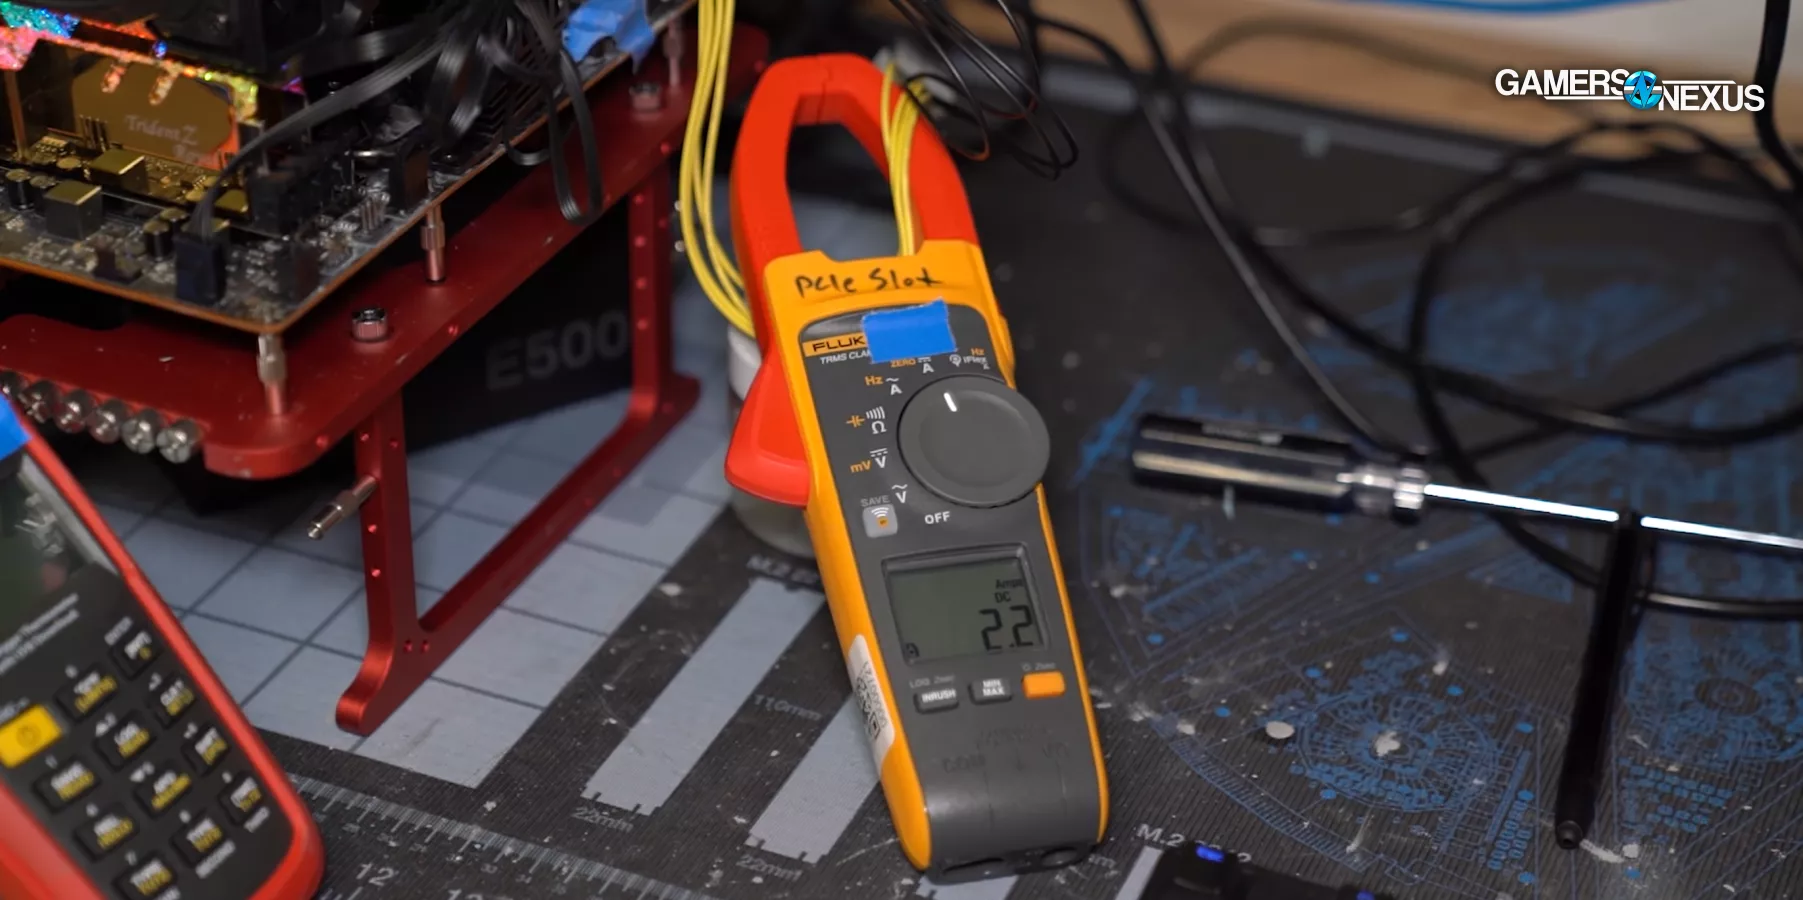
- Current Clamp: A physical clamp used to monitor current passed through cables, useful for ensuring no deviation in power consumption during course of testing.
- Efficiency: When we use this word in relation to cooler performance, we are referring to the cooler's thermal performance versus its noise performance. If the cooler is loud and runs the CPU hot, we'd call it "inefficient." If it is exceptionally quiet and runs cool, we'd call it "efficient."
- DUT: Device Under Test
- HSF: Heatsink & Fan
Fixed Hardware is Required
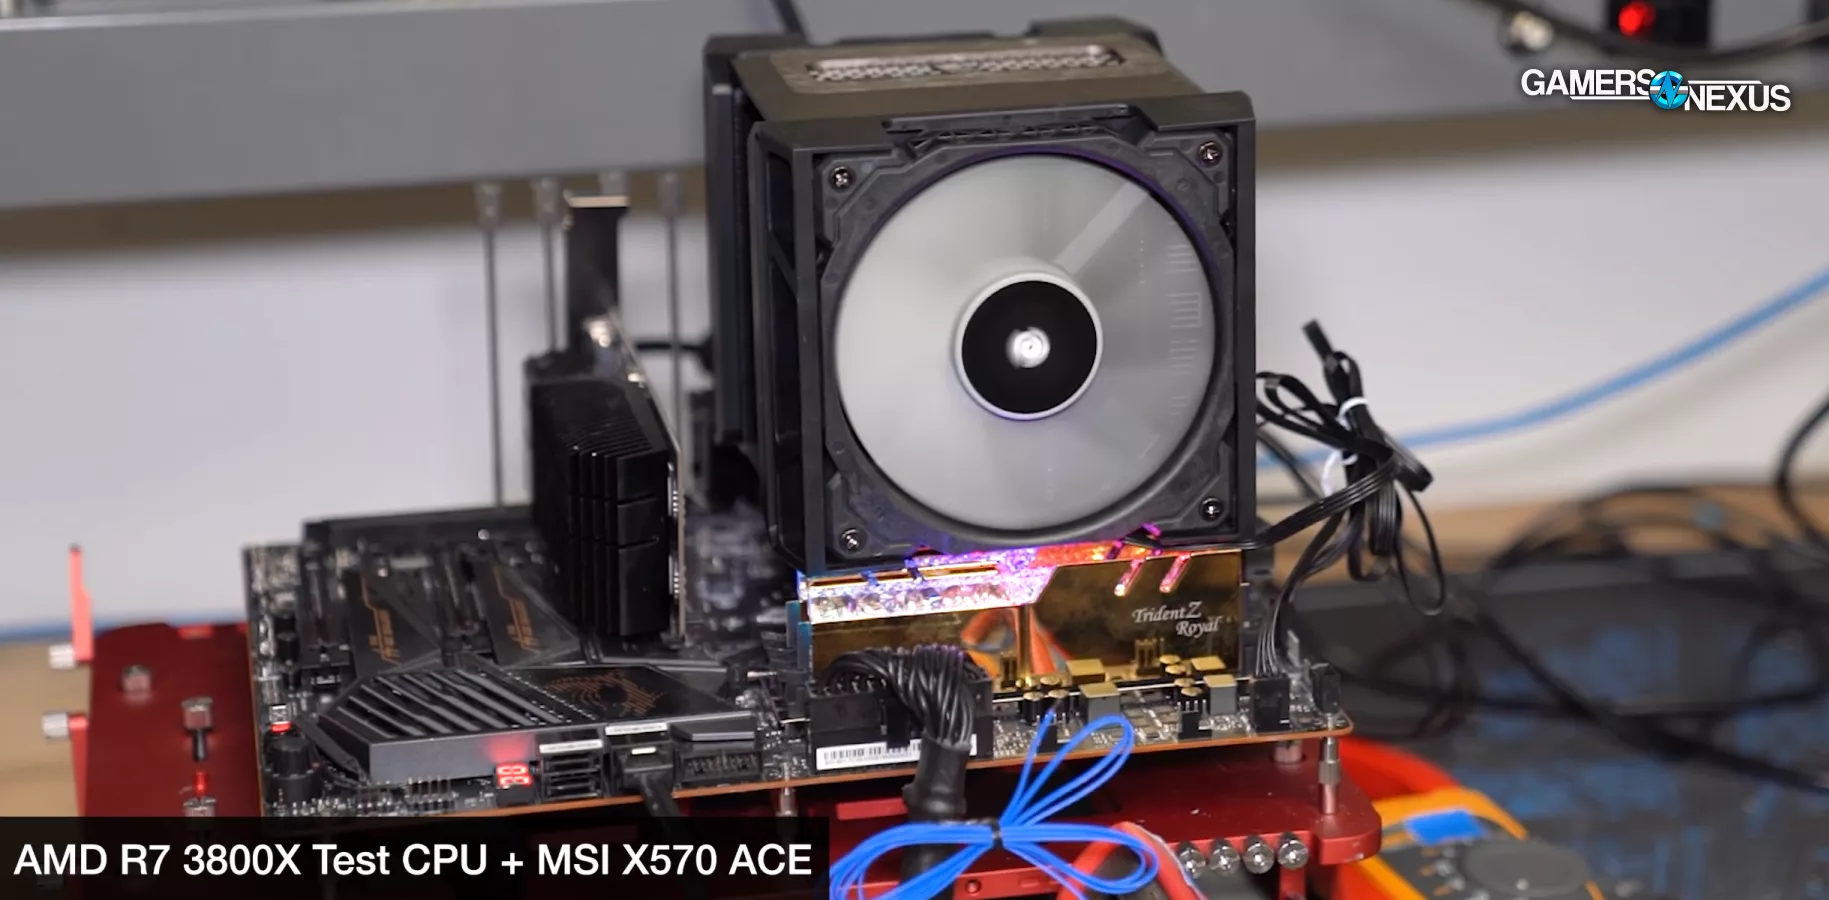
First: The exact same CPU (or CPUs, but on different charts) has to be used for all testing. You can’t compare coolers against one another with different CPUs – even if it’s the same model – under the coolers. Two 3800X CPUs will not produce the same results under identical usage conditions, and neither will two 9900K CPUs. The dies are all different, SMUs are different, the package is sealed differently, the thickness of the silicone adhesive between the substrate and IHS is variable, the solder thickness and quality is variable. One CPU to the next, it's not uncommon to see the core-to-core delta differ by 5-10 degrees.
Additionally, the same exact motherboard should ideally be used for all tests, and all voltages and power settings must be manually controlled on the board. Resetting BIOS with auto settings in play can change the voltages being driven to different parts of the CPU, and that includes more than just Vcore. Firmware should also remain fixed once the platform is up and running. We also use identical RAM, PSU, and everything else – we’ve tied-up a whole stack of components that will only ever be for a dedicated CPU cooler test bench.
The system should also be disconnected from the internet. We do this to avoid Windows updates that could alter CPU behavior in a way that would potentially shuffle cooler performance without us knowing. If Windows launches an update to change scheduling behavior, it could result in a change in how coolers appear to perform (even if the actual performance is unchanged). For cooler tests, all we care about is consistency: If Windows improves scheduling, that's no factor to how well one block of metal cools versus another, but it could change the observed results if one test had the improvement and the other didn't.
On that front, we also lock the power plan within Windows and power behavior within BIOS.
Logging & Spreadsheets Needed
The next one is the means used to take the final measurements: Easily the most common error is to spot-check some logging program for temperature, typically done by allowing the test to run some semi-arbitrary amount of time and then glancing at the numbers in the “maximum” column in HWINFO. We see this a lot in forum posts. It's OK for a quick check of if there's a mount issue (like obvious throttling), but isn't a repeatable approach for reviews where we're advising thousands of users.
The “maximum” column in HWINFO numbers can spike hard and may not represent the average at steady state. They also fluctuate pursuant to ambient and, without logging (rather than spot-checking), you could be off by a couple degrees if ambient fluctuates. That's fine for an end user's purposes of just making sure the CPU is running at an acceptable temperature, but a couple of degrees' worth of fluctuation could be enough to completely change the tone of which product is better in a comparative review.
To get enough data for meaningful averaging, we also have to run the tests sufficiently long to achieve steady state. Running Blender’s BMW test for 3 minutes or Cinebench R15's single pass isn't going to be enough to load the cooler fully and demonstrate its performance under real load conditions. This can disproportionately affect how liquid coolers will look in the stack since they have a longer soak time.
Controlling Fan Speed
Because cooling is defined in most instances by the speed and capabilities of the attached fan, fan speeds also have to be controlled.
Setting all fans to “100%” isn't helpful for like-for-like testing, but at least establishes how a cooler will perform if a user maxes-out the fan. It's at least better than arbitrarily picking a percentage - like 50% - and setting all coolers to that percentage.
In order to get a gauge for performance at a level playing field, we need noise-normalized performance (ours is 35dBA @ 20”, straight on, always with the air directed away from the meter). This allows us to get an efficiency measurement at the same noise level, since any cooler can brute force its way to the top with high RPM fans. Arbitrarily applying a 50% or similar speed to all fans also doesn’t make sense, since they’re all going to run at different RPM and noise levels with such a setting. More critically, some fans are optimized for performance in ways that’ll have hard fall-offs at certain PWM values and might be built to best deal with the accompanying heatsink’s impedance at a certain RPM.
Coolers Tested in a Case Only Valid for That Case
CPU coolers really can’t be tested well in a case, because then you’re basically just testing the capabilities of that case. We do that in our case reviews already: Our general philosophy, to try and limit variables and produce consistent data, is to isolate components in reviews. Cases get their own reviews, so we leave that analysis to those tests in order to keep reviews of approachable length and complexity.
Cases are so varied in design that there’s no point in trying to pick a “standardized” case to test against all coolers, and instead we think it's better to test open air where the field is level and relatively easy to extrapolate across other conditions. Using a case also gets really messy when dealing with radiators, where some cases won’t fit certain radiators in certain locations, and so a technician might end up moving the radiator mounting around depending on cooler. That invalidates the test, because it’s no longer standard: A radiator mounted in the top will be under different case ambient conditions than a radiator mounted in the front. Further, this would change the fans installed in the case, also invalidating results and making them incomparable. Other coolers will react differently with the pressure system of a case, where a sufficiently tall cooler might draft air from the top venting (if no fans are present and a negative pressure system exists near the cooler). This wouldn’t be equal across all devices. While it’d be a valid result, it’d only be valid for that case. We have case reviews for that.
The Computer is Lying to You
We’ll talk about each of these points in the ensuing paragraphs, but here’s what you can expect us to cover:
- Can’t trust the computer to do what you think is consistent – even with heavy controls, software can execute differently run-to-run (we’ve programmed our own solutions for this in combination with our Blender GN Logo render and active current monitoring)
- Definitely can't trust Windows! No updates allowed!
- Can’t trust the computer voltages to remain consistent (requires technician oversight and manual configuration)
- Can’t trust a single mount to be accurate enough for a review
- Voltage levels should be initially validated with a DMM to ensure fluctuation is either none or is known for future testing. This should be audited occasionally. BIOS resets, even with BIOS profiles, can mess things up.
Common Bench Setup Errors
Again, these will be addressed in paragraph form below, but we’ll start the items here:
- Ambient temperature must be monitored. Looking at the thermostat at the start of the test isn't good enough (nor the end of the test). Thermostats don’t measure at the inlet of the HSF, and so are invalid measurements. The hottest and coldest points in a room (or worse, a floor) can vary greatly against a thermostat’s single data point. We use active logging meters at the HSF inlet and control AC status.
- LLC and voltages should be known and kept consistent
- Paste application consistency between tests will impact results. We use a manual spreading technique and multiple full mounts and re-mounts to validate against our own data. If testing paste as applied by a manufacturer and needing multiple re-applications, we use a silk screen.
- Paste aging, shelf life, and batch-to-batch consistency mean that accumulating paste will work against you over time. We are able to refresh our long-term supply, but we also have a fresh, cycling supply of thermal compound with effectively perfect batch-to-batch consistency, but it comes from factories that we’ve met with in Asia. We found enough variance run-to-run with over-the-counter thermal pastes that we were dissatisfied with their consistency for cooler benchmarks. It’s fine for an end user, but not for reviews. When we discover consistency issues, we run re-tests and discard any bad data (or bad paste)
- Another common error is that technicians don’t control which fan header is used, which is bad because RPM can change slightly between headers
- Location in the room matters a lot. Our bench’s position is marked on a GN Modmat and is fixed
CPU Power Consumption is the #1 Consideration
When we compare the thermal performance of one cooler to the next, we need to know what that really looks at. Ultimately, it’s the ability of the cooler to dissipate a known, fixed amount of energy being shed as heat. Knowing this, the most important control is power. If you don’t control the power that the CPU consumes, you won’t have any accuracy or like-for-like comparisons. Variables in BIOS or software will invalidate tests, and a lack of controls means the technician will never know. Power is the single most important aspect of cooler testing, and once that’s accounted for, everything else falls into place.

Can't Trust the Application
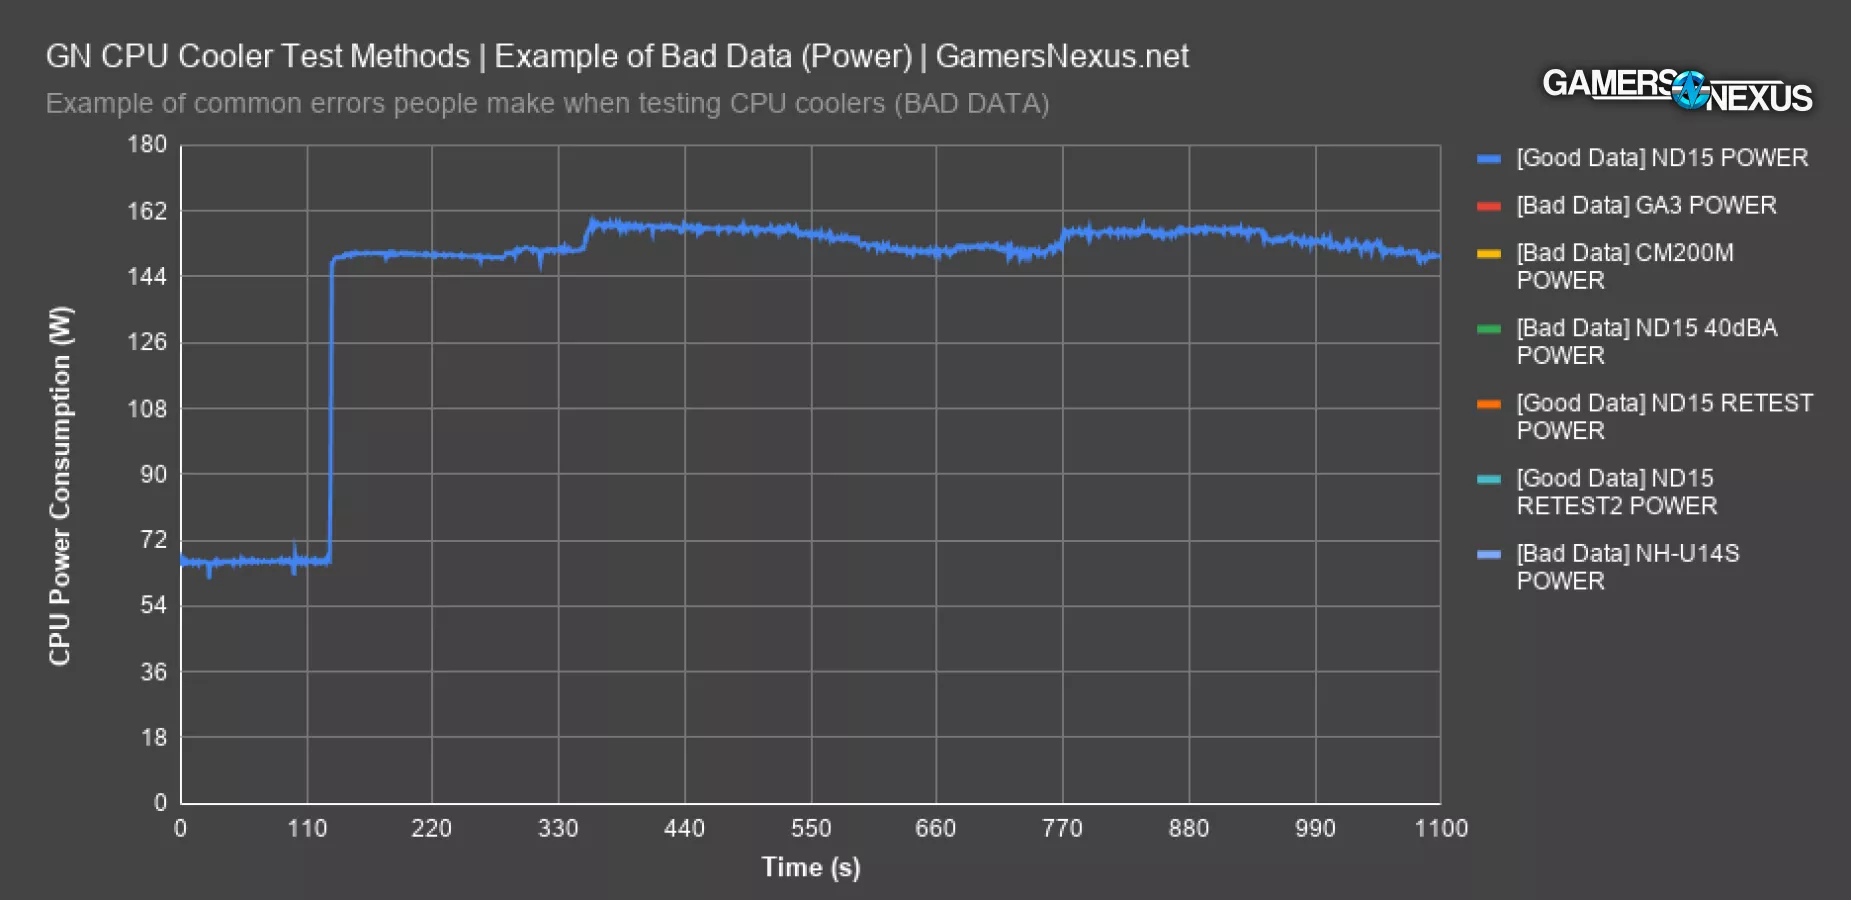
This chart of intentionally bad data illustrates the most common oversight. These are some test passes we threw out because they were invalid from software variance, not from operator error. In other words, the operator did everything according to the SOP, but the application produced unexpected variance.
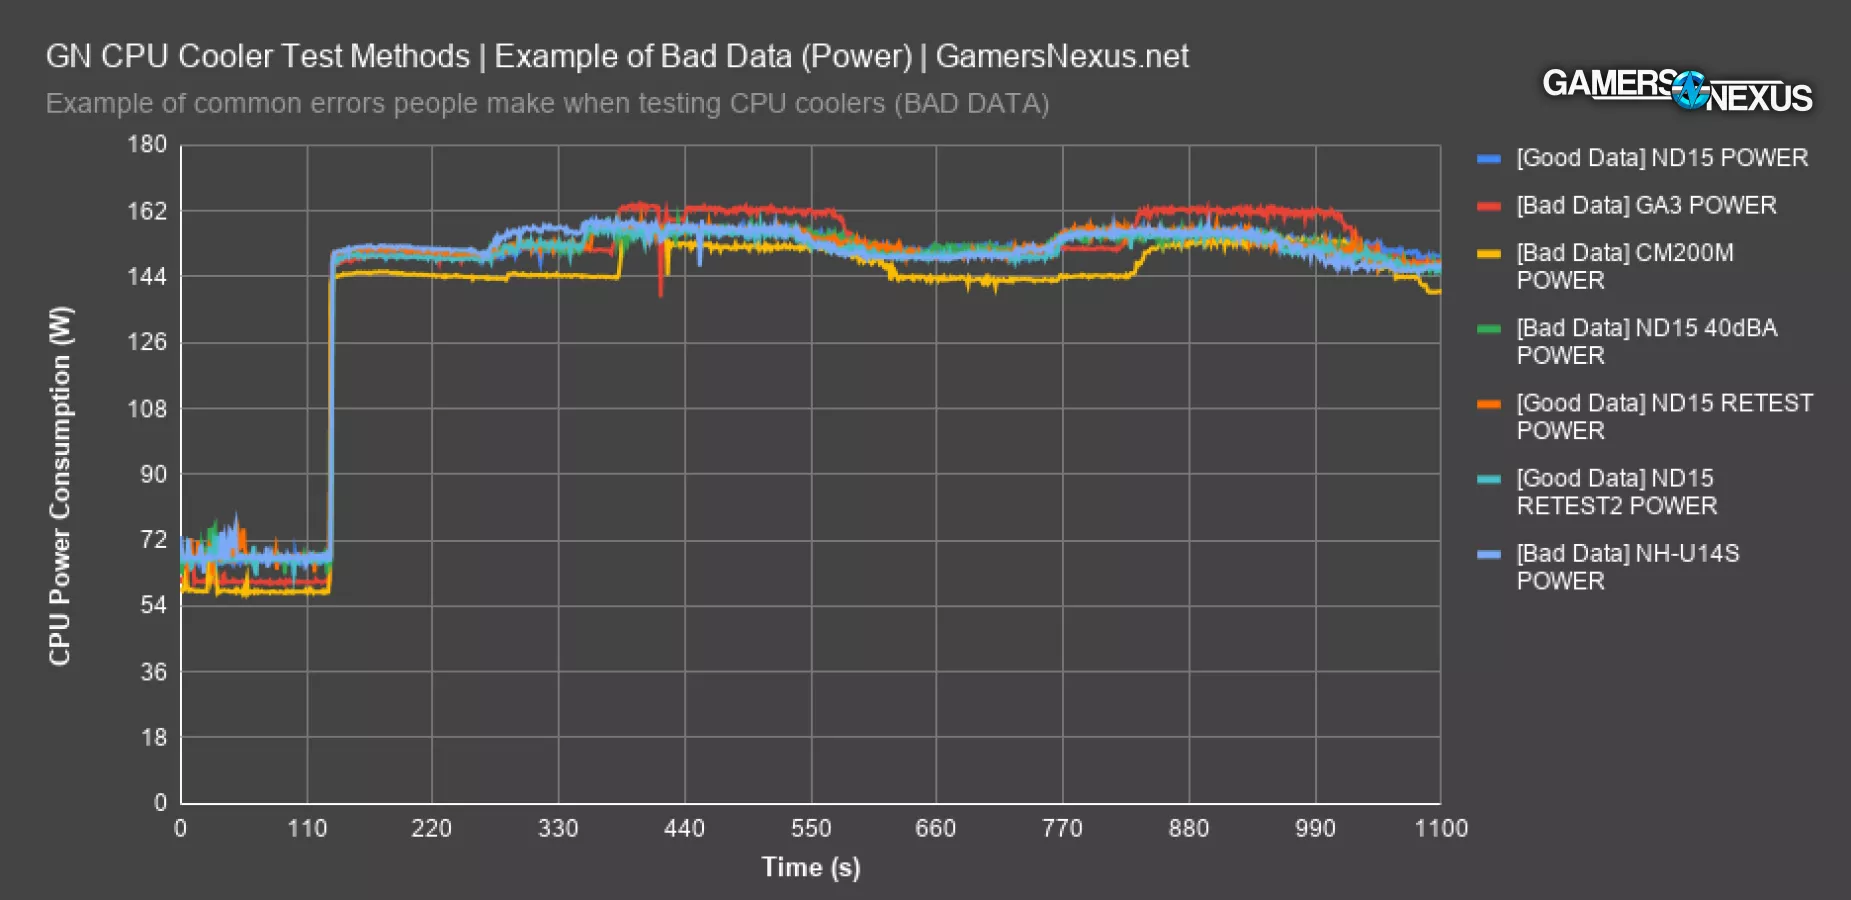
Every one of the lines drawn should be equal to the lines marked in the legend as “GOOD DATA,” so orange and two of the blues. They all line-up with each other. The bad data is first illustrated with one of our Deepcool Assassin III test passes, where power consumption spiked from an expected mean of 156W to 163W. This spike can influence the rankings and would put the Assassin III under an unfairly high heatload compared to the others. 7 watts might not sound like a lot, but when everyone is fighting over fractions of a degree of difference, every minute deviation from the mean matters. 7W is still an increase in power consumption of about 3.8%, so that matters and the data is stricken from the results. In a scenario where this happens, we’d investigate it and run more tests, then determine if it’s a technician error or software error. If it's from our SOP, then we'd put new steps in place to fix the configuration. If it's from software variance, we'd re-evaluate use of that software or figure out how to better control it.
Another example would be the Cooler Master 200mm cooler: In this bad data: In the bright yellow line above, we can see that the initial power spike in the soak test doesn’t go high enough, plateauing at 150W instead of 156W. The floor also comes down lower, to 144W instead of 150W, and the next spike is latent despite being an automated test. This is an instance where the software didn’t behave as usually expected, and although our test benches are disconnected from internet and stripped of services as a matter of practice, it’s possible that Windows did something anomalous in the background with scheduling.
Even if you control the voltages, the frequencies, the ambient temperature, mounting pressure, and everything else, it’s still possible for test data to be completely wrong. This most typically happens because applications can occasionally exhibit spikes in power behavior from run-to-run, and most people just trust that it’s going to work the same way each time. In order to eliminate this concern, we have hooked up a current clamp to the EPS12V lines on our test bench and are monitoring power input constantly with physical, external tools, but we’re also using software to keep an eye on things. Software alone isn’t good enough – you really need both solutions to do it right.
How Power Should Look (New Tests)
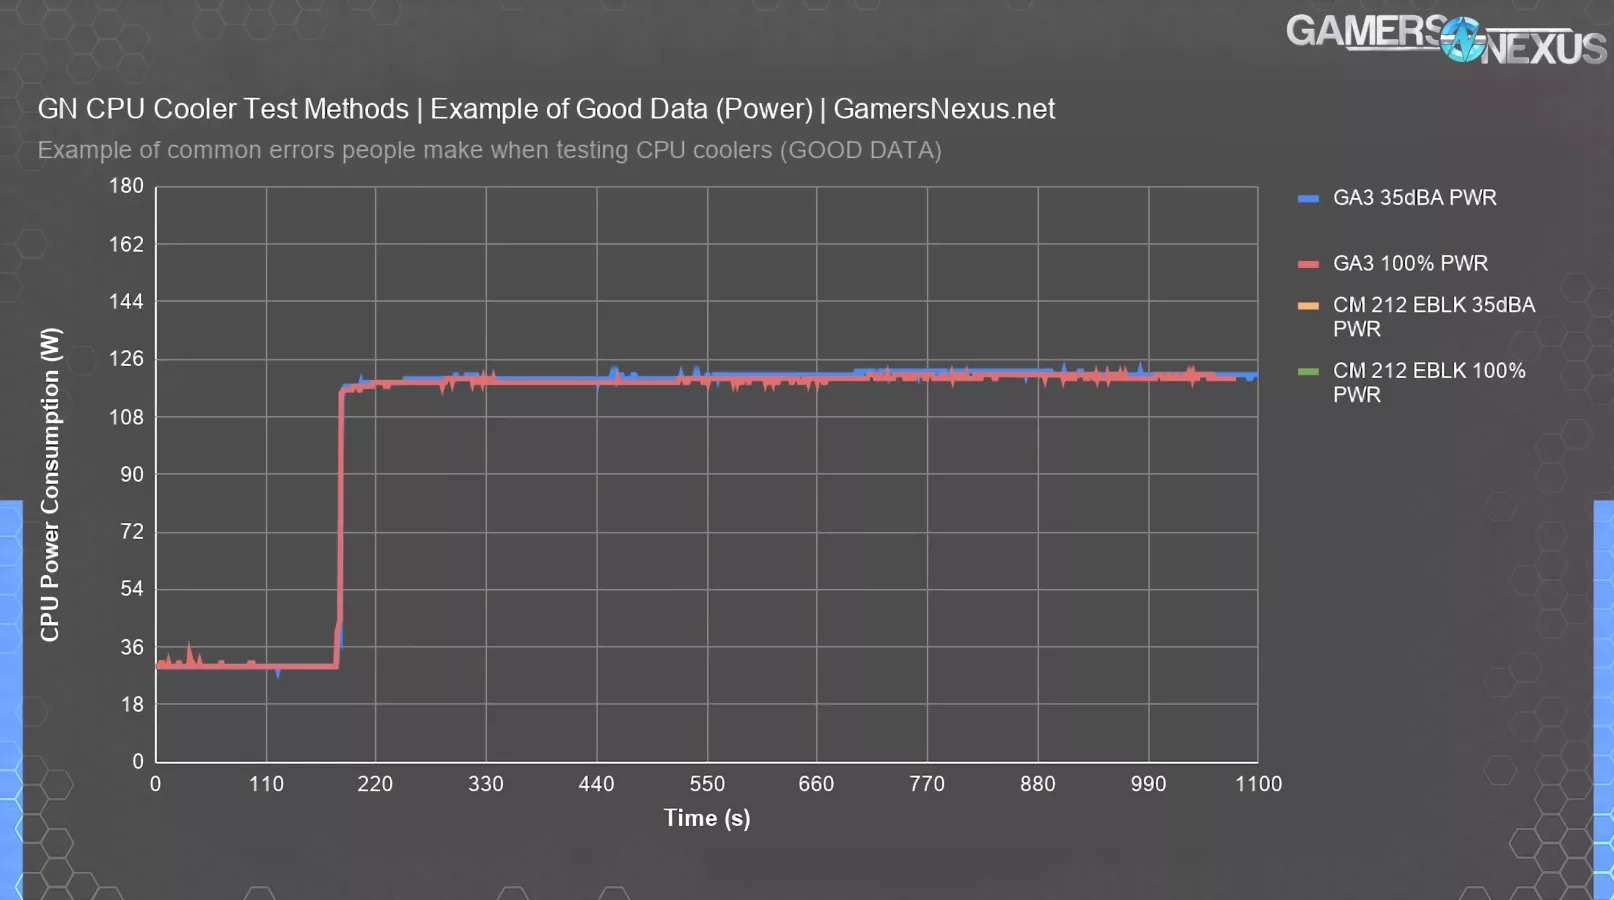
Here’s an example of how the power consumption should look. This is our new test bench with refined methods and software that GN custom-built to improve automation and reliability of testing. This doesn’t exist publicly and took months of testing for us to fine-tune. The first few lines here are from the Deepcool Assassin III with different speeds and some validation passes. The cooler performed strongly even with reduced fan speed as a result of its surface area and contact, clearly, and so power is almost perfectly equivalent from one cooler to the next. There are some spikes up-and-down, as you can see, but the peak-to-peak delta is 3W when looking at initial start of the test and the hottest point at the end. Our data is averaged at steady state at the end; the bench must be allowed to warm up for a sufficient period of time prior to averaging data, as there will be some power leakage over time as the CPU gets hotter. In this test, power leakage is low since the cooler is among the best performers.
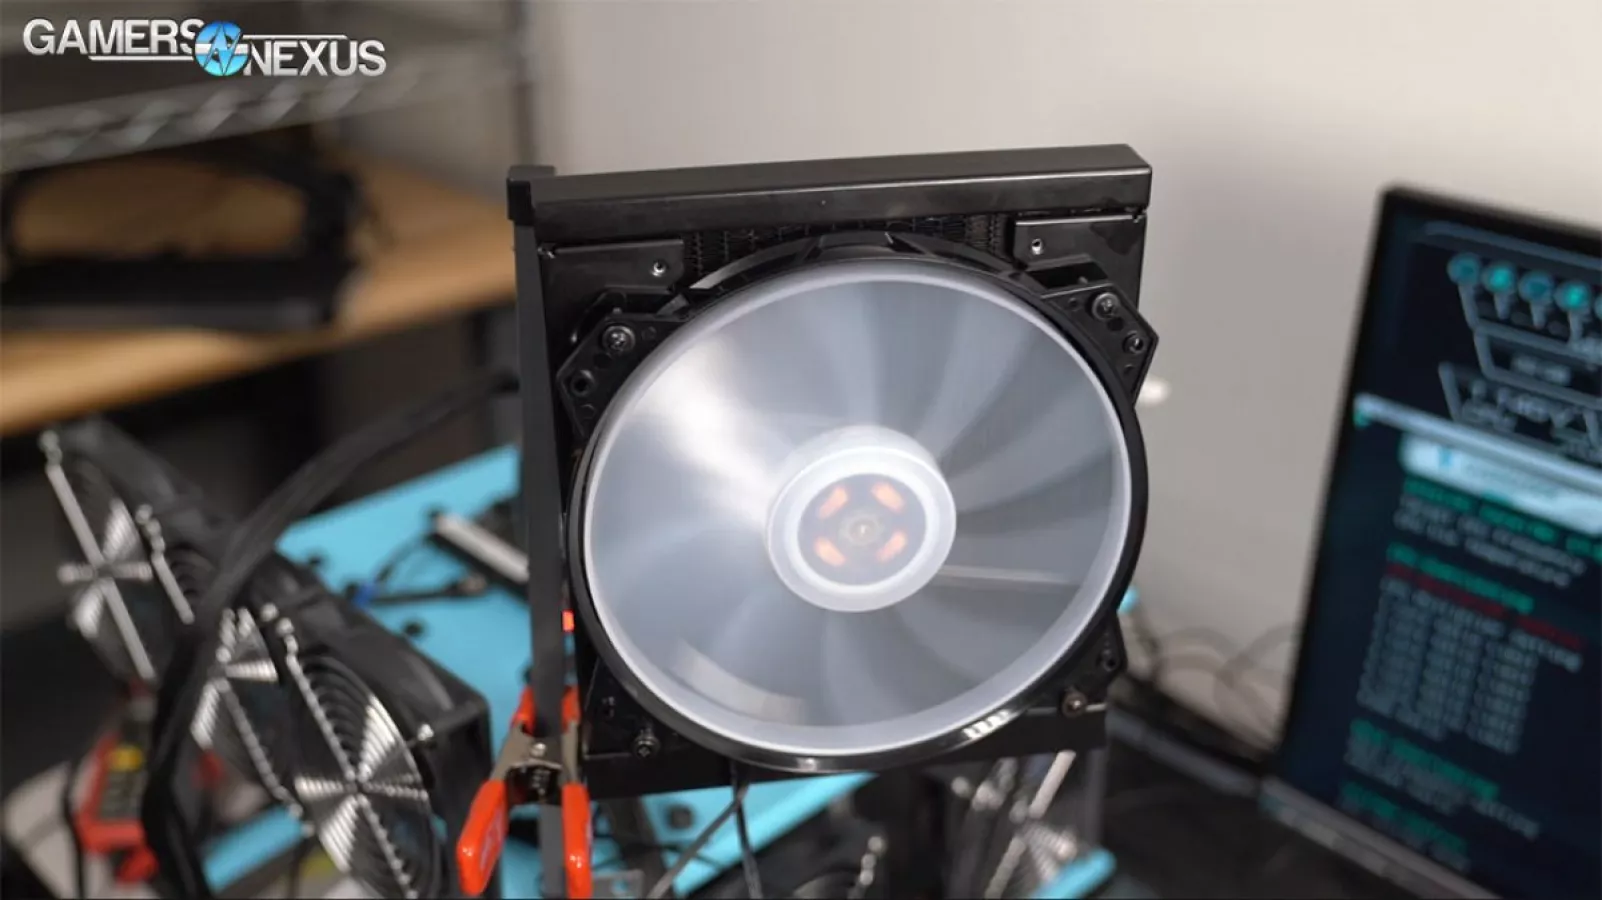
Power Leakage Challenges: Cooler Master Hyper 212 Thermals
That brings up another point, though: separate from software variance and issues shown previously, we also have to keep an eye on power leakage with lower-end coolers that run hotter.
We can next plot one of the lower performers.
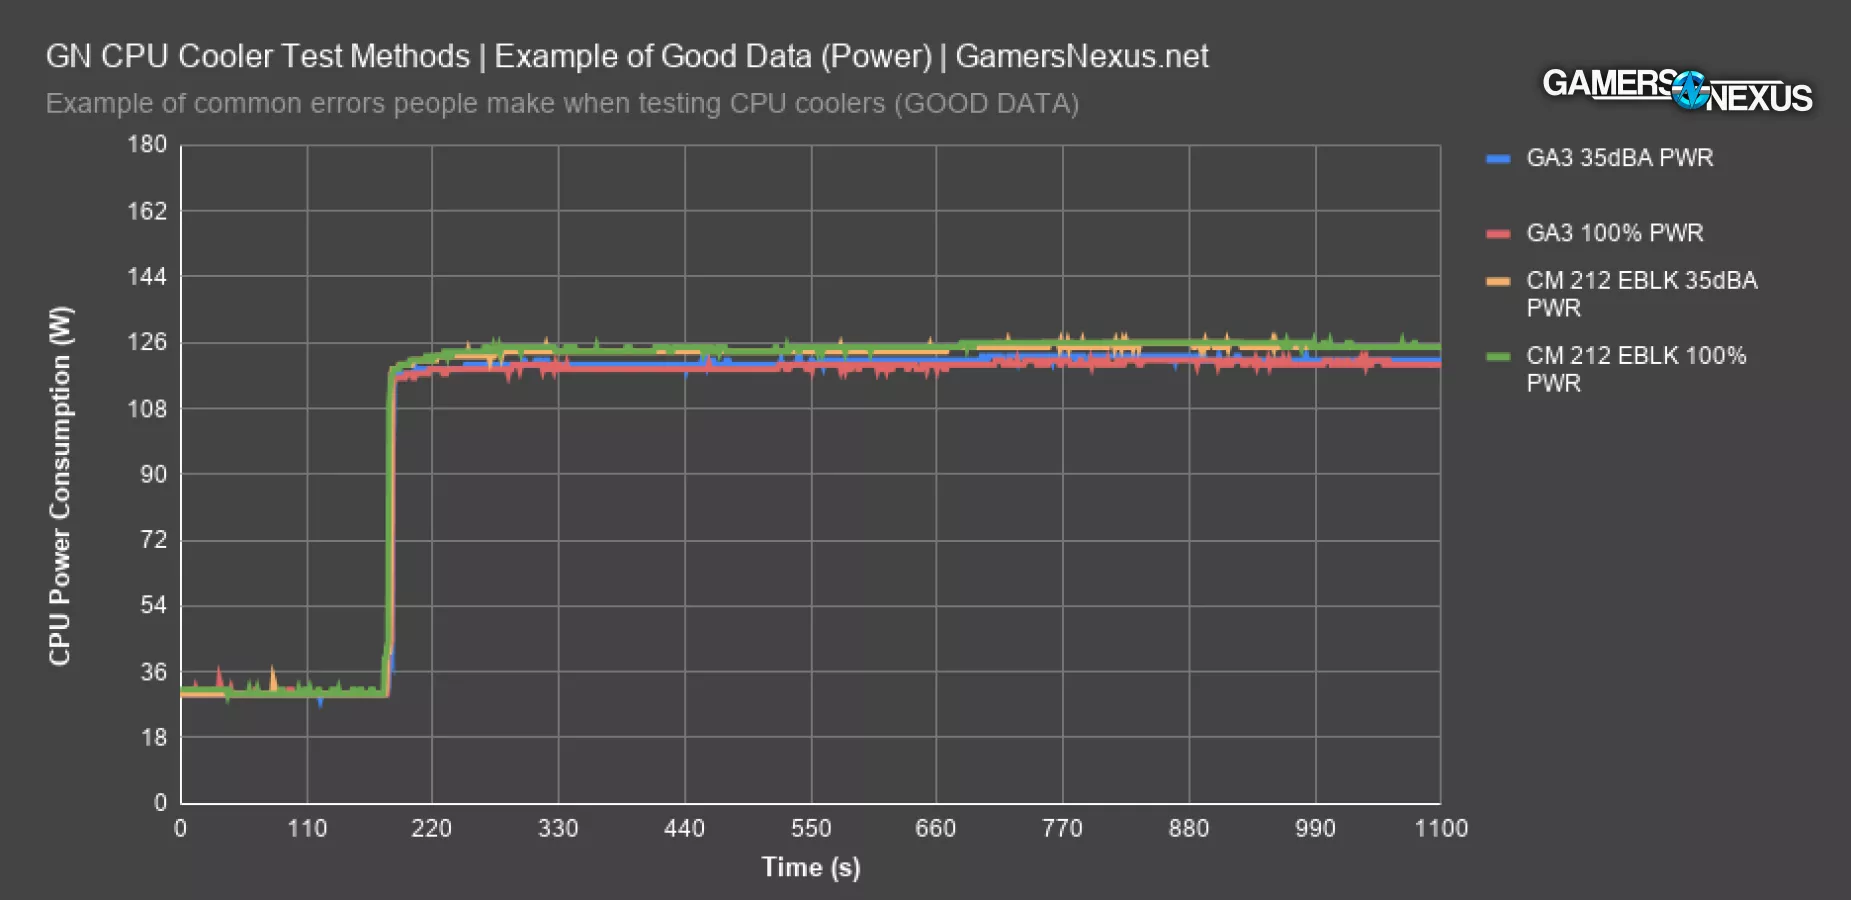
For this one, the Cooler Master Hyper 212 Evo Black is behind the Assassin III in thermals in a significant way, to the extent that some additional power leakage shows up in testing. This isn’t error and is part of life with a lower-end cooler. We can control for this on dummy heaters that we’ve also built, but at some point, you do have to look at the real-world implications of using silicon that has additional power leakage external from software testing. In this instance, the power leakage is caused from running hotter, and so this is considered a valid metric in the test. The increase is about 4-5W from leakage. The best way to report on this is to inform viewers of the power leakage change while reporting thermal results. We want to make extremely clear that the previous sample data with variance was specifically from software behavior and the software’s inability to behave precisely the same way each time, whereas this test shows software behaving the same way, but power numbers changing as a result of cooler inefficiency. That’s an important distinction and is another item that most cooler reviews won’t notice or point-out.
Example of Bad Voltage Data (Noctua NH-D15)
We’re next going to show you an example of a test bench that was controlled the same way as every other test, but anomalously produced bad data for one run. This chart is zoomed intentionally.
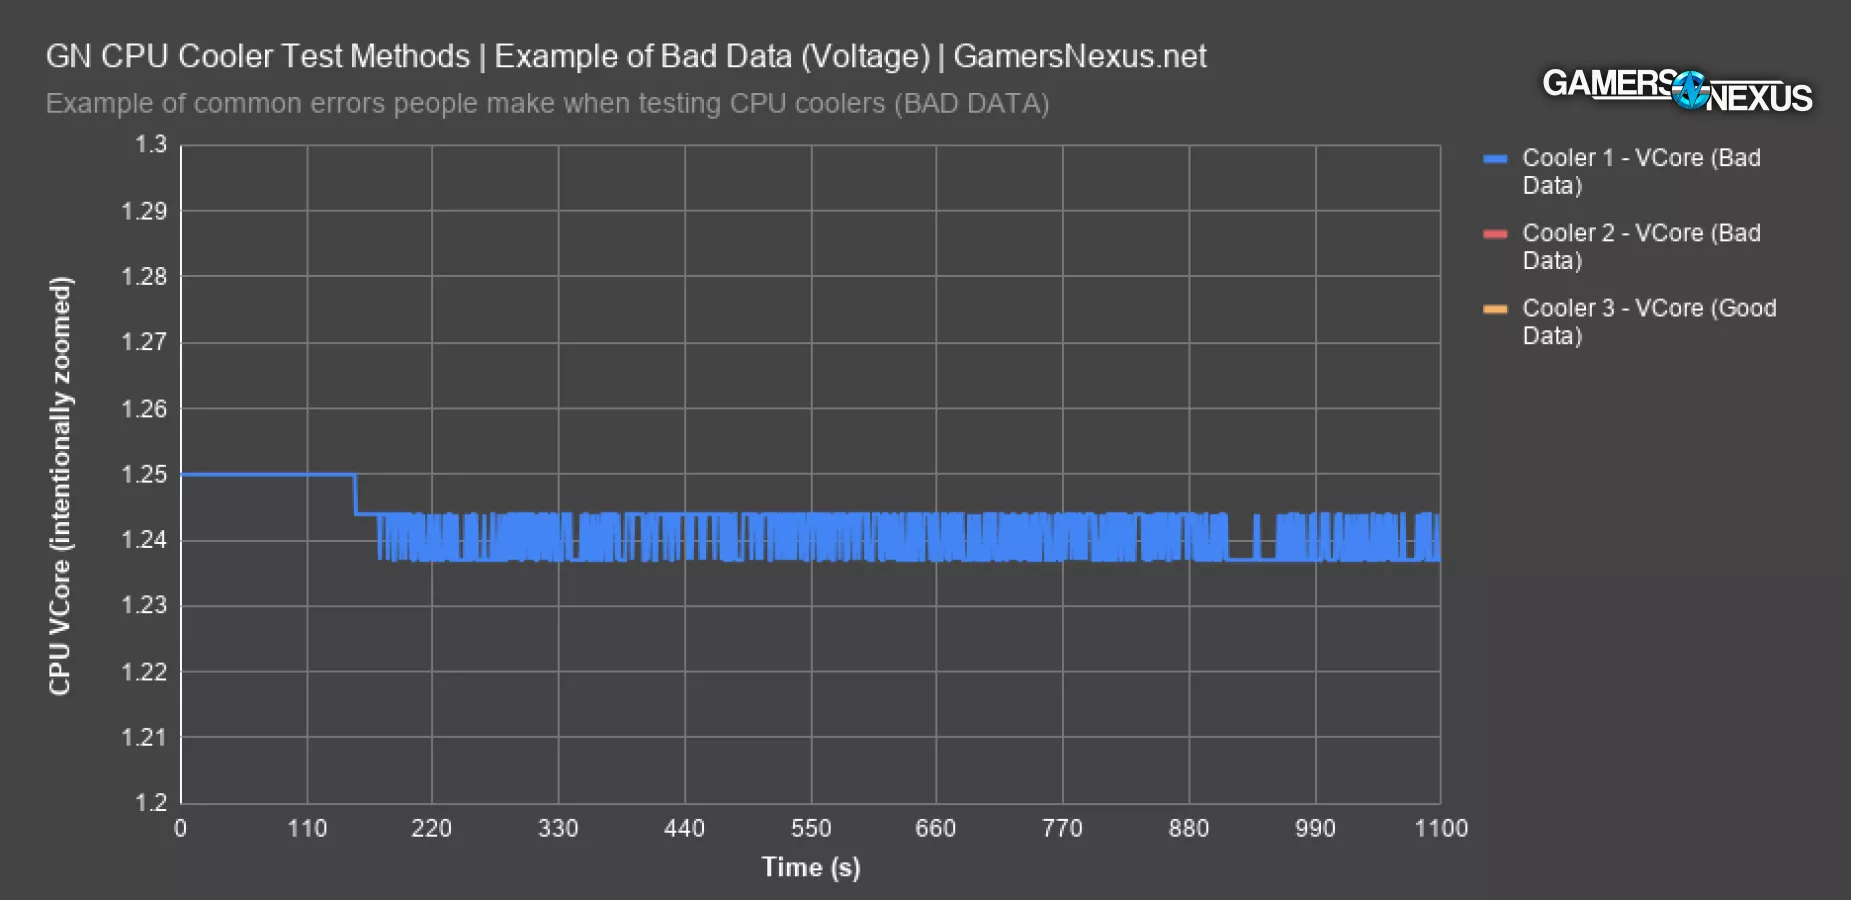
In this one, we used the same BIOS profile as all the other tests and nothing changed on the bench or with software, and remember that it’s not connected to internet, but VCore still behaved in a non-fixed way. We ultimately resolved this issue by loading defaults and re-applying the BIOS changes, but this is another item that would produce errors in data and must be closely watched. That's a concern, because that means something assumed to be fixed (BIOS and voltage) became unexpectedly variable. At a technician level, this can create a lot of anxiety for data consistency.
But we try to reduce anxiety caused by software and testing around here. We built some custom charting software to flag these types of deviations for us and notify the technician automatically. Since this isn’t even technician error, it’s an important thing to be aware of.
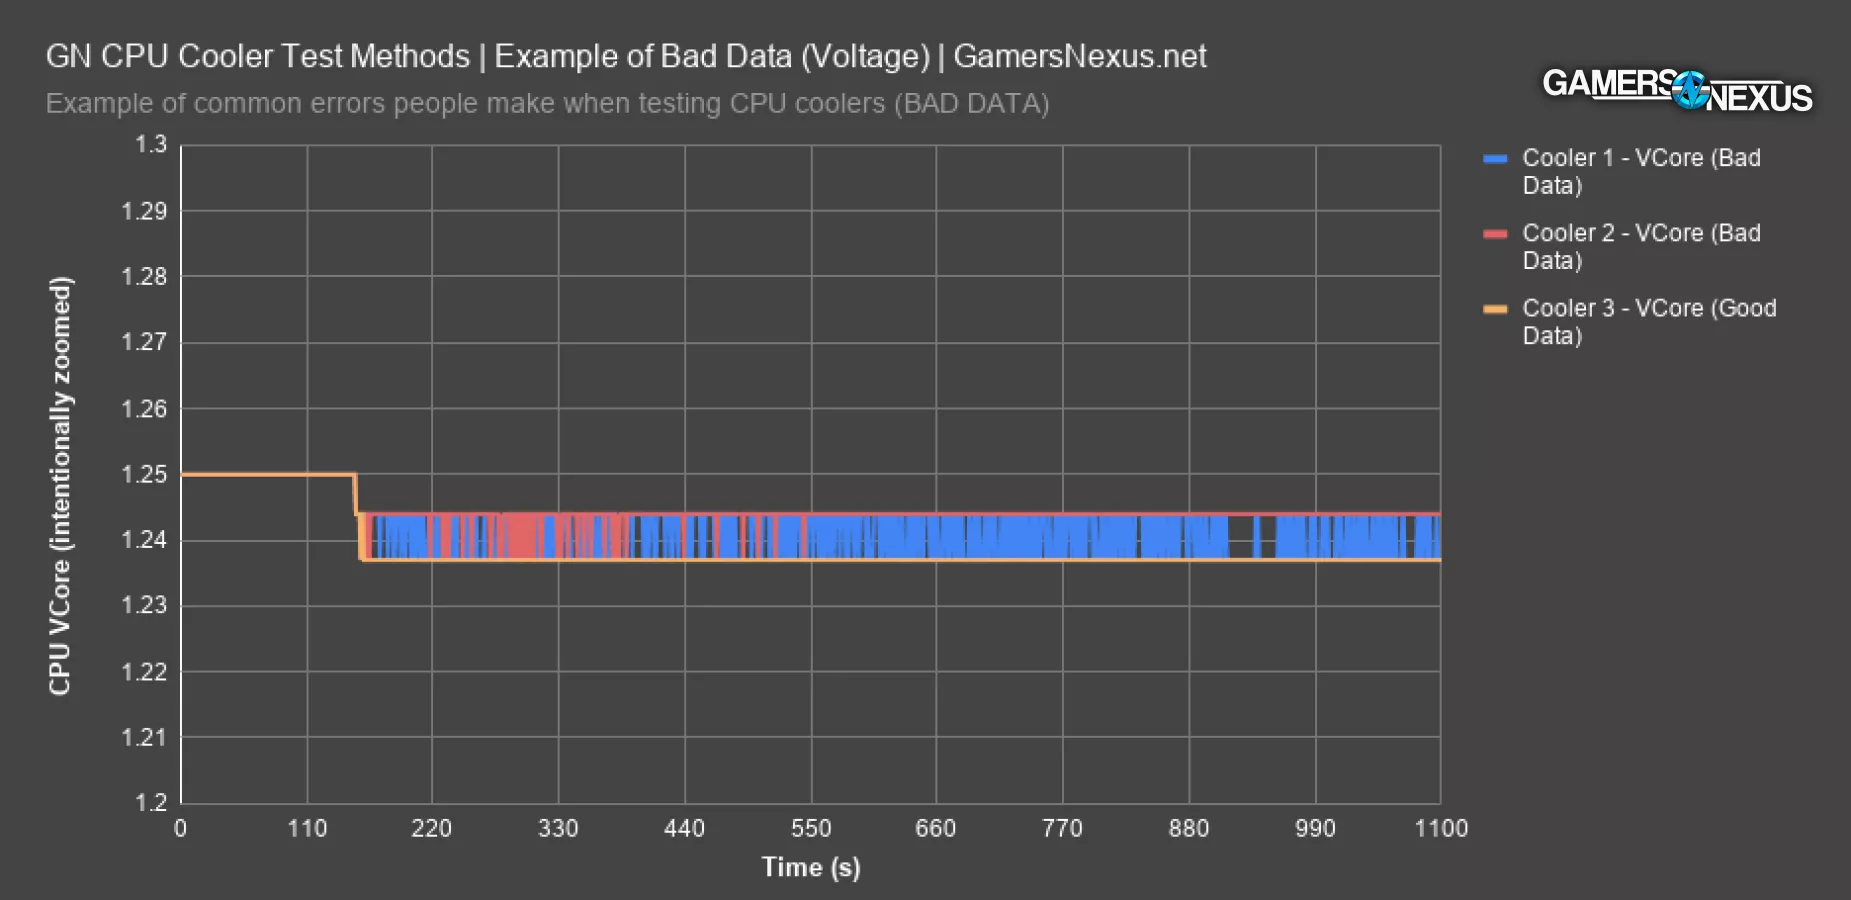
In this chart, you’ll notice that the voltage should be a fixed 1.237V constantly for this particular test. It should be nearly a perfectly flat and predictable line. In reality, these rare test instances ran an average voltage of 1.240V to 1.244V instead of 1.237V, with the range from 1.237V to 1.244V on the second bad data set, and a fixed 1.244 on the worst. This impacts the power consumption of the chip and will impact thermal results during testing, potentially invalidating the result, contingent upon severity. When we’re already contending with potential software challenges, compounding that with erratic voltage behavior can create upwards of 15W difference run-to-run, which is a massive change. We’ve solved the software problem with our own automation programming, and as for the motherboard’s decision to randomly change voltage despite a profile being in play, we solve that with internal and automated red flags and careful technician oversight and retesting. Our future dummy heaters will completely eliminate this concern as well, but we still need real-world testing.
Can’t Run Auto
One of the biggest mistakes is that people will just run “auto” without setting any controls on voltages or anything else. We see this a lot in our comments, where people will tell us their cooler performs at temperature Y, but without at least knowing the CPU and its VCore (not every board is the same), that doesn't mean anything. The case also matters, as does room ambient, the workload (AVX or non-AVX), and everything else we've explained.
First, if you don’t control the frequency on a modern CPU – like AMD’s Zen architecture – then you’re no longer primarily testing temperature, you are primarily testing frequency. Temperature would be the secondary metric, but the sustained frequency under auto frequency settings would be the first. Voltage still must be controlled so that the power load remains fixed, otherwise the entire test is invalid, but frequency doesn’t have to be controlled and is still a valid metric if understood and presented properly. It'd be a frequency benchmark.
For instance, if you want to show the frequency range produced between the best and worst coolers tested, that could be done without controls on frequency but with controls on everything else. Thermals could be useful as a secondary metric, but because they will no longer be comparable head-to-head as a result of changing frequencies, they are not the primary comparison.
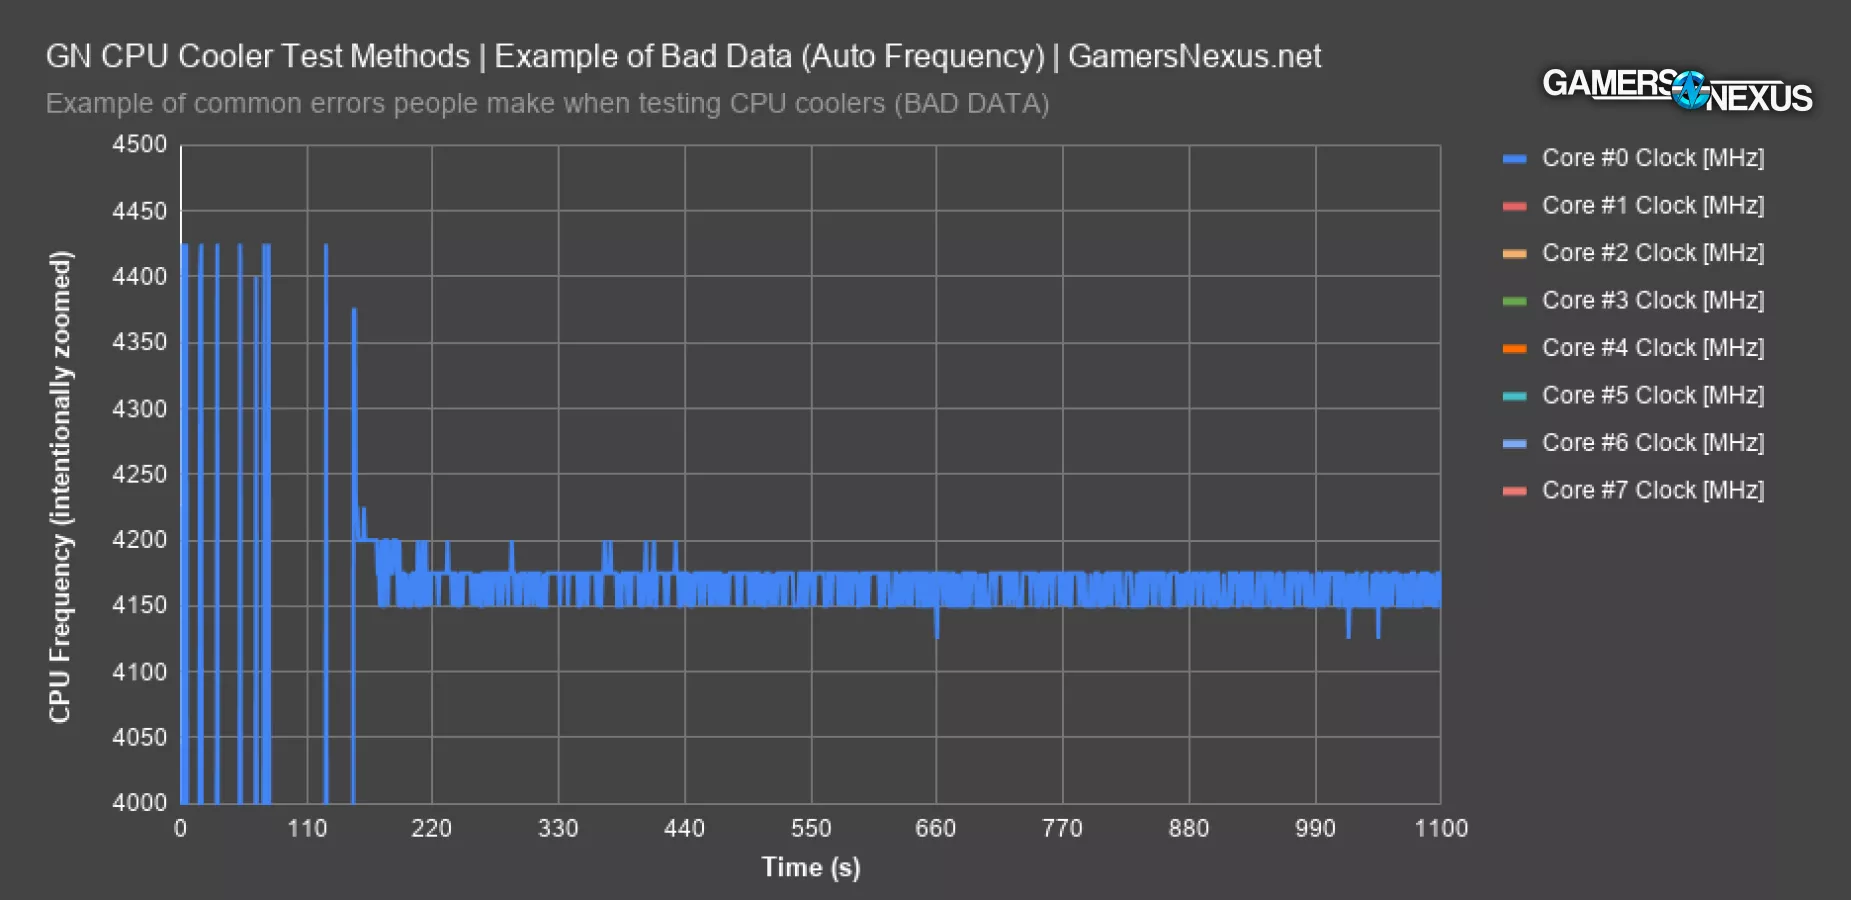
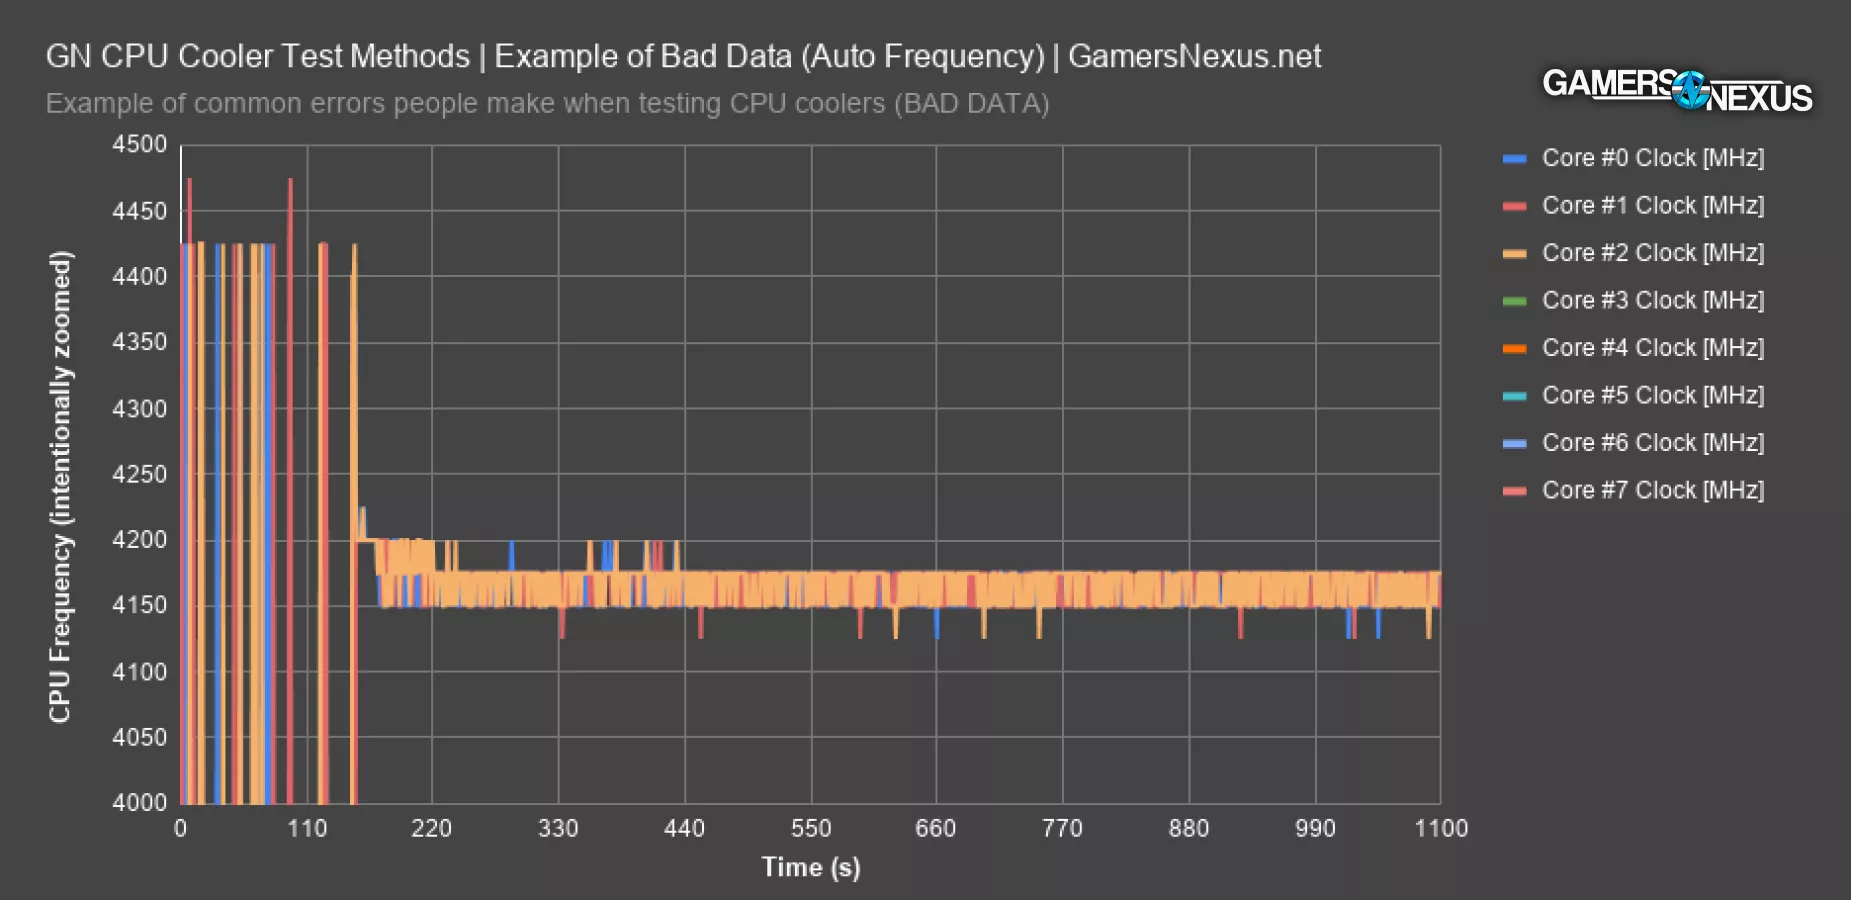
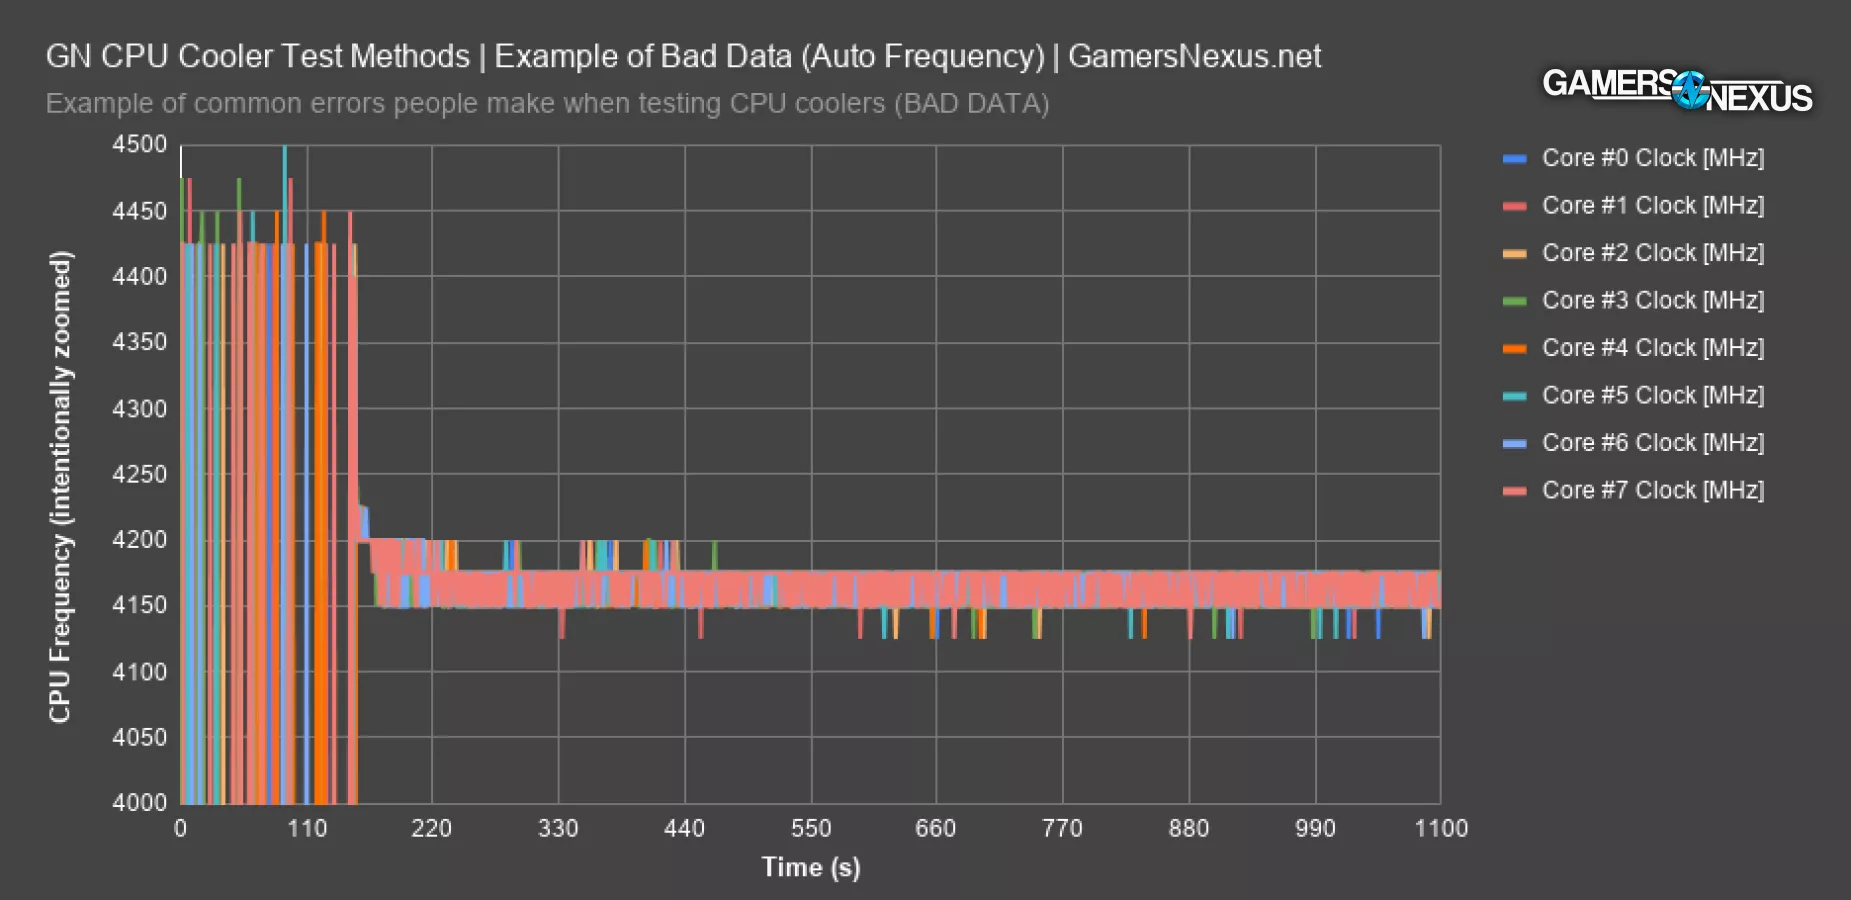
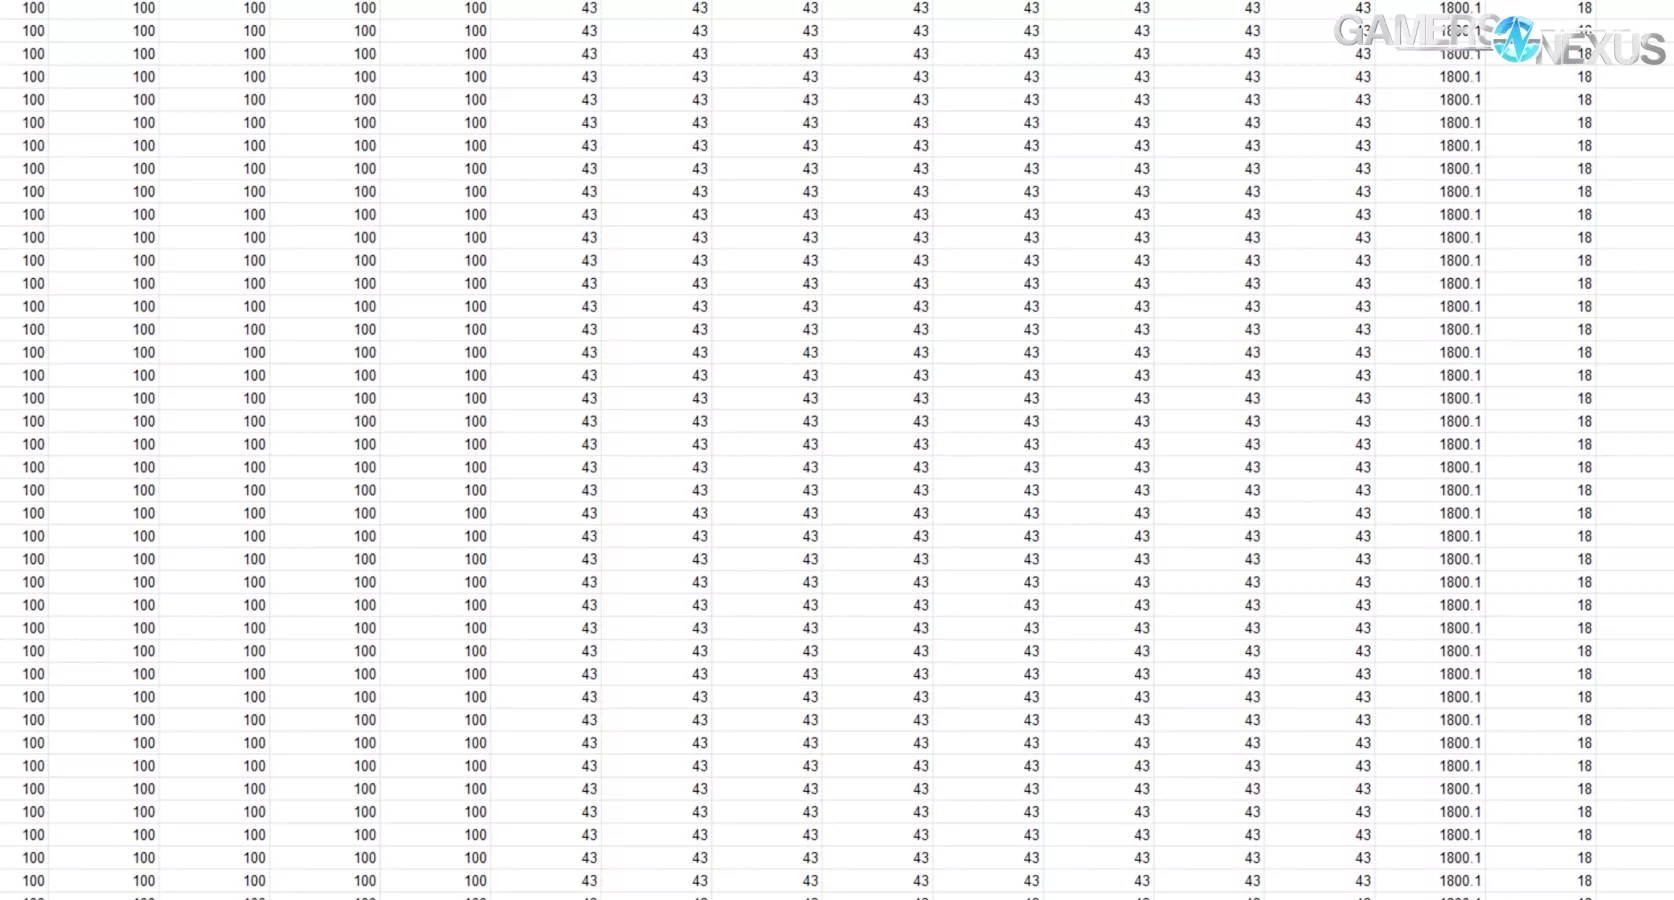
Here’s an example of how frequency changes on the 3800X with full auto settings, aside from XMP and 100% fan speed. The rest is automatic. Frequency bounces between 4125MHz and 4200MHz across the cores. Average core frequency is 4165MHz, but it’s all over the place. Voltage, not shown here, goes between 1.28 and 1.32, and in a pattern which is not repeatable from one test to the next. Voltage needs to be controlled in the least, and frequency needs to be reported as a result if not controlled. That’s useful anyway, since it puts an actual value aside from “well, it runs cooler” on the CPU cooling products. Frequency can be extrapolated to performance in a more direct way than simply being lower temperature.
Fan RPM & Fan Headers
This is different on every motherboard and there’s no formula to it, but some motherboards will either report fan speeds as drastically different one header to the next, but actually be the same, while others will genuinely crank certain headers faster. For this reason, it’s very important to use the same fan headers every time and in the same order for the fans. It’s also just good testing practice, because it’ll reduce chance for error when working with data logging and analytics. We always plug the CPU fan into CPU_FAN on the motherboard, we keep CLC pumps in PUMP, and the second fan goes in SYS_4.
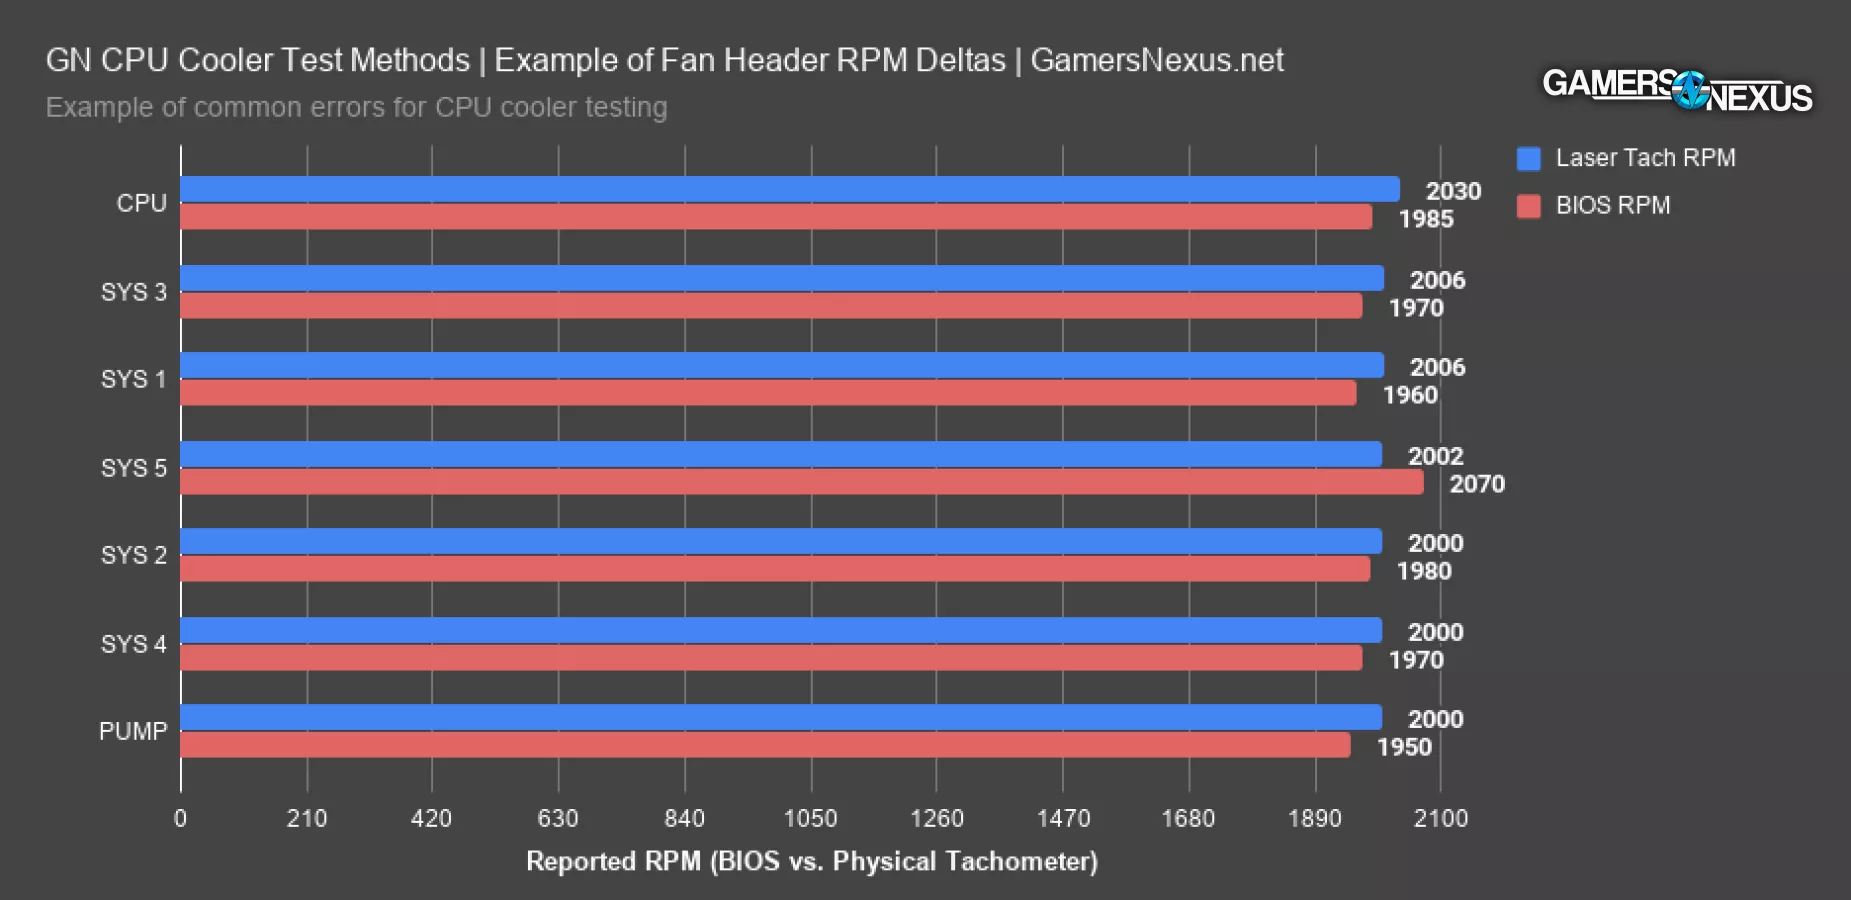
This chart shows the speed differences. For the most part, we’re within error with our laser tach – about 2000 to 2006RPM. The CPU fan header runs reliably at 2030RPM, despite reporting about the same as the others. Inversely, the SYS 5 fan reports significantly higher, at 2070RPM, but reads about the same speed with a physical tachometer.
It’s best to use the same exact headers in the same order each time.
Mounting Pressure Variance (Thermaltake Example)
One of the larger variables is that of mounting pressure. Ideally, this would be controllable with a simple torque driver, but it’s not really that straight-forward. Each of the coolers has a slightly different torque spec for these desktop platforms, whereas Intel HEDT platforms are typically more conformed to a spec. In this situation, where backplates can change, standoffs might or might not be present, and hardware changes unit to unit. We can’t always rely on torque drivers. AMD provides a recommendation, but each vendor can deviate, and it’s not always possible to get a torque number from the manufacturers. It’d be nice if they published it, but most don’t, and we’ve even had trouble getting answers when asking our contacts. Ultimately, we’ve determined that the best approach is to use torque drivers where specifications are present, and to otherwise rely on reason and experience, but then perform multiple full re-mounts for validation.
Mounting pressure has some of the highest potential to influence performance, but it’s also difficult to screw-up if you know what you’re doing. That’s the good side. It’s also easy to adjust for by doing full mount-and-remounts of each cooler under test. When remounting a cooler for additional test passes, we fully remove all mounting hardware and start from scratch. If any differences greater than +/- 1-degree Celsius emerge during this process, we know something is wrong and start isolating possible flaws in our testing versus the cooler. This is rare, but it does happen, and the only way to know about it is to actually re-mount and re-paste the cooler. Relying on a single mount and paste job means you’d never know if your pressure or paste just happened to be wrong that time.
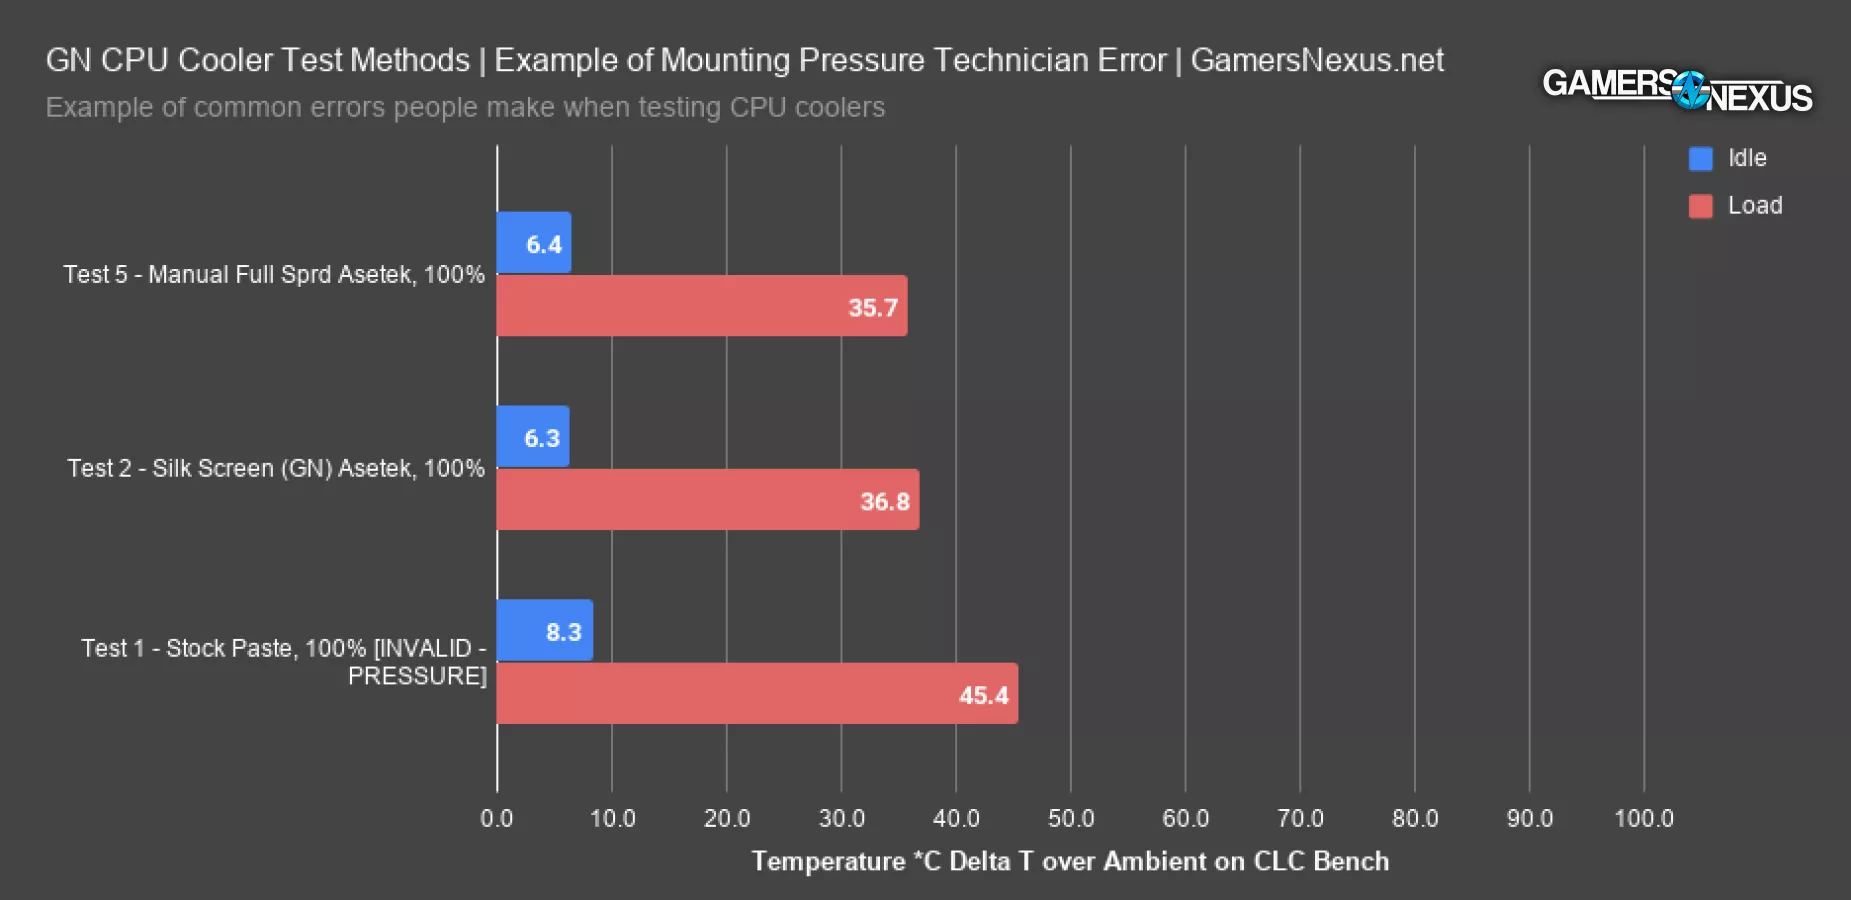
Here’s an example of some data where the mount was a problem.
In this scenario, the first test pass with the stock cooler paste we invalid. First of all, it’s basically impossible for paste to be this different, and secondly, Thermaltake uses Asetek’s paste anyway, and so do we, so the only actual difference is that the pre-application is slightly less coverage on this particular platform than our manual application. We further determined this data was bad by re-mounting the cooler and identifying that the mounting hardware was not fully seated, thus creating erroneous data that did not represent performance. Our software and spreadsheets flag deltas this large within a single cooler and we receive a notification to go investigate why a such a large gap could exist on one product with the fans at a fixed speed. 10 degrees is obviously not a real result.
It’s all about being equipped to identify test errors and differentiate them from product flaws, and that’s what we’ve specialized in for over a decade now. This is an inside look at what we normally do silently behind-the-scenes. Rather than just proclaim that the stock paste is garbage, we investigated to ensure it wasn’t our fault. Separately, we have the same silk screens that most factories use to pre-apply paste, and we also have their stock pastes – often Shin etsu or Dow Corning – and so we can effectively re-test the pre-application by using the same process as the factories. We picked-up tools and pastes for this while touring factories last year.
Hardware Used
Some of the charts above are on our old bench, some are on the new bench, but they’re all fully self-contained (chart-to-chart) and aren’t going to be used in future results. Most are to illustrate bad data and the high chance for test error if you’re not building around the expectation of bad data. Trusting the system is bad.
The hardware we’re using will vary only contingent upon whether it’s a “real” workload or a simulated workload, but for the most part, it is as follows:
CPU Cooler Benchmarking (Test Suite)
Our tests for finding the best CPU coolers include:
- Coldplate surface levelness test (micron depth delta from known zero-point across surface)
- Auto frequency, fixed voltage, 100% fan (measurement point: frequency)
- Auto frequency, fixed voltage, fixed fan 35dBA (measurement point: frequency, thermal)
- Fixed frequency, fixed voltage, 100% fan (measurement point: thermal)
- Fixed frequency, fixed voltage, fixed fan 35dBA (measurement point: thermal efficiency)
Data Analyzed from Above Tests
Data analytics are diverse, but primarily boil-down to:
- Tdie
- Individual CCD measurements where applicable (larger CPU)
- VRM average
- VRM measurement point 1
- VRM measurement point 2
- Max fan RPM as verified by physical tachometer and BIOS
- Noise at 20” distance, centered on fan hub, held by tripod in room with noise floor of 26dB to 26.3dB
- Frequency AVG all-core
Frequency & Voltage
For frequencies and voltages, we are using a mix, so you’ll need to check information per review to double-check what was used for each chart. We primarily use these:
- (3800X) Fixed frequency, fixed voltage: 4.3GHz all-core, 1.287Vcore, 1.063VSOC, 1.35VDIMM, various others controlled
- (3950X) Fixed frequency, fixed voltage: 4.2GHz all-core, 1.215Vcore, 1.063VSOC, 1.35VDIMM, various others controlled
- (3800X) Auto frequency, fixed voltage: Auto all-core, 1.237VCore, 1.063VSOC, 1.35VDIMM, various others controlled
- (3950X) Not tested with auto frequency
IMPORTANT: The only goal is to generate a known, reliable amount of heat from a heat source. For this reason, the actual CPU frequency is irrelevant as long as it is known reliable. We could push our 3950X to about 4.3GHz all-core, and sometimes 4.4GHz all-core, but then the problem becomes that we lose the ability to test lower-end coolers on the same platform (gets too hot for anything but large liquid coolers); further, 4.4GHz isn’t always stable, so it’s best to increase voltage to generate the desired amount of heat (power) and then set a frequency that’s known good.
As a note, the system runs entirely passively other than the CPU cooler when taking noise measurements.
Conclusion

CPU cooler reviews are remarkably challenging for how "simple" the product seems. Even today, we've seen improvements in air coolers despite decades of refinement. It's an exciting component to test that mixes aspects of acoustic and thermal performance with visuals.
Writing an updated sentence here, now in 2023 (the rest of this article was written in 2020), we are working on our next major advancement in methodology. Most of these methods remain, but we'll be changing our test bench components and focusing on some new and emerging trends within the CPU side of the industry. We're excited to bring that update to you -- it'll be the next major methodological overhaul to our cooler tests, now incorporating the past 3 years of using the above methodology.
Note that there is some additional information in the accompanying video, mostly relating to the dummy heater. We'll talk about that more separately.