We put the Steam Deck OLED through numerous tests that measure system latency, thermals, acoustics, gaming benchmarks, and more
The Highlights
- The Steam Deck OLED still uses a 4C/8T AMD Zen2 part but shrinks its die from 7nm to 6nm
- Certain OLED models have staticky headphone jack issues
- The Steam Deck OLED features a better display, faster memory clock, and bigger battery compared to its predecessor
- Original MSRP: $550-$650
- Release Date: November 16, 2023
Table of Contents
- AutoTOC

Intro
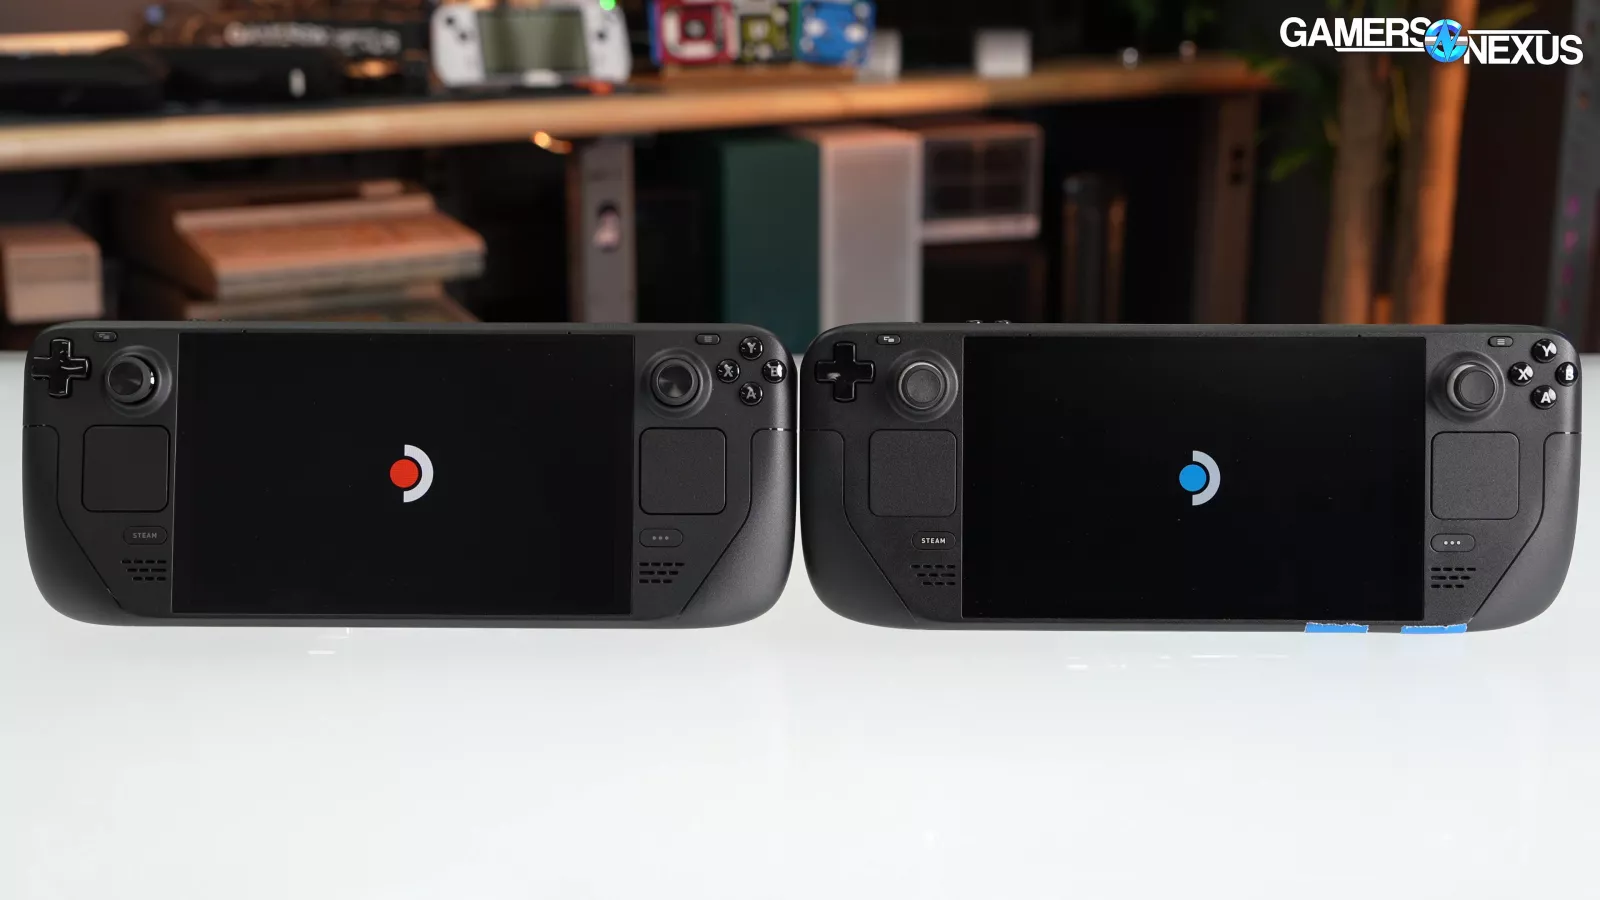
Valve is killing it right now -- but they’re not alone anymore. The overhauls to the Deck hardware materialized in huge improvements against the original Deck, but it remains sieged on all sides by competition.
When the Deck OLED came out, we were quick to get an in-depth tear-down detailing the component changes. Valve changed a lot, and now, some months later, we’ve spent a lot of time with the OLED as the market has settled. In this review, we’re taking a long-term user approach to reviewing the Deck OLED: We’ve used the device a lot and had more of a true user experience, putting us in a position to talk in more detail about the subjective and objective aspects of the OLED variant of the Deck. This also gave us time to run into issues, like a headphone static problem.
Editor's note: This was originally published on February 23, 2024 as a video. This content has been adapted to written format for this article and is unchanged from the original publication.
Credits
Test Lead, Host, Writing
Steve Burke
Testing, Writing
Patrick Lathan
Camera, Video Editing
Vitalii Makhnovets
Web Editing
Jimmy Thang
Testing today includes system latency with click-to-photon measurements, thermals with hand-wired thermocouples on the PCB, acoustics in our quarter-million dollar hemi-anechoic chamber, gaming benchmarks, and some subjective thoughts.

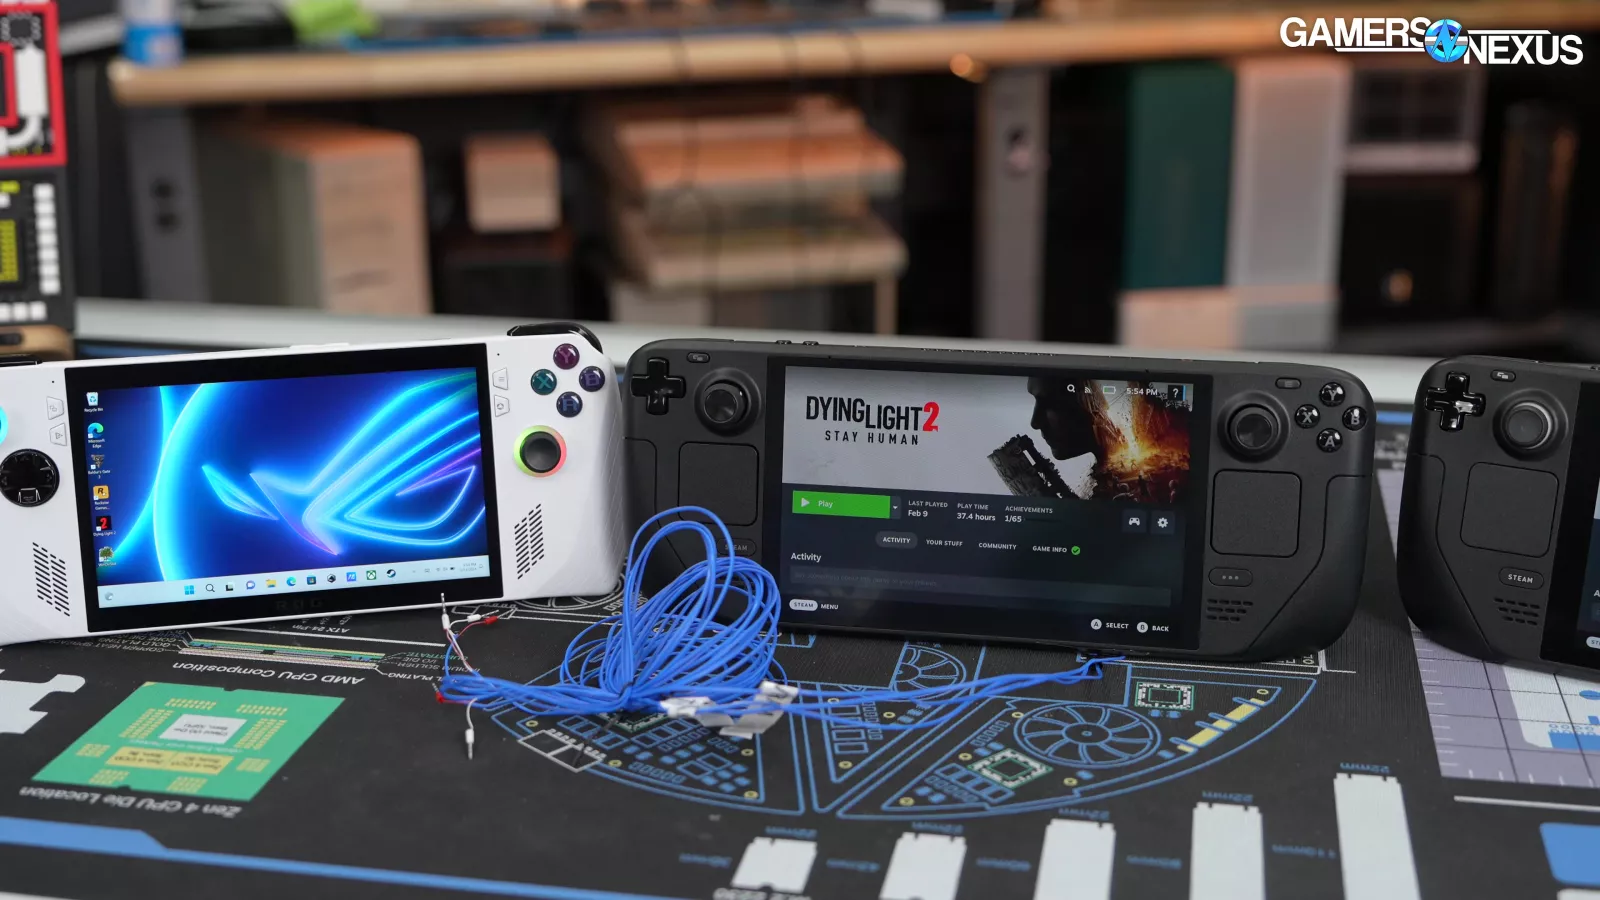
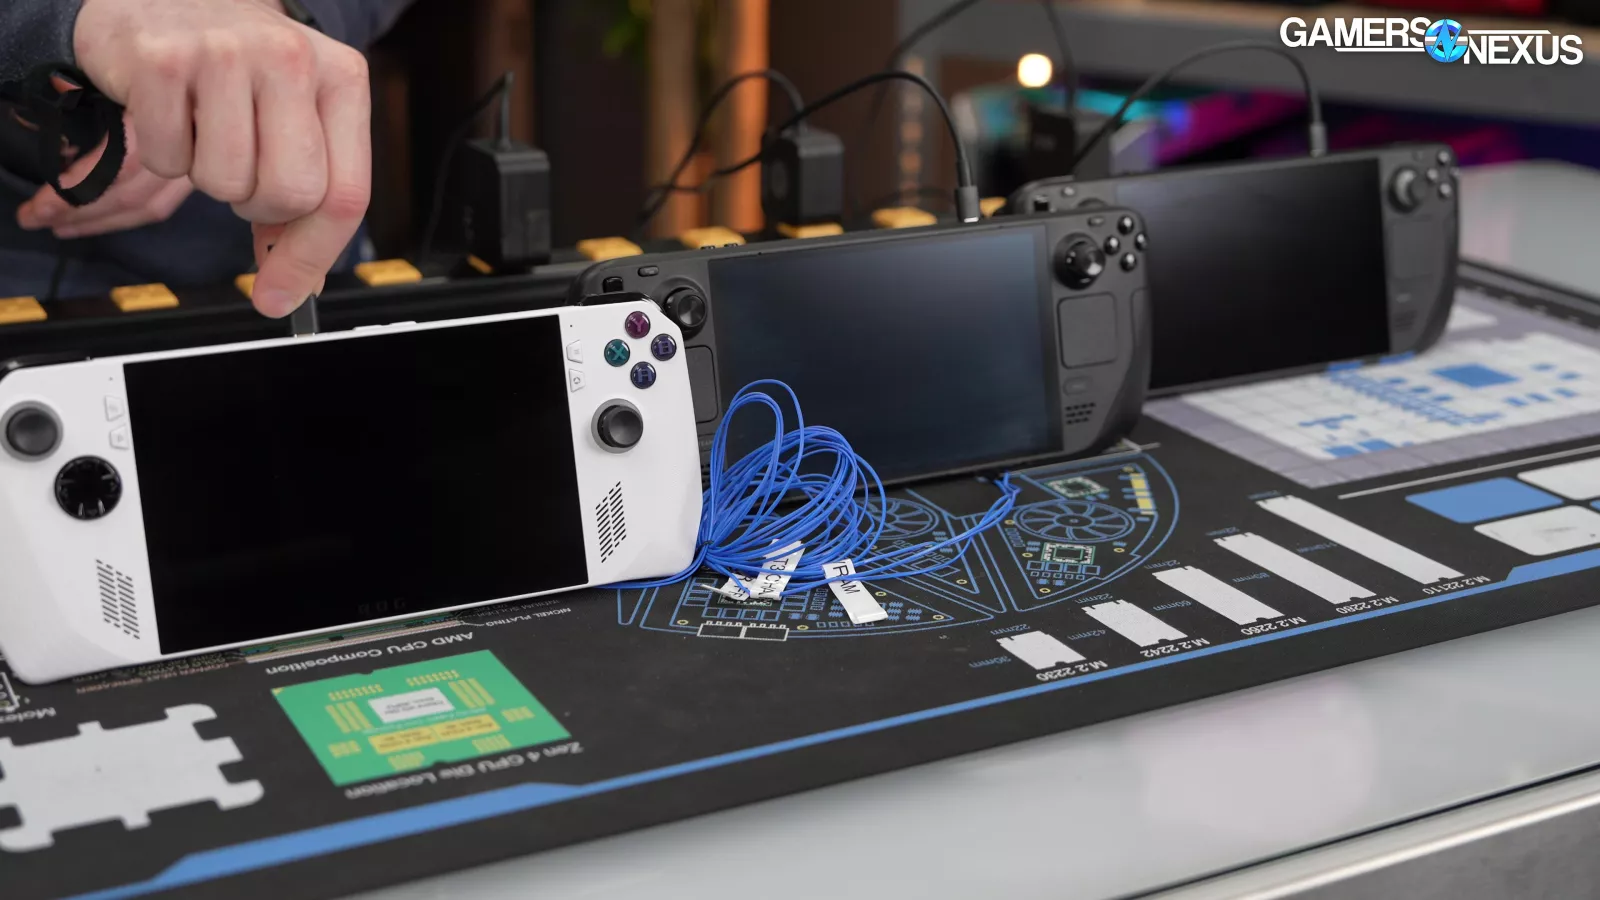
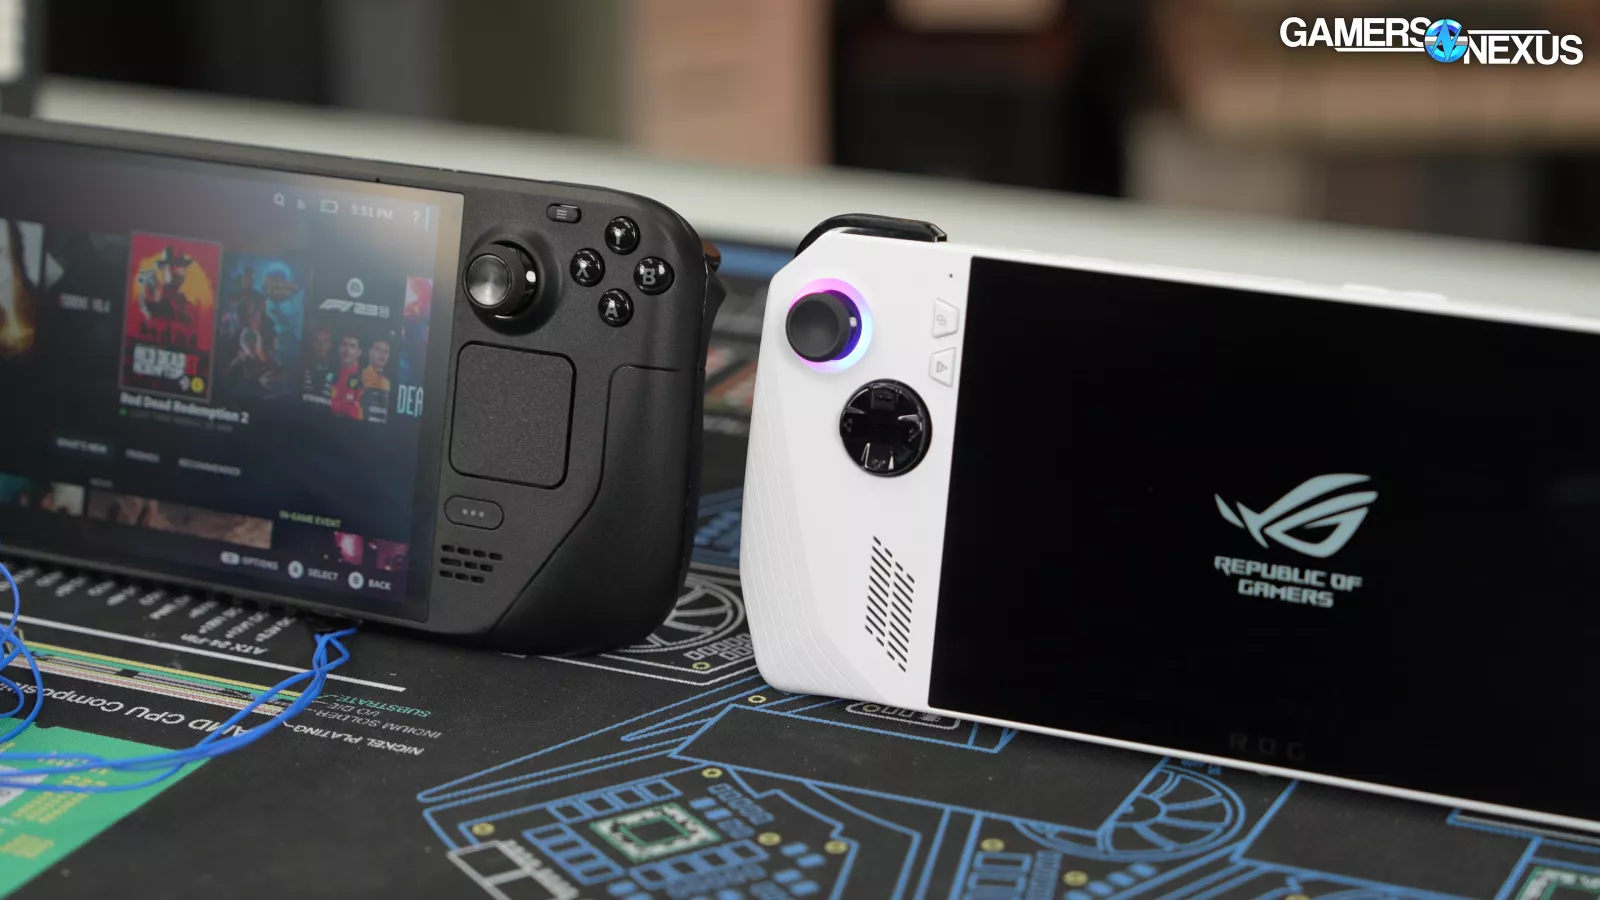
We're ready now to show how it stacks up against its biggest rival, the ASUS ROG Ally Z1 Extreme, originally launched in June for $700 but down to $600 as of this writing. It seems to fluctuate.
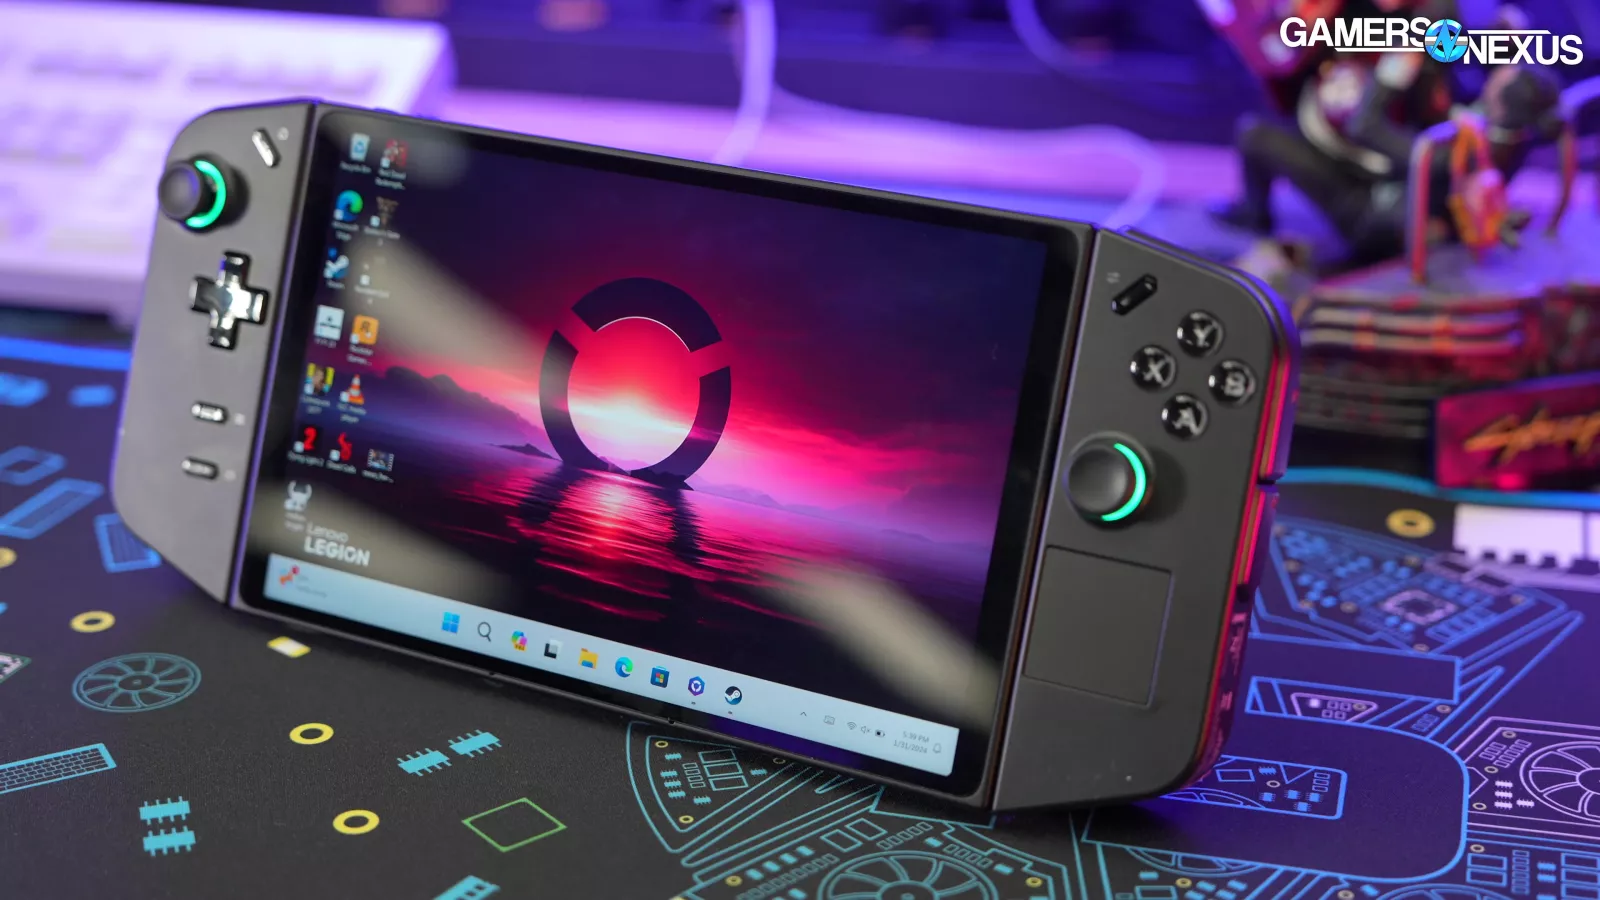
We also have the Legion Go that we’ll be reviewing next and against both of these, so our plan is to start building-out handheld charts just like we do for CPUs and GPUs.
Valve isn't quite ready to release the Deck 2 yet, but it has shipped the Deck OLED and adjusted prices to match the wave of competitors that have entered the market from heavy hitters like ASUS, Lenovo, and soon MSI.
And here are the specs differences:
Lenovo Legion GO vs. Steam Deck OLED, LCD, & ASUS ROG Ally Specs
| Lenovo Legion GO | Valve Steam Deck OLED | Valve Steam Deck LCD | ASUS ROG Ally (Z1 Extreme) | |
| Retail Date | 10/31/2023 | 11/16/2023 | 2/25/2022 | 6/13/2023 |
| Price | $650-$750 ($50 off sale now) | $550-$650 | $350+ | $700 ($600 sale price) |
| CPU | AMD Zen4 Z1 Extreme | 6nm AMD Zen2 Van Gogh | 7nm AMD Zen2 Van Gogh | AMD Zen4 Z1 Extreme |
| CPU Core/Thread Count | 8C/16T | 4C/8T | 4C/8T | 8C/16T |
| CPU Base/Boost Clock | 3.3/5.1GHz | 2.4/3.5GHz | 2.4/3.5GHz | 3.3/5.1GHz |
| GPU | RDNA3 | RDNA2 | RDNA2 | RDNA3 |
| GPU CUs | 12 | 8 | 8 | 12 |
| GPU Clock | 2.7GHz | 1.6GHz | 1.6GHz | 2.7GHz |
| APU "Power" | 9-30W | 4-15W | 4-15W | 9-30W |
| Battery Capacity | 49.2WhrControllers: 900mAh | 50Whr | 40Whr | 40Whr |
| Memory | 16GB LPDDR5X | 16GB LPDDR5 | 16GB LPDDR5 | 16GB LPDDR5 |
| Memory Clock | 7500MT/s | 6400MT/s | 5500MT/s | 6400MT/s |
| Storage Form Factor | M.2 2242 | M.2 2230 | M.2 2230 | M.2 2230 |
| Storage Specs | 1TB NVMe PCIe M.2 2242 | 512GB OR 1TB NVMe M.2 2230 | 256GB NVMe M.2 2230 | 512GB NVMe M.2 2230 |
| Screen | 8.8" QHD (2560x1600) 144Hz IPS | 7.4" 1280x800 90Hz HDR OLED | 7" 1280x800 60Hz IPS | 7" 1920x1080 120Hz FreeSync IPS |
| Weight (claimed) | 854g | 640g | 669g | 608g |
| Weight (measured) | 863g | 639g | 676g | 615g |
| Official Dimensions(LWH) | 298.83 x 131 x 40.7mm11.76" x 5.16" x 1.6" | 298 x 117 x 49mm11.73" x 4.6" x 1.9" | 298 x 117 x 49mm11.73" x 4.6" x 1.9" | 280 x 111 x 21.2~32.4mm11.02" x 4.37" x 0.83"~1.28" |
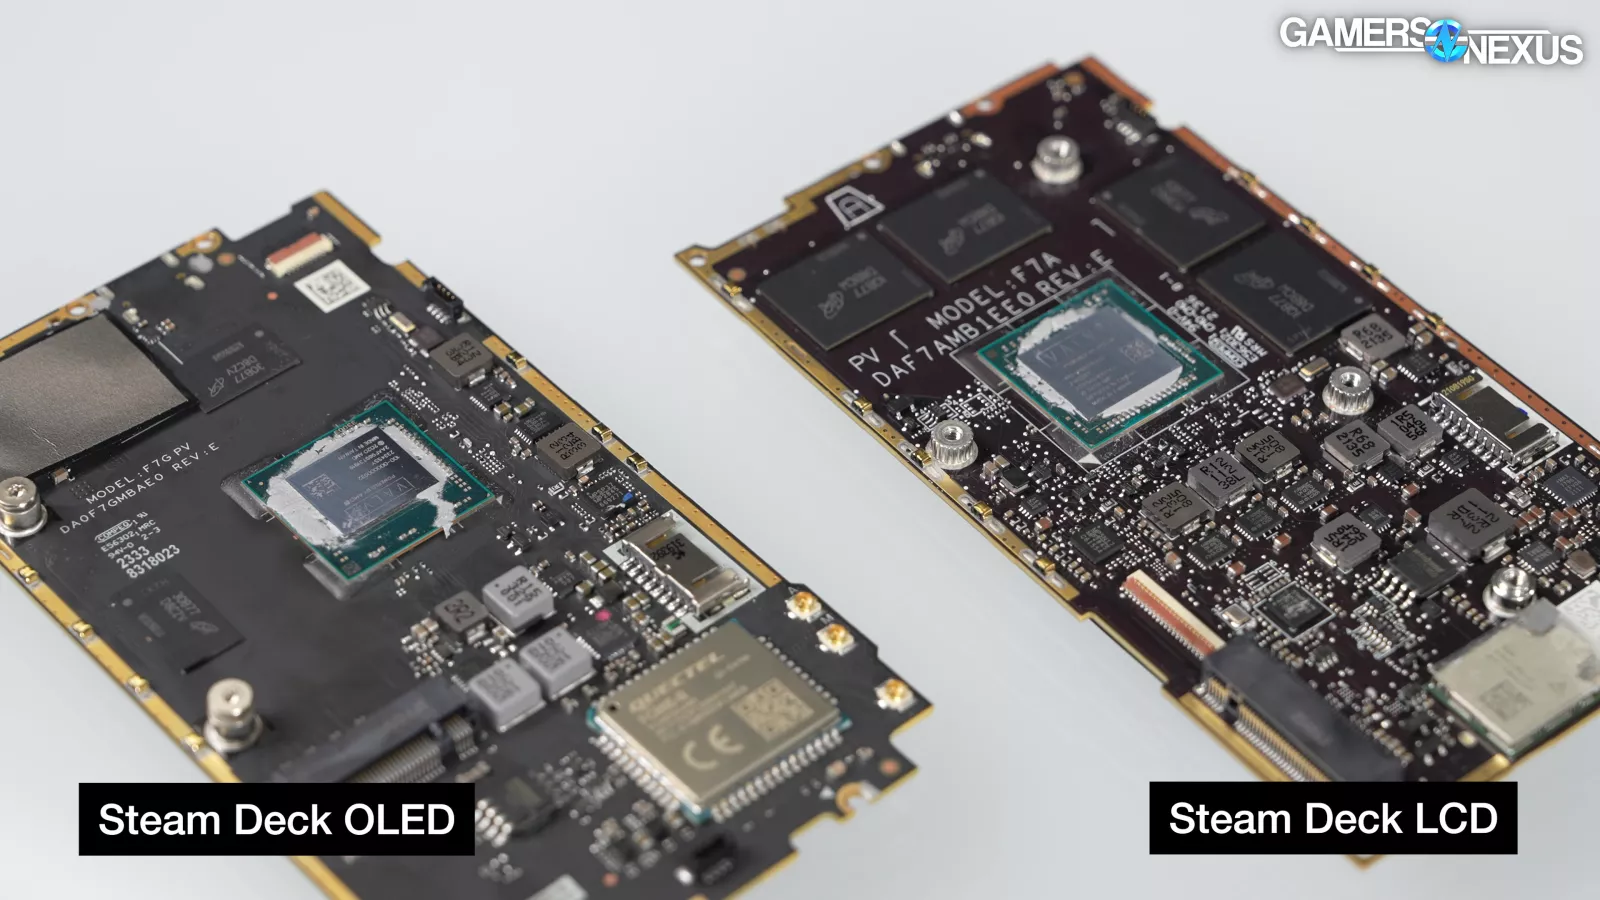
The Steam Deck OLED’s biggest difference is obviously the screen, but there are a ton of physical hardware changes that we’ve also covered in-depth in a video.
The SOC remains a 4C/8T AMD Zen2 part, but now with a die shrink to 6nm. The target base and boost clocks are the same, the RDNA2 GPU is the same, and the battery capacity has changed.
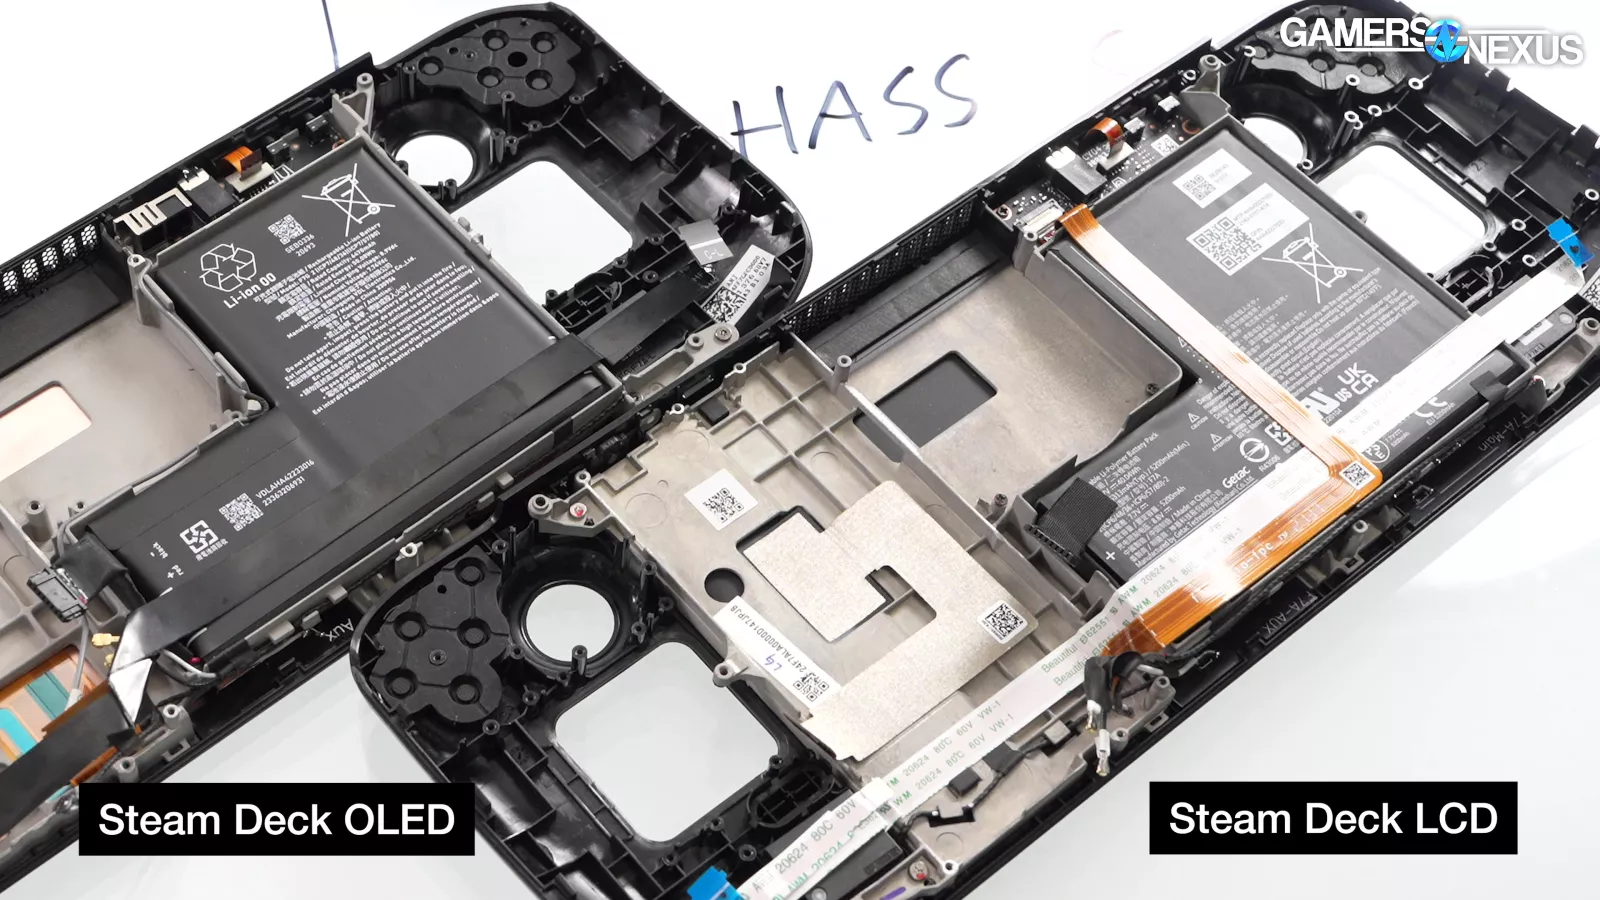
The new battery is a 50Wh part, which was possible thanks to the smaller OLED screen. The OLED isn’t as thick as the original LCD unit, and Valve used that extra space to increase battery thickness.
The memory also got a major overhaul, now up at DDR5-6400 from DDR5-5500. What this impacts will mostly depend on where we run into the hardest GPU memory constraints. Our measured weight had the OLED 37g lighter, so not necessarily a meaningful weight change.
It’s really the memory and battery that are the most noticeable on a spec sheet, but later in this review, we’ll also recap some of the physical internal hardware changes that were significant -- including repairability improvements.
| Valve Steam Deck OLED | Valve Steam Deck LCD | ASUS ROG Ally (Z1 Extreme) | |
| Retail Date | 11/16/2023 | 2/25/2022 | 6/13/2023 |
| Price | $550-$650 | $400 | $600 ("sale" price) |
| CPU | 6nm AMD Zen2 Van Gogh | 7nm AMD Zen2 Van Gogh | AMD Zen4 Z1 Extreme |
| CPU Core/Thread Count | 4C/8T | 4C/8T | 8C/16T |
| CPU Base/Boost Clock | 2.4/3.5GHz | 2.4/3.5GHz | 3.3/5.1GHz |
| GPU | RDNA2 | RDNA2 | RDNA3 |
| GPU CUs | 8 | 8 | 12 |
| GPU Clock | 1.6GHz | 1.6GHz | 2.7GHz |
| APU "Power" | 4-15W | 4-15W | 9-30W |
| Battery Capacity | 50Wh | 40Wh | 40Wh |
| Memory | 16GB LPDDR5 | 16GB LPDDR5 | 16GB LPDDR5 |
| Memory Clock | 6400MT/s | 5500MT/s | 6400MT/s |
| Storage Form Factor | M.2 2230 | M.2 2230 | M.2 2230 |
| Storage Specs | 512GB OR 1TB NVMe M.2 2230 | 256GB NVMe M.2 2230 | 512GB NVMe M.2 2230 |
| Screen | 7.4" 1280x800 90Hz HDR OLED | 7" 1280x800 60Hz IPS | 7" 1920x1080 120Hz FreeSync IPS |
| Weight (claimed) | 640g | 669g | 608g |
| Weight (measured) | 639g | 676g | 615g |
As for the Ally, it runs a significantly higher core count solution with a more modern Zen architecture, at 8C/16T, Zen 4, and running up to 5.1GHz boost. The Ally also runs RDNA3 and has 12 CUs, for a significant boost in theoretical capabilities over the Deck. The Ally also runs a higher APU power, though, and sticks to a 40Wh battery that compares to the original LCD. We’ll test to see if the Deck OLED has a battery life advantage. Spoiler alert: bigger battery and lower power consumption equals yes.
Gaming Testing Methodology
We did a fully new batch of gaming tests due to hardware and firmware updates across the handhelds we're testing. All games were tested at 1280x720, since that's the highest resolution that's natively supported on both the Ally and the Deck. Like-for-like testing mandates equal resolution for fair comparisons.
HDR was disabled in the games that offered an option for it. Firmware, software, and drivers on the Ally were updated through ASUS' first-party tools (MyASUS, Armoury Crate) and Windows Update, and the same was done on the Deck through SteamOS.
We limited our retesting of the ROG Ally Z1 Extreme to battery power, which is what we really care about with handhelds.
On battery, the Ally defaults to the Performance power profile. Plugging in the device or manually selecting the Turbo power profile leads to higher framerates, with predictable tradeoffs: check our dedicated Ally Z1 Extreme review for more detail. For this piece, we're focusing on Deck versus Deck.
Also noted in our Ally Z1 Extreme review is the Ally's tendency to score high on initial test passes in some games, then settle to lower scores as power and thermal limits clamp down after a minute or two. This also relates back to STAPM, which we detailed extensively in our APU review.
We've cut those initial passes from this set of results since they're not representative of gaming performance. No one plays short enough sessions to be within the STAPM window. All framerate caps were turned off and tearing was allowed on both Decks and the Ally.
Let’s get to testing.

Red Dead Redemption 2 (720p Vulkan, upper-end Favor Performance preset)
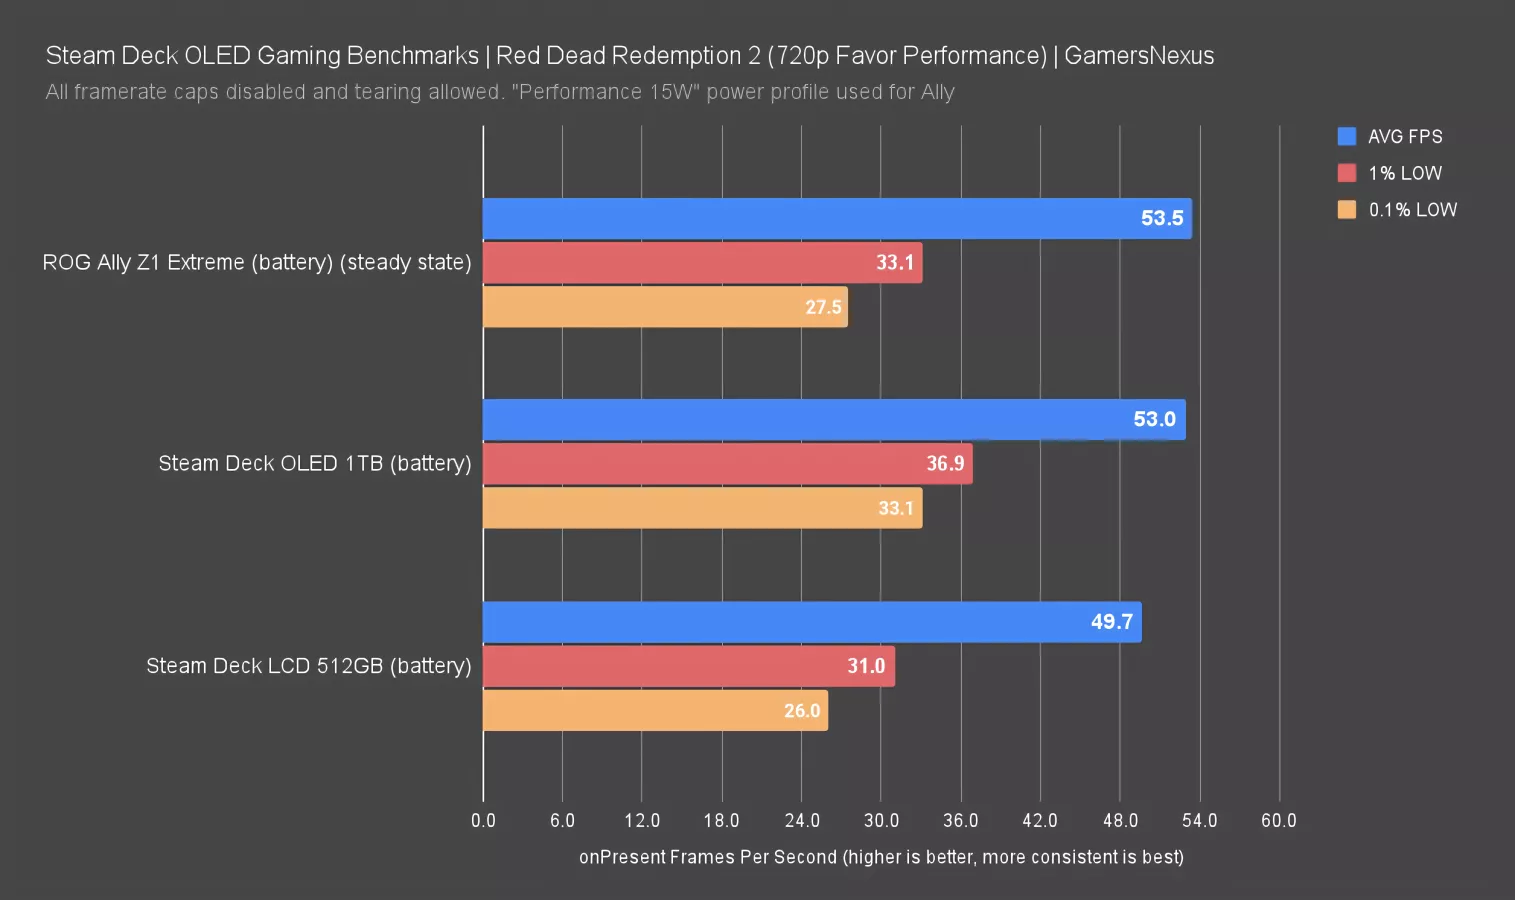
Red Dead Redemption 2 is up first. For a game that was the state of the art five years ago, the game runs surprisingly well on handheld hardware, even without help from upscaling. The original Deck LCD averaged 49.7FPS with 26FPS for the 0.1% lows. Lows are critical on handhelds in particular as they have historically shown on frametime plots to be spotty.
The OLED averaged 53FPS for a 7% uplift over the LCD. Despite Valve’s initial claims that performance should be about the same, the memory is bolstering performance here. The Z1 Extreme has improved in the months since launch and is now effectively tied with the OLED. Previously, there were instances where the Ally was outperformed by the Deck when frametime pacing was less stable and Red Dead could sometimes be one of those.
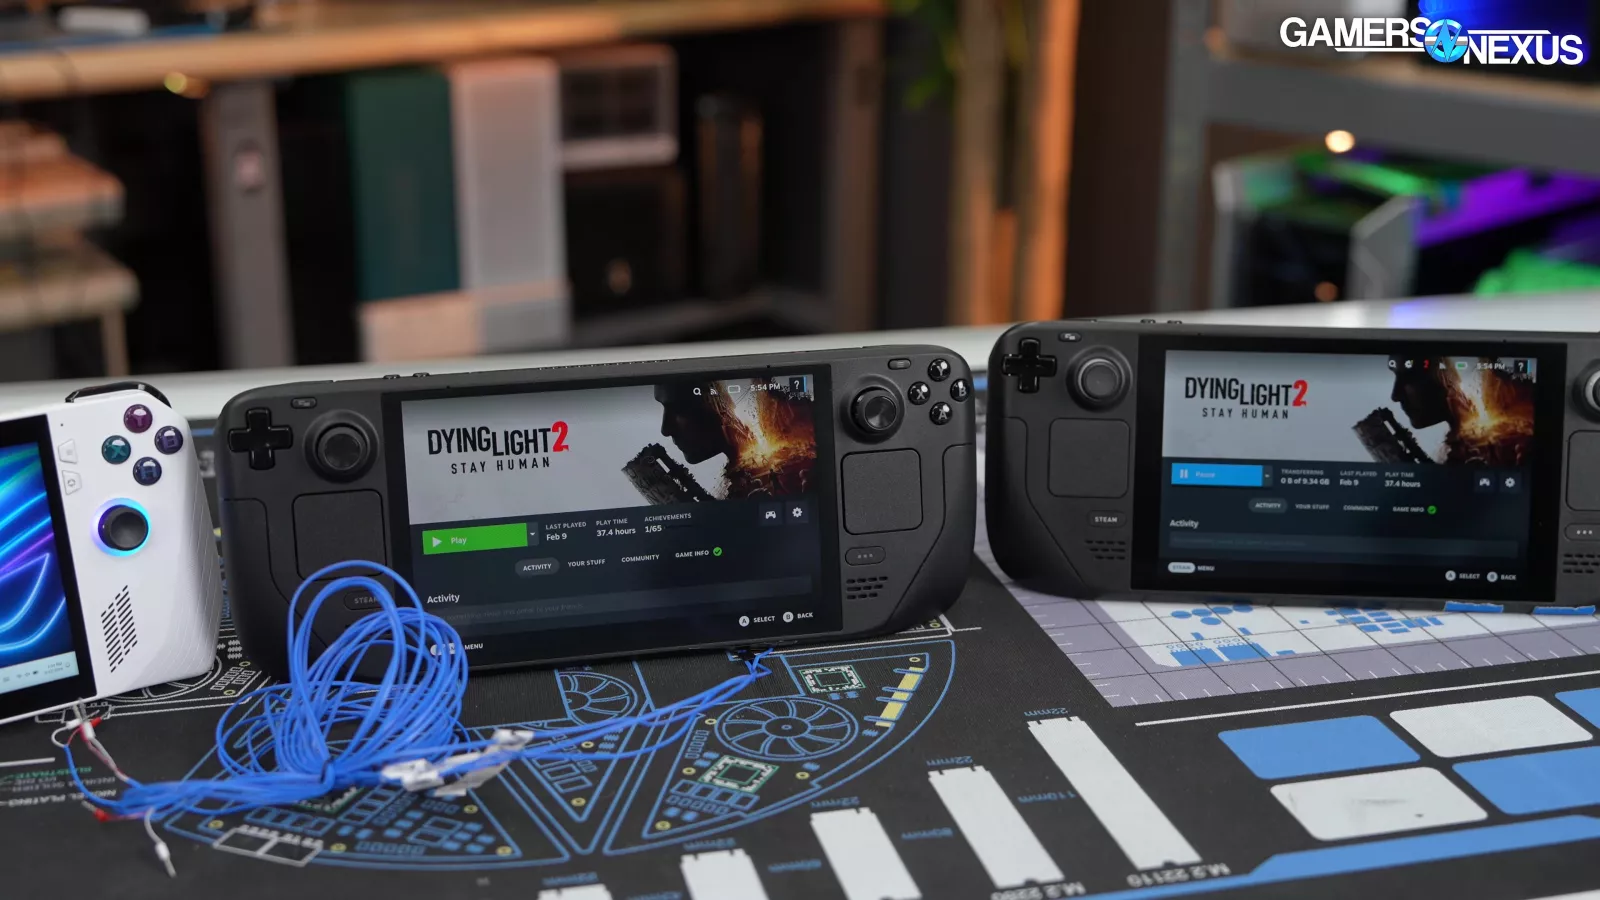
Dying Light 2 Stay Human (720p, Low preset, FSR Quality)
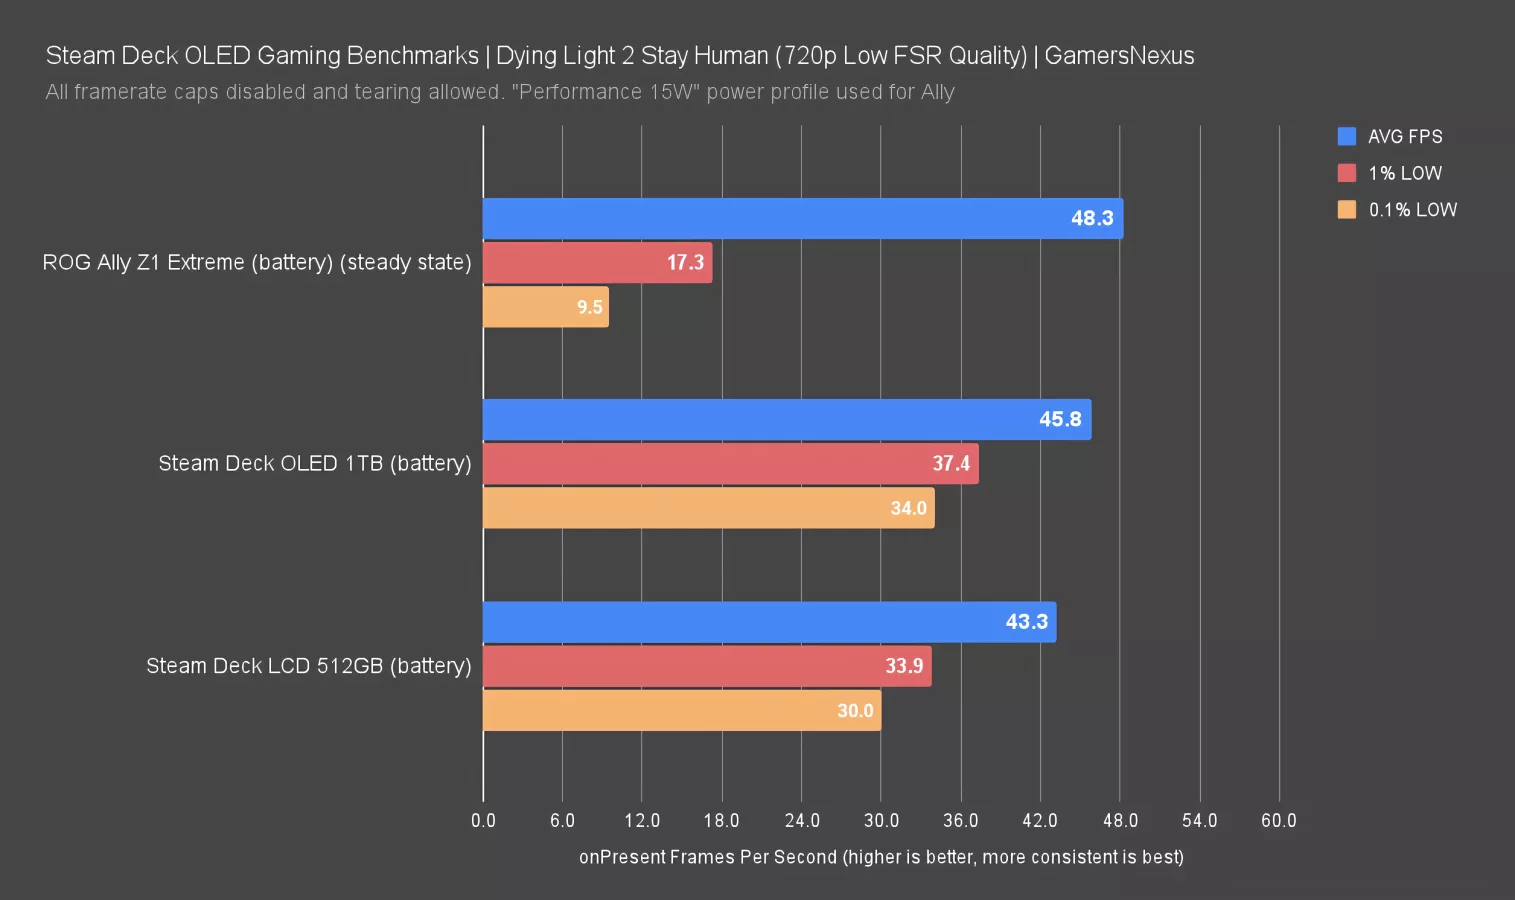
For Dying Light 2, we opted to set FSR to Quality and push the settings down to the Low preset to hit playable framerates. The OLED had a lead over the original again, with a similar 6% uplift to 45.8FPS AVG. The Ally Z1 Extreme's average may have been higher (at 48FPS), but the lows are terrible, which is something we noted in our original review. We’ve proven this uncountable times over the last 12 years, but this is, once again, why it’s so important to look beyond average. The frametime pacing wasn’t good here, and the difference in OS and the drivers used on each is a large part of that. Despite an AVG FPS advantage for the Ally, the Deck provides a significantly better experience. Let’s look closer.
Dying Light 2 Frametime Pacing
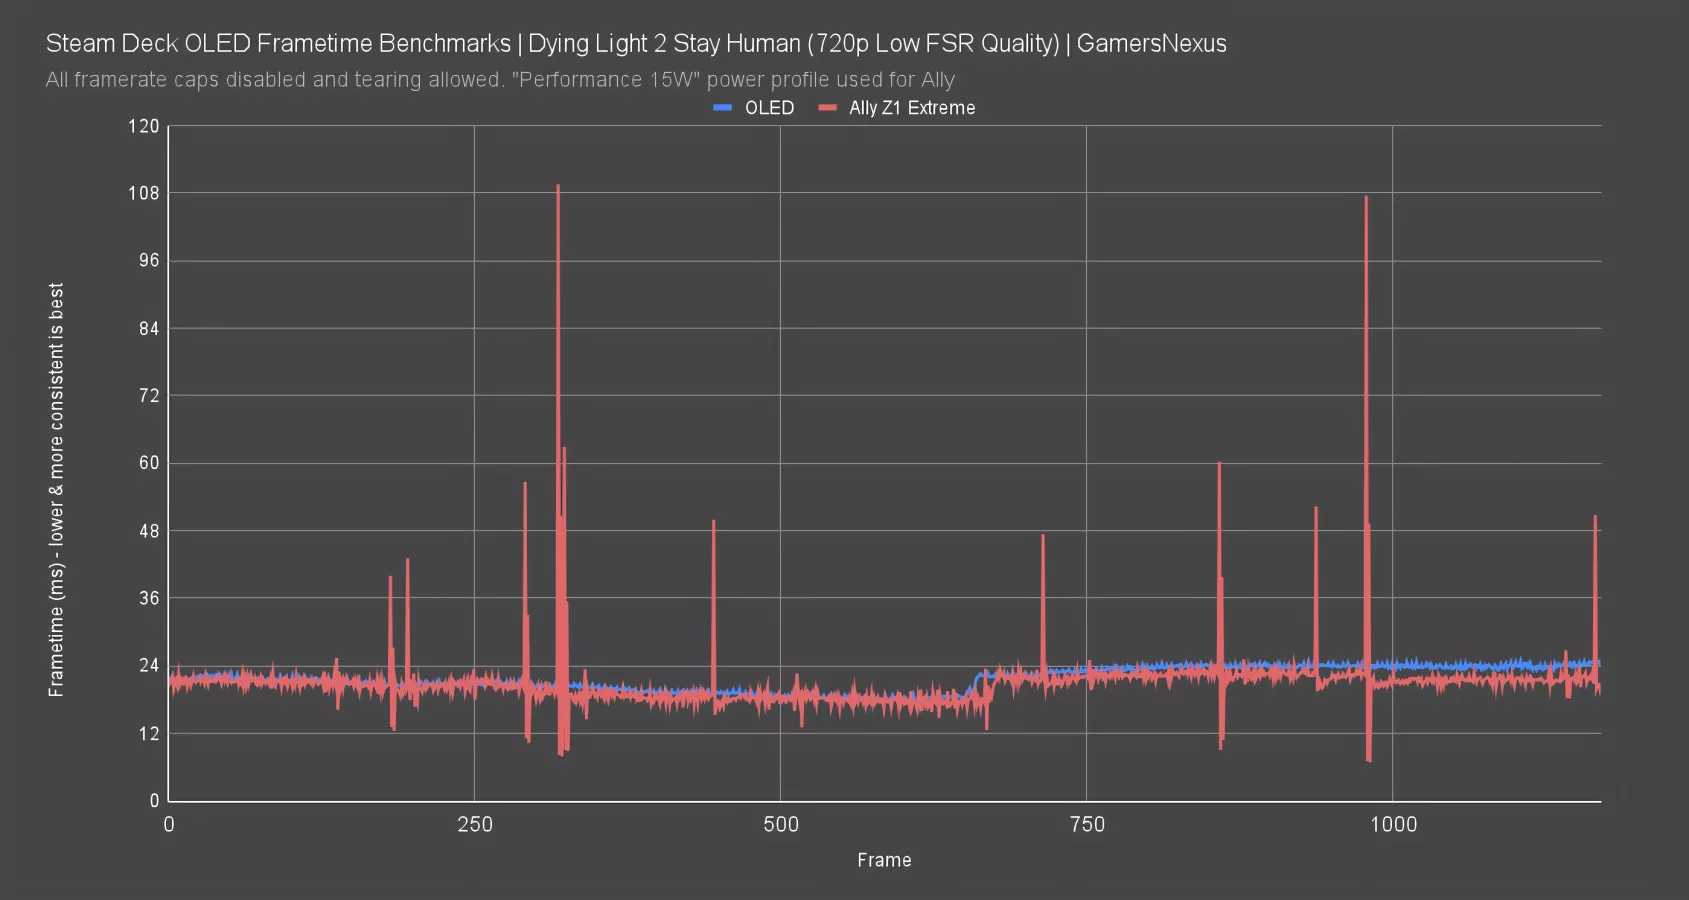
This chart shows frametimes, or the time required to render each frame.
The Deck OLED plots an incredibly flat line frame-to-frame, representing a pacing of frame delivery that ensures the player won’t notice any hitches or stutters. The Ally is a different story and is the reason the vertical scale is so blown-out: There are several spikes approaching 40ms, already a 20ms deviation, with a few spikes to the 50ms range and some even up around 110ms, which represents one-tenth of a second that you’d be staring at the same, old frame data. This also affects the total system latency, as delivery of your input will be delayed. You can learn more about the relationship of latency and framerate in our recent latency engineering interview and deep dive. This is the Ally’s weakest point so far.
F1 22 (720p, High preset, VRS disabled)

We'd already installed F1 22 for some noise and power tests, so we ran an FPS test as well. The OLED lost most of its lead here, with a 60FPS AVG that’s functionally tied with the LCD’s result. The difference is run-to-run variance, so memory has less impact.
The OLED led the Ally Z1 Extreme by 4.2% for AVG FPS, which is a direct result of the poor 0.1% lows we’re seeing on the Ally. The Ally’s frame pacing issues mean reduced average framerate as well, and once again, the Deck produces a better experience.

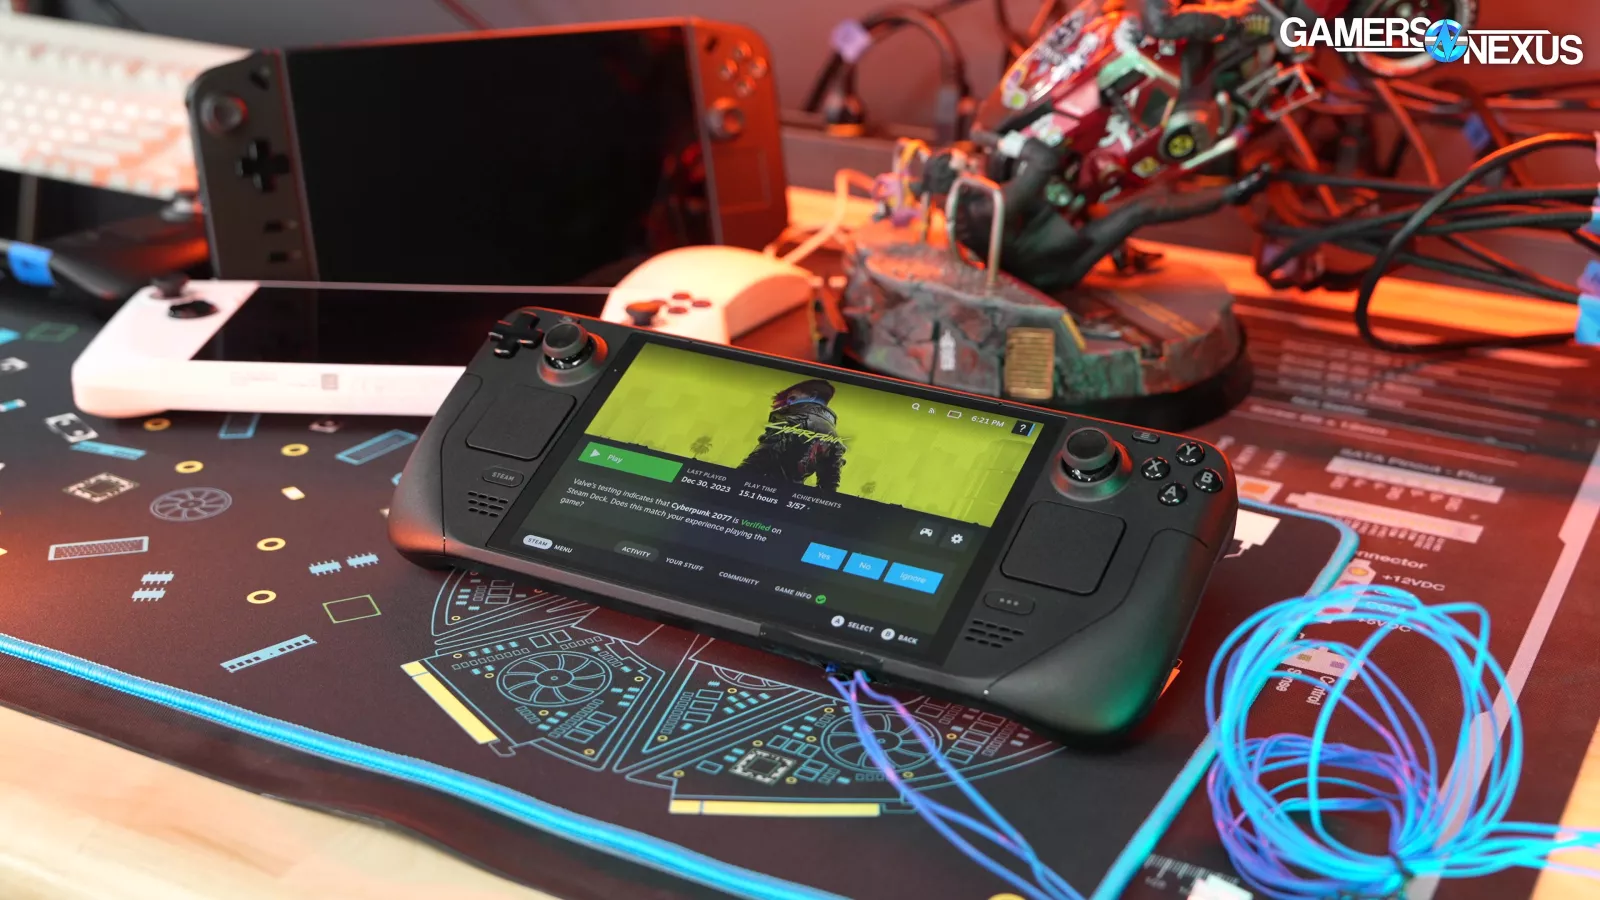
Cyberpunk 2077 v2.02 (720p, Low preset, FSR 2.1 Quality)
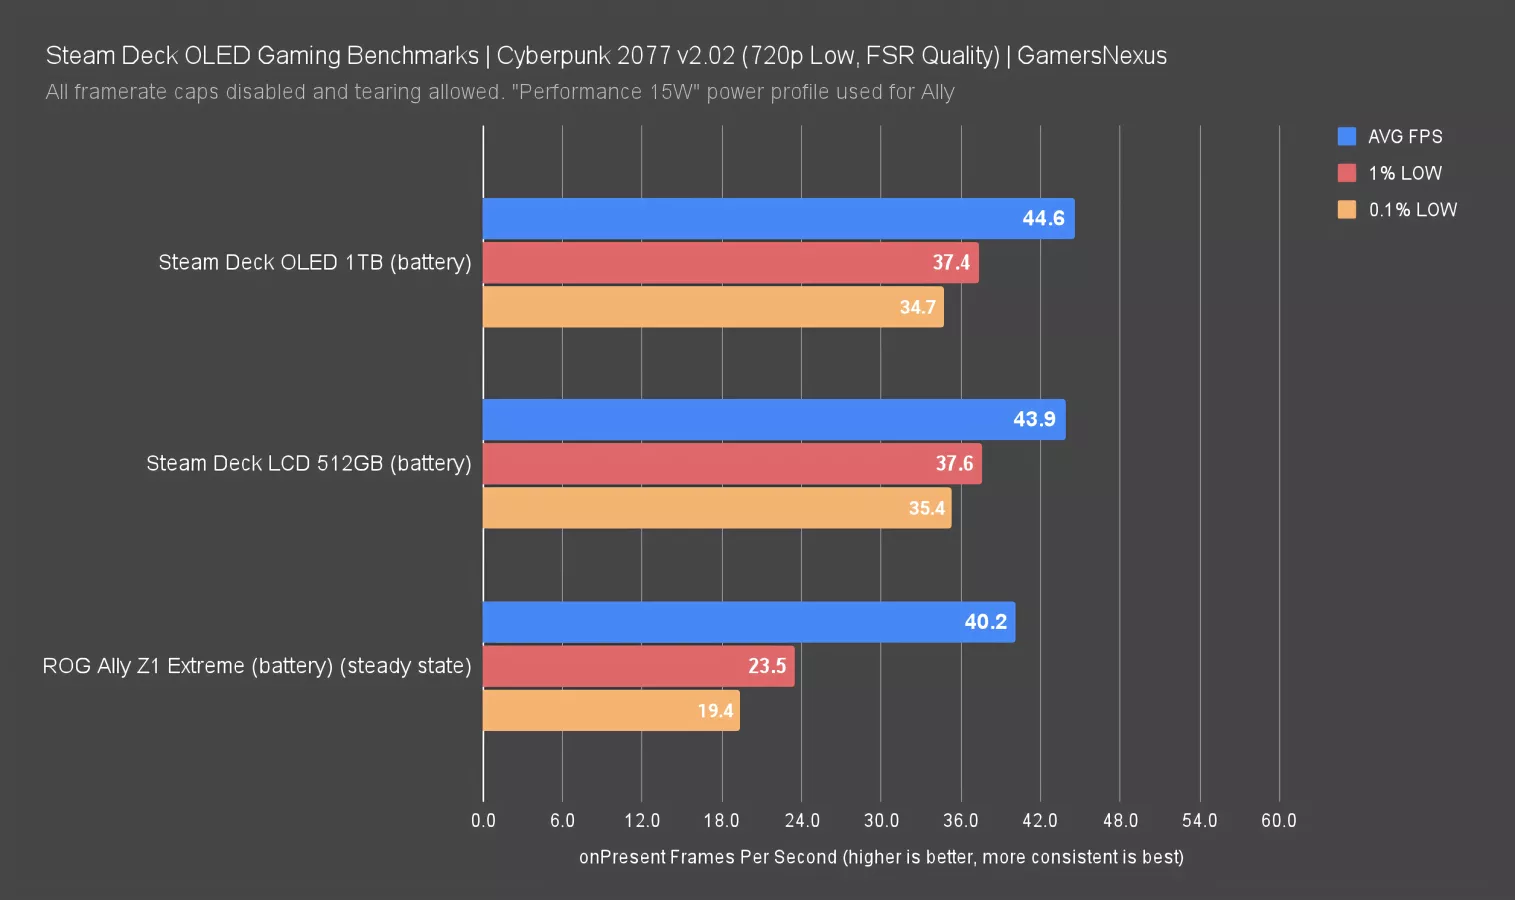
Cyberpunk, with our tested settings, had one of the least significant deltas. We tested in Dogtown, part of the Phantom Liberty DLC, at 720p Low with FSR 2.1 set to Quality. At those settings, the LCD averaged 44FPS, the OLED averaged 44.6FPS, a 1.6% improvement. The Ally Z1 Extreme is behind the LCD, as it was in our review months ago, although the Ally is capable of massive performance improvements on wall power that the Deck can't equal.
We’ll show that chart as a reminder. The data is not comparable to the chart above and settings are different, but this gives a reminder as to the capabilities of the Ally when on wall power -- the Deck can’t approach that, so the Ally is a better candidate for docked play.
Resident Evil 4 (2023) (720p, Prioritize Graphics preset)
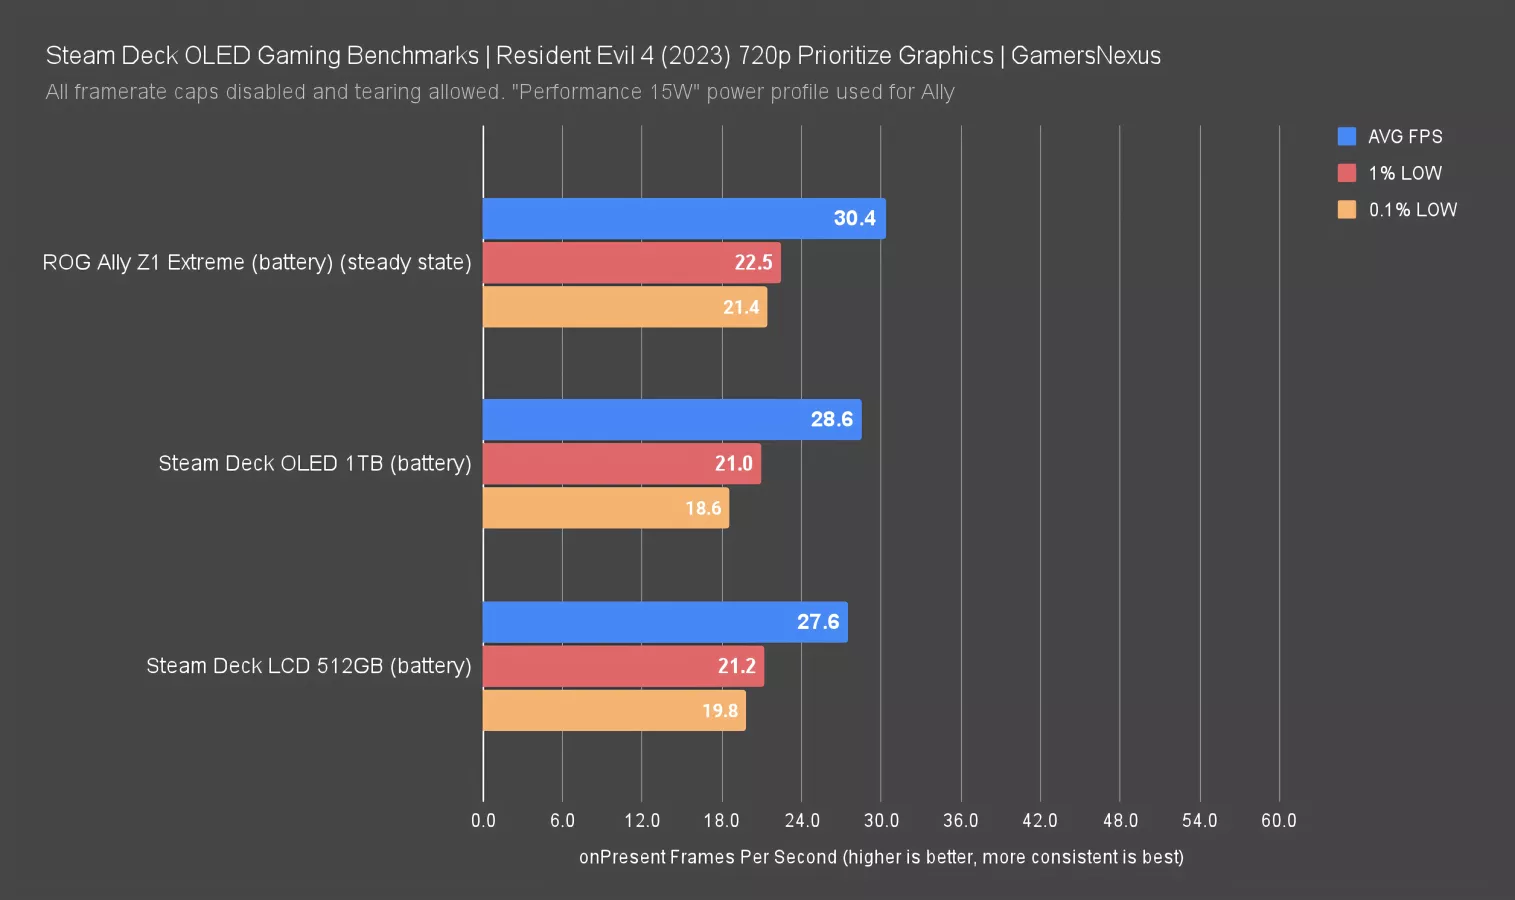
Resident Evil 4 at 720p with the Prioritize Graphics preset is pushing what these devices can manage, but the OLED handled it a little better than the LCD, with a 4% improvement from 27.6FPS average to 28.6FPS. The Z1 Extreme improved its position from last time we tested, pulling ahead of the OLED by 6.3%, at 30.4FPS average with stable lows. That’s a major relief for the Ally and is more in-line with what its hardware suggests it should be capable of and it really needs that support here.
Baldur's Gate 3 (720p DX11, Low preset, FSR 2.2 Balanced)
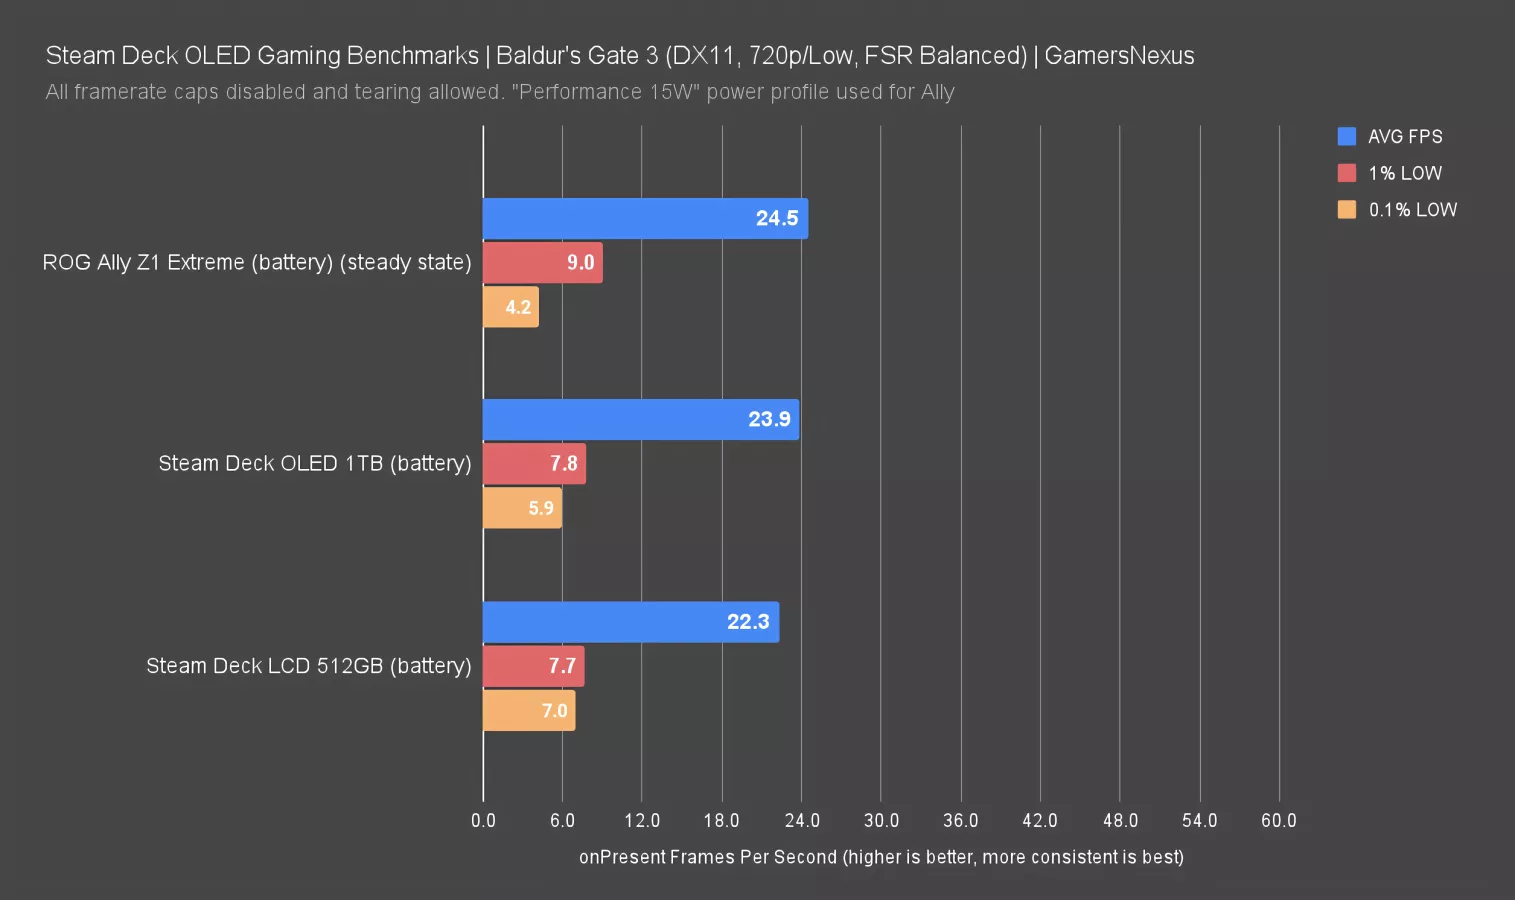
At time of testing, there's no obvious way to run Baldur’s Gate 3 with Vulkan on the Deck. We tested using the default DX11 API, since that's what a typical user would do.
The lows are abysmal on the crowded city street we use for testing, even at 720p Low with FSR 2.2 dropped all the way down to Balanced. 22.3FPS average on the LCD with 7.0 for 0.1% lows is brutal from the perspective of a desktop gamer, but Baldur's Gate 3 doesn't require high framerates to be playable, and there are plenty of players who will testify to that. The OLED improves things as much here as anywhere else, up 7% from the LCD, but that only translates to a 23.9FPS average with the unpleasant frametime spikes unchanged. The Ally did even better, and although it had poor 0.1% lows overall, it had high run-to-run variance with some individual stable passes mixed in.
Steam Deck OLED Latency
Now we’re talking latency. We won’t deep dive into why this matters here -- check our engineering interview for more detail. The short version is that the total responsiveness of the device significantly affects the actual human experience and, although framerate is indirectly tethered to responsiveness, it can at times decouple.
The updated Steam Deck has a 90Hz OLED screen, which will help it to attain lower latencies than the original 60Hz LCD at the back-end of this pipeline. In addition, higher framerates typically correlate with lower latency and will be reflected in the PC latency part of this pipeline, and we've already seen that the OLED usually outperforms the LCD.
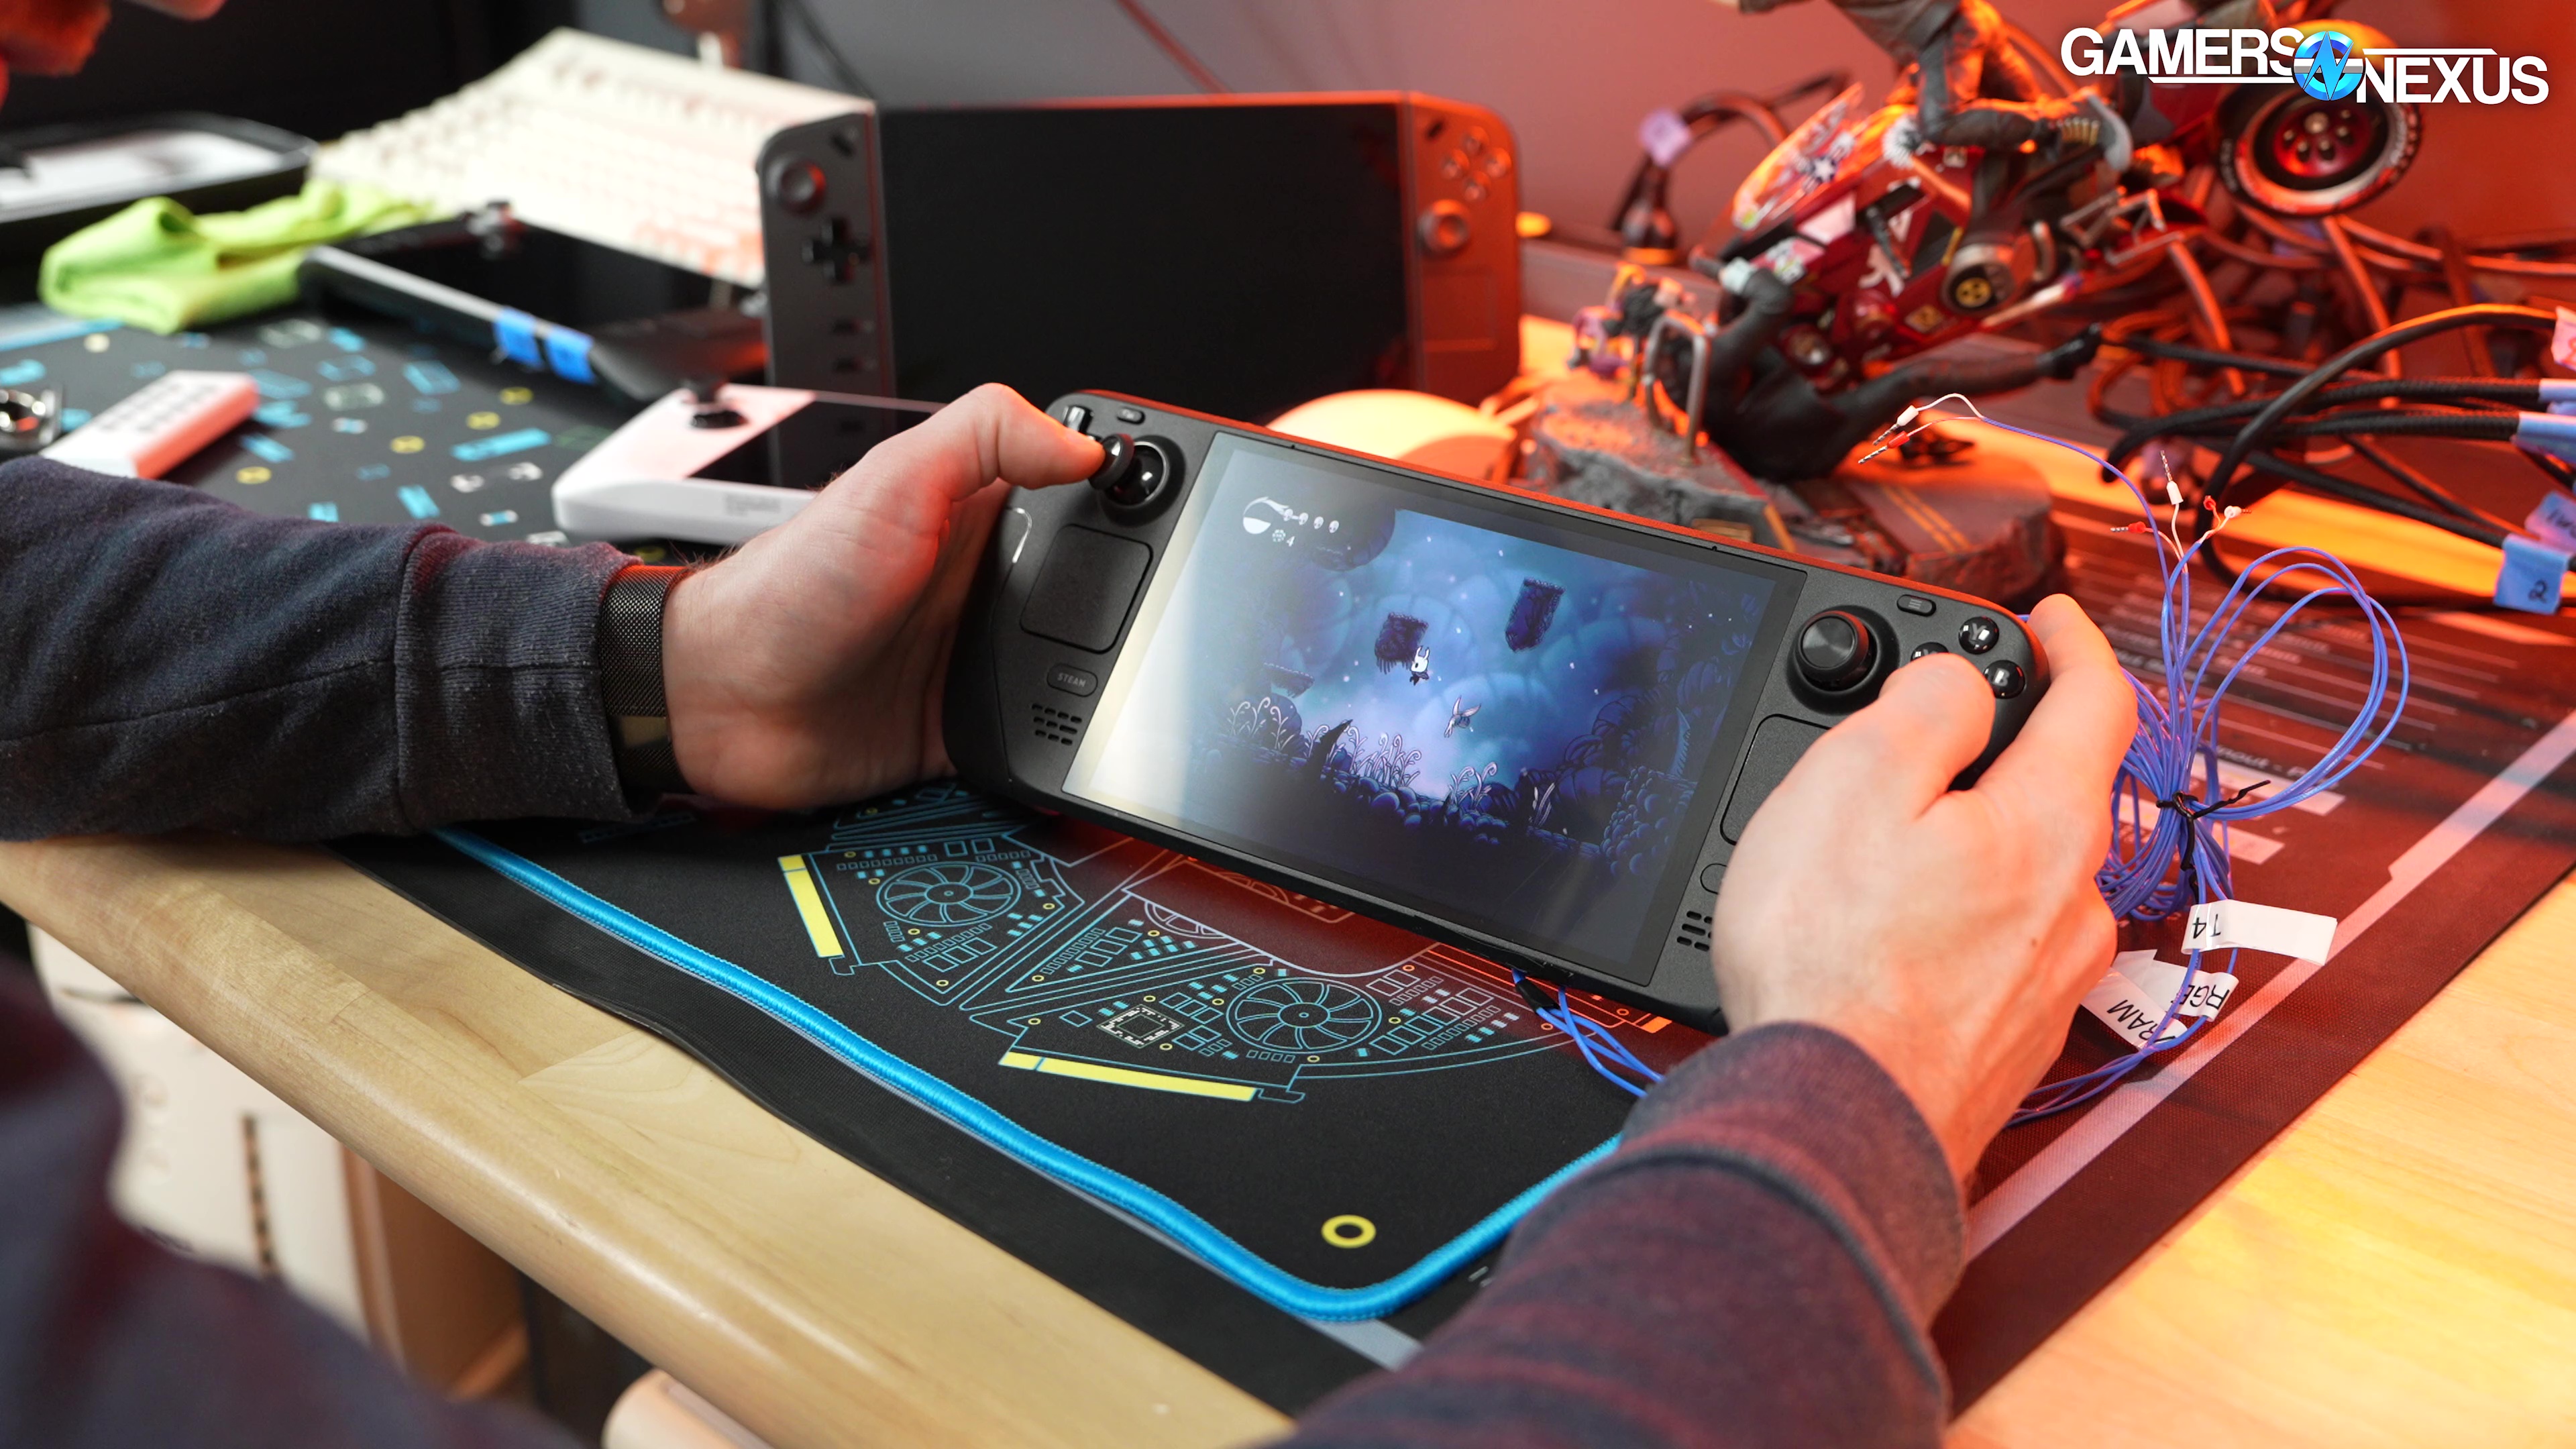
We chose two games for latency testing: Hollow Knight, a 2D platformer that renders well above the refresh rates of either device, and Dying Light 2, a more demanding 3D game that already showed improved performance on the OLED.
We used the NVIDIA LDAT for testing. This is a platform-agnostic tool. The measurements we're showing today are full "click-to-photon" system latency, so they encompass everything from the mouse button making a physical connection to the first detectable change on the display panel, meaning that FPS (the rate at which frames are rendered and presented) is a factor. This is a compromise; we could try to isolate the latencies tied to individual parts of the pipeline or experiment with framerate or refresh rate caps, but we're reviewing the Deck OLED holistically, so that's how we're testing its latency.
Variability in latencies is always high due to natural misalignments between the rates of rendering, refreshing, and input polling, so each result shown is an average of 100 samples. That’s a lot of sampling. Let’s get started with this exciting foray into latency testing.
Latency Benchmarks: Hollow Knight
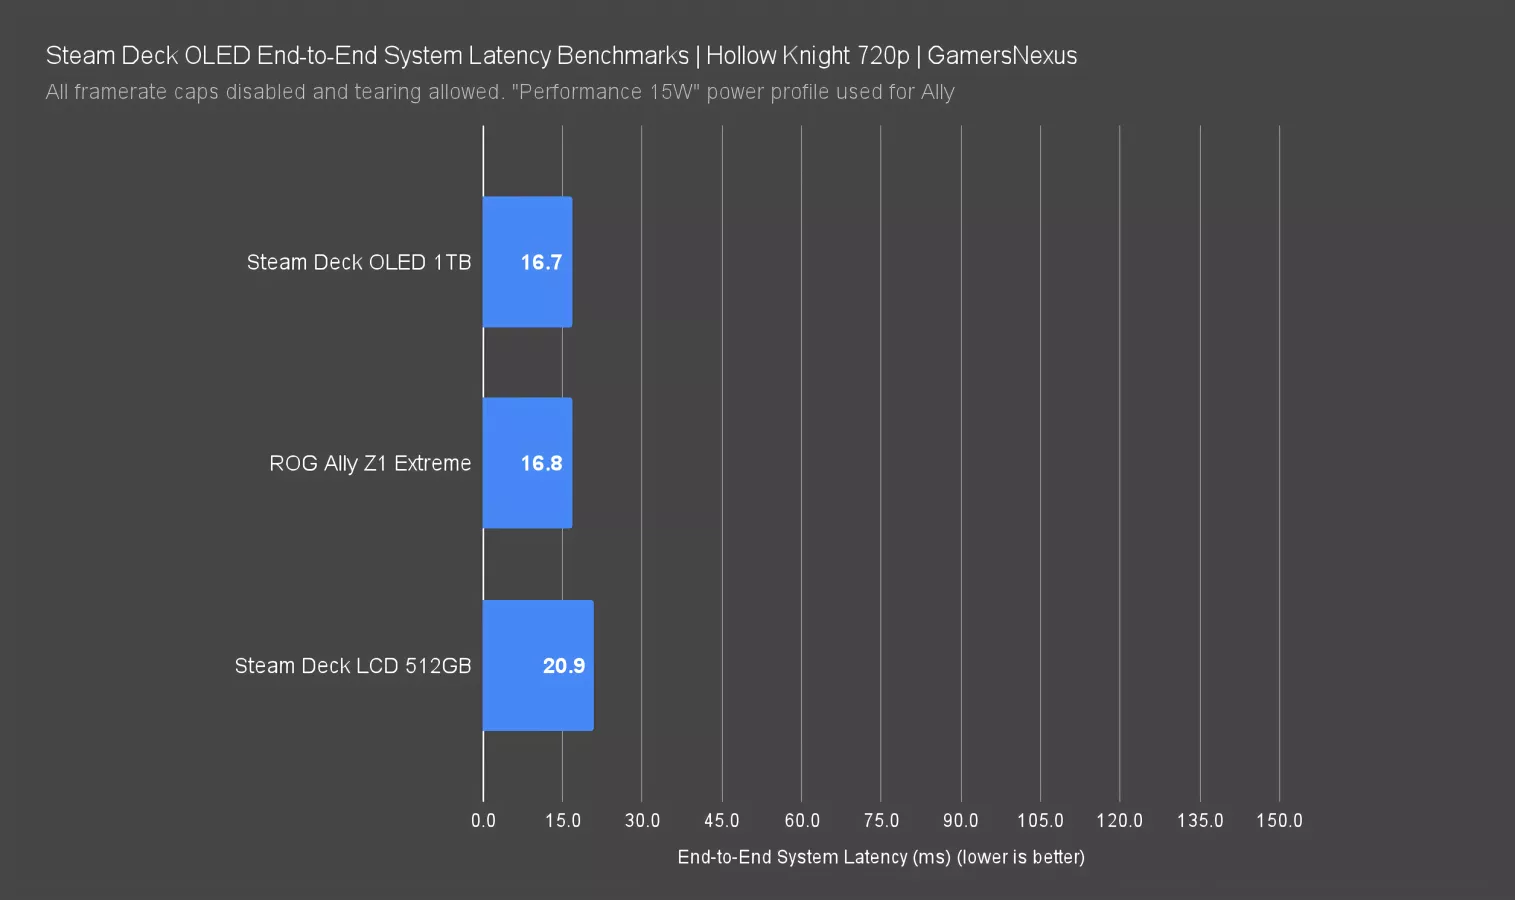
We tested Hollow Knight at 720p fullscreen with all framerate caps disabled, VSync off, and particle effects and blur quality set to their default values of normal and medium, respectively. On the LCD, latency averaged 20.9ms end-to-end. Technically, we saw an average of 70.9ms, but there's a frame of windup before The Knight's 20FPS attack animation becomes visible and can trigger the LDAT, so we can subtract a flat 50ms (or 1000ms/20FPS) from the measured time on each device as a result of the fixed 20FPS animation. On the OLED, that true latency was reduced to 16.7ms, a reduction from the LCD of 4.2ms. That's a tiny improvement, but our testing with a pro player -- coming out soon -- shows that people can detect small changes. Any reduction in latency can improve your precision, whether you're consciously aware of it or not. The reduction here can be directly tied to the screen change.
The Ally tied the OLED at 16.8ms, with the Ally tested as usual in Performance mode with its LCD screen running at 120Hz. The Ally and OLED are tied and within error.
Latency Benchmarks: Dying Light 2
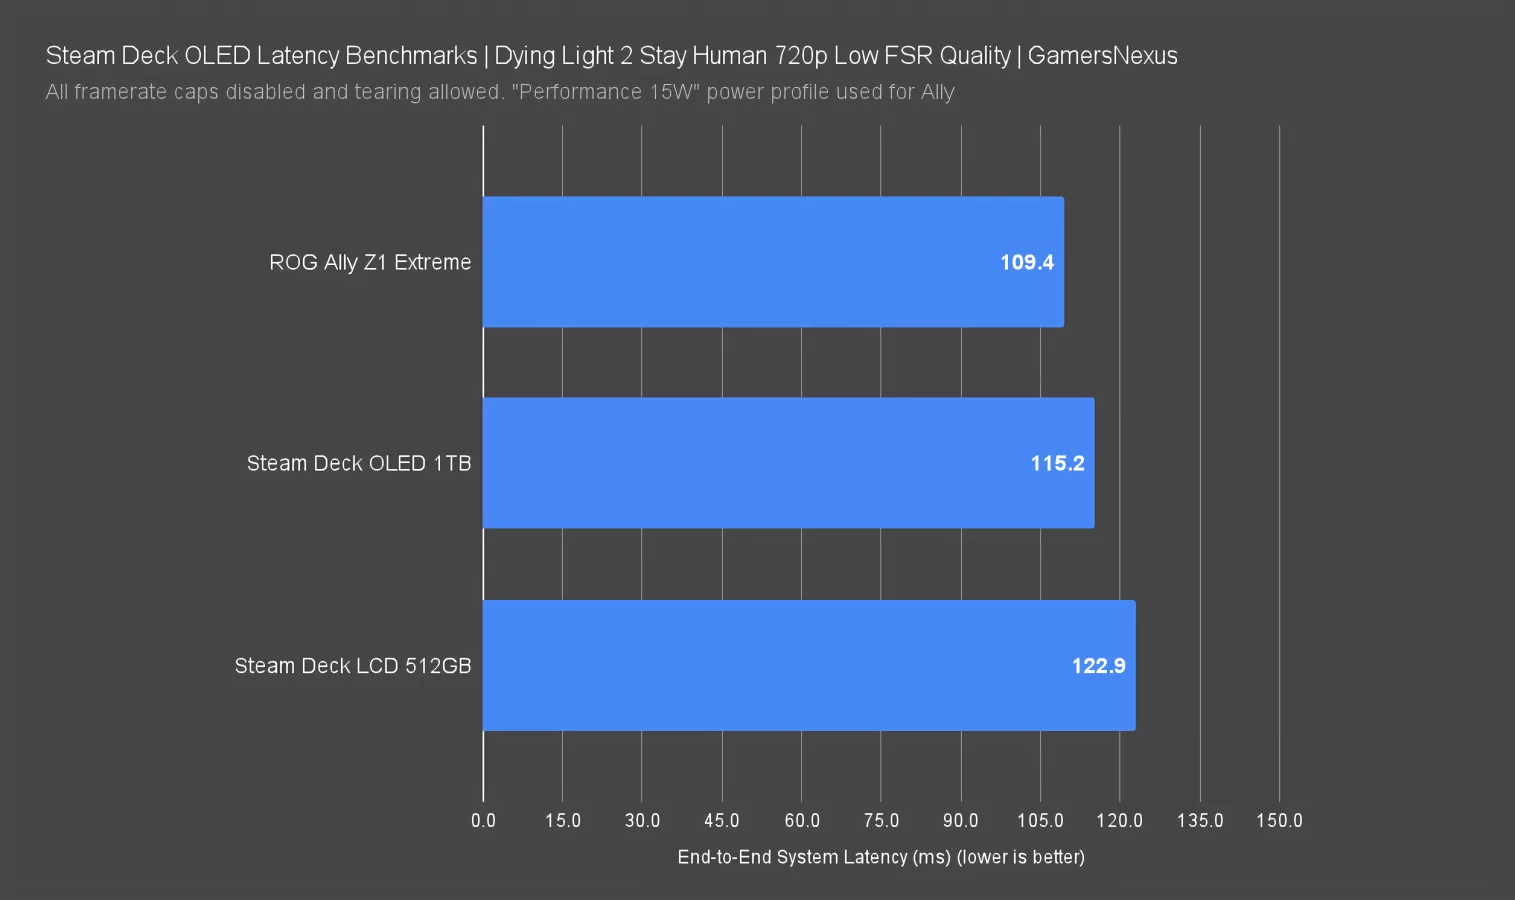
We tested Dying Light with the same settings used for our FPS benchmark. We experimented with different actions to trigger the LDAT and found that some (like flashlight toggle) seemed to have lower latency than others (like quick turn). We settled on the quick turn as the most reliable and relevant trigger. On the LCD, we saw a sluggish average 122.9ms of total system latency, down to 115.2ms on the OLED, a reduction of 7.7ms. For context, that reduction is a little more than the length of one frametime at 144FPS, but any improvement can have an impact when it comes to latency and this is a real improvement since we’re doing at least 100 passes. The more demanding software allows the Ally to stretch its legs, with the 109.4ms latency improved by 5.8ms versus the OLED. This is one of the titles in which the Ally also had an overall average framerate advantage.
The OLED has definitely improved over the LCD. The Ally also posts an advantage in some scenarios.
Steam Deck OLED Battery and Discharging
Now we’re getting into battery life tests and discharge time.
Battery life is completely dependent on workload. We've used three in the past for handhelds: VLC looping a 4K video locally, Dead Cells with a framerate cap, and F1 22 with unlimited framerate. This time around, we subbed in F1 23 to fix some crashing problems with the OLED. We wanted to add some full brightness tests as well, but even using F1 23, we found that the game would reliably crash if the OLED was set to 100% brightness; as a result, we only have 50% brightness comparisons here. We couldn’t find a solution to this bug and it did not appear to be related to thermals.
Battery Life: Video Playback
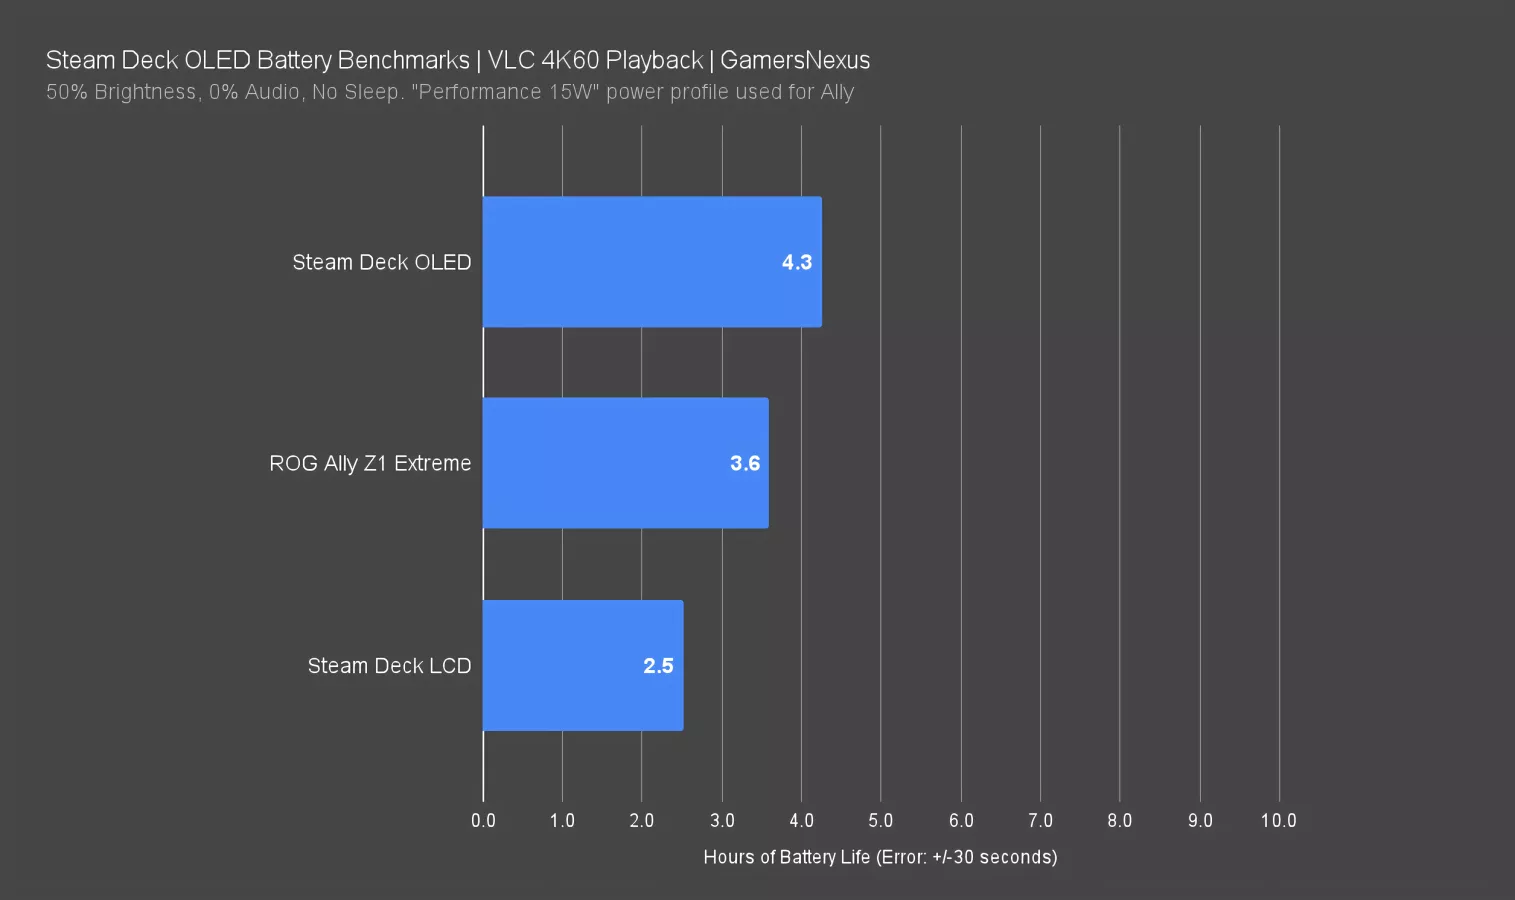
Looping one of our own rendered 4K60 videos fullscreen in VLC killed the OLED's battery after 4.3 hours, which is a significant improvement over the LCD and Z1 Extreme. In comparison to the LCD, the OLED lasted 72% longer -- a massive increase in total runtime for video playback. The lead over the Ally is 20%, a benefit of the OLED’s larger battery.
Battery Life: 2D Gaming (Dead Cells)
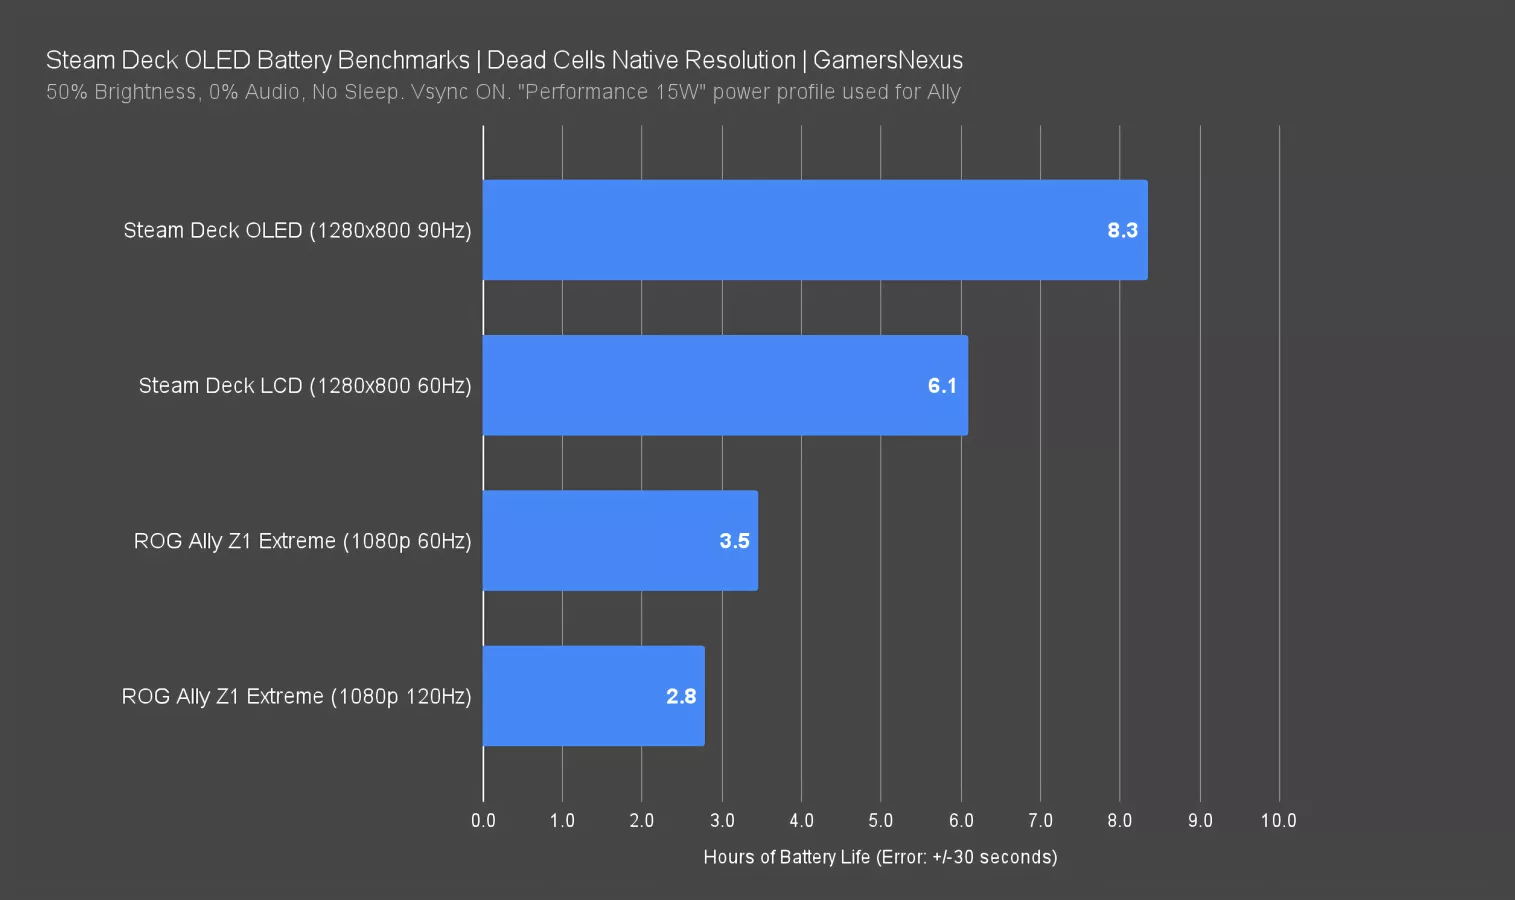
In Dead Cells, we allow the game to run at the native resolution of the device under test, and VSync to that device's native refresh rate. That means they are not purely like-for-like (that’s the next test), and we allow this variable to help represent likely real-world use.
Even for a 2D game like Dead Cells, this matters: note that our old result for the Z1 Extreme lasted 40 minutes longer with the refresh rate cut down to 60Hz. The OLED's 90Hz refresh rate should similarly decrease battery life versus the 60Hz LCD here, but the larger battery allows it to last 36% longer than the LCD model. More than 8 hours of continuous 2D gaming is pretty good.
Battery Life: F1 2023
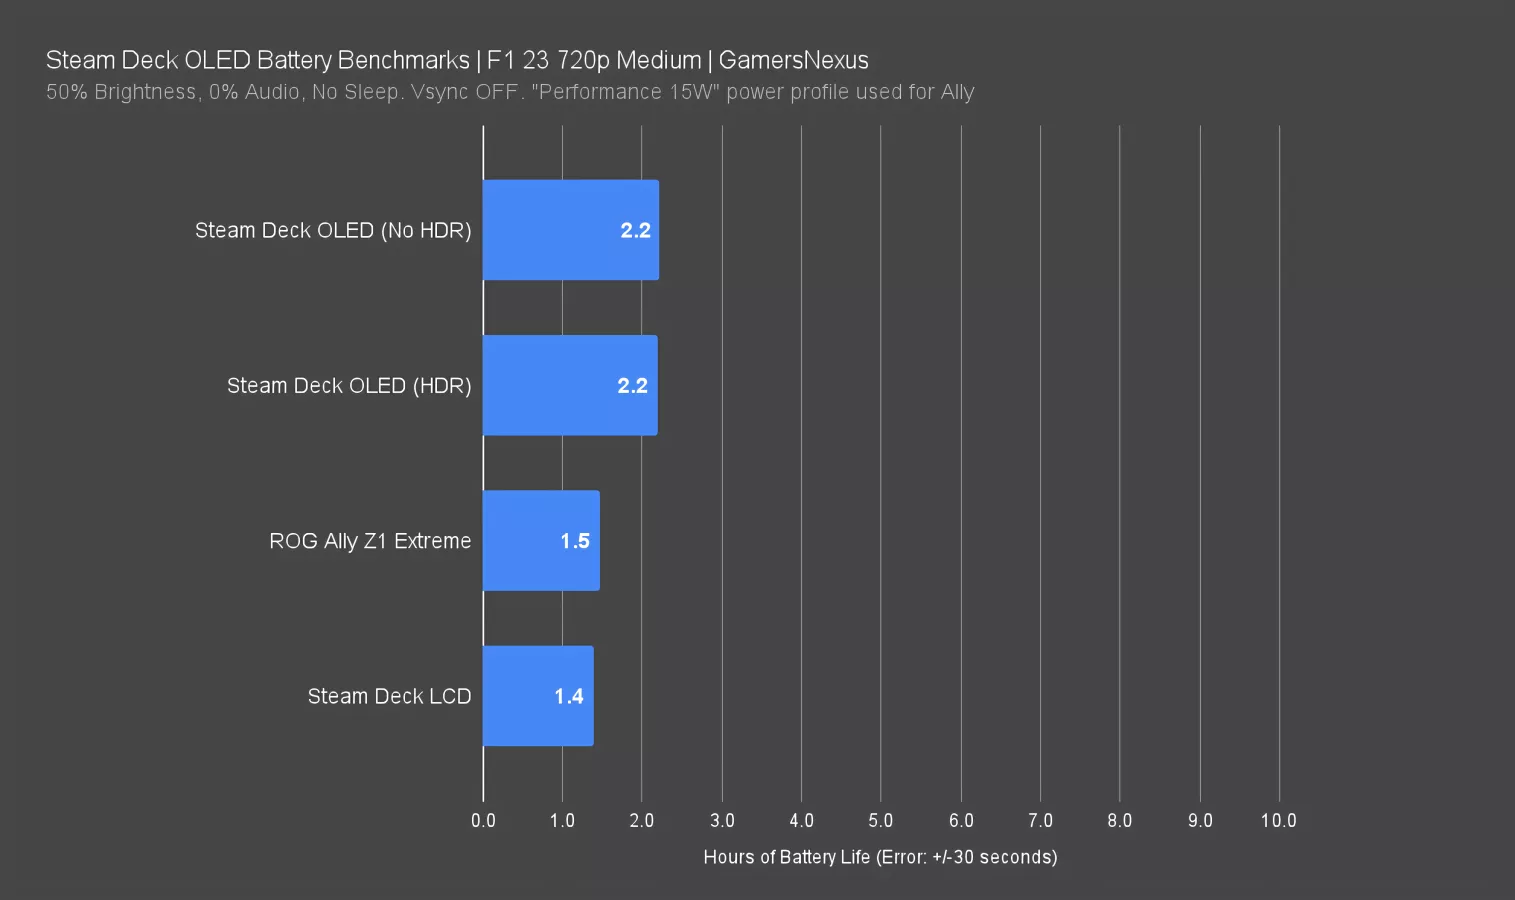
F1 is up, this one using all variables controlled, including resolution. These are directly comparable.
VSync was disabled for the F1 test and the medium preset was used (with variable rate shading turned off). The OLED Deck is the only device we tested that allowed the in-game HDR option to be enabled, so we did an extra test with it on and set to default values: scRGB with Peak Nit Adjustment set to 10. At a system level, the brightness was still set to 50% for all tests.
The Ally in Performance mode slightly outperformed the Deck LCD. The OLED handily beats both by more than half an hour of playtime, which is definitely noticeable in the real-world, and regardless of the in-game HDR setting: that's a 57% increase versus the LCD, and a 47% increase versus the Ally Z1 Extreme in Performance mode with those VSync settings as listed.
Steam Deck OLED Charging
We’re getting into charging testing now. For this testing, we use a calibrated logging power meter to sit between the device and the wall. Testing is done with the devices completely off. Remember that, although fast charge time is desirable, there are safety limitations and battery preservation limitations that should still be observed.
Battery Charge Rate
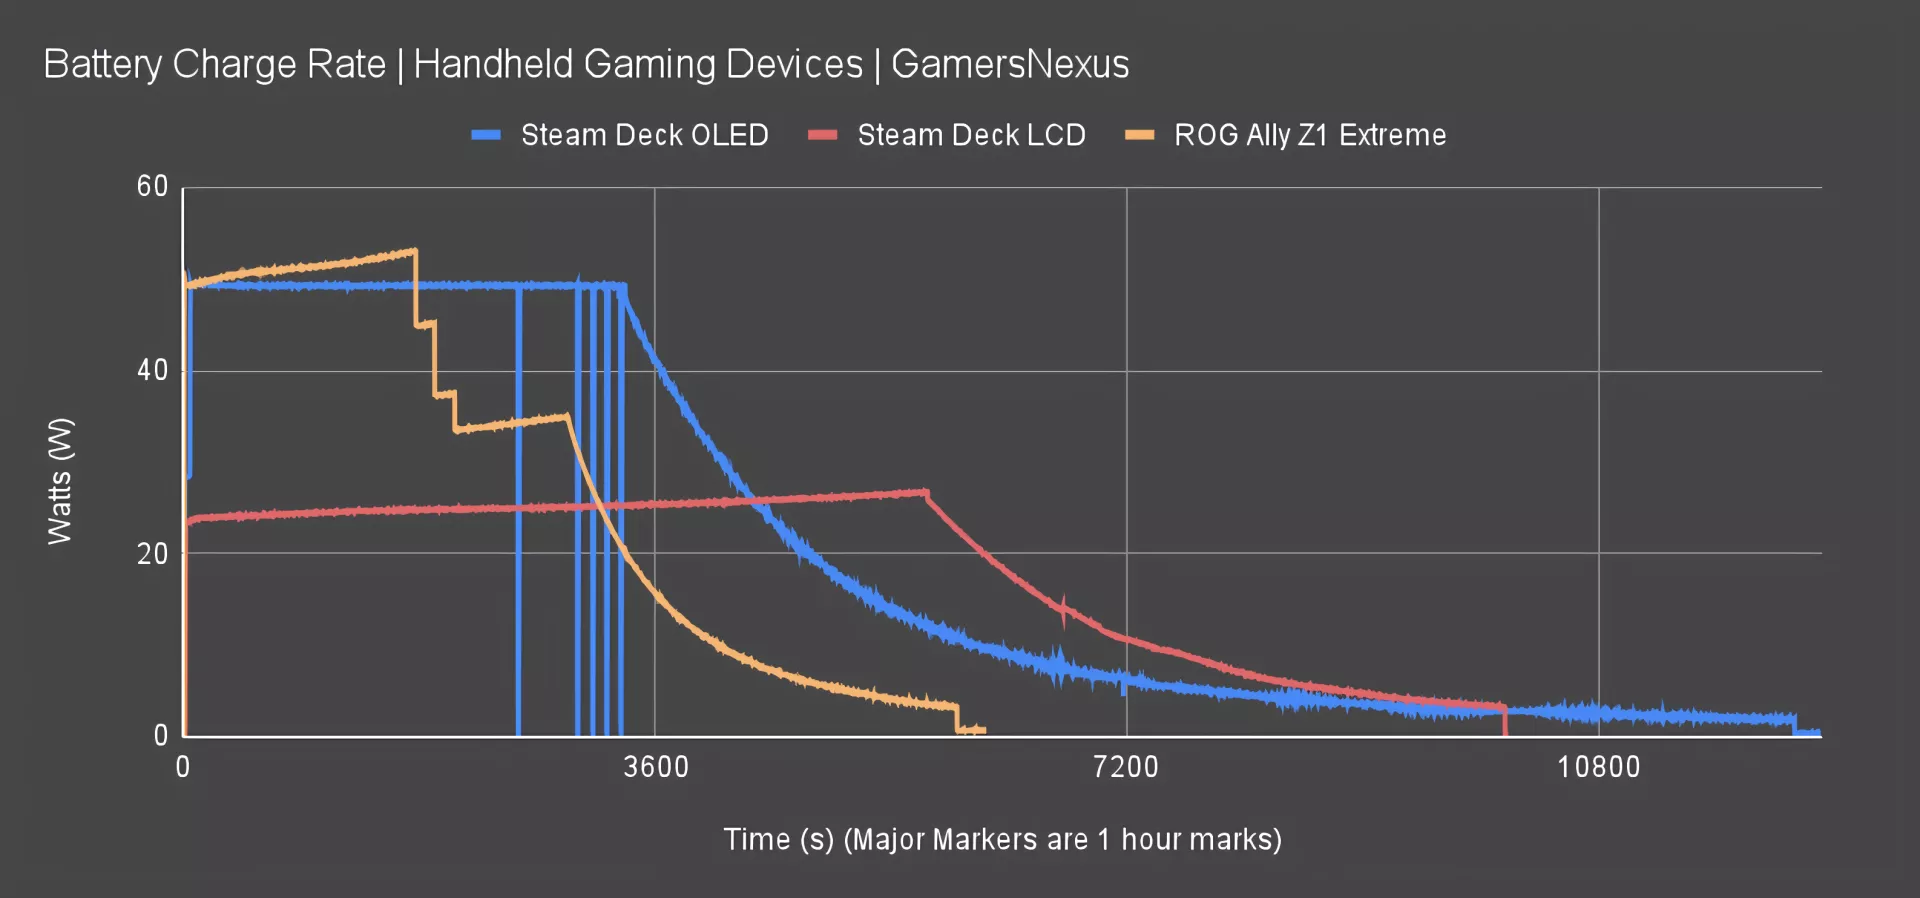
Despite the 50Wh battery against the original’s 40Wh, the Deck OLED uses a charger which is functionally identical: it's still a Chicony (Qún guāngdiànzǐ) AC adapter with 5V/3A, 9V/3A, 15V/3A, and 20V/2.25A listed as available output modes. If you do the math, that's a 45W max output.
The Deck OLED pulled 50W at its peak, measured at the wall and not the output, with brief dips near the 55-minute mark. That’s where the rate of charging drops into a typical curve. We found that the Deck LCD only pulls 27W at most under these conditions. The Ally completed its charge in about 98 minutes, making it the fastest of these. Its curve is also the most aggressive, with a stuttered stair step and higher initial draw.
In total, the OLED took 205 minutes to charge, a 22% longer charge time than the LCD's 168 minute total charge time -- but its battery is 25% larger and there is more to the story.
Charge Time: 0-90%
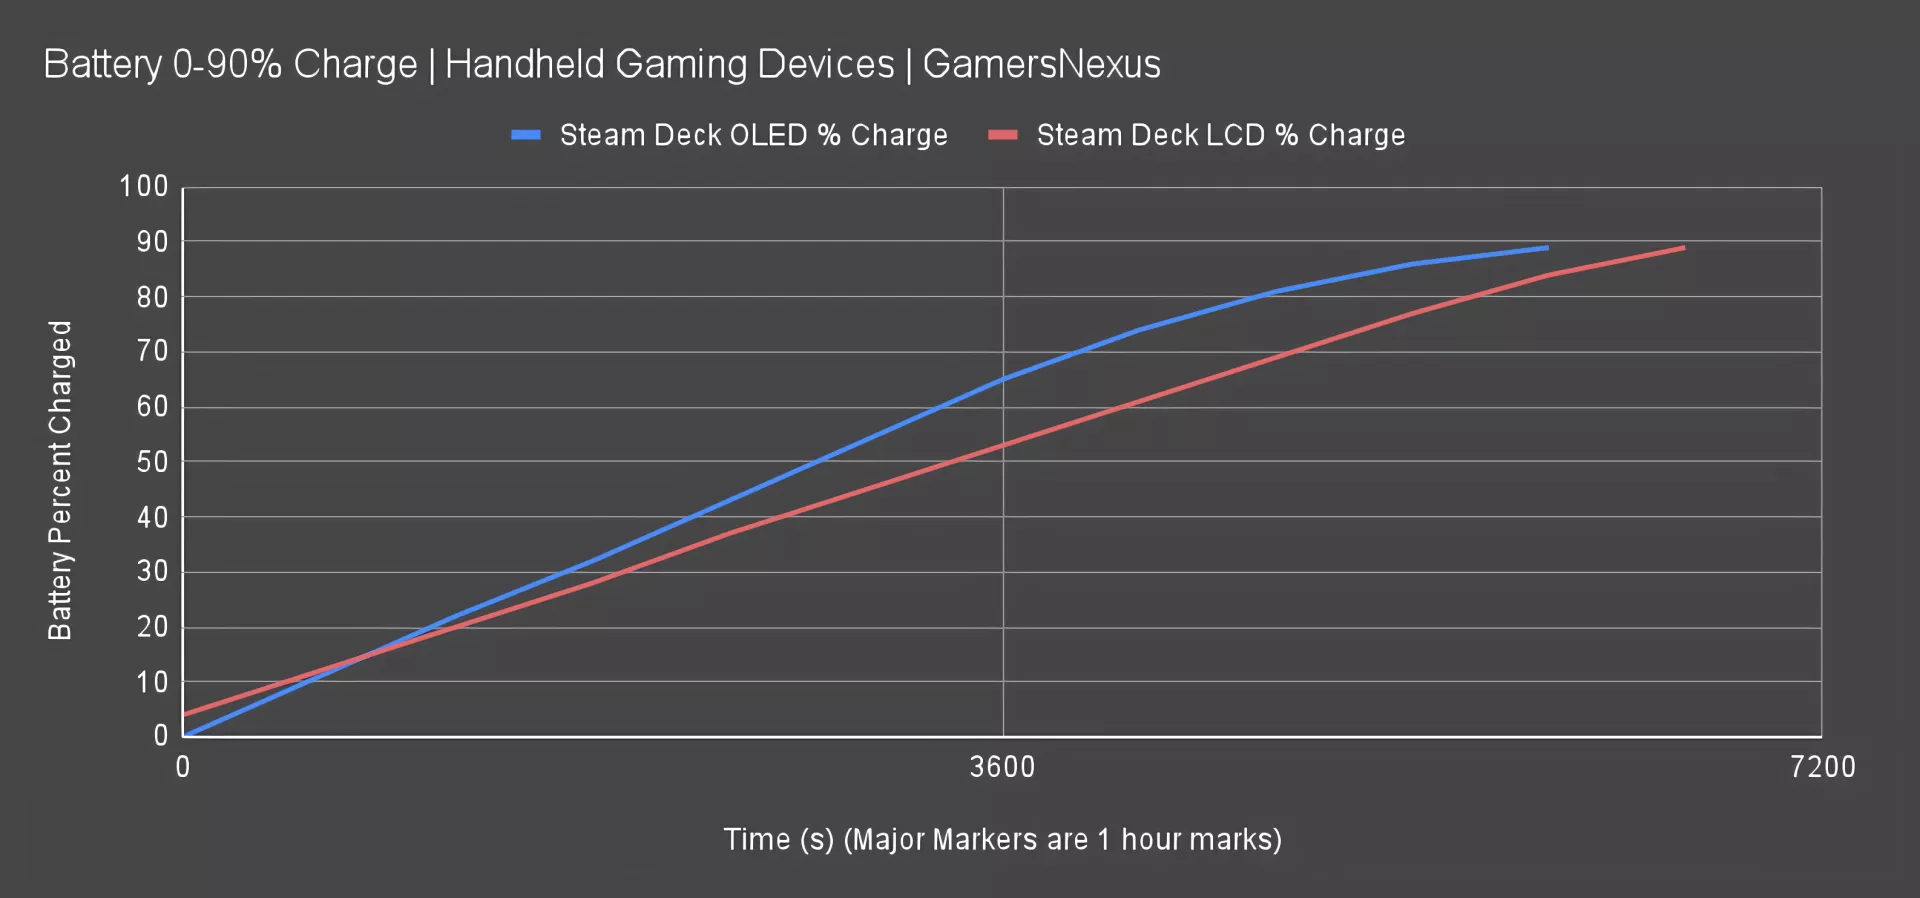
That 22% increase in time lines up neatly with the 25% increase in battery capacity, but that's not the whole story: most lithium batteries don't charge at a linear rate. As this chart illustrates, the OLED reaches a usable state of charge faster than the LCD, even if the total charge time is longer. The OLED hits 80% charge at 78 minutes to the LCD's 94 minutes, and 90% charge at 101 minutes to the LCD's 111 minutes. Note that the horizontal scale of this chart is half that of the chart above: getting to 90% charge is much, much faster than 100%.
But there’s a flaw to this chart.
Charge Time: Wh Comparison

This chart fixes it. Because the OLED's battery has a larger overall capacity, percentages aren’t the whole story. Plotting the Watt-hours rather than percent of charge at the same intervals reveals a larger gap between the curves, as the OLED both stores more energy and does it at a faster rate than the LCD, we start to see them deviate. The OLED hits 30 Wh before the LCD is even at 20 Wh.
Steam Deck OLED Thermals
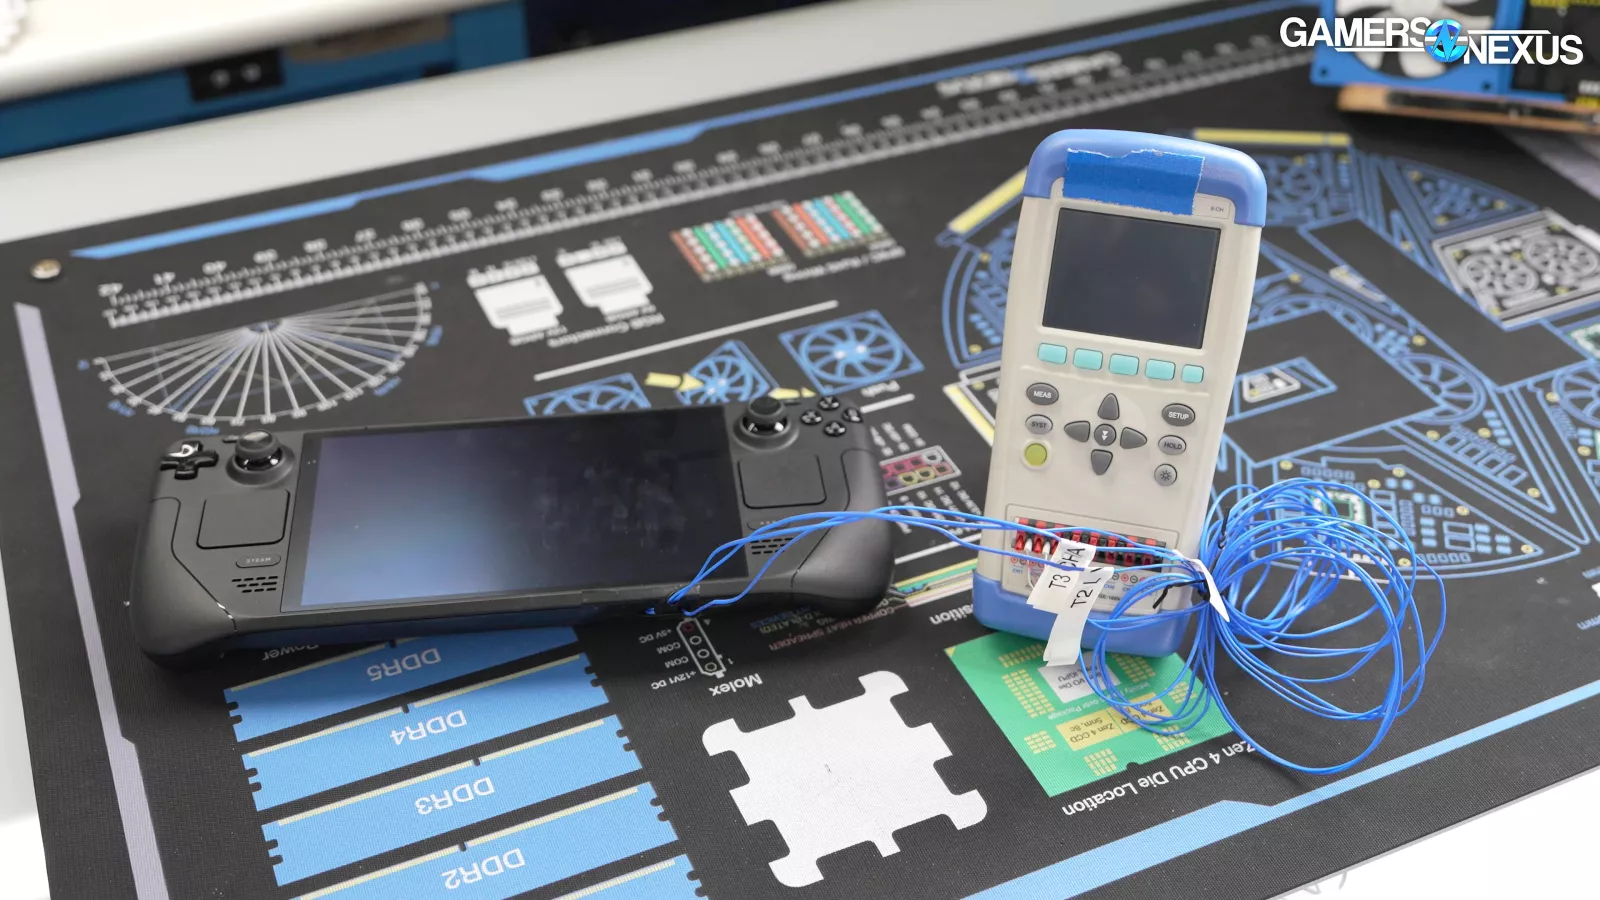
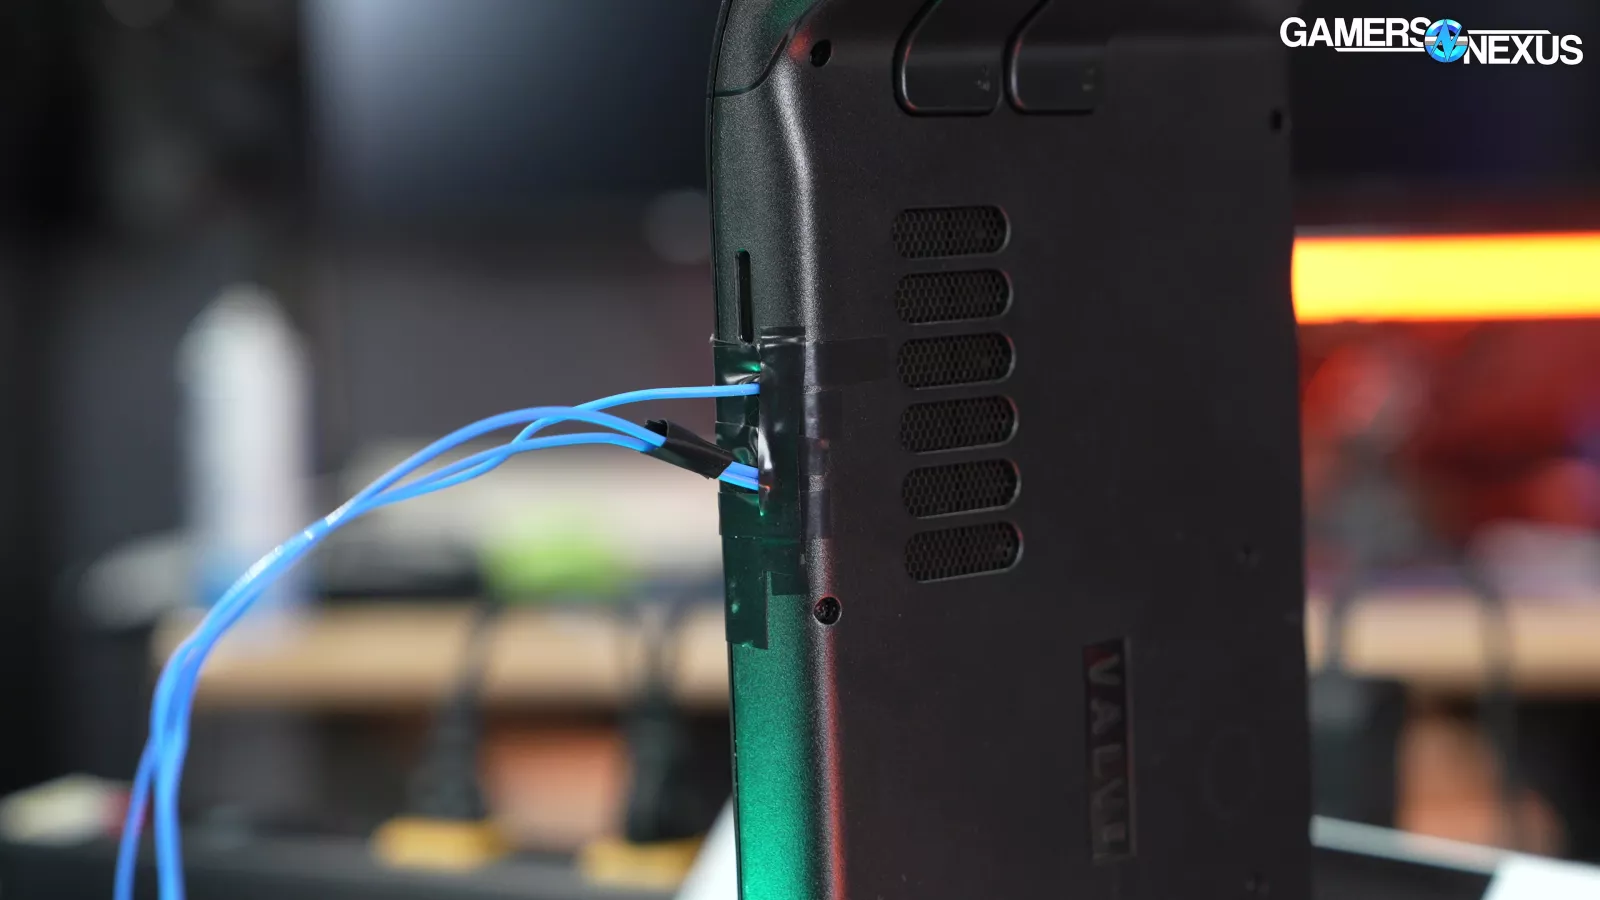
This is a quick revisit of the thermals on the Steam Deck devices. For this testing, we use a mix of internal sensors and thermal probes that we attach inside the device.
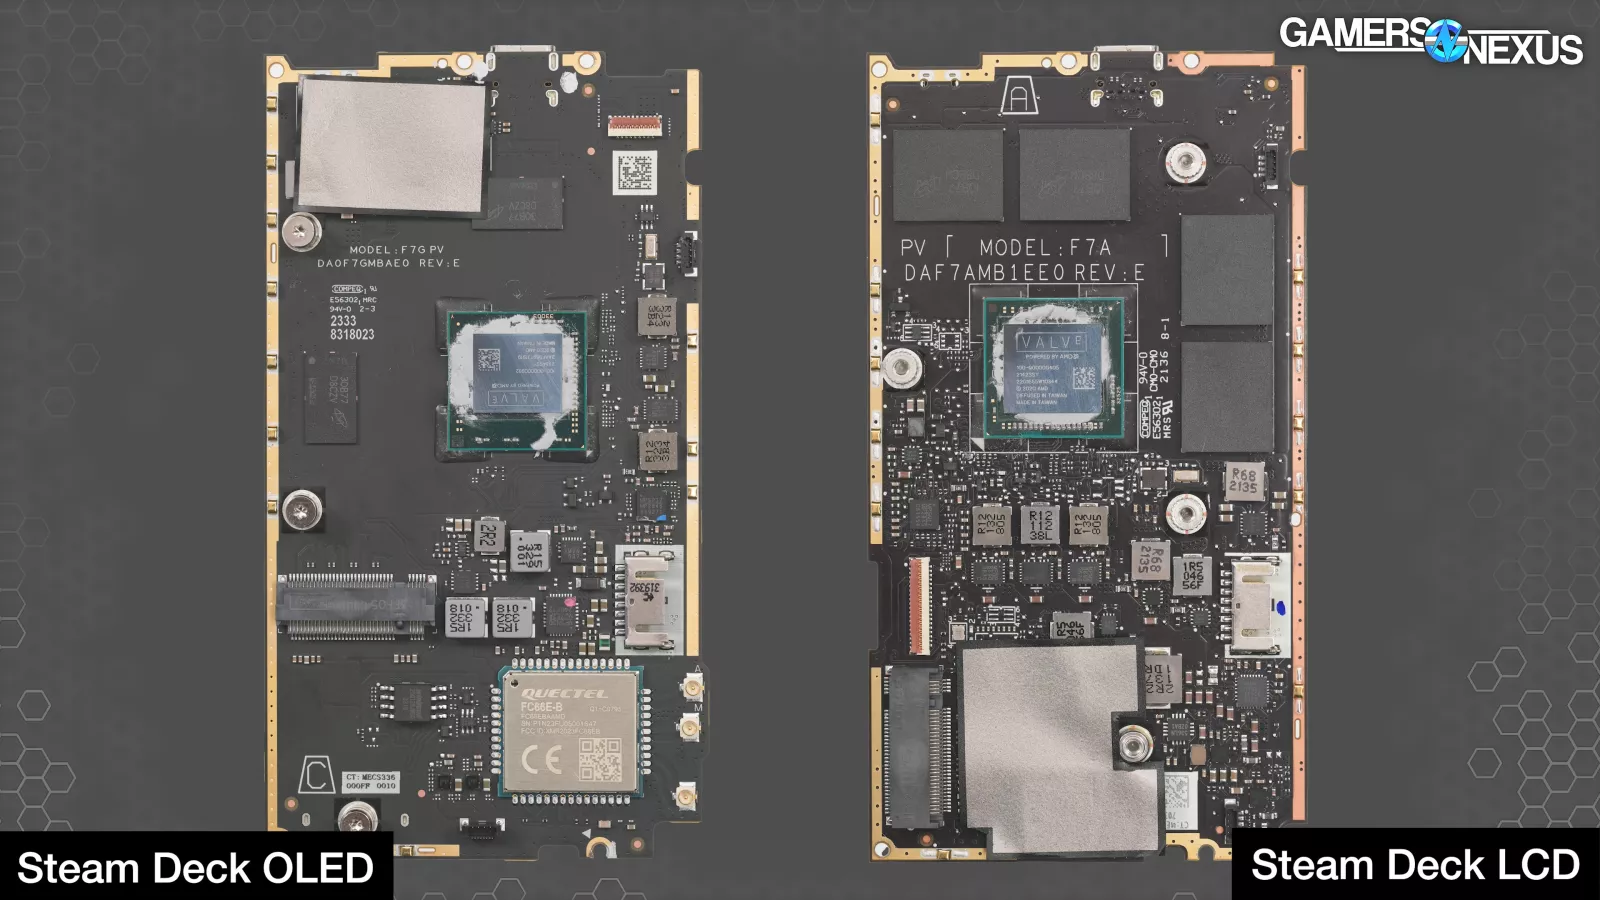
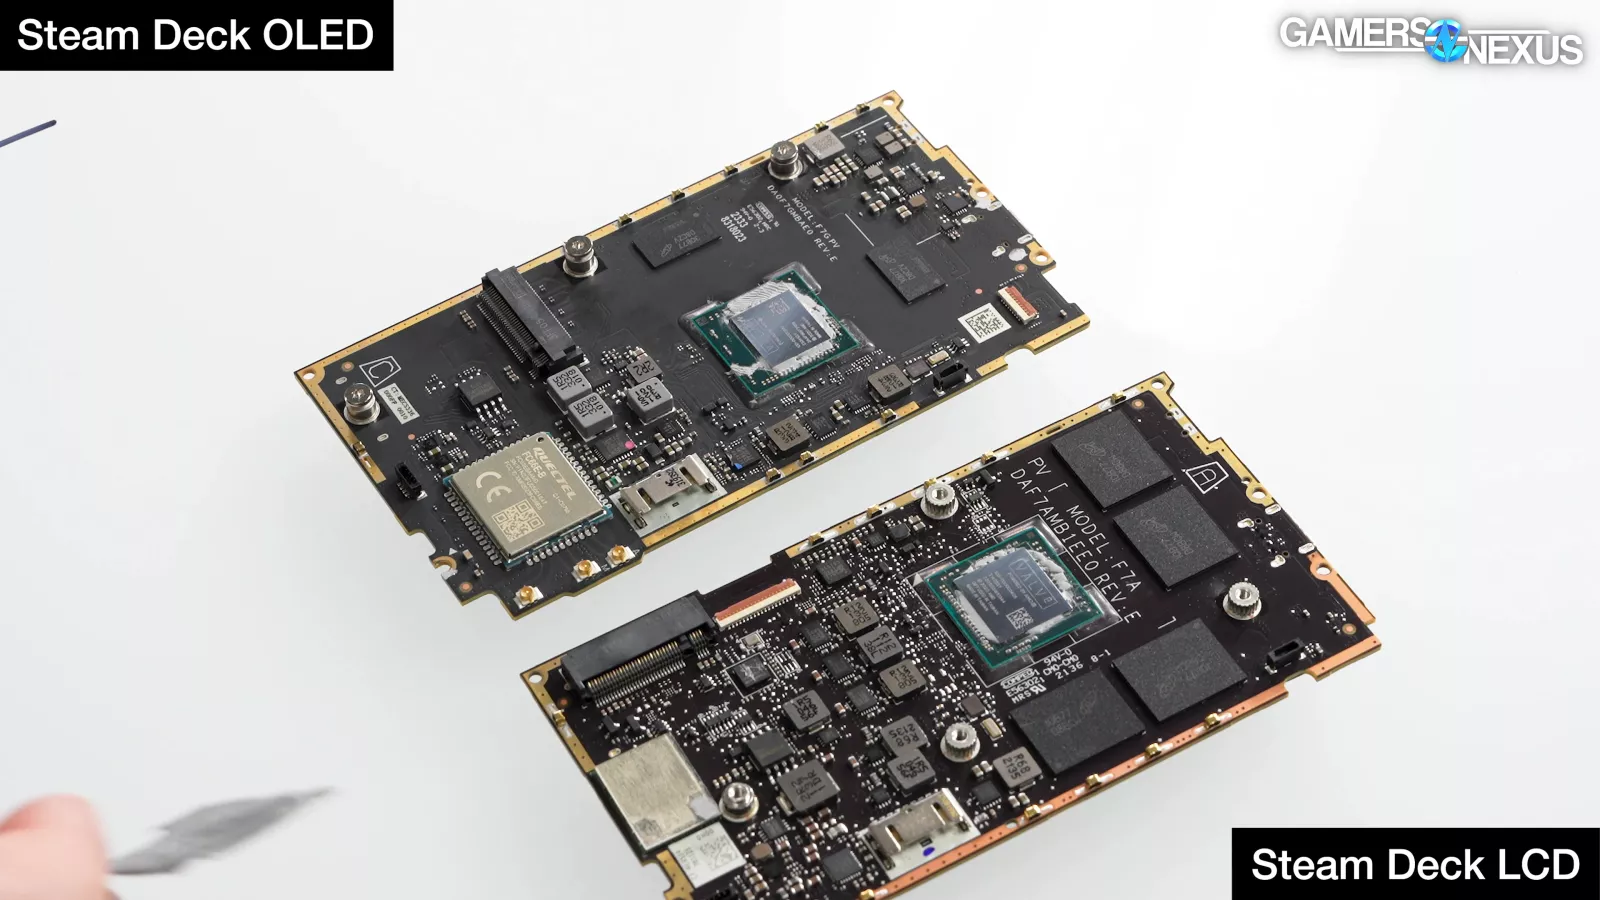
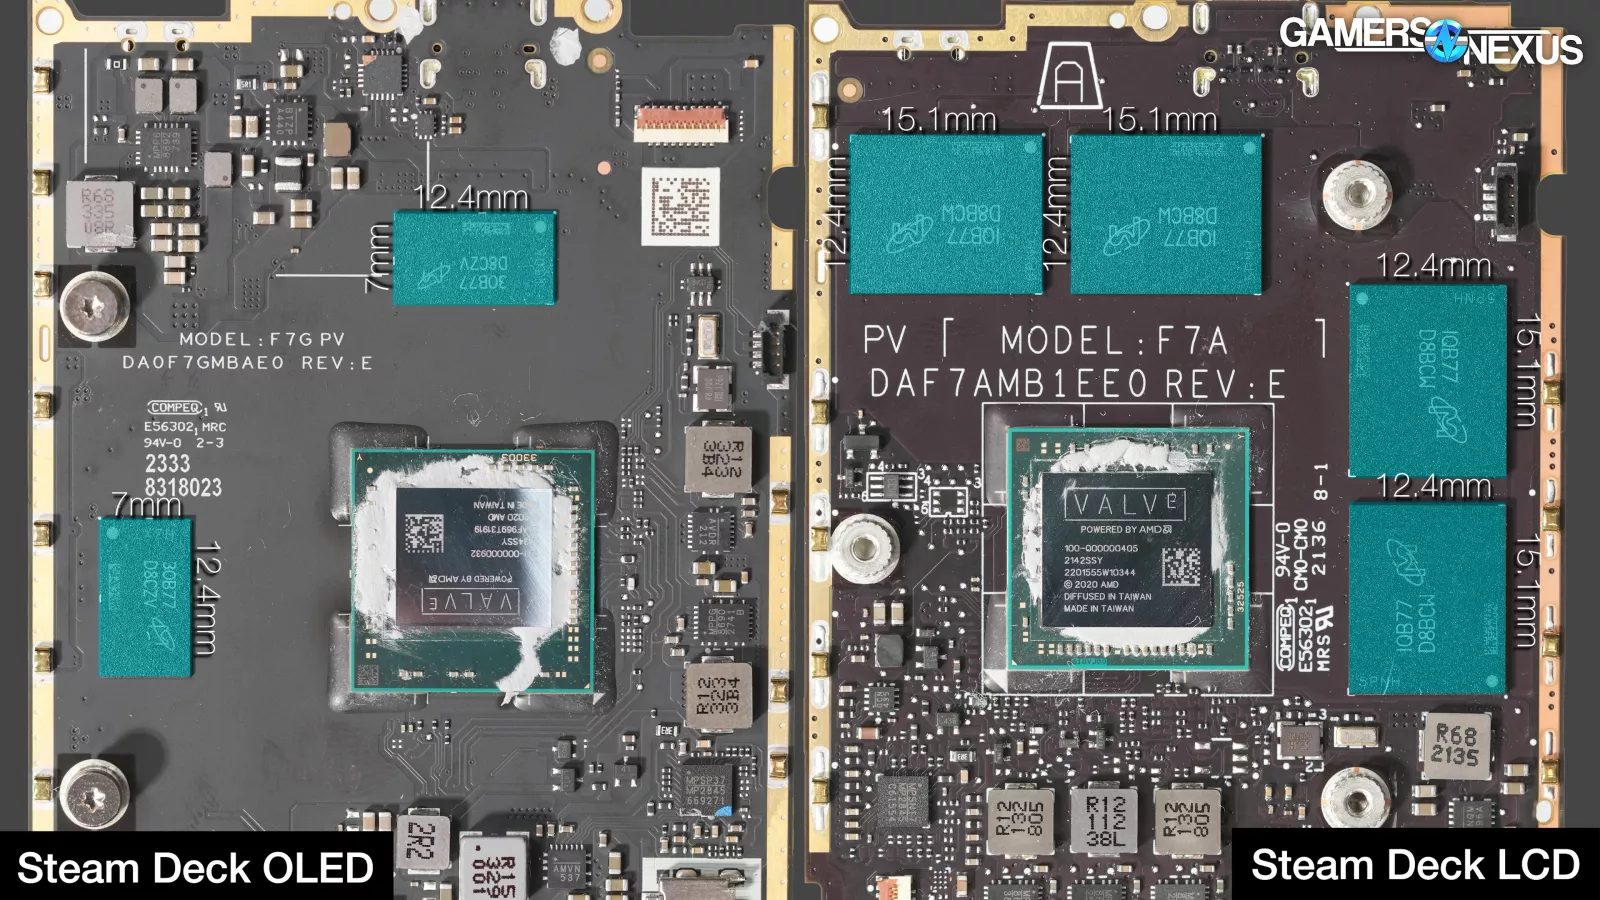
One of the major changes to the internals was the rotation of the SOC, which likewise allowed a rotation of the taller VRM components away from the underpass that allows the fan to supply air to the motherboard. Valve also went with shorter inductors in some places, which also reduces impedance to flow. The new memory chips are also about half the height of the original, which allows more flow into the rest of the board.
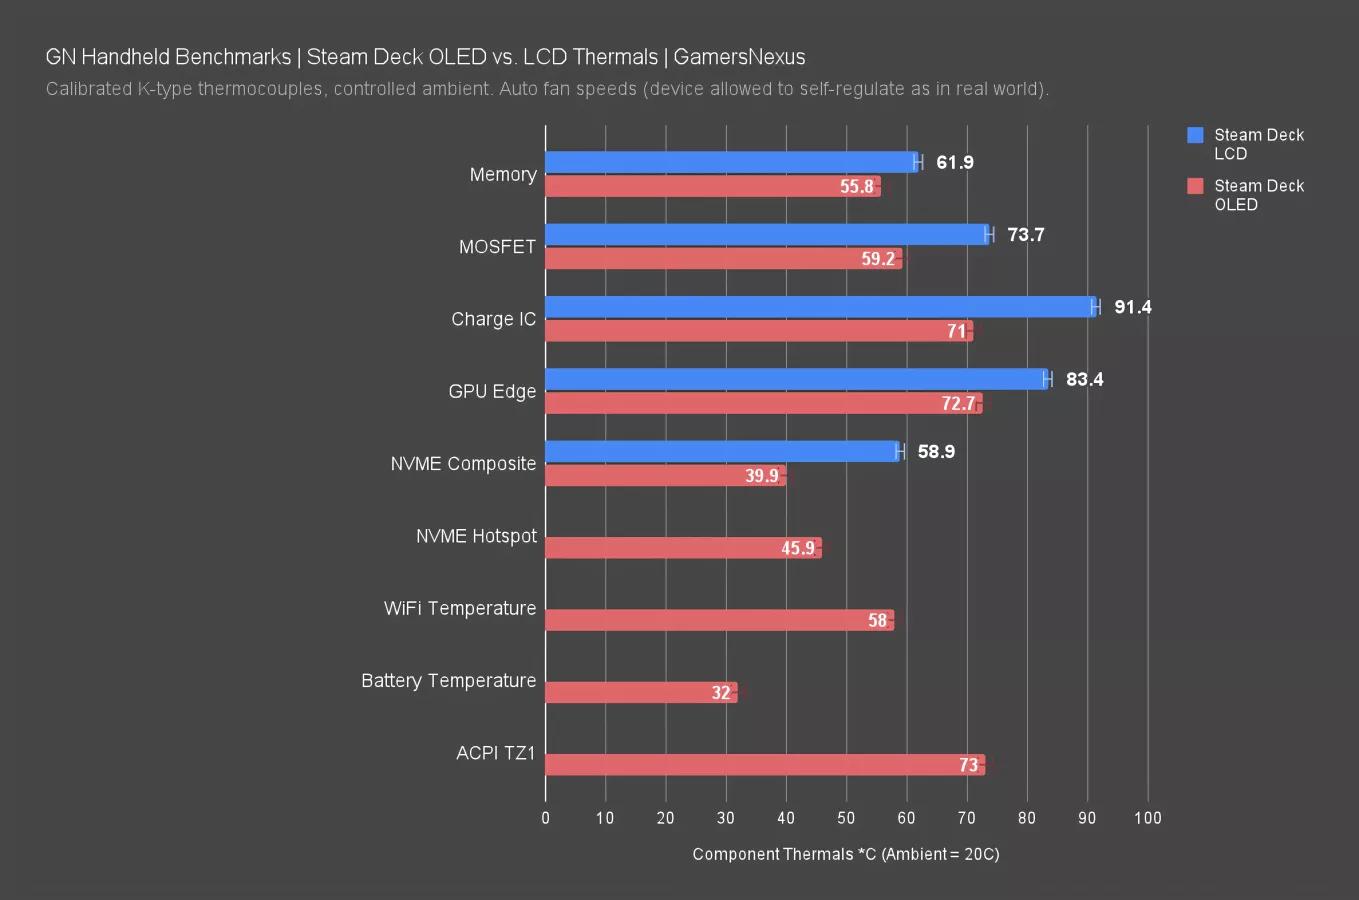
The end result is this chart, showing a significant improvement to thermals across the board. The memory temperatures checked at our probe points have dropped from 62 degrees to 56 degrees at 20 degrees Celsius ambient for the OLED.
The charger IC dropped massively in temperature, falling from 91 degrees Celsius in the original testing to 71 degrees with the major overhaul that Valve committed to this charger IC previously. We detailed the technicals of this in our tear-down, but the significant changes worked to resolve one of the main thermal problems Valve had previously.
NVMe temperatures may not be 100% directly comparable, as this uses sensors in software.
Overall, Valve’s changes to component layout have significantly aided in the thermals of the device.
Steam Deck OLED Fan RPM and Noise
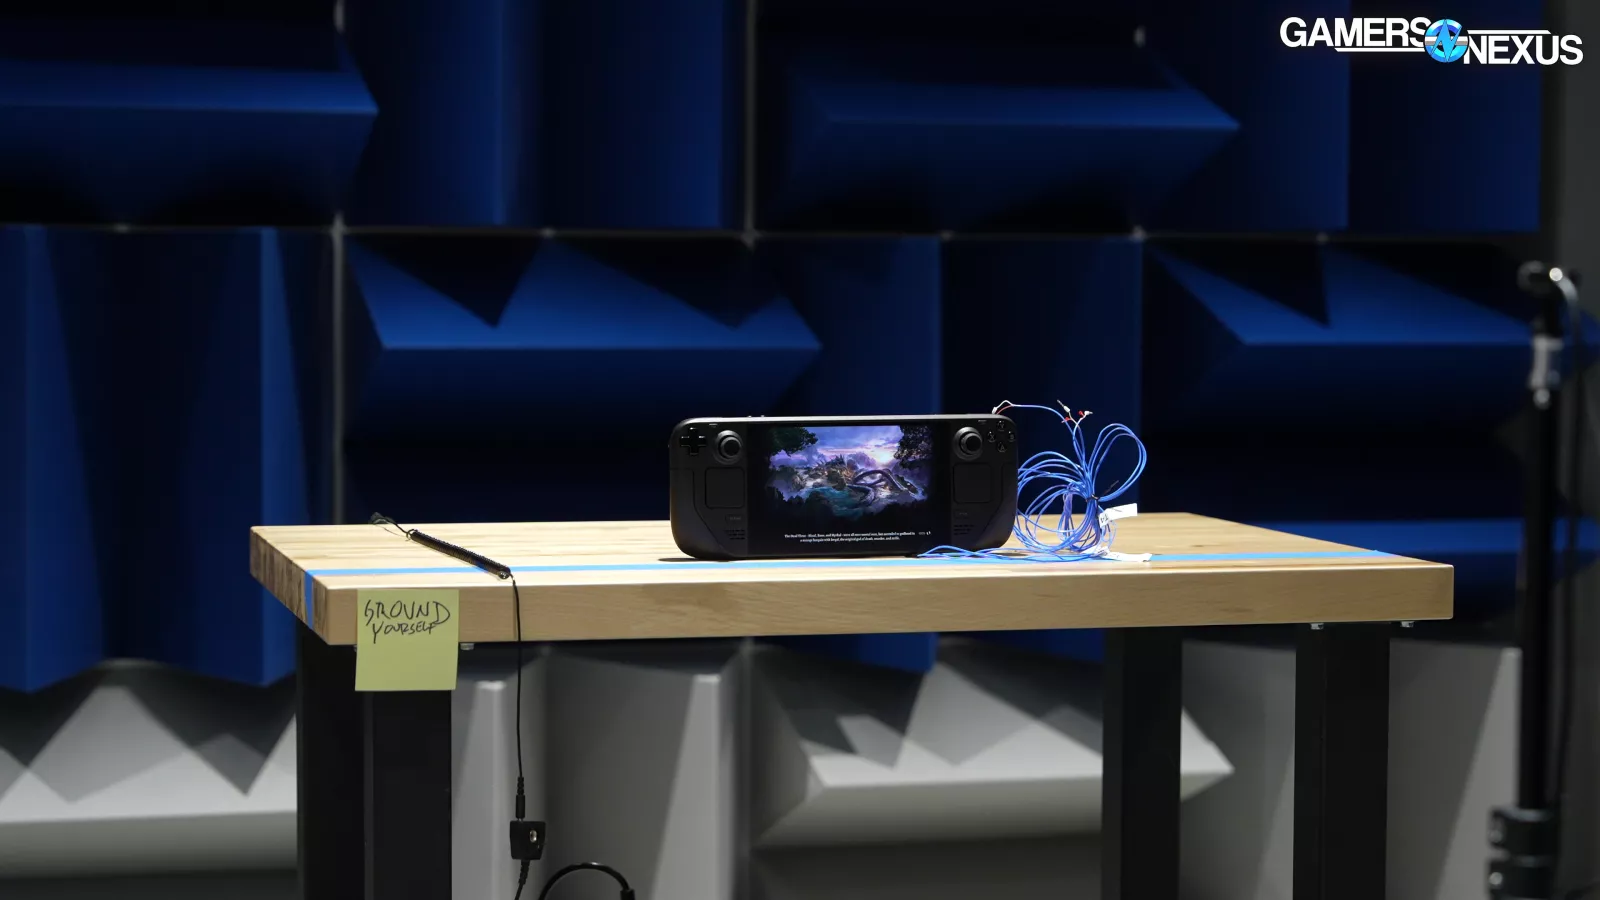
Anecdotally, the OLED is far quieter than the LCD but is louder than the Ally. We don't need to rely on anecdotal evidence, though; we have a hemi-anechoic chamber.
Noise Levels: dBA
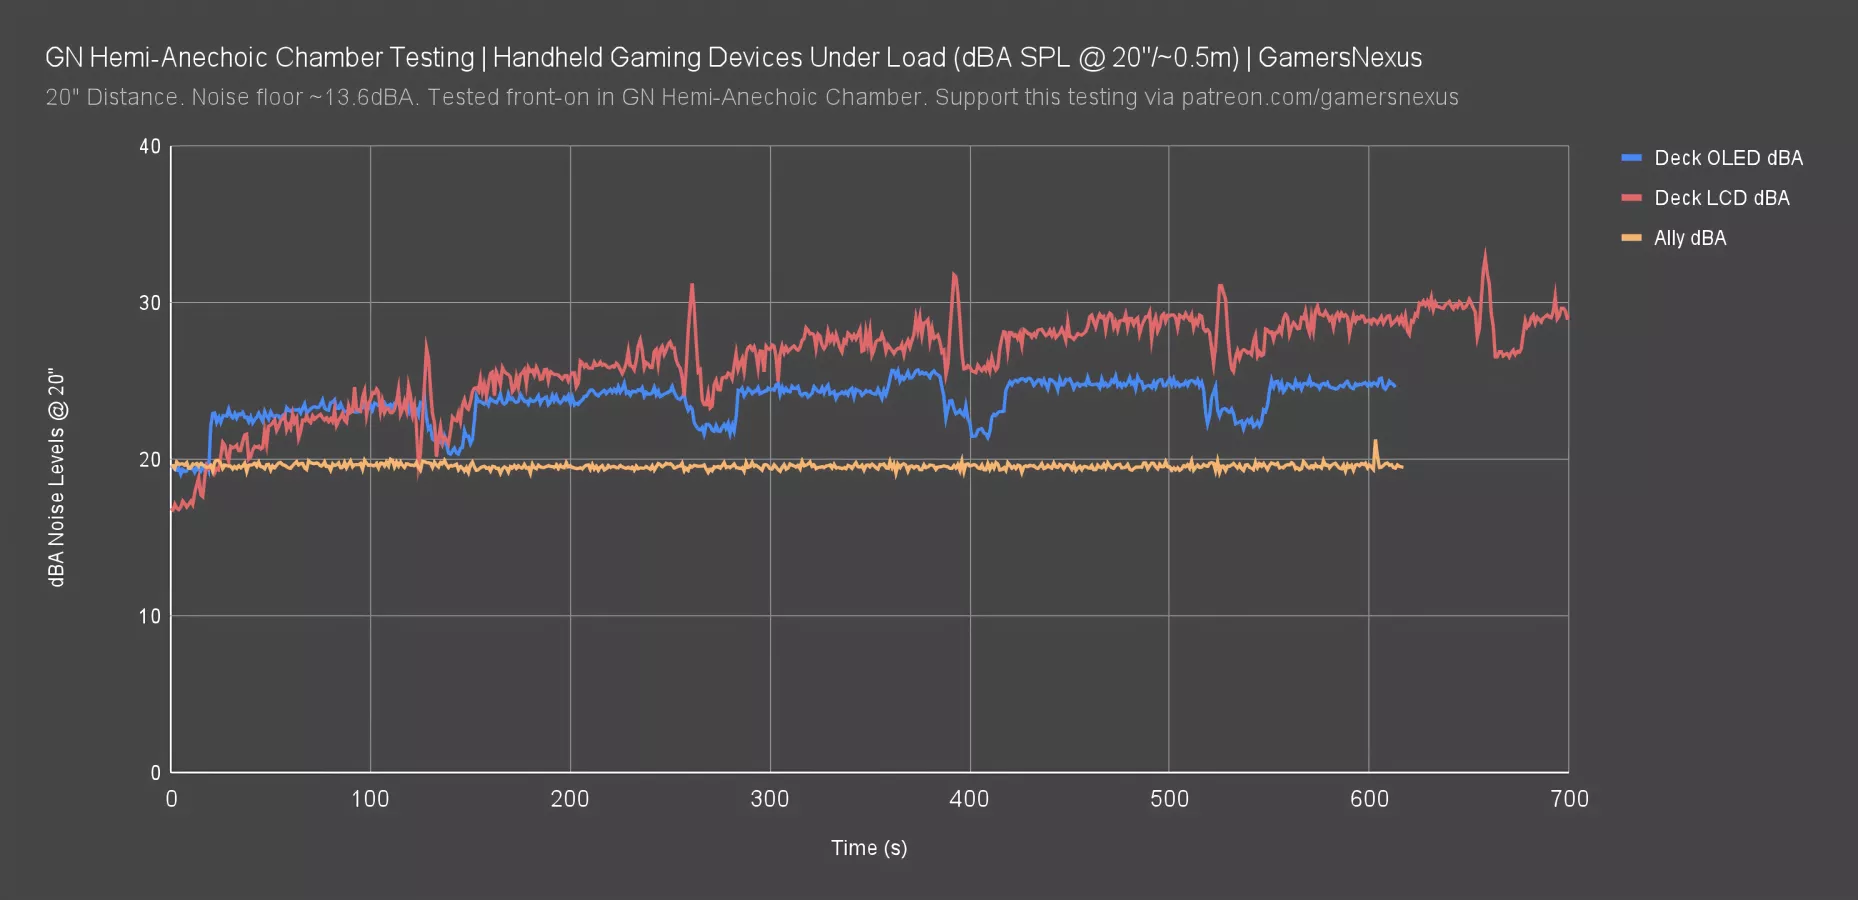
This chart looks at the noise levels over time during a 10-minute load period for all devices under test. Fans are left to their default settings.
A 100% gaming load resulted in Deck OLED fan ramp landing at about 22-23dBA at half a meter measurement distance. The dips you’re seeing are from loading screens in the workload. After the first loading screen, temperature has begun climbing enough to push RPM higher and noise levels to 24dBA, then 25dBA at the peak.
The Deck LCD climbed more gradually with a less immediate RPM ramp, but continued climbing past the OLED levels. It still has the occasional massive spike. It still briefly and violently ramps before falling: At its peak, it hits 33dBA, which is nearly a 2x increase perceived noise to the human ear over the OLED. The average is closer to 30dBA.
As for the Ally, it held a perfectly flat noise level during this particular test. Its fans are not being utilized as much as with the Deck.
Steam Deck OLED Frequency Spectrum
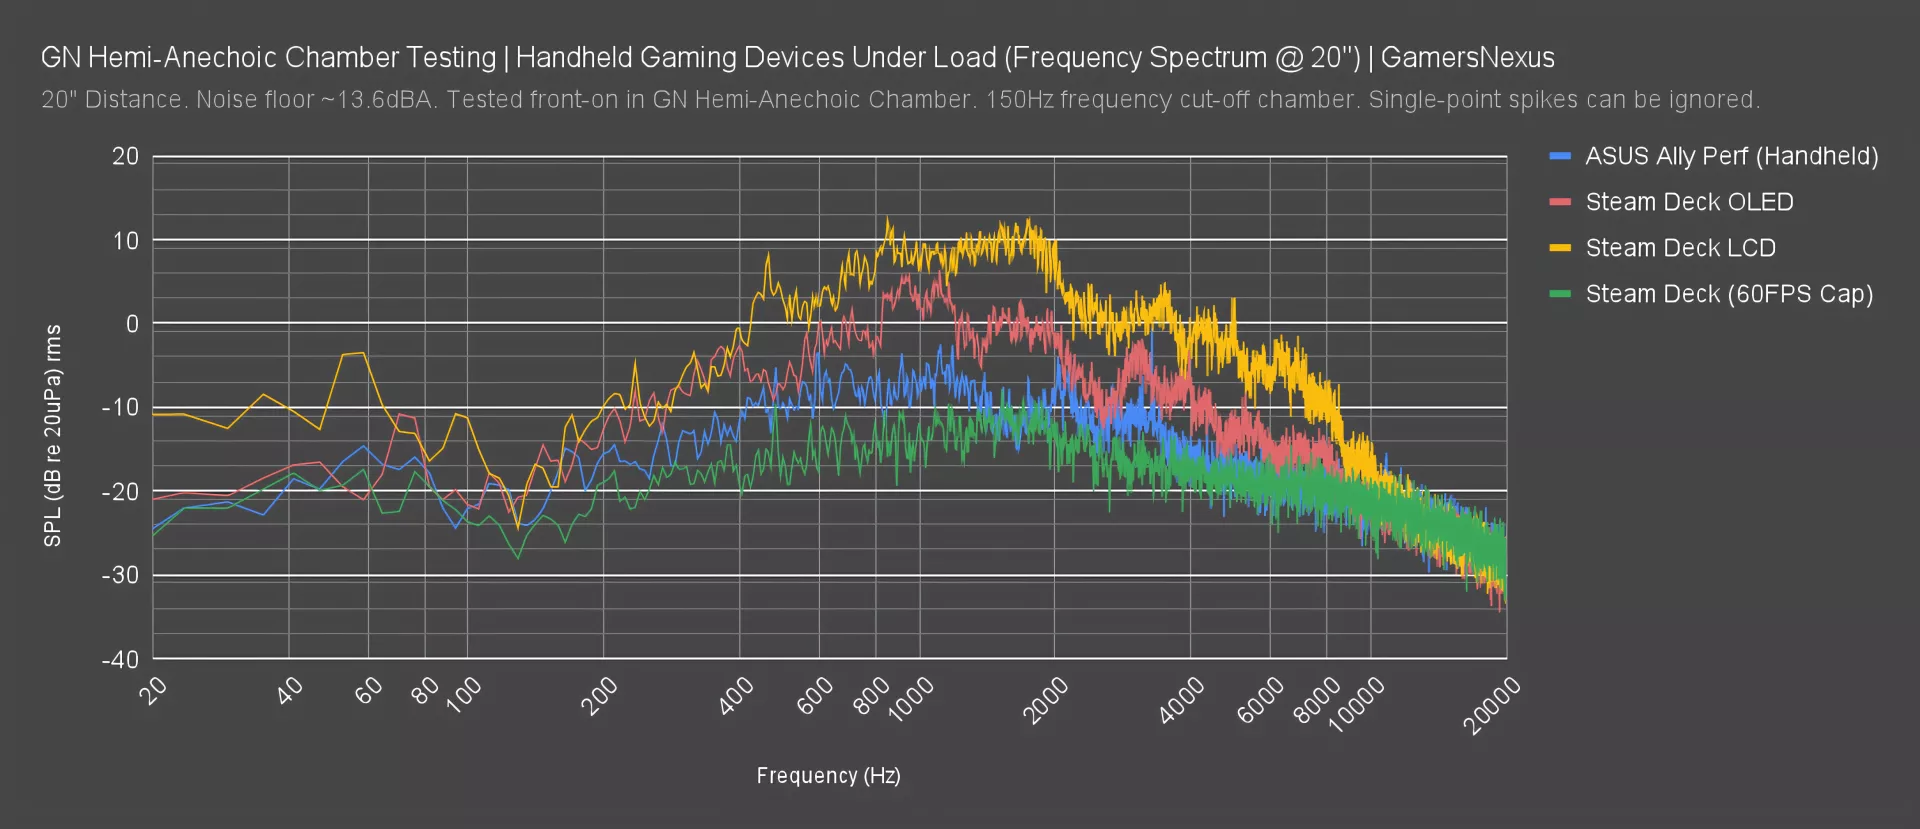
Here’s a plot of the frequency spectrum from this same test case. The Ally had its loudest range in the 500 to 1300 Hz range, with another bump around 2000-3000 Hz. The Deck OLED is louder overall, but follows a similar profile except for its bump in the 1500 to 2000 Hz range. The 800 to 1200 Hz part of the spectrum is also elevated.
The Deck LCD is significantly louder in all frequencies, with a more noticeable spike in the 1300 to 2000 Hz range when compared against the OLED. As a reminder, capping the framerate brings down the noise levels significantly -- we’ll plot that as well.
Steam Deck OLED Conclusion

In general, the OLED does reduce latencies versus the LCD, but in most cases the easiest way to reduce latency is to increase framerate, whether that means lowering settings or using more powerful hardware. If you apply any kind of framerate cap, it will increase latency. The Ally still struggles with frametime pacing in some games, but not all, and it has improved significantly in some tests versus the original launch data.
As of this writing, a brand-new Ally Z1 Extreme can be had from ASUS' official Best Buy storefront for $600, while a 512GB Steam Deck OLED costs $550 on Steam. At near-equivalent prices, the OLED's potential advantages come down to its screen, its battery, and SteamOS. After seeing the OLED panel in action, we don't strongly prefer it to the Ally's higher refresh rate and resolution. Similarly, SteamOS isn't necessarily an advantage: we like the interface, but closing Armoury Crate and launching Steam in Big Picture mode offers mostly the same experience in Windows (on the Ally), but with wider software compatibility. We don't prioritize testing with wall power in handheld reviews, but the Ally Z1 Extreme has a much higher performance ceiling than any existing Deck model when connected to wall power, with more cores and higher clocks. Check our original Ally review for more on that. If you plan to play exclusively in handheld mode, the Deck OLED does beat the Ally in terms of battery life, although both devices have settings that can be tweaked to extend playtime.
However, the specs don't take into account the drawn-out technical issues with the Ally's microSD card slot or the Deck OLED's headphone static problem through its 3.5mm audio jack. Of the two, the Ally's problem is much more serious, and we're reluctant to use the microSD card slot at all. That said, it's a little easier to swap the SSD in an Ally than it is in a Deck, and upgrading to 1TB and skipping external storage is an option.