There's no argument that RAM has become commoditized in the marketplace. This has been reinforced by furthered emphasis on appearances and the prevalence of high-capacity modules at relatively stabilized prices. DDR3 DRAM fabrication has also improved its yield steadily through the years, making high-frequency memory more abundant than ever.
As it turns out, RAM also feels like a relatively uninteresting component when selecting parts for a new system -- such is the nature of a stable product. It's similar to buying gas, in that regard; serious enthusiasts might deliberate over suppliers and octane specifications, but most users just fill up with the most convenient and affordable source. That's not to diminish the importance of quality RAM, though it does currently feel like a fairly stagnated market. Things will change in the face of DDR4.
Today we're reviewing & benchmarking
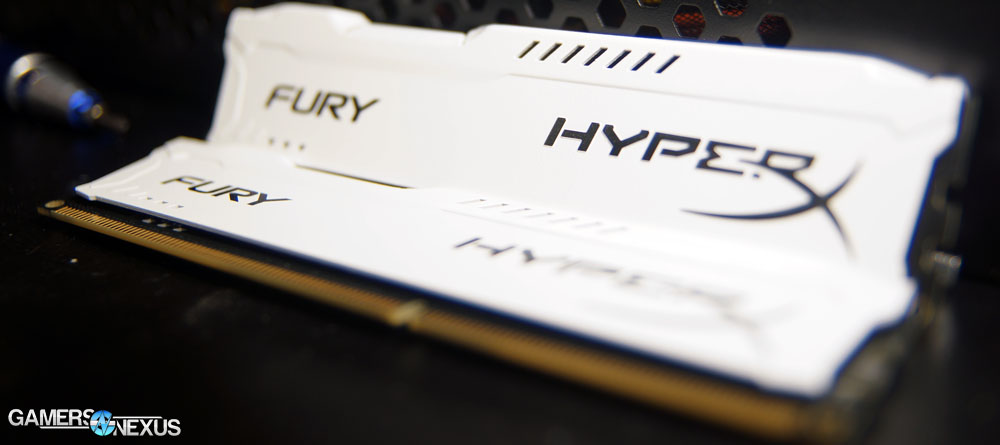
The new Fury RAM is branded as just "HyperX Fury" with no "Kingston" in the tag at all, part of the company's new direction to further differentiate the HyperX gaming business unit from its core.
HyperX Fury RAM Specs
| Density | 4GB, 8GB |
| Frequency | 1333MHz, 1600MHz, 1866MHz |
| CAS LAT | 9-9-9-27 / 10-10-10-30 |
| Voltage | 1.5v |
| MSRP | $80 for 2x4GB / 1866MHz |
Our 2x4GB DDR3-1866 kit operates with a native CAS latency of 10-10-10-30 on 1.5v. The new Fury RAM will automatically detect the host platform and adjust its frequency appropriately, meaning that no initial BIOS tweaks should be necessary to achieve the spec. Up until memory started adopting this feature, system builders had to enable XMP or manually configure clock speeds to reflect the RAM spec, as Intel's modern platforms would default the frequency to 1333MHz. Things are pretty standard beyond this feature.
Kingston HyperX Fury RAM Video Hands-On / Overview
Most Immediate Competition
The Fury's most direct competition comes from G.Skill's Ripjaws X 1866MHz CL9 RAM ($84), Sniper memory of the same spec ($85), Corsair's Vengeance Pro 2133MHz CL11 RAM ($95), and a mix of ADATA / Crucial memory in the same price range. Ultimately, all of these listed / linked options perform pretty similarly in most use cases and identically in mainstream and gaming applications. It isn't until stepping into high-clock RAM (like the provided ADATA 2800MHz unit we tested, though clocked down to 2666MHz) that we see noteworthy gains in gaming performance.
RAM Test Methodology
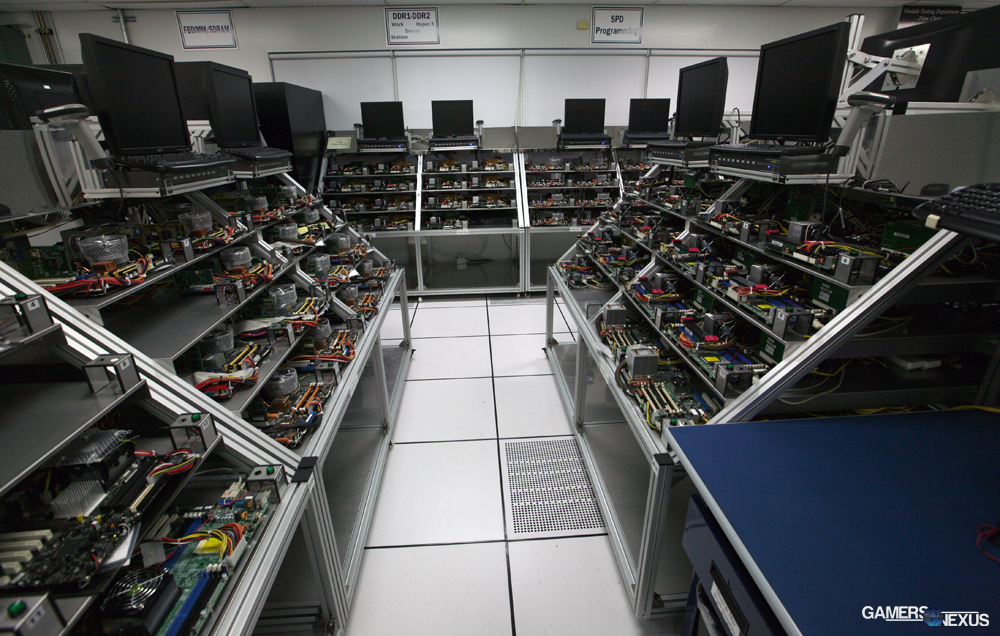 Where RAM goes to die. From our Kingston HQ tour last year.
This is pasted from our multichannel RAM benchmark, where we tested dual- vs. single-channel platform configurations.
I wrote a full-feature test case for this bench that was followed to the 't,' so each test was executed under identical conditions (beyond our one variable that changes). For trade reasons, we aren't releasing the start-to-finish test case spreadsheet, but I'll walk through most of it here. If you'd like to replicate my results, this should provide adequate tools and information to do so (please post your own below!).
Some standard benchmarking practices will go undetailed. Starting with a clean image, for instance, doesn't need much explanation.
We ran the following tools in the order they are listed:
Synethetic:
- Euler 3D.
- MaxxMem.
- Cinebench.
- Audacity LAME (honorable mention; was not significant enough to use).
Real-World
- Adobe Premiere encoding pass.
- Adobe After Effects live RAM preview pass.
- Handbrake.
Each test was conducted numerous times for parity. The shorter tests were run 5 times (Euler 3D, MaxxMem, Cinebench), the longer tests were run 3 times - because we do have publication deadlines (Handbrake, Premiere, After Effects), and the tests that produced varied results were run until we felt they were producing predictable outcomes (Cinebench). All of these were averaged into a single subset of numbers for the tables.
RAM was purged between all tests. No active memory management programs were present outside of the default, clean Windows installation.
STARS Euler 3D: CFD Simulation Performance
Euler 3D is best-used when testing CPUs and memory. The program is freely available through Casealab.
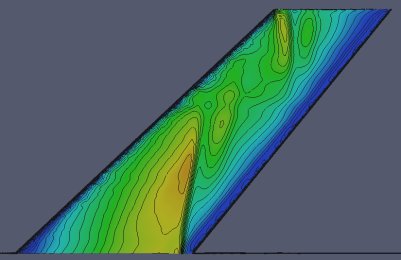 Figure 1: AGARD 445.6 Mach Contours at Mach 0.960. Source.
Euler 3D performs heavy floating-point and multi-threaded tasks that leverage resources in a similar manner to heavy-duty compiling and simulation. This is done using Computational Fluid Dynamics (CFD) and measures output "as a CFD cycle frequency in Hertz." Caselab defines their software's test sequence with great specificity, stating:
"The benchmark testcase is the AGARD 445.6 aeroelastic test wing. The wing uses a NACA 65A004 airfoil section and has a panel aspect ratio of 1.65, a taper ratio of 0.66, and a 45 degree quarter-chord sweep angle. This AGARD wing was tested at the
The benchmark CFD grid contains 1.23 million tetrahedral elements and 223 thousand nodes. The benchmark executable advances the Mach 0.50 AGARD flow solution. Our benchmark score is reported as a CFD cycle frequency in Hertz."
A lot of these words are fairly intimidating, but most of them are explaining that the test case is simulating a specific aircraft component at a specific speed. Simulation like this is a computation-intensive task that tends to demand high-speed components and multithreaded processing. CFD uses a computer model to calculate fluid flow (air, in this case). My understanding is that the test uses a complex matrix to calculate fluid flow at multiple points, then iterates (over time) with change in flow at surrounding points. Assuming this is correct, it means that we have to store values and access them upon each iteration, so RAM speed becomes important.
I should note that I'm not an expert in CFD -- not anywhere remotely close -- but after speaking with GN's resident physics engineer (Tim "Space_man" Martin), that was our educated speculation.
Regardless, you don't need to know how it works to know that a higher frequency is better. We ran the test with settings of "14 / 4," where 14 is indicative of the count of passes and 4 is the active thread-count.
A higher frequency rating is better in this test.
Anyone performing simulation or computation-intensive compiling tasks will benefit from these numbers; if you're in these categories, use this benchmark to judge how much multi-channeling matters to you.
MaxxMem: Memory Copy, Read, Write, Latency, & Bandwidth Performance
MaxxMem is another synthetic test. I won't spend as much time here since it's a bit easier to understand.
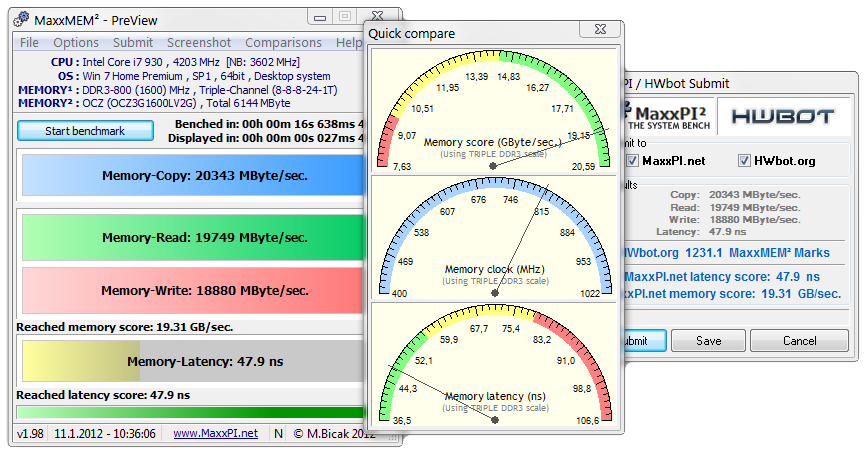 NOTE: These aren't our results. Just a program screenshot.
MaxxMem tests memory bandwidth by writing to and reading from memory blocks that are sized in powers of 2, starting at 16MB and scaling up to 512MB. MaxxMem executes numerous passes and averages the result, though we did our own multiple passes to ensure accuracy. MaxxMem attempts to address CPU cache pollution concerns upon reads/writes, which can become a problem with some real-world tests that will skew results if improperly tested. The test uses "an aggressive data prefetching algorithm" to test theoretical bandwidth caps during read/writes.
Handbrake & Cinebench
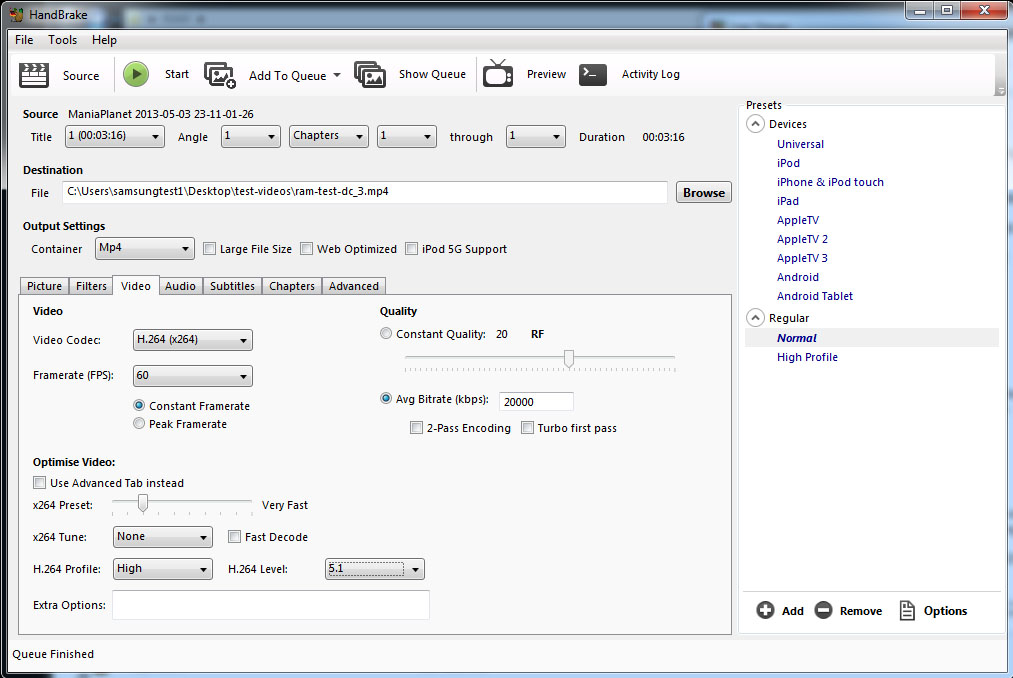
These just get quick mentions. Handbrake is a multithreaded transcoding program that has one video format / codec as input and another as output. We put a 9GB AVI recorded with FRAPS into Handbrake and spat out an h.264 (5.1 high profile @ 1080) MP4 at a continuous 60FPS with a 20Mbps datarate. In theory, this is CPU- and memory-intensive and will see the benefits of faster memory.
Cinebench is a pretty fun synthetic test to use. We relied upon the OpenGL benchmark, since that was the only one that would have any amount of impact from RAM differences. It runs a video and logs the FPS - pretty straight-forward stuff. This is more dependent upon the GPU and CPU than anything, but had some RAM variability.
Impact of Memory Speed on Adobe After Effects Live Preview & Premiere Encoding
I'm responsible for maintaining our entire YouTube channel here at GamersNexus (and do a good deal of hobbyist mountain bike video editing in my free time), so the video editing tests were of most interest to me. Premiere is an easy one, the test settings consisted of:
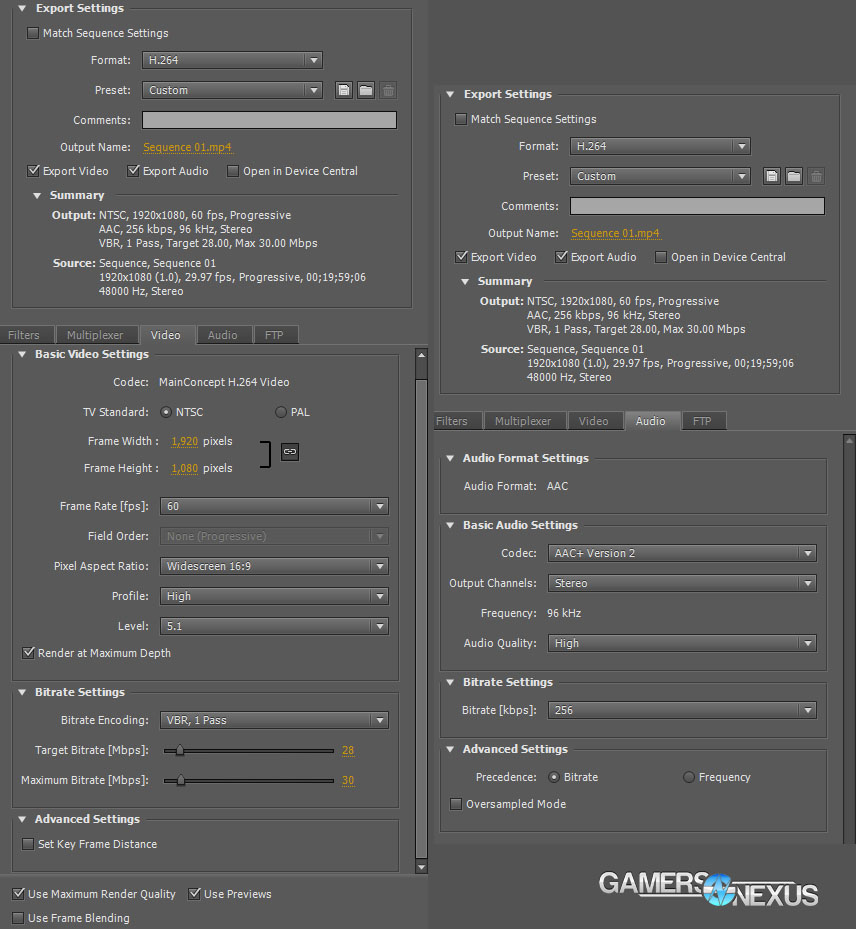
We rendered out a complex 10s clip that featured four 1080@60p videos shot at 24- & 28Mbps. The clips had color correction and other post-processing effects applied and were rendered at maximum depth.
To test the performance of memory configurations with After Effects, we put together another 4x1080@60p set of videos (down-scaled into quadrants) at 20-28Mbps. Two of the videos had color and exposure correction effects applied. We then previewed the video with RAM (RAM Preview) to check for RAM Preview stuttering or low framerates (expected). A video camera was set up to monitor the RAM Preview info panel for live FPS metrics. We used an external video camera so the results would be independent of the screen capture. You can view the test in video form on page 1.
Testing Platform
We have a brand new test bench that we assembled for the 2013-2014 period! Having moved away from our trusty i7-930 and GTX 580, the new bench includes the below components:
| GN Test Bench 2013 | Name | Courtesy Of | Cost |
| Video Card | NVIDIA GTX 780 Ti | NVIDIA | ~$780 |
| CPU | Intel i5-3570k CPU | GamersNexus | ~$220 |
| Memory | HyperX Fury 2x4GB 1866MHz ADATA XPG 2x4GB 2800MHz Corsair Vengeance Pro 1866MHz | ADATA Corsair Kingston Tech. | Varies |
| Motherboard | MSI Z77A-GD65 OC Board | GamersNexus | ~$160 |
| Power Supply | NZXT HALE90 V2 | NZXT | Pending |
| SSD | Kingston 240GB HyperX 3K SSD | Kingston Tech. | ~$205 |
| Optical Drive | ASUS Optical Drive | GamersNexus | ~$20 |
| Case | NZXT Phantom 820 | NZXT | ~$220 |
| CPU Cooler | Thermaltake Frio Advanced Cooler | Thermaltake | ~$60 |
For this test, the CPU was configured at 4.2GHz (instead of our usual 4.4GHz) with a vCore of 1.265V.
Continue to page 2 for the benchmark results.
Maxx Mem Benchmark: HyperX Fury vs. Vengeance Pro, ADATA XPG
Pre-overclock, our Maxx Mem copy results expectedly place ADATA's 2666MHz XPG memory at the top, though the closest competing kit is Corsair's Vengeance Pro model. Disparity between the HyperX Fury and Vengeance Pro kits is within margin of error and should be regarded as identical for this benchmark.
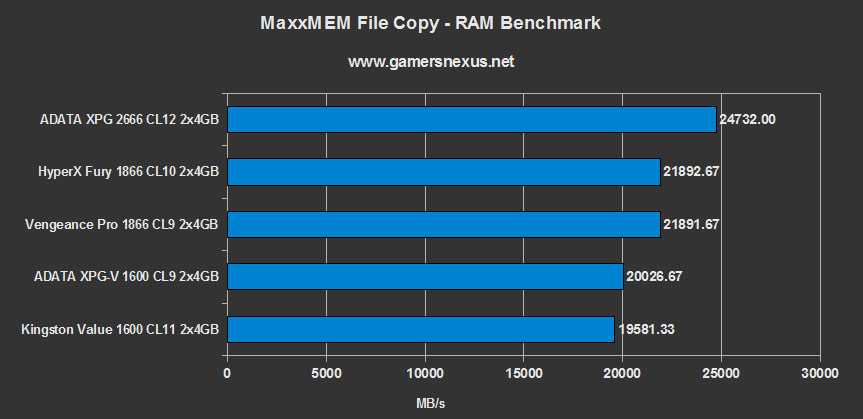
The memory copy benchmark represents maximum throughput of the memory when performing file copy transactions.
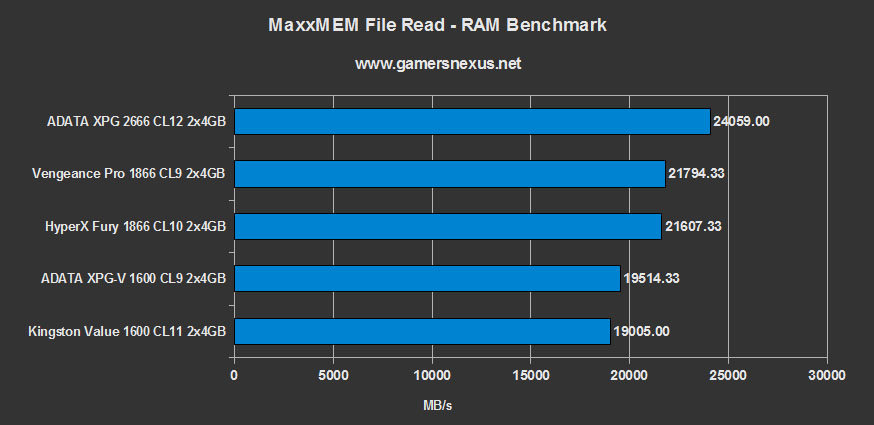
Looking at read speeds (file read), similar results are presented with the exception of the Vengeance Pro memory marginally outranking the Fury kit. The results thus far are relatively uninteresting, beyond the high performance exhibited by ADATA's kit.
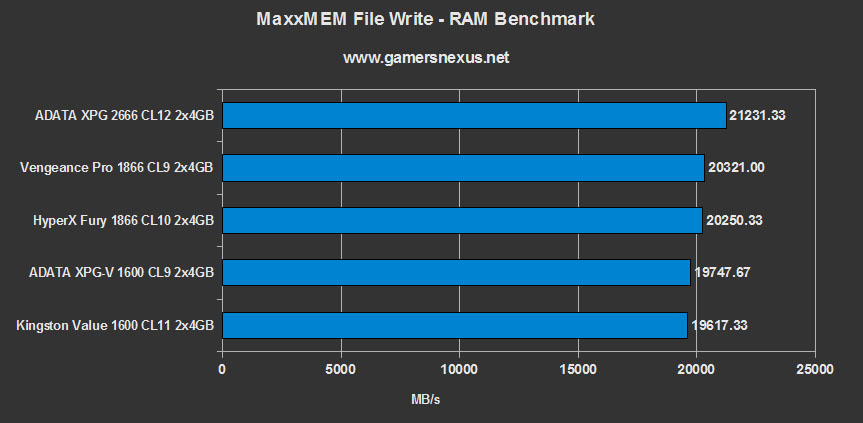
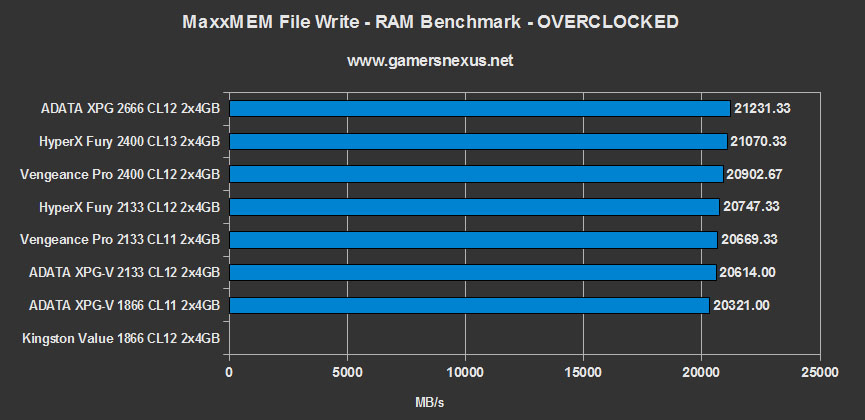
Memory write is our next chart. Once again, it goes ADATA, Corsair, and then HyperX in the standings; the differential between the Vengeance and HyperX products is close enough to be regarded as irrelevant. Selecting either of these kits based on price would be the way to go thus far, though things will change as we progress through the real-world tests.
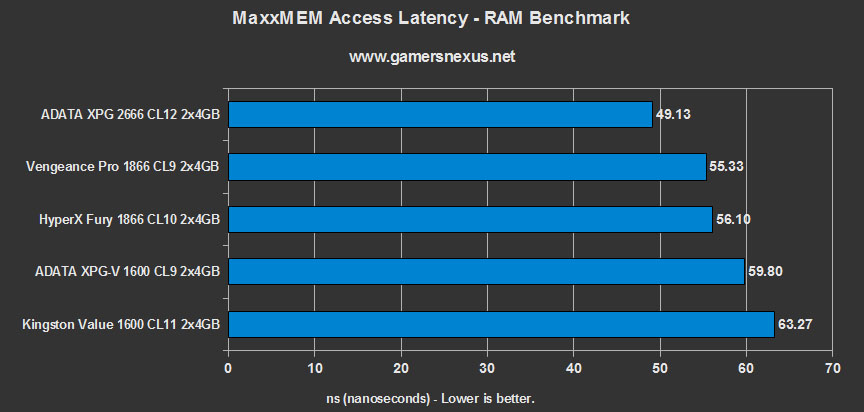
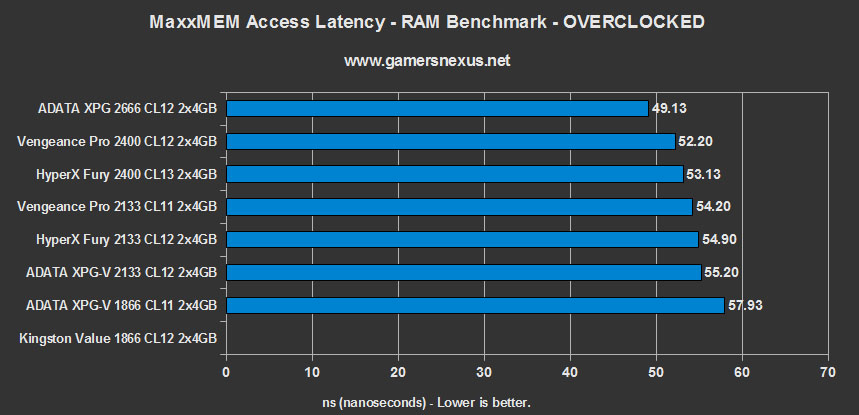
Latency is the last item tested by Maxx Mem, representing the time in nanoseconds between transactions (lower is better). Somewhat surprisingly, ADATA's high-performing memory retains an exceptionally low latency given the RAM spec. The HyperX Fury, low-end ADATA unit, and Vengeance Pro are all within spitting distance of one another. HyperX and Corsair are neck-and-neck for latency.
Maxx Mem Overclocked Benchmark Results
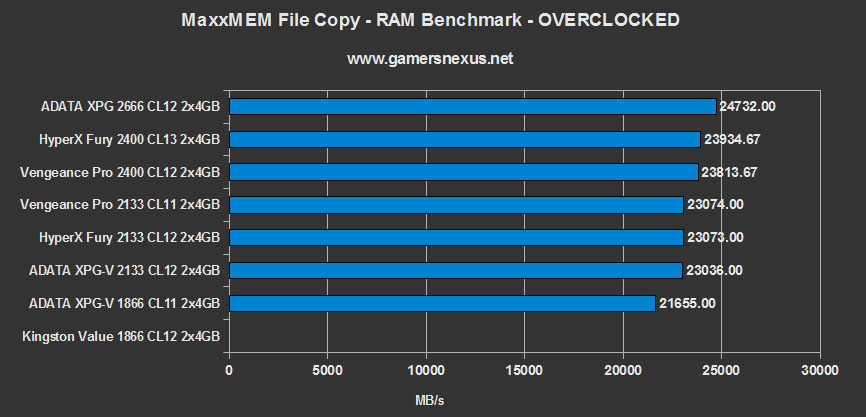
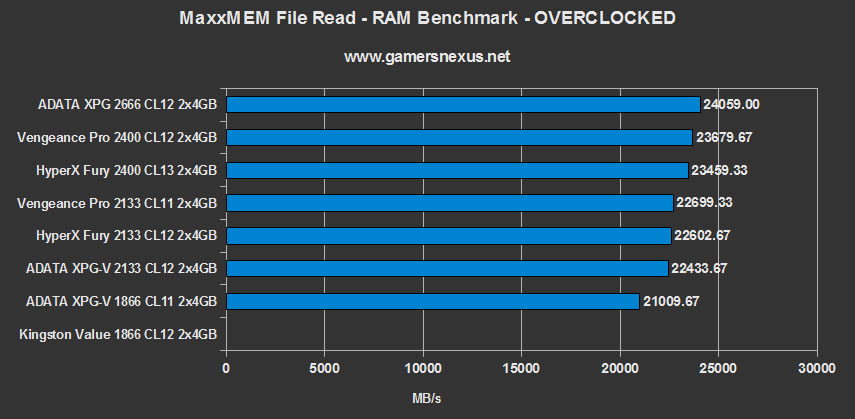
Overclocking all the modules saw mirrored results to the stock clock performance above.
Euler 3D CFD Benchmark
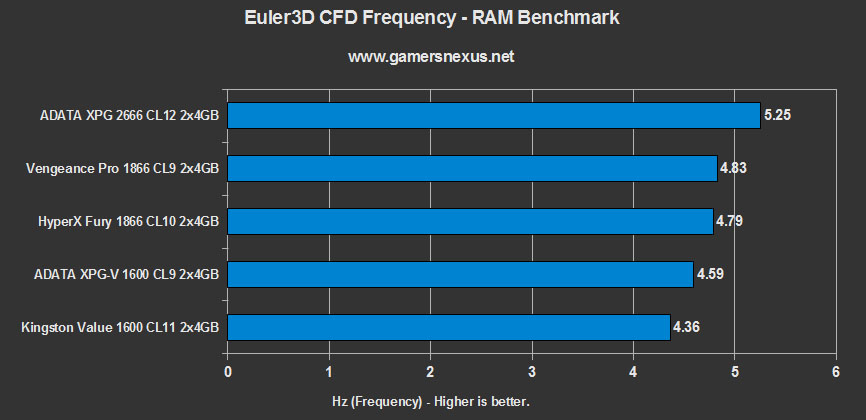
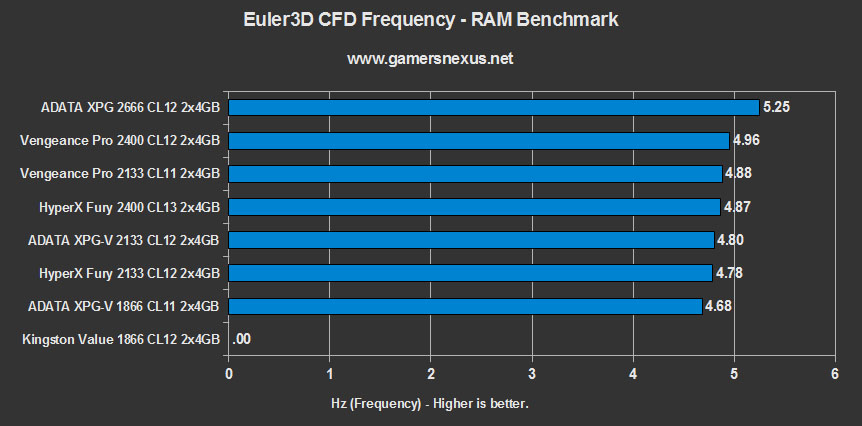
Testing computational fluid dynamics performance gives a look inside of the memory's under-load capabilities. Using Euler 3D, we found that -- once again -- ADATA's very expensive memory stands at the top. Among closer competitors, the Fury memory is just barely edged out by Corsair's Vengeance Pro line. This remains true in the overclocking results.
Cinebench Average FPS / OpenGL Performance
Although our games testing was tossed out due to identical results, Cinebench shows some disparity between products. Testing memory using games is tough; most games will not be memory-bound in any capacity, instead deferring to the GPU and CPU for FPS output. We saw marginal advantages between 1600MHz ADATA value RAM and the faster 1866 Vengeance and Fury RAM, and somewhat noteworthy gains between 1866MHz and 2666MHz.
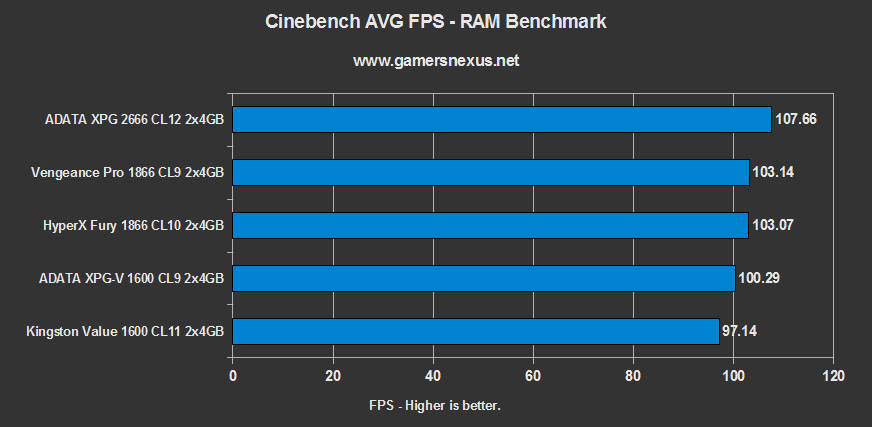
These results are mirrored in some games in the real world, though generally it's within margin of error and ends up being a flat-line chart. Formula 1 2012 is one of the few games that sees large gains in FPS from memory, but we've opted not to test this since it seems more like a benchmark of F1 and not the memory (being the only game I've found with such a response).
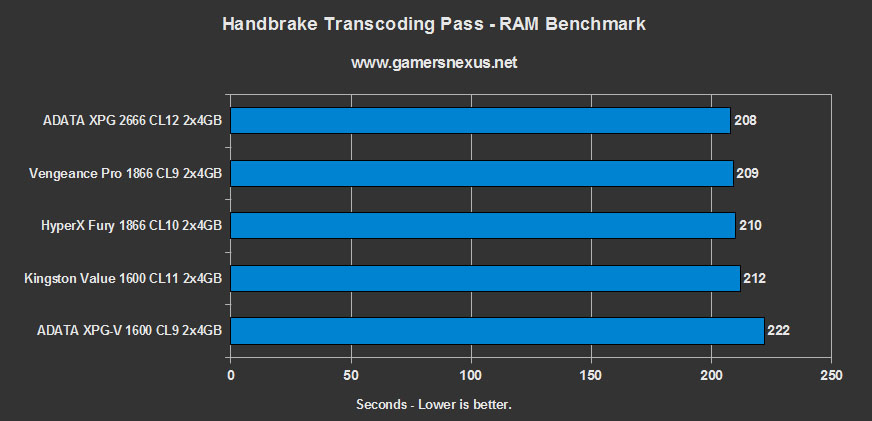
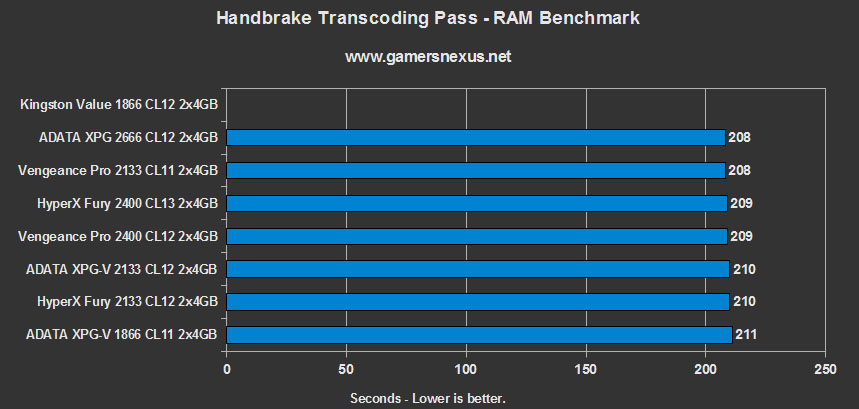
Real World Tests - Handbrake
Handbrake provides an indicator of memory performance in more intensive, real-world applications -- like video transcoding and encoding x.264 files. The test results show the top three performers -- ADATA's high-end kit, Corsair's Vengeance Pro, and the HyperX Fury memory -- are all within margin of error of each other. The XPG value and
Adobe Premiere x264 High-Bitrate Encoding Pass
This in-house test renders-out a high-bitrate media file using Adobe's media encoder, pushed through Premiere. This test is as real-world as it gets, reflecting tasks we perform regularly for the site's YouTube channel. The results showed the HyperX Fury memory trailing in stock frequency performance, but leading the pack in overclocked performance. I suspect that the CAS timings had more impact on performance in encoding, hence the drop in ADATA's ranking.
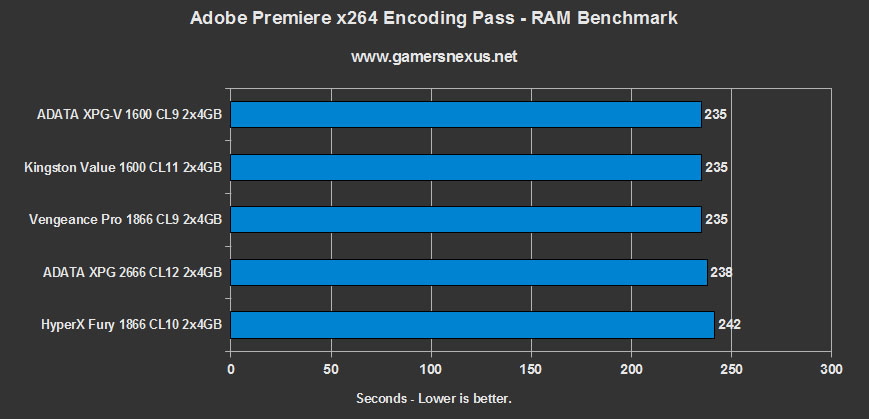
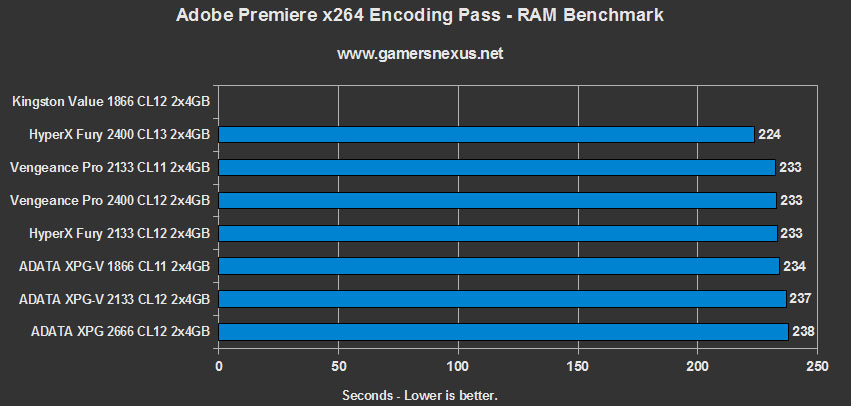
Whether or not such a difference matters to you will hinge upon how many hours you spend rendering videos.
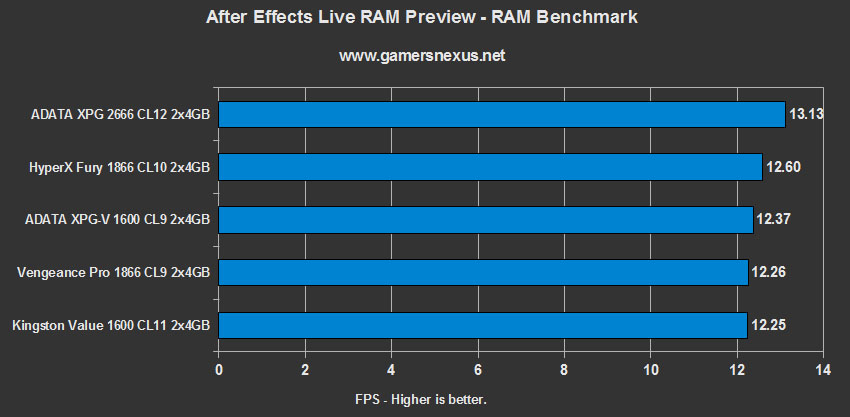
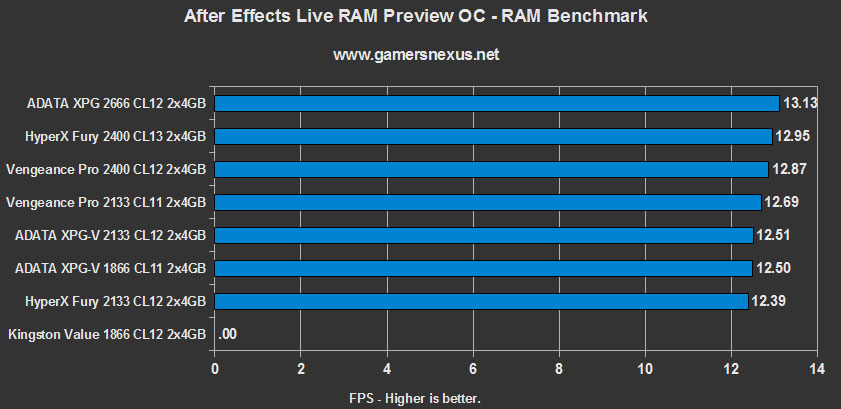
After Effects RAM Preview AVG FPS
After Effects is a leading real-world tool insofar as memory consumption. By using the RAM preview function, AE loads the entire video into memory to reduce hits to storage and streamline FX previewing. The results are admittedly rather boring, with everything landing between 12 and 13FPS, the exception being ADATA's $200 kit of 2666MHz RAM.
Conclusion
RAM is still a rather uninteresting subject, and no DDR3 kits are going to change that right now. The Fury memory doesn't exhibit obscene performance anywhere and seems to be at a minimum on-par with competition, if not slightly better than it. This combined with the color choices -- and honestly, that is a driving force in selection right now -- makes the Fury RAM a reasonable recommendation for new system builds. I can't really find anything "wrong" with it, it looks good, performs as expected, and beats competitors by a few bucks depending on how the wind blows that morning.
As for the subjective, aesthetics stuff, I'm a big fan of the matte white color -- it looks excellent with the white H440 we reviewed.
If you need help in selecting RAM for your build (or other parts), leave a post in our forums!
- Steve "Lelldorianx" Burke.