AMD’s RX 560 continues a trend of refreshing the Polaris line, but with a more notable change than the previous RX 580RX 570 refreshes: The RX 560 fully unlocks itself to 16 CUs, up from the previous 14 CUs of the RX 460. This change (in addition to voltage-frequency changes) instantly accounts for performance increases over the RX 460, theoretically making for a more exciting update than was had with the 580 & 570. That’s not to say that the predecessors of this 500 line were unworthy, but they certainly weren’t eye-catching for anyone who’d followed the 400-series launch.
Our review of the Sapphire RX 560 Pulse OC 4GB ($115) card is the first look at this new low-end line from AMD, updating the entry-level, sub-$120 market (in theory) with fresh competition. The incumbent would be the GTX 1050, which we previously thought a better buy than the RX 460. Today, we’re seeing how that’s changed in seven months.
To catch everyone up on the RX 500 refresh thus far, it’s mostly been a glorified BIOS update to the RX 580 and RX 570 cards, driving higher frequency, permitting higher voltage under OV, and trading more power for some performance. Nothing special, but enough to keep AMD in the game until its eventual Vega launch. We found the RX 580 to be a strong competitor to the GTX 1060, particularly at the price point, though noted that owners of RX 480 series cards shouldn’t bother considering an upgrade – because it’s not one. This 500 series is not meant for owners of the 400 series. Tune out until Vega, Volta, or high-end Pascal makes sense.
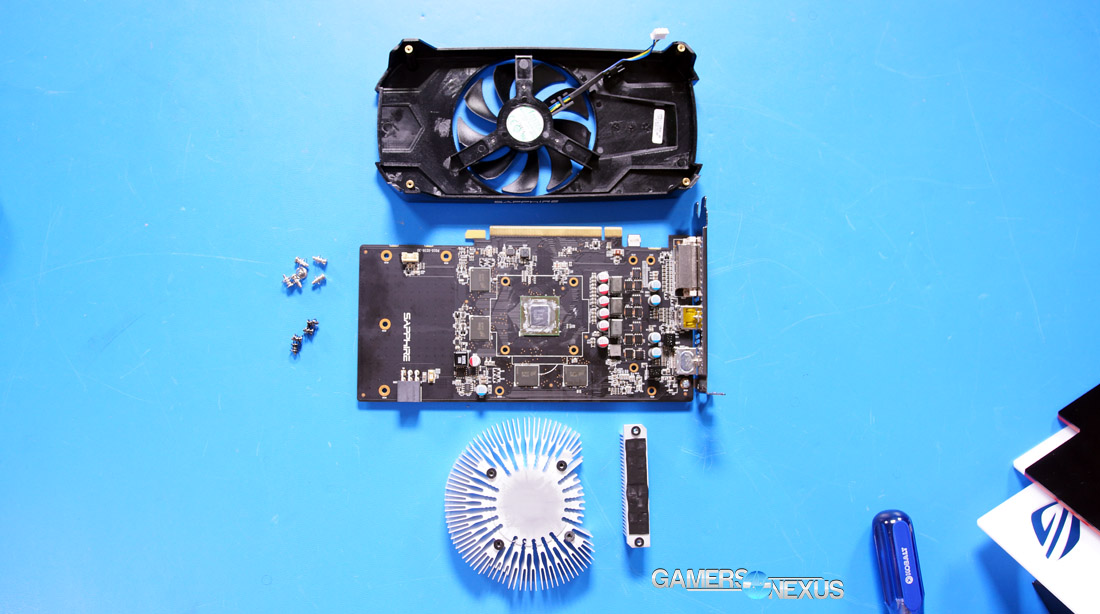
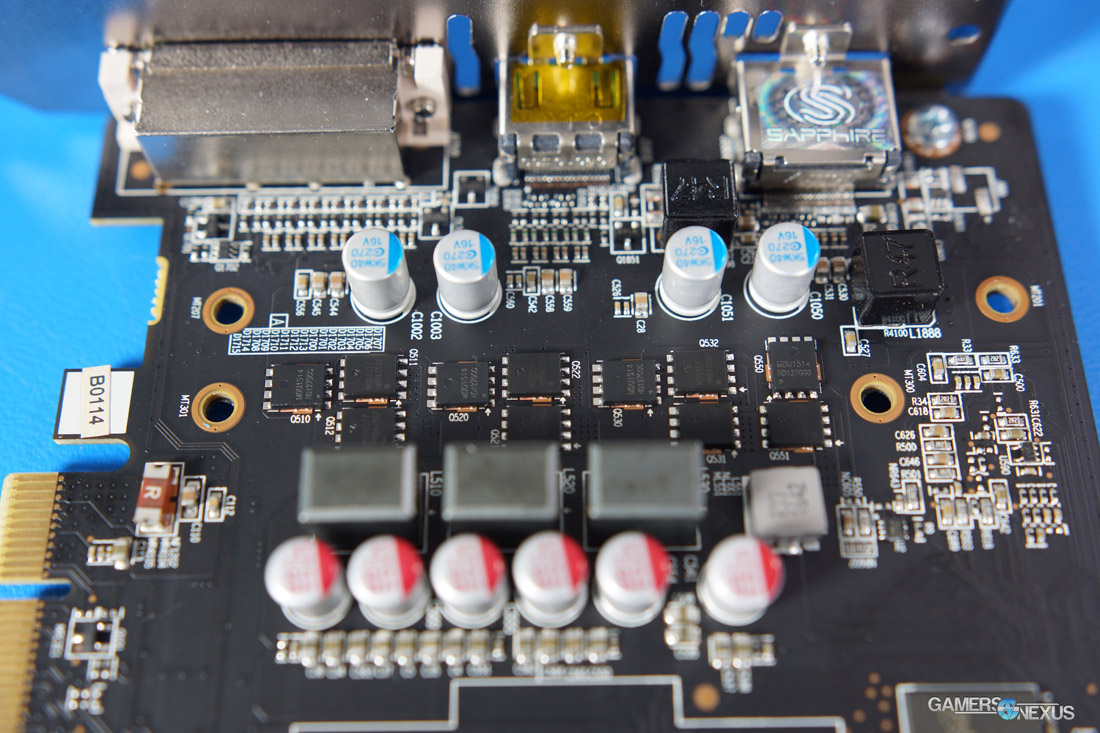
Sapphire’s RX 560 Pulse OC has one of the weakest cooling solutions we’ve seen of late, but – as we learn in our VRM+VRAM temperature testing – it’s sufficient for this type of card. A low-end GPU doesn’t draw much power, and so Sapphire skates by with its MagnaChip Semiconductor MDU1514 + MDU1517 3-phase power design.
As this content is relatively straight-forward, given the low price, let’s dive straight into testing.
Here's the overclock stepping chart for our RX 560, reflecting the "OC" version in our charts:
| Peak Clock (MHz) | AVG Clock (MHz) | Core Offset (MHz) | MEM CLK (MHz) | MEM Offset (MHz) | MEM mV | Power Target % | mV | Fan | TMP | Pass/Fail |
| 1298 | 1277 | 0 | 1750 | 0 | Auto | 100 | 1100 | 1200 | 69 | P |
| 1300 | 1300 | 0 | 1750 | 0 | Auto | 175 | 1100 | 1600 | 79 | P |
| 1319 | 1319 | 20 | 1750 | 0 | Auto | 175 | 1150 | 2900 | 77 | P |
| 1329 | 1329 | 30 | 1750 | 0 | Auto | 175 | 1150 | 2900 | 77 | P |
| 1339 | 1339 | 40 | 1750 | 0 | Auto | 175 | 1150 | 2900 | 77 | P |
| 1349 | 1349 | 50 | 1750 | 0 | Auto | 175 | 1150 | 2900 | 77 | P |
| 1359 | 1359 | 60 | 1750 | 0 | Auto | 175 | 1150 | 2900 | 77 | P |
| 1369 | 1369 | 70 | 1750 | 0 | Auto | 175 | 1150 | 2900 | 77 | P |
| 1379 | 1379 | 80 | 1750 | 0 | Auto | 175 | 1150 | 2900 | 77 | P |
| 1389 | 1389 | 90 | 1750 | 0 | Auto | 175 | 1150 | 2900 | 77 | P |
| 1399 | 1399 | 100 | 1750 | 0 | Auto | 175 | 1150 | 2900 | 77 | P |
| 1419 | 1419 | 120 | 1750 | 0 | Auto | 175 | 1150 | 2900 | 78 | P |
| 1439 | 1439 | 140 | 1750 | 0 | Auto | 175 | 1150 | 2900 | 79 | P |
| 1459 | 1459 | 160 | 1750 | 0 | Auto | 175 | 1150 | 3200 | 79 | F - Heavy Flickering |
| 1449 | 1449 | 150 | 1750 | 0 | Auto | 175 | 1150 | 3200 | 78 | Flickering |
| 1439 | 1439 | 140 | 1750 | 0 | Auto | 175 | 1150 | 3200 | 79 | P |
| 1439 | 1439 | 140 | 1900 | 150 | Auto | 175 | 1150 | 3200 | 78 | P |
| 1439 | 1439 | 140 | 1950 | 200 | Auto | 175 | 1150 | 3200 | 78 | P |
| 1439 | 1439 | 140 | 2000 | 250 | Auto | 175 | 1150 | 3200 | 78 | P |
And for the GTX 1050:
| Peak Clock (MHz) | AVG Clock (MHz) | Core Offset (MHz) | MEM CLK (MHz) | MEM Offset (MHz) | Power Target | Voltage | Fan | TMP | Pass/Fail |
| 1797 | 1734 | 0 | 1752 | 0 | 100 | 1.03 | 41 | 57 | P |
| 1823 | 1810 | 100 | 1752 | 0 | 100 | 1.03 | 70 | 58 | P |
| 1873 | 1848 | 150 | 1752 | 0 | 100 | 1.03 | 70 | 58 | P |
| 1987 | - | 175 | 1752 | 0 | 100 | 1.03 | 70 | 58 | F |
| 1886 | 1860 | 160 | 1752 | 0 | 100 | 1.03 | 70 | 58 | P |
| 1886 | 1860 | 160 | 1902 | 300 | 100 | 1.03 | 70 | 58 | P |
| 1886 | 1860 | 160 | 1952 | 400 | 100 | 1.03 | 70 | 58 | P |
| 1886 | 1860 | 160 | 2027 | 550 | 100 | 1.03 | 70 | 58 | P |
GPU Testing Methodology
For our benchmarks today, we’re using a fully rebuilt GPU test bench for 2017. This is our first full set of GPUs for the year, giving us an opportunity to move to an i7-7700K platform that’s clocked higher than our old GPU test bed. For all the excitement that comes with a new GPU test bench and a clean slate to work with, we also lose some information: Our old GPU tests are completely incomparable to these results due to a new set of numbers, completely new testing methodology, new game settings, and new games being tested with. DOOM, for instance, now has a new test methodology behind it. We’ve moved to Ultra graphics settings with 0xAA and async enabled, also dropping OpenGL entirely in favor of Vulkan + more Dx12 tests.
We’ve also automated a significant portion of our testing at this point, reducing manual workload in favor of greater focus on analytics.
Driver version 378.78 (press-ready drivers for 1080 Ti, provided by nVidia) was used for all nVidia devices. Version 17.10.1030-B8 was used for AMD (press drivers).
A separate bench is used for game performance and for thermal performance.
Thermal Test Bench
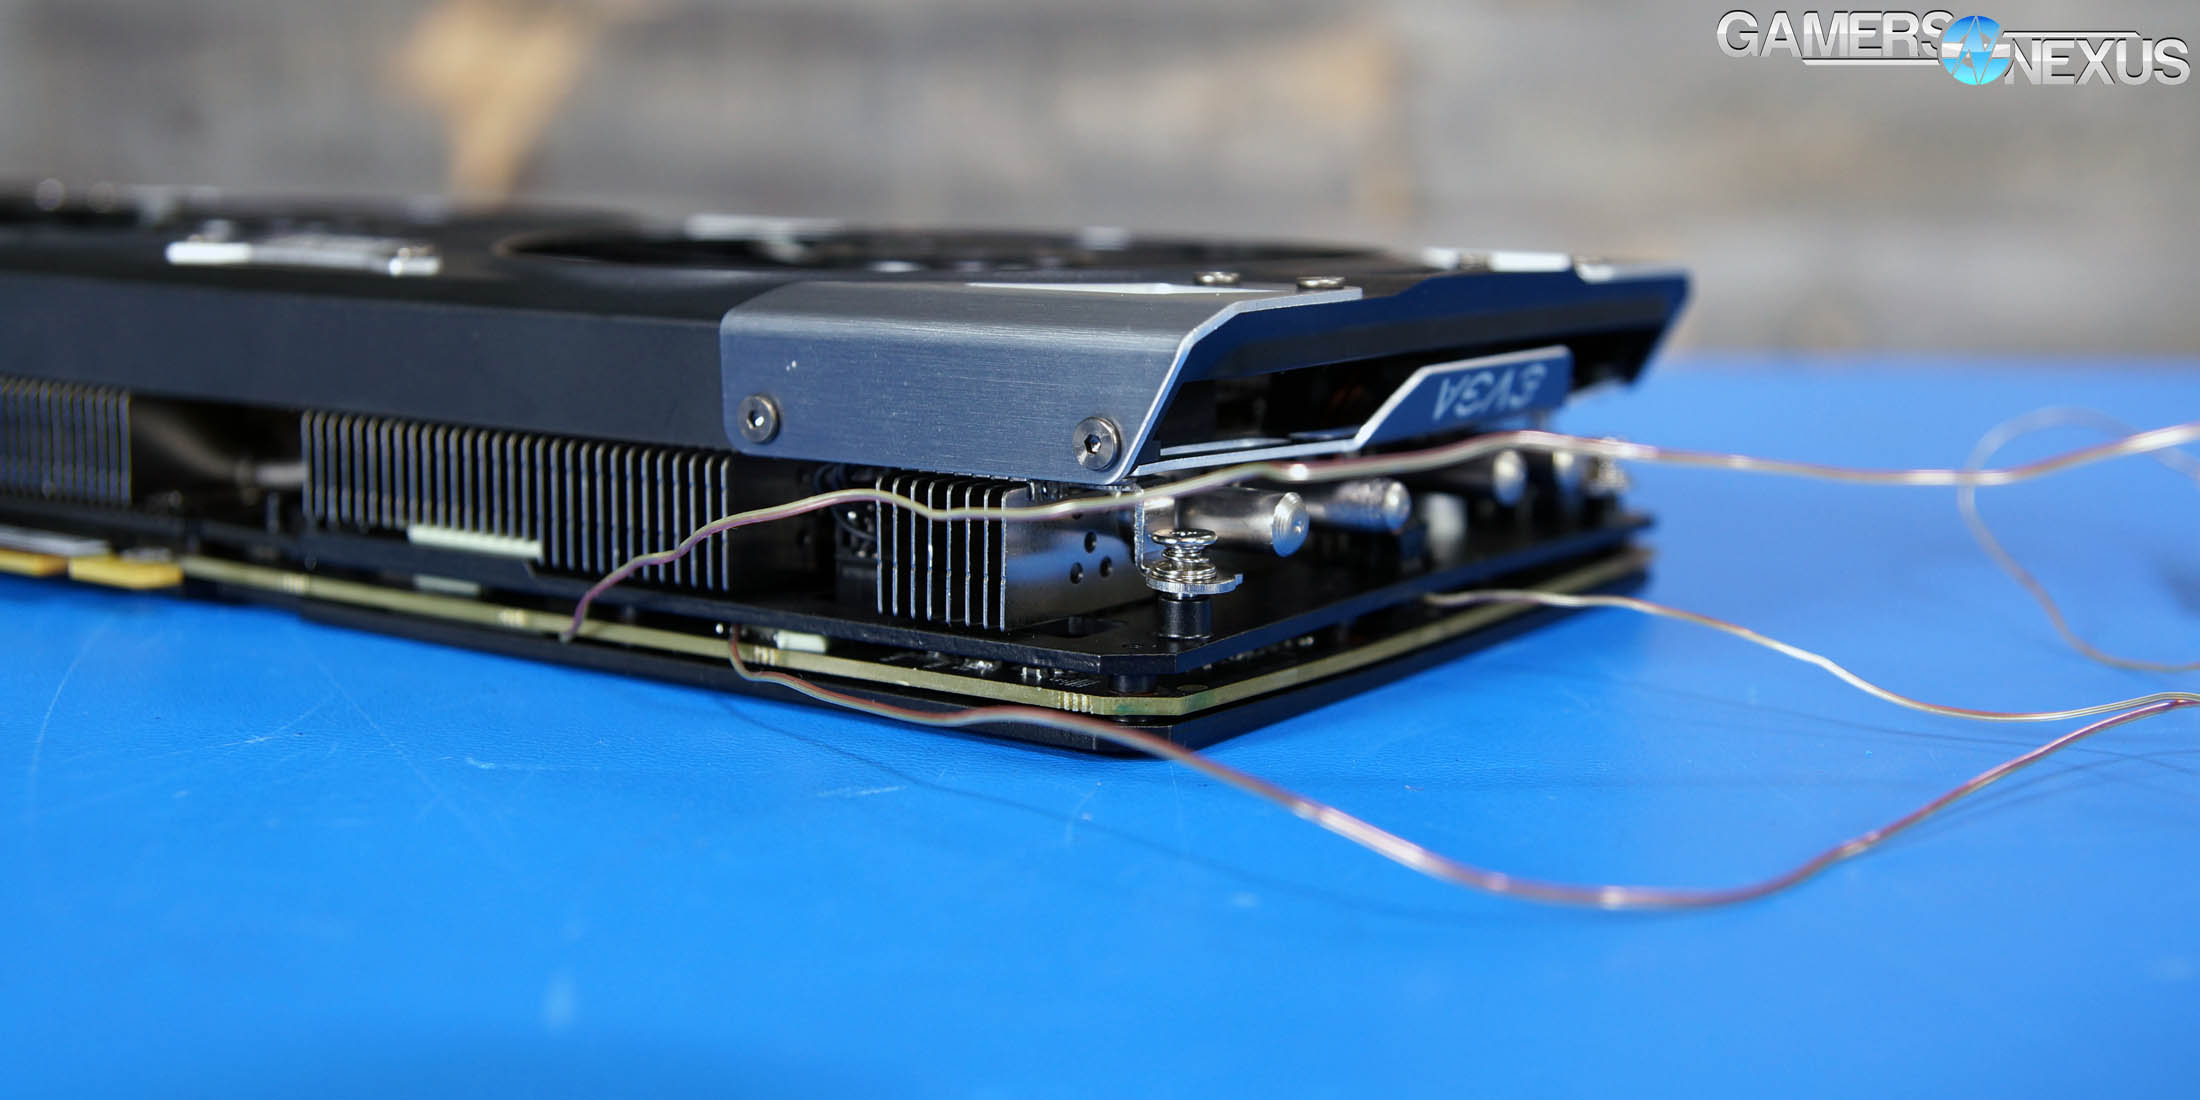
Our test methodology for the is largely parallel to our EVGA VRM final torture test that we published late last year. We use logging software to monitor the NTCs on EVGA’s ICX card, with our own calibrated thermocouples mounted to power components for non-ICX monitoring. Our thermocouples use an adhesive pad that is 1/100th of an inch thick, and does not interfere in any meaningful way with thermal transfer. The pad is a combination of polyimide and polymethylphenylsiloxane, and the thermocouple is a K-type hooked up to a logging meter. Calibration offsets are applied as necessary, with the exact same thermocouples used in the same spots for each test.
Torture testing used Kombustor's 'Furry Donut' testing, 3DMark, and a few games (to determine auto fan speeds under 'real' usage conditions, used later for noise level testing).
Our tests apply self-adhesive, 1/100th-inch thick (read: laser thin, does not cause "air gaps") K-type thermocouples directly to the rear-side of the PCB and to hotspot MOSFETs numbers 2 and 7 when counting from the bottom of the PCB. The thermocouples used are flat and are self-adhesive (from Omega), as recommended by thermal engineers in the industry -- including Bobby Kinstle of Corsair, whom we previously interviewed.
K-type thermocouples have a known range of approximately 2.2C. We calibrated our thermocouples by providing them an "ice bath," then providing them a boiling water bath. This provided us the information required to understand and adjust results appropriately.
Because we have concerns pertaining to thermal conductivity and impact of the thermocouple pad in its placement area, we selected the pads discussed above for uninterrupted performance of the cooler by the test equipment. Electrical conductivity is also a concern, as you don't want bare wire to cause an electrical short on the PCB. Fortunately, these thermocouples are not electrically conductive along the wire or placement pad, with the wire using a PTFE coating with a 30 AWG (~0.0100"⌀). The thermocouples are 914mm long and connect into our dual logging thermocouple readers, which then take second by second measurements of temperature. We also log ambient, and apply an ambient modifier where necessary to adjust test passes so that they are fair.
The response time of our thermocouples is 0.15s, with an accompanying resolution of 0.1C. The laminates arae fiberglass-reinforced polymer layers, with junction insulation comprised of polyimide and fiberglass. The thermocouples are rated for just under 200C, which is enough for any VRM testing (and if we go over that, something will probably blow, anyway).
To avoid EMI, we mostly guess-and-check placement of the thermocouples. EMI is caused by power plane PCBs and inductors. We were able to avoid electromagnetic interference by routing the thermocouple wiring right, toward the less populated half of the board, and then down. The cables exit the board near the PCI-e slot and avoid crossing inductors. This resulted in no observable/measurable EMI with regard to temperature readings.
We decided to deploy AIDA64 and GPU-Z to measure direct temperatures of the GPU and the CPU (becomes relevant during torture testing, when we dump the CPU radiator's heat straight into the VRM fan). In addition to this, logging of fan speeds, VID, vCore, and other aspects of power management were logged. We then use EVGA's custom Precision build to log the thermistor readings second by second, matched against and validated between our own thermocouples.
The primary test platform is detailed below:
| GN Test Bench 2015 | Name | Courtesy Of | Cost |
| Video Card | This is what we're testing | - | - |
| CPU | Intel i7-5930K CPU 3.8GHz | iBUYPOWER | $580 |
| Memory | Corsair Dominator 32GB 3200MHz | Corsair | $210 |
| Motherboard | EVGA X99 Classified | GamersNexus | $365 |
| Power Supply | NZXT 1200W HALE90 V2 | NZXT | $300 |
| SSD | OCZ ARC100 Crucial 1TB | Kingston Tech. | $130 |
| Case | Top Deck Tech Station | GamersNexus | $250 |
| CPU Cooler | Asetek 570LC | Asetek | - |
Note also that we swap test benches for the GPU thermal testing, using instead our "red" bench with three case fans -- only one is connected (directed at CPU area) -- and an elevated standoff for the 120mm fat radiator cooler from Asetek (for the CPU) with Gentle Typhoon fan at max RPM. This is elevated out of airflow pathways for the GPU, and is irrelevant to testing -- but we're detailing it for our own notes in the future.
Game Bench
| GN Test Bench 2017 | Name | Courtesy Of | Cost |
| Video Card | This is what we're testing | - | - |
| CPU | Intel i7-7700K 4.5GHz locked | GamersNexus | $330 |
| Memory | GSkill Trident Z 3200MHz C14 | Gskill | - |
| Motherboard | Gigabyte Aorus Gaming 7 Z270X | Gigabyte | $240 |
| Power Supply | NZXT 1200W HALE90 V2 | NZXT | $300 |
| SSD | Plextor M7V Crucial 1TB | GamersNexus | - |
| Case | Top Deck Tech Station | GamersNexus | $250 |
| CPU Cooler | Asetek 570LC | Asetek | - |
BIOS settings include C-states completely disabled with the CPU locked to 4.5GHz at 1.32 vCore. Memory is at XMP1.
We communicated with both AMD and nVidia about the new titles on the bench, and gave each company the opportunity to ‘vote’ for a title they’d like to see us add. We figure this will help even out some of the game biases that exist. AMD doesn’t make a big showing today, but will soon. We are testing:
- Ghost Recon: Wildlands (built-in bench, Very High; recommended by nVidia)
- Sniper Elite 4 (High, Async, Dx12; recommended by AMD)
- For Honor (Extreme, manual bench as built-in is unrealistically abusive)
- Ashes of the Singularity (GPU-focused, High, Dx12)
- DOOM (Vulkan, Ultra, 0xAA, Async)
Synthetics:
- 3DMark FireStrike
- 3DMark FireStrike Extreme
- 3DMark FireStrike Ultra
- 3DMark TimeSpy
For measurement tools, we’re using PresentMon for Dx12/Vulkan titles and FRAPS for Dx11 titles. OnPresent is the preferred output for us, which is then fed through our own script to calculate 1% low and 0.1% low metrics (defined here).
Power testing is taken at the wall. One case fan is connected, both SSDs, and the system is otherwise left in the "Game Bench" configuration.
Continue to Page 2 for power & thermals.
Sapphire RX 560 Pulse OC Power Consumption
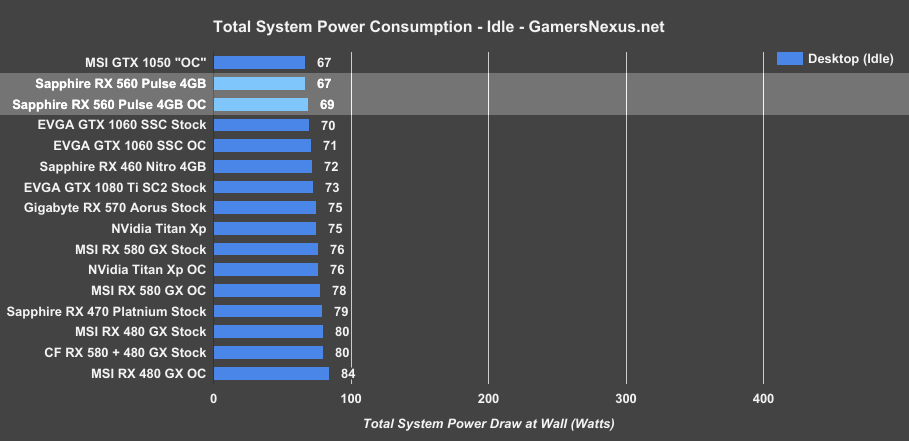
Starting off with total power consumption as measured at the wall, our RX 560 Pulse ($115) configuration draws 67W when idle, with the overclocked variant mostly equal to this. This is lower power consumption than the RX 460 for two reasons: One, AMD tuned the 500 series of Polaris cards to draw lower power when idle; two, the RX 460 we tested has LEDs and extra hardware on the board, which increases power draw. For comparison, our MSI GTX 1050 model – which MSI calls the “OC,” but we are running stock – has equal power consumption in our tests to the RX 560 Pulse.
Moving to 3DMark – FireStrike, the RX 560 Pulse faces a total system power draw of 148W, lower than the RX 460 Nitro only because the 460 hosts two fans, LEDs, and different volt-frequency curves. Otherwise, as we saw in our RX 580 versus RX 480 results – which we can highlight here – the 500 series has been drawing more power given the same PCB and cooler.
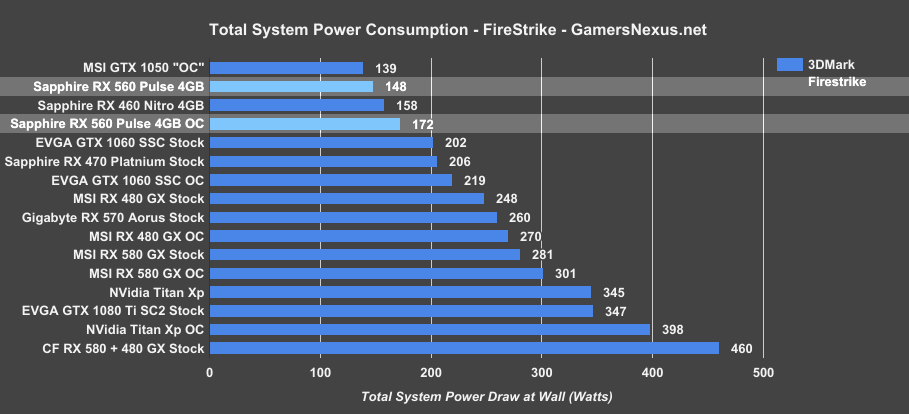
Regardless, 148W for the Pulse 4GB card, jumping to 172W system power draw when overclocked. The GTX 1050 configuration draws 139W with the stock MSI card, which MSI calls “OC.” The GTX 1060 SSC, for reference, sits around 219W total system power draw.
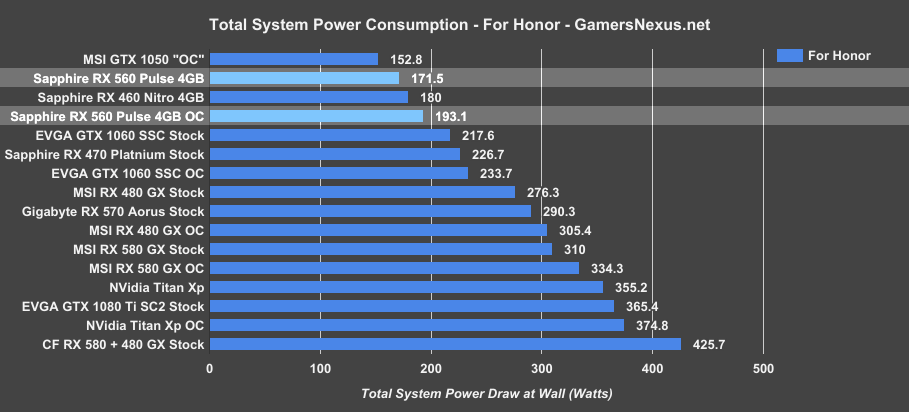
In real-world gaming workloads, starting with For Honor, the RX 560 Pulse runs a power consumption of around 172W total system draw, with the 460 Nitro at 180W and both fans cranking. The 560 Pulse overclocked card hovers around 193W total draw, below the GTX 1060 SSC at 218W total system power draw. The MSI 1050 card hovers at 153W total system power draw, marking about an 11% reduction in power draw than the Pulse 460.
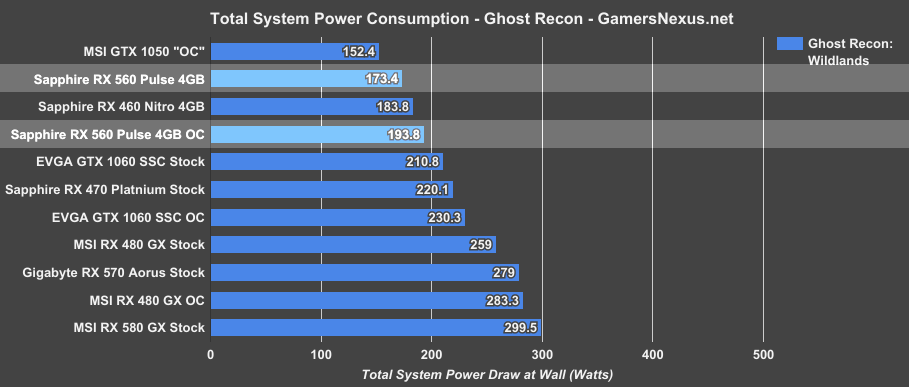
Playing Ghost Recon: Wildlands, we observe a total system power draw of around 173W for the RX 560 Pulse, a reduction of about 5.7% from the particular RX 460 that we tested, with the overclocked Pulse build drawing 194W. This is about an 8% reduction from the GTX 1060 SSC. At the low-end, the GTX 1050 MSI card runs at 152W total system power draw.
AMD RX 560 Frequency Stability vs. Temperature
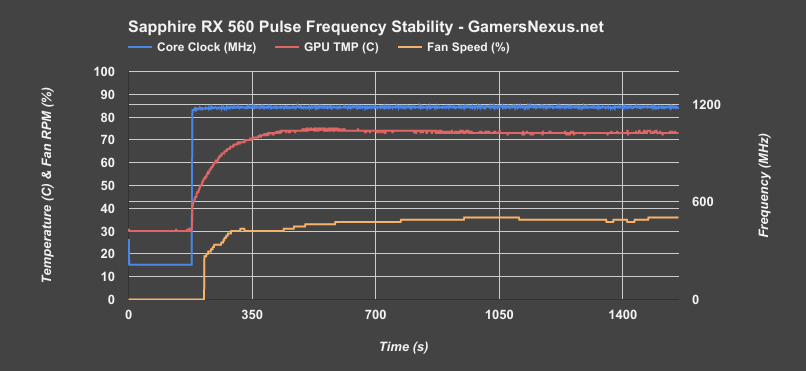
Moving now to thermal testing, we start with a simple frequency versus time chart to plot GPU core stability under a power virus scenario. Clocks are enumerated differently in these torture workloads than with gaming workloads, meaning a lower clock than in gaming, but power consumption and thermals are higher.
Given the low-power cooler on the Sapphire RX 560 Pulse, we expected worse cooling performance than what was output in our torture workload. It seems that, thanks to the relatively low power consumption of the GPU compared to its larger counterparts, things are kept under control even with a heatsink that is similar to an Intel stock cooler.
We’re looking at an average GPU diode reading of approximately 75C, with the target seeming to be about 73-75C, while the GPU clock maintains just below 1200MHz. We see some clock dithering at this point; ideally, you’d observe a perfectly straight line for the clock – but our range is still about 20MHz. Not bad. To maintain this clock and temperature, the fan ramps up maximally to around 36% fan speed for 1600RPM.
Sapphire RX 560 Pulse OC VRAM & VRM Temperature
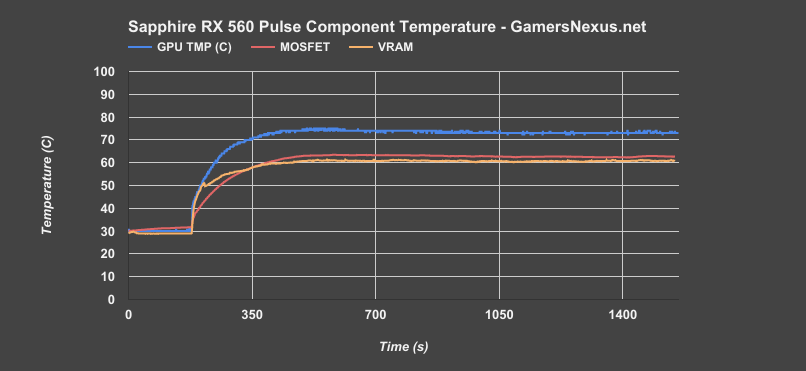
The next question is how VRM and VRAM components hold up to the small cooler. Fortunately, because this card isn’t driving much power, the VRMs do OK.
With our thermocouples, we measured one of the hottest MOSFETs at around 63C, which is well within any reasonable operating temperature. We’re so far below the 125C point that FET temperatures are a non-issue here; at least, they are for the stock card.
The top-left VRAM module is one of the hottest on this card, and measures at about 75C. We’re still well within spec here, though it’d get a bit warm in a higher ambient environment with restrictive airflow. GPU diode temperature is steady at around 73-75C.
Continue to Page 3 for 3DMark results.
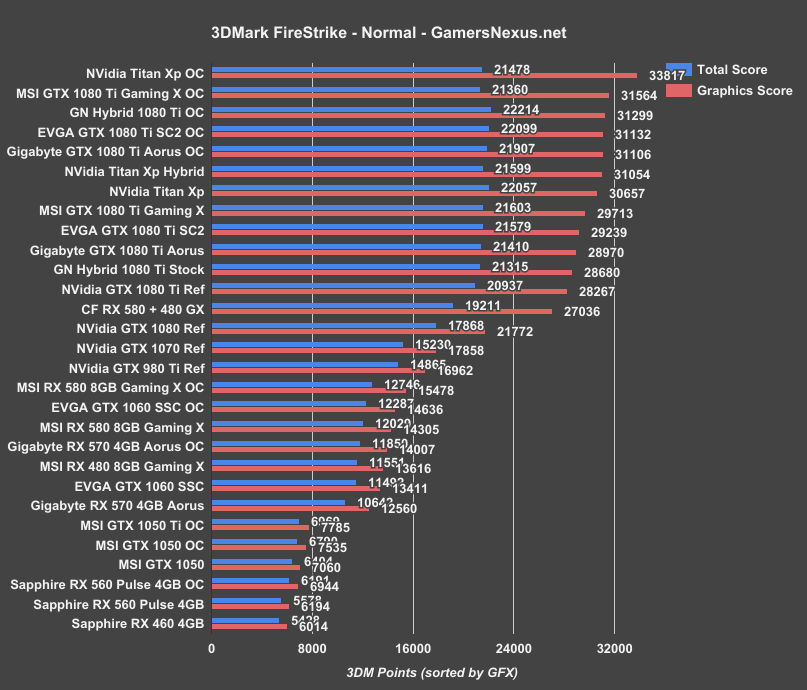
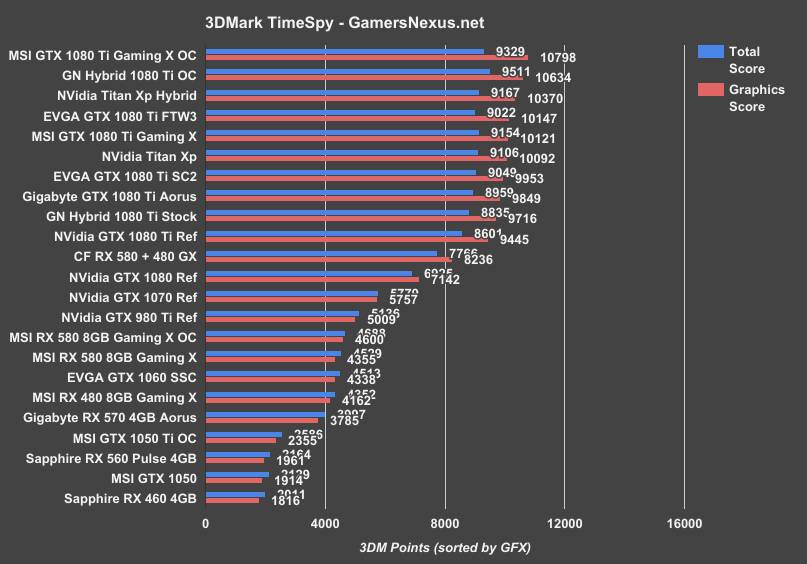
3DMark & Synthetic Benchmarking
We're using 3DMark for synthetic benchmarking here, though won't begin data analysis until the next page. These charts are just for fans of 3DMark (like benchmarkers and overclockers) who like having the synthetic metrics on hand.
We're using 3DMark Firestrike - Normal, 3DMark Firestrike - Extreme, and 3DMark Firestrike - Ultra for testing, alongside TimeSpy. Continue to the next page for data analysis of games.
Continue to Page 4 for gaming benchmarks.
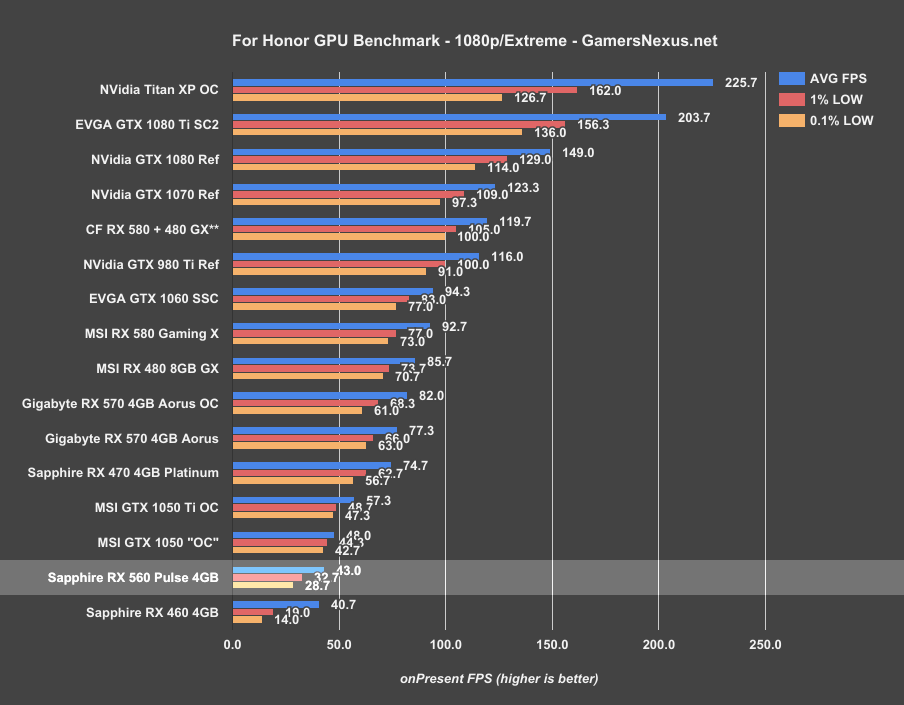
For Honor GPU Benchmark - Sapphire RX 560 vs. GTX 1050, RX 460, 570
Starting our game testing with For Honor, the Sapphire RX 560 Pulse OC ($115) operates a 43FPS AVG with this in-game test course, with GN’s coined 1% low framerate at 32.7FPS, and 0.1% lows at 28.7FPS. This positions the RX 560 Pulse below the GTX 1050 from MSI – which, despite its name, is not actually overclocked – and above the RX 460 4GB card. We’ve got a lead of 5.7% over the previous RX 460 4GB card, running the slower clock-rate, with the GTX 1050 producing an 11.6% lead over the RX 560 Pulse OC.
To compare versus other nearby cards, the $140 MSI GTX 1050 Ti runs at 57FPS AVG, 49FPS 1% lows, and 47FPS 0.1% lows. This places the $140 1050 Ti approximately 19% ahead of the $100 GTX 1050 and 33% ahead of the RX 560. The RX 570, at $180, runs 35% faster than the 1050 Ti. While those cards aren’t the focus of today, they help us understand if and when extra money could be worthwhile.
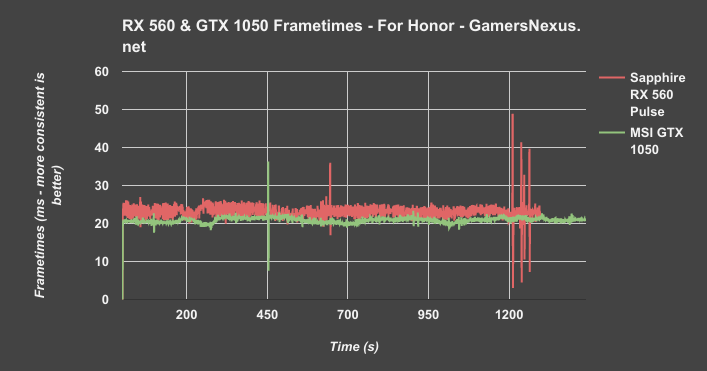
Frametime consistency isn’t king for the RX 560 in this particular title, as we can show in this frametime plot, although the GTX 1050 does reasonably when compared to the 560.
Mass Effect: Andromeda GPU Benchmark – RX 560
Moving on to Mass Effect: Andromeda, we start with higher settings tests to get some comparative numbers to the higher-end cards, then we’ll move to tests with medium settings.
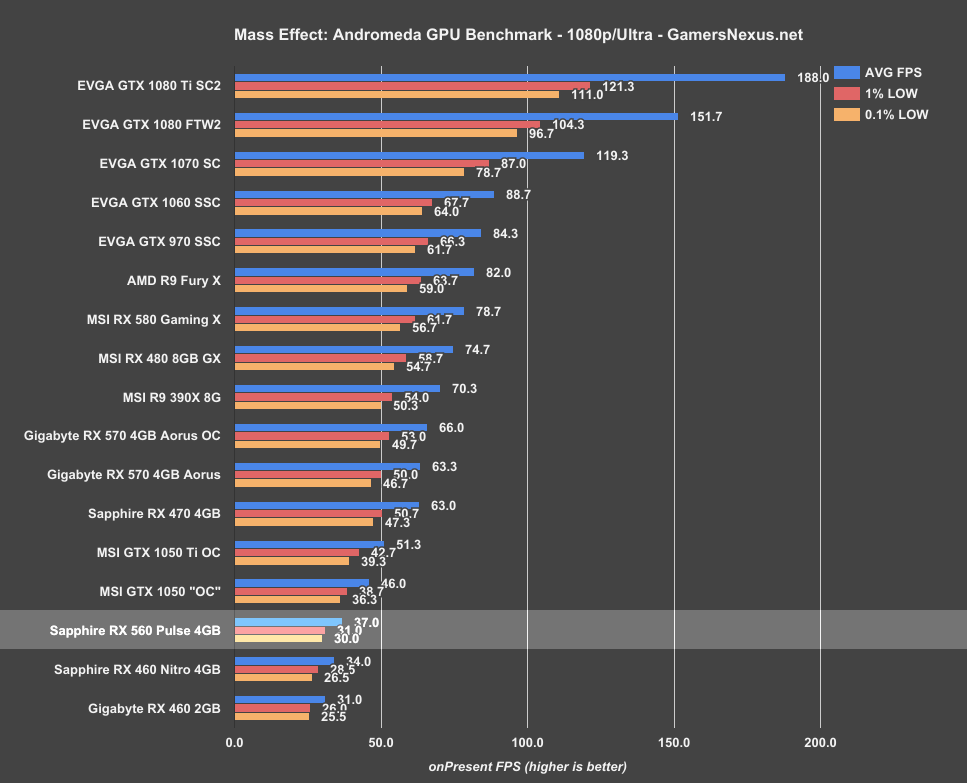
The $115 Sapphire RX 560 Pulse runs an AVG FPS of 37, with lows at 31 and 30, trailed by the RX 460 Nitro 4GB card at 34FPS AVG. The 560 leads by about 8.8% over the 460. The next card up, the MSI GTX 1050 $100 card, operates at an average of 46FPS, with lows tightly timed as on the previous cards. The 1050 Ti runs a 51FPS AVG, outmatched quickly by an RX 570 at 63FPS AVG.
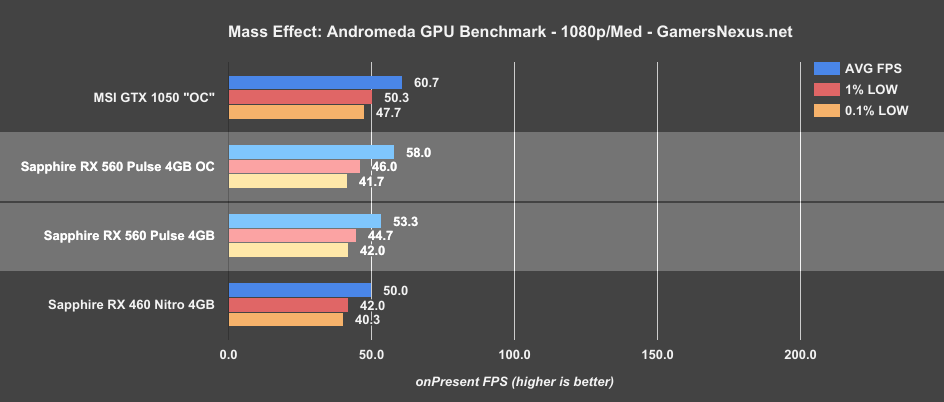
Let’s look at the medium results. Although more limited, as we’ve only just begun testing lower-end GPUs, we get a better idea as to relative performance on these cards. With these settings, the GTX 1050 is able to hit 61FPS AVG, with the RX 560 stock running 53FPS AVG, 45FPS 1% lows, and 42FPS 0.1% lows. This lands it about 6.6% better than the RX 460 Nitro 4GB card, with the overclocked RX 560 Pulse running at 8.8% faster than the stock RX 560.
DOOM (Vulkan) GPU Benchmark – RX 560
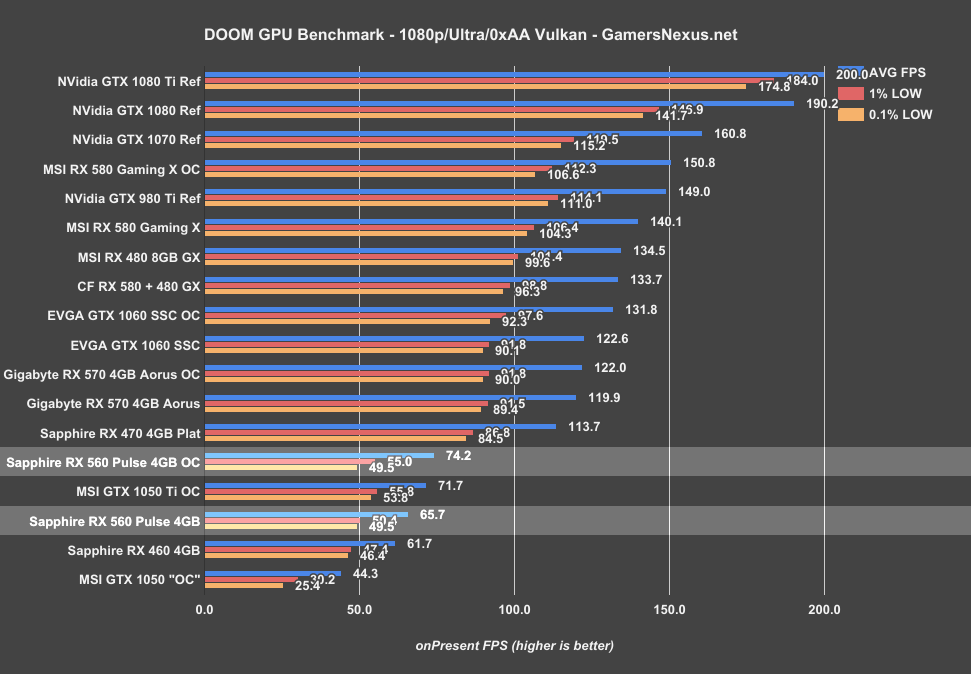
Moving now to DOOM with Vulkan and Async compute, the RX 560 finally begins to pull ahead of the GTX 1050; in fact, once overclocked, it also pulls ahead of the more expensive 1050 Ti. This is in-line with what we’ve seen out of this particular game in the past, where DOOM tends to produce more favorable results for AMD with its Vulkan integration. The MSI GTX 1050 OC struggles a bit, maintaining an average FPS of 44 with lows dipping to 25, and overall produces less consistent frametimes than the RX 560 4GB card. The 560 averages 66FPS, which is about 6.5% faster than the RX 460 4GB Nitro card.
Overclocked, the 560 moves up to 74FPS AVG, a 13% increase over its stock performance. For reference, the RX 570 4GB card averages at around 120FPS, or 60% faster than the RX 560 4GB Pulse card.
A quick note, here: this is with DOOM configured to Ultra graphics at 1080p – not bad performance for these low-end cards. Even the 1050, although we wouldn’t recommend it.
Ghost Recon: Wildlands GPU Benchmark – RX 560
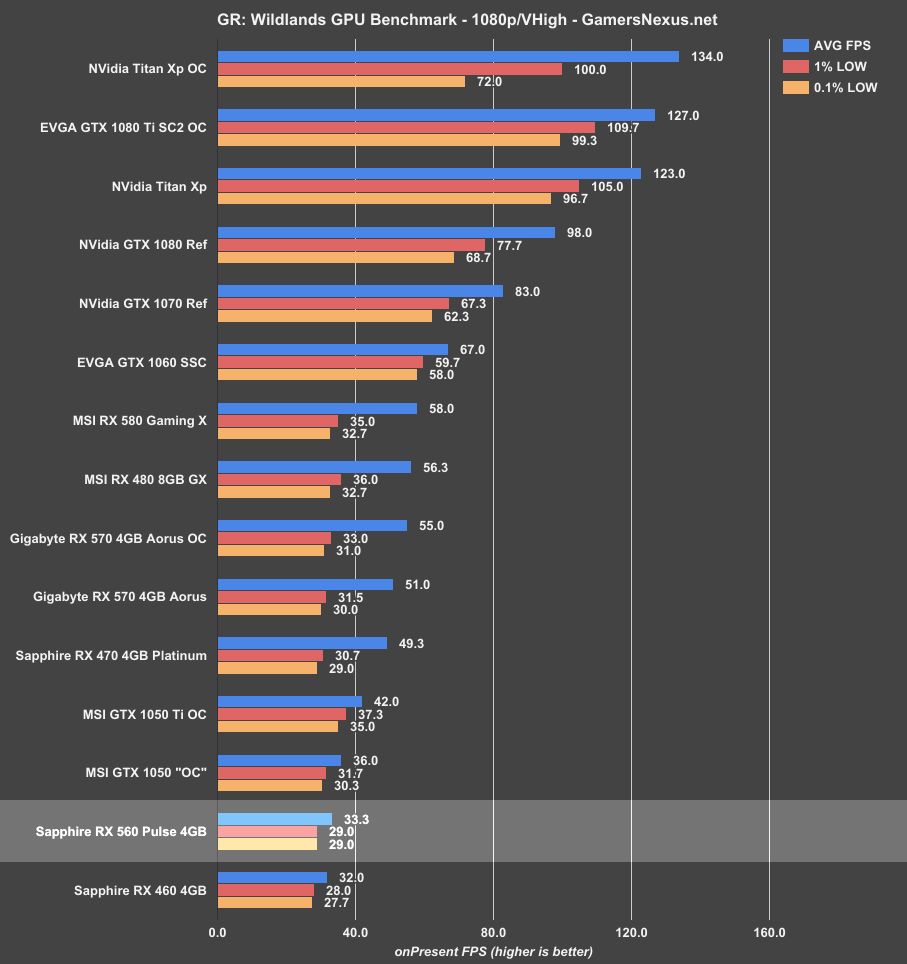
We now move to Ghost Recon: Wildlands, where we’ve got tests at Very High for comparison and on Medium for more realistic representation of the cards.
We’ve got a fairly complete view of performance from top-to-bottom with this chart, with regard to scaling. The RX 560 Pulse operates an average FPS of 33.3, followed by the RX 460 4GB card at 32FPS AVG. The GTX 1050 is able to sustain a higher average at 36FPS, with the 1050 Ti running about 42FPS AVG. For perspective, the RX 570 runs an average FPS of 51, leading the RX 560 by 53%. It’s not until RX 570, RX 580, and GTX 1060 territory that we start reaching numbers where it’d be possible to play on a mix of Very High and High settings. The GTX 1060 is the real victor of that stack, but at more than two times the cost of the GTX 1050 and RX 560, can’t really be considered as an alternative in the price-point. Instead of trying to make that work, let’s just run the tests with lower settings.
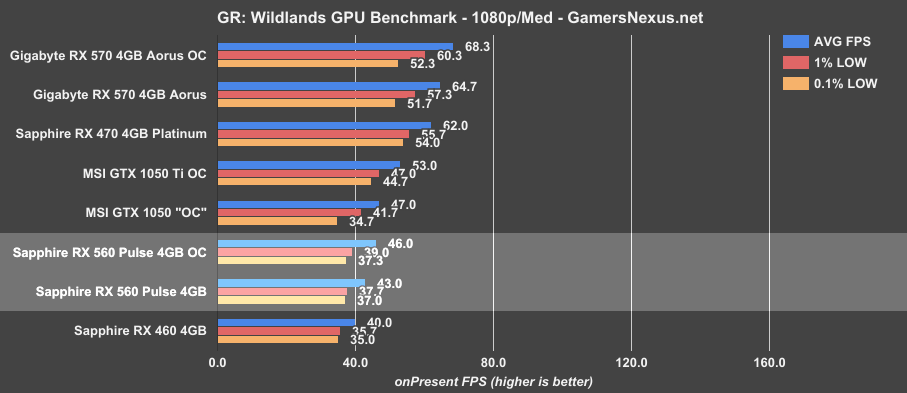
Here’s Medium, which is more reasonably where you’d be playing with these $100-class cards. We’ve got fewer cards on this chart, but enough to start building an understanding of performance. The RX 560 Pulse now runs an average of 43, about 10FPS higher than previously, landing it around 7.5% faster than the RX 460 4GB Nitro card. Overclocking gets us to 46FPS AVG, which is about on-par with the MSI 1050 card’s stock performance. The MSI GTX 1050 stock card operates 8.6% faster than the RX 560 4GB card. For reference, the GTX 1050 Ti stock card runs a 53FPS AVG, making it 12.8% faster than the 1050 and 15.3% faster than the RX 560. The RX 570 is about 50% faster than the RX 560.
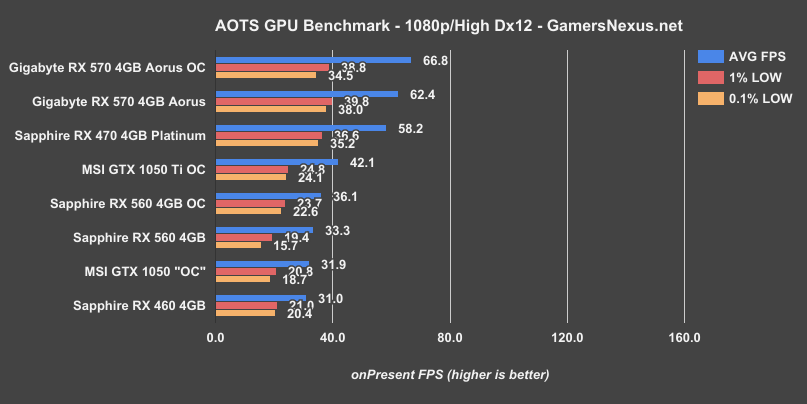
AOTS (Dx12) - RX 560
Sniper Elite 4 (Dx12) GPU Benchmark – RX 560
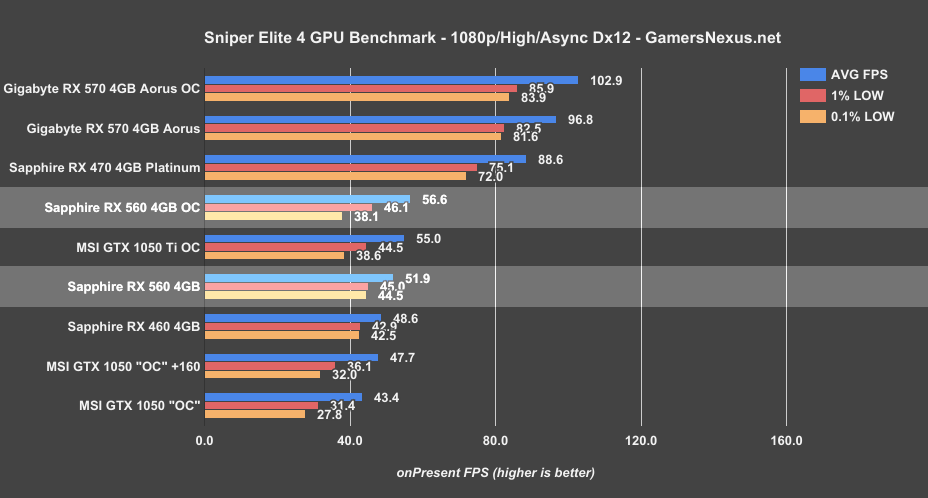
Sniper Elite 4 is another game where we’ve only just started running low-end card tests, so it’s not as populated as our 4K tests. Looking at 1080p/High, the RX 560 4GB card runs an average of 52FPS, with overclocking producing a 9% performance improvement over baseline. The RX 460 runs a 49FPS AVG, making the gap between the 460 and 560 about 6.7%. The GTX 1050 is led by all of these, thanks to its 43FPS AVG, though overclocking nearly gets its averages on-par with a 460 – despite lower performance in frametime consistency overall, as illustrated by GN’s low values.
These performance numbers plot the RX 560 close to the GTX 1050 Ti, with the RX 570 hitting 100FPS averages, at times.
Conclusion: RX 560 vs. GTX 1050 (& Others)
We’re not yet looking at 4GB vs. 2GB comparisons for the RX 560 (but hope to), but the promised price-point of ~$115 (a $15 difference) nearly makes such a comparison irrelevant. Our initial reviews of the RX 460 and GTX 1050 ($80 to $100) demonstrated that the RX 460 was a bad purchase, given the competition at the same price bracket. Things have changed today – part of that is the games market, where we now have the likes of DOOM and Sniper holding the RX 560 well ahead of the 1050 – and part of that is just the core and frequency increase. Still, it’s not a clean sweep; the RX 560 4GB is behind in our Dx11 test suite, costs more ($15 more from retail, or $35 more if counting near-constant MIRs), and consumes more power. Considering, though, that its Dx11 deficits aren’t as large as its surpluses in other test titles, the RX 560 is far from a “bad buy.”
This particular model, the Pulse from Sapphire, is able to maintain perfectly acceptable VRM FET and VRAM temperatures in spite of its low-quality cooler, thanks to lower amperage throughput on the 560 GPU. Temperatures aren’t offensive, performance isn’t offensive, and power draw is acceptable.
These cards aren’t the most exciting to look at, given the price bracket, but they fill an important niche. At this point, the 1050 is aging – that’s not to say the 560 is “new,” seeing as it’s really just Polaris with a new BIOS, but the unlocked cores do help the RX 560 regain ground where the 460 lost handily. The extra ~5-7% over the initial RX 460 launch helps out.
Really, though, just buy whichever fits the budget. Unless you’re playing one of the specific games where the 560 takes a strong lead (like DOOM or Sniper), performance is similar enough to just go for the card that favors the budget. If games like DOOM and Dx12 titles are in your regular games arsenal, then the 560 seems to suit those titles (from our tests).
More to come on this card.
Editor-in-Chief: Steve Burke
Video Producer: Andrew Coleman