Intel’s past few weeks have seen the company enduring the ire of a large portion of the tech community, perhaps undeservedly in some instances -- certainly deservedly in others. We criticized the company for its initial marketing of the 7900X – but then, we criticize nearly everyone for marketing claims that borderline on silly. “Extreme Mega-Tasking,” for instance, was Intel’s new invention.
But it’d be folly to assume that Skylake-X won’t perform. It’s just a matter of how Intel positions itself with pricing, particularly considering the imminent arrival of Threadripper. Skylake-X is built on known and documented architecture and is accompanied by the usual platform roll-out, with some anomalies in the form of Kaby Lake X's accompaniment on that same platform.
Today, we're reviewing the Intel Core i9-7900X Skylake X CPU, benchmarking it in game streaming (Twitch, YouTube) vs. Ryzen, in Blender & Premiere rendering, VR gaming, and standard gaming.
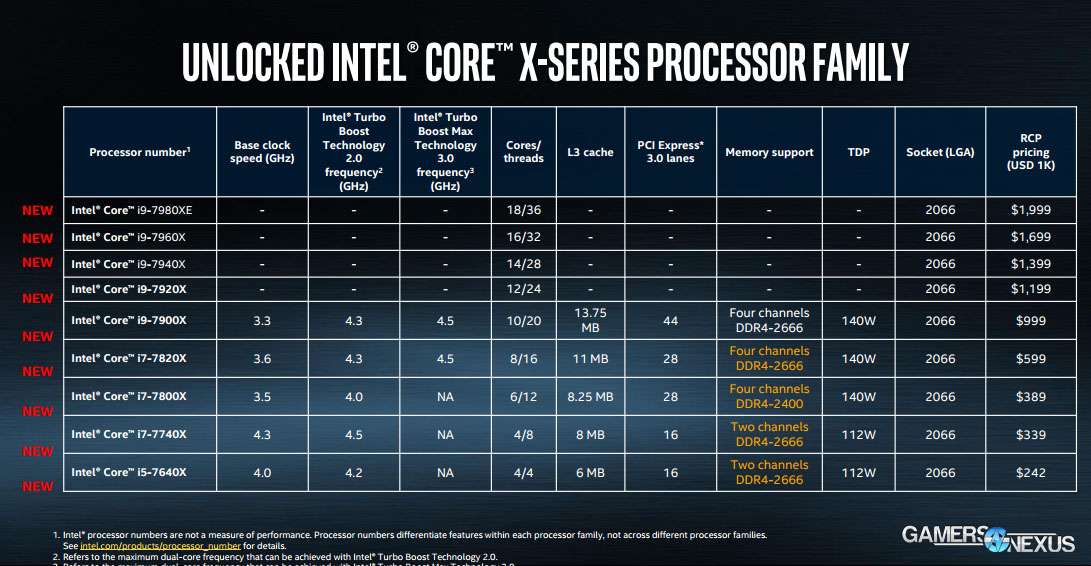
Intel i9-7900X Specs
About That Skylake X RFID Chip
Let’s start by revisiting our earlier 7900X discussions. First, the RFID chip on the corner of the 7900X is actually disconnected – the CPU can’t read from or write to the chip, and it stores no data. We asked Intel about this at a recent event, and the company told us that the RFID chip is present because the HEDT and server CPUs use the same package, and the RFID module is used for the enterprise division. The SMBUS actually isn’t connected on the HEDT CPUs, meaning it’s a dead chip that’s only there because Intel is just making a lot of the same package for both enterprise and server. The enterprise tracking chip happens to be on both – but the SMBUS only connects on the server CPUs.
This could be something like RMA tagging or service life tags, among myriad other maintenance utilities that enterprise groups would make use of.
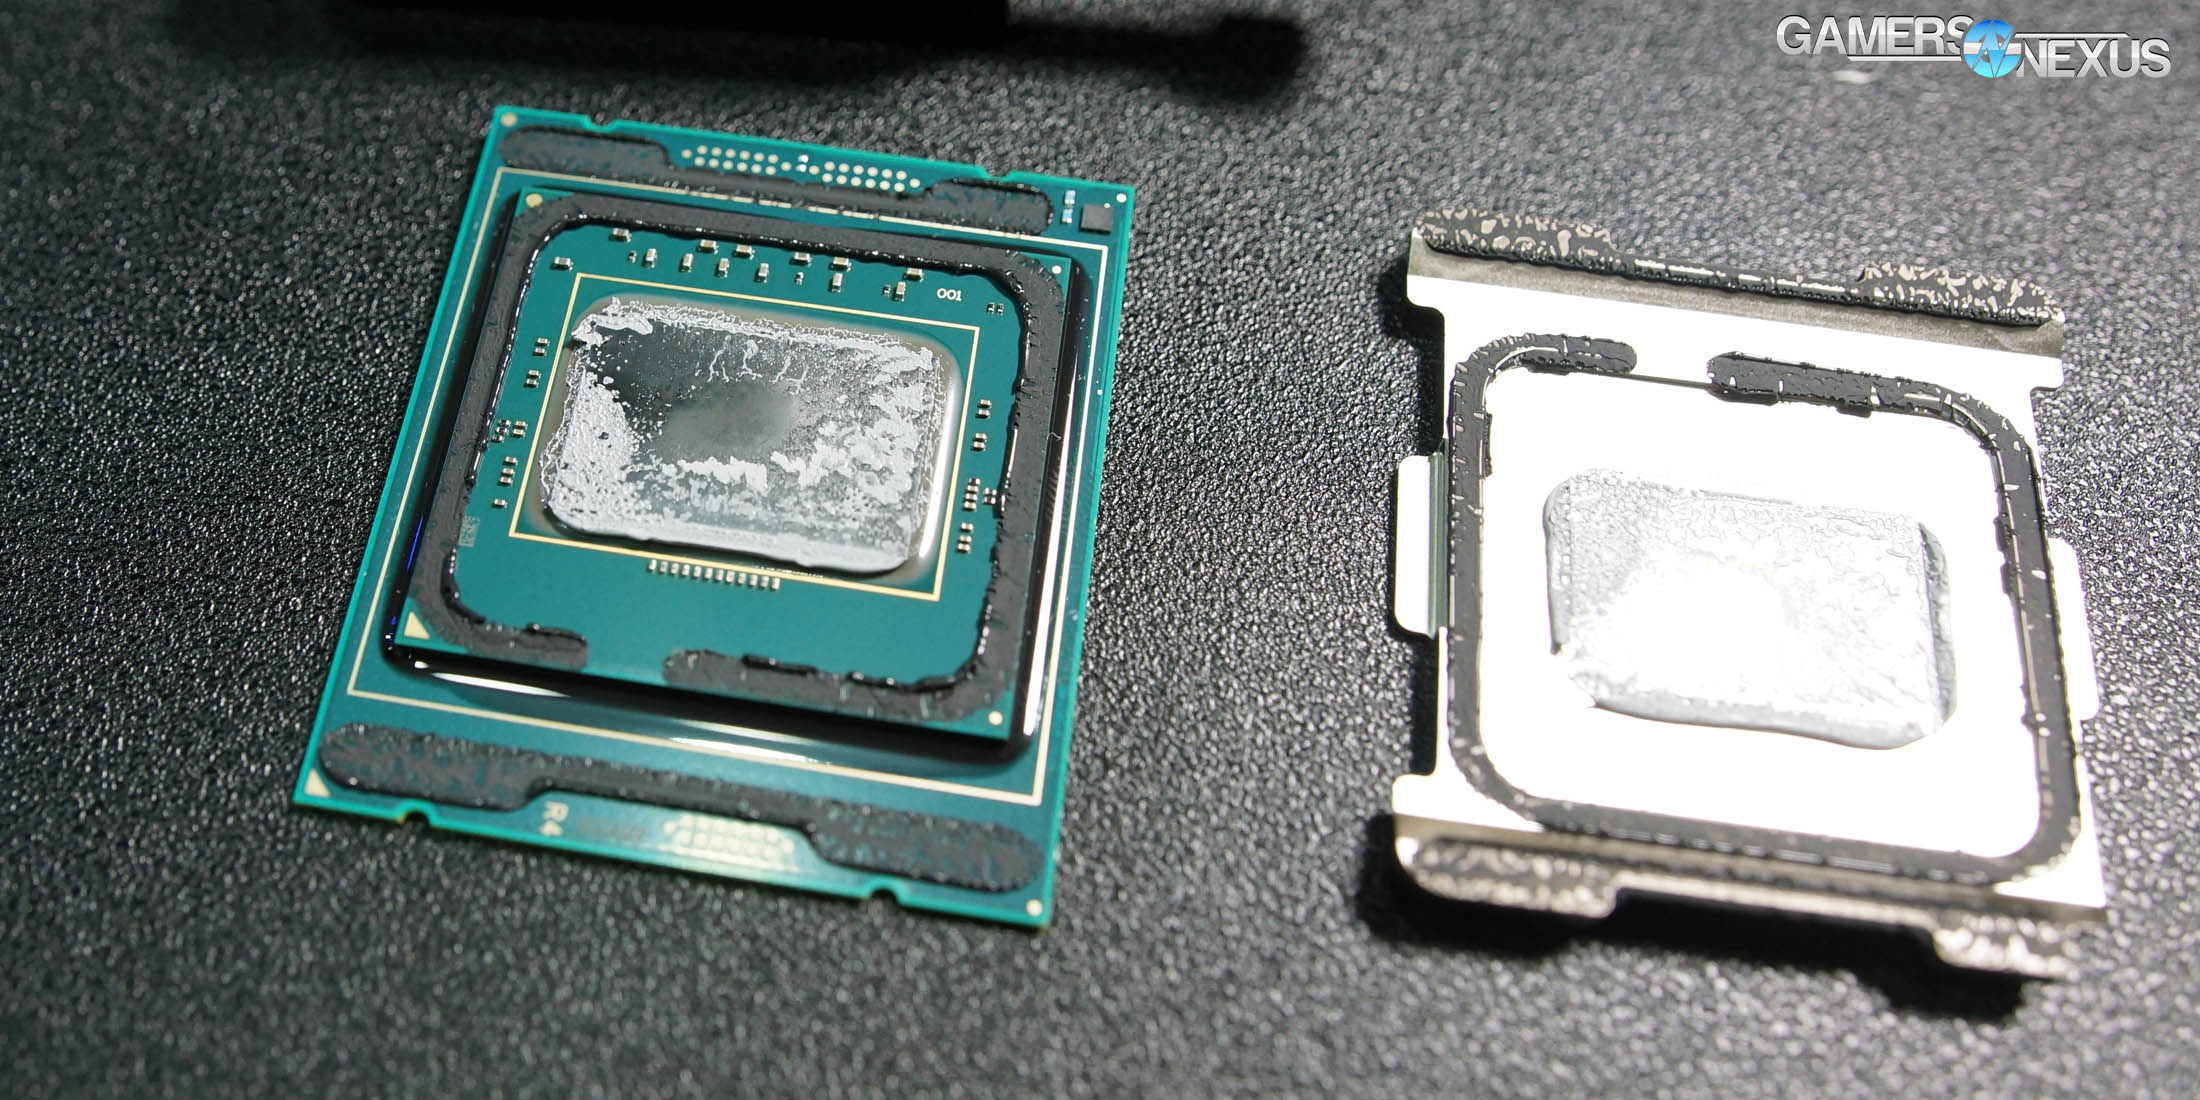
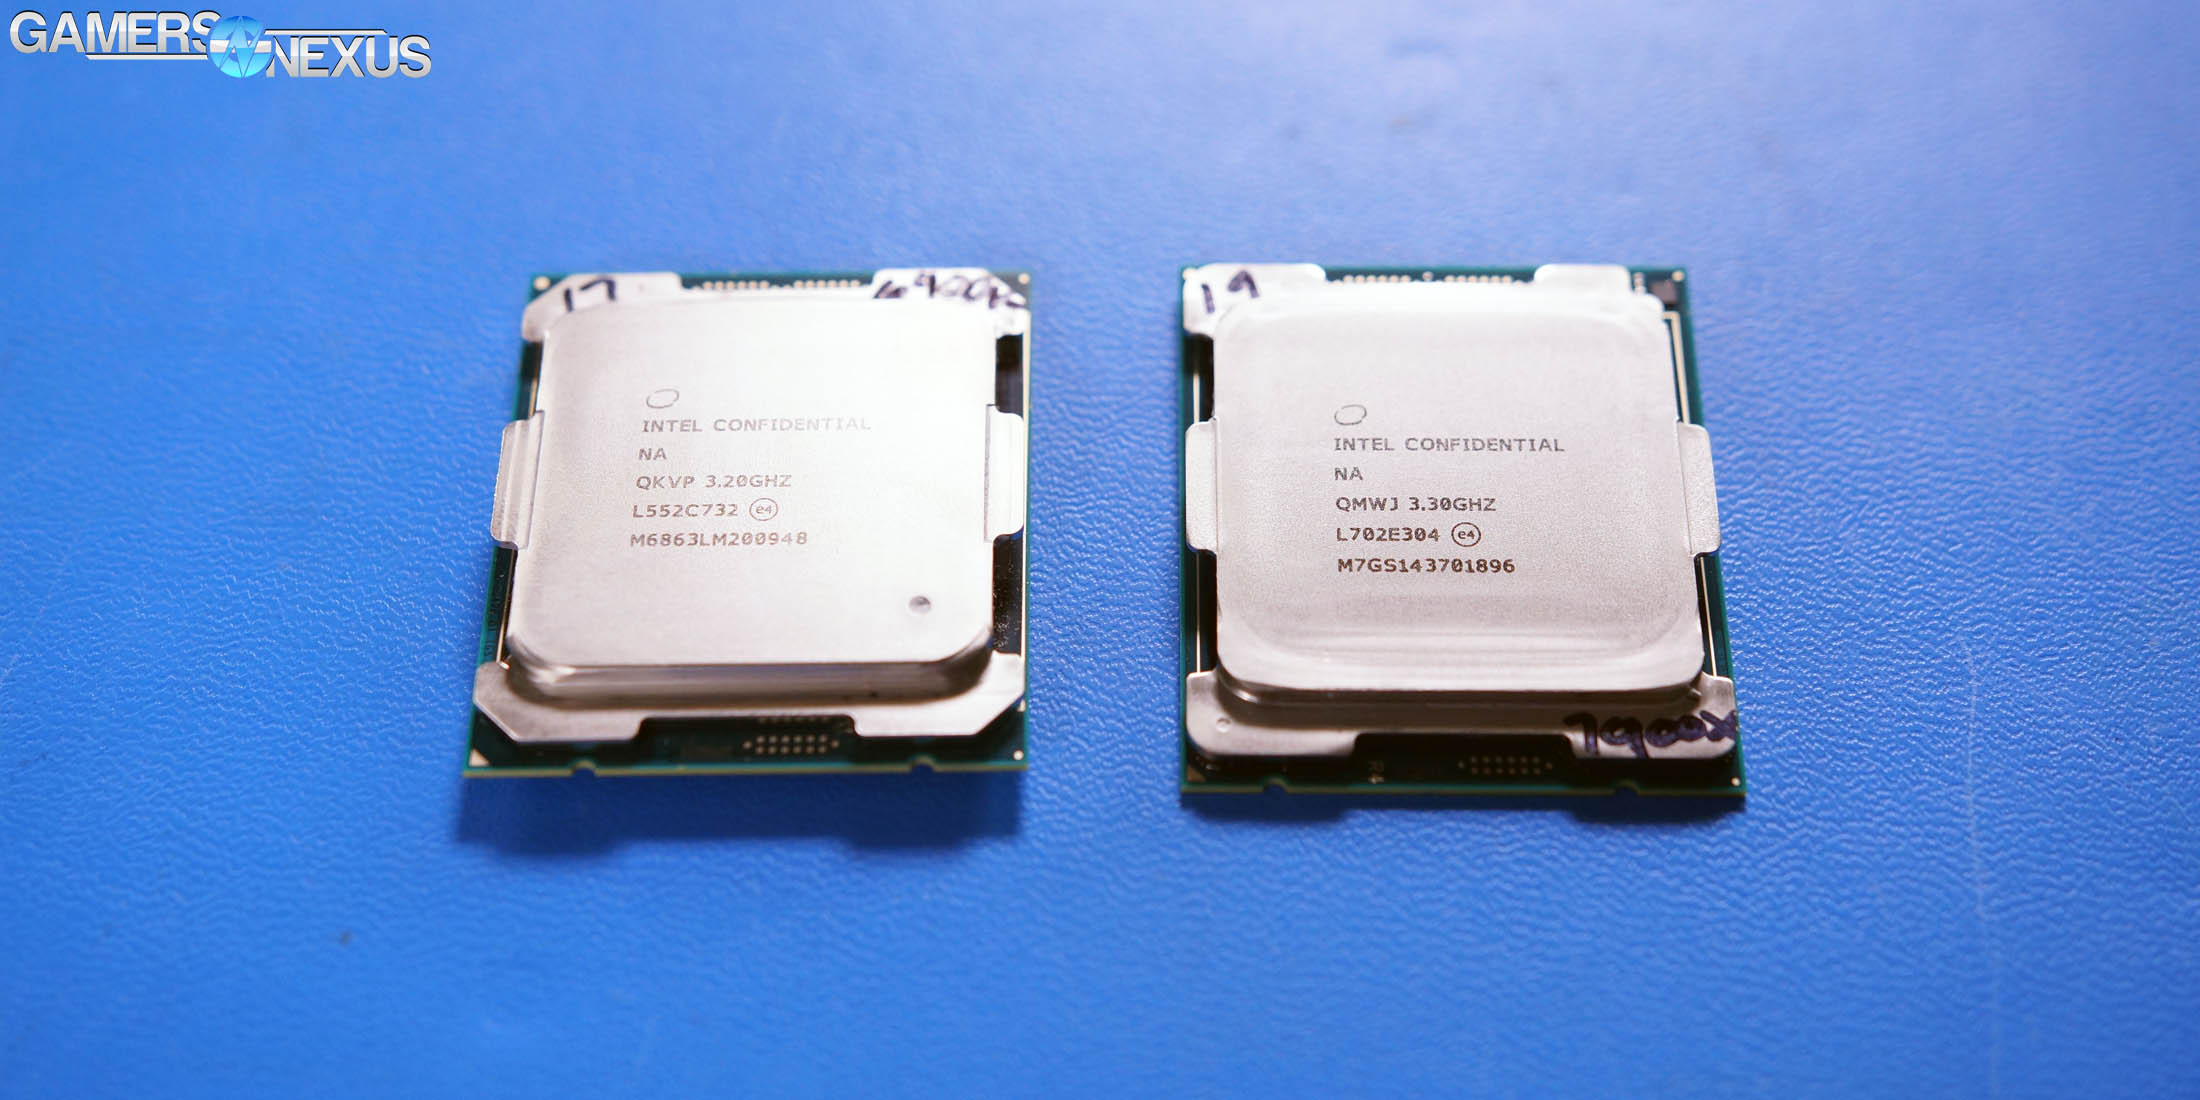
Intel’s Stacked Substrate for Skylake X & i9-7900X (Delidded) Die Size
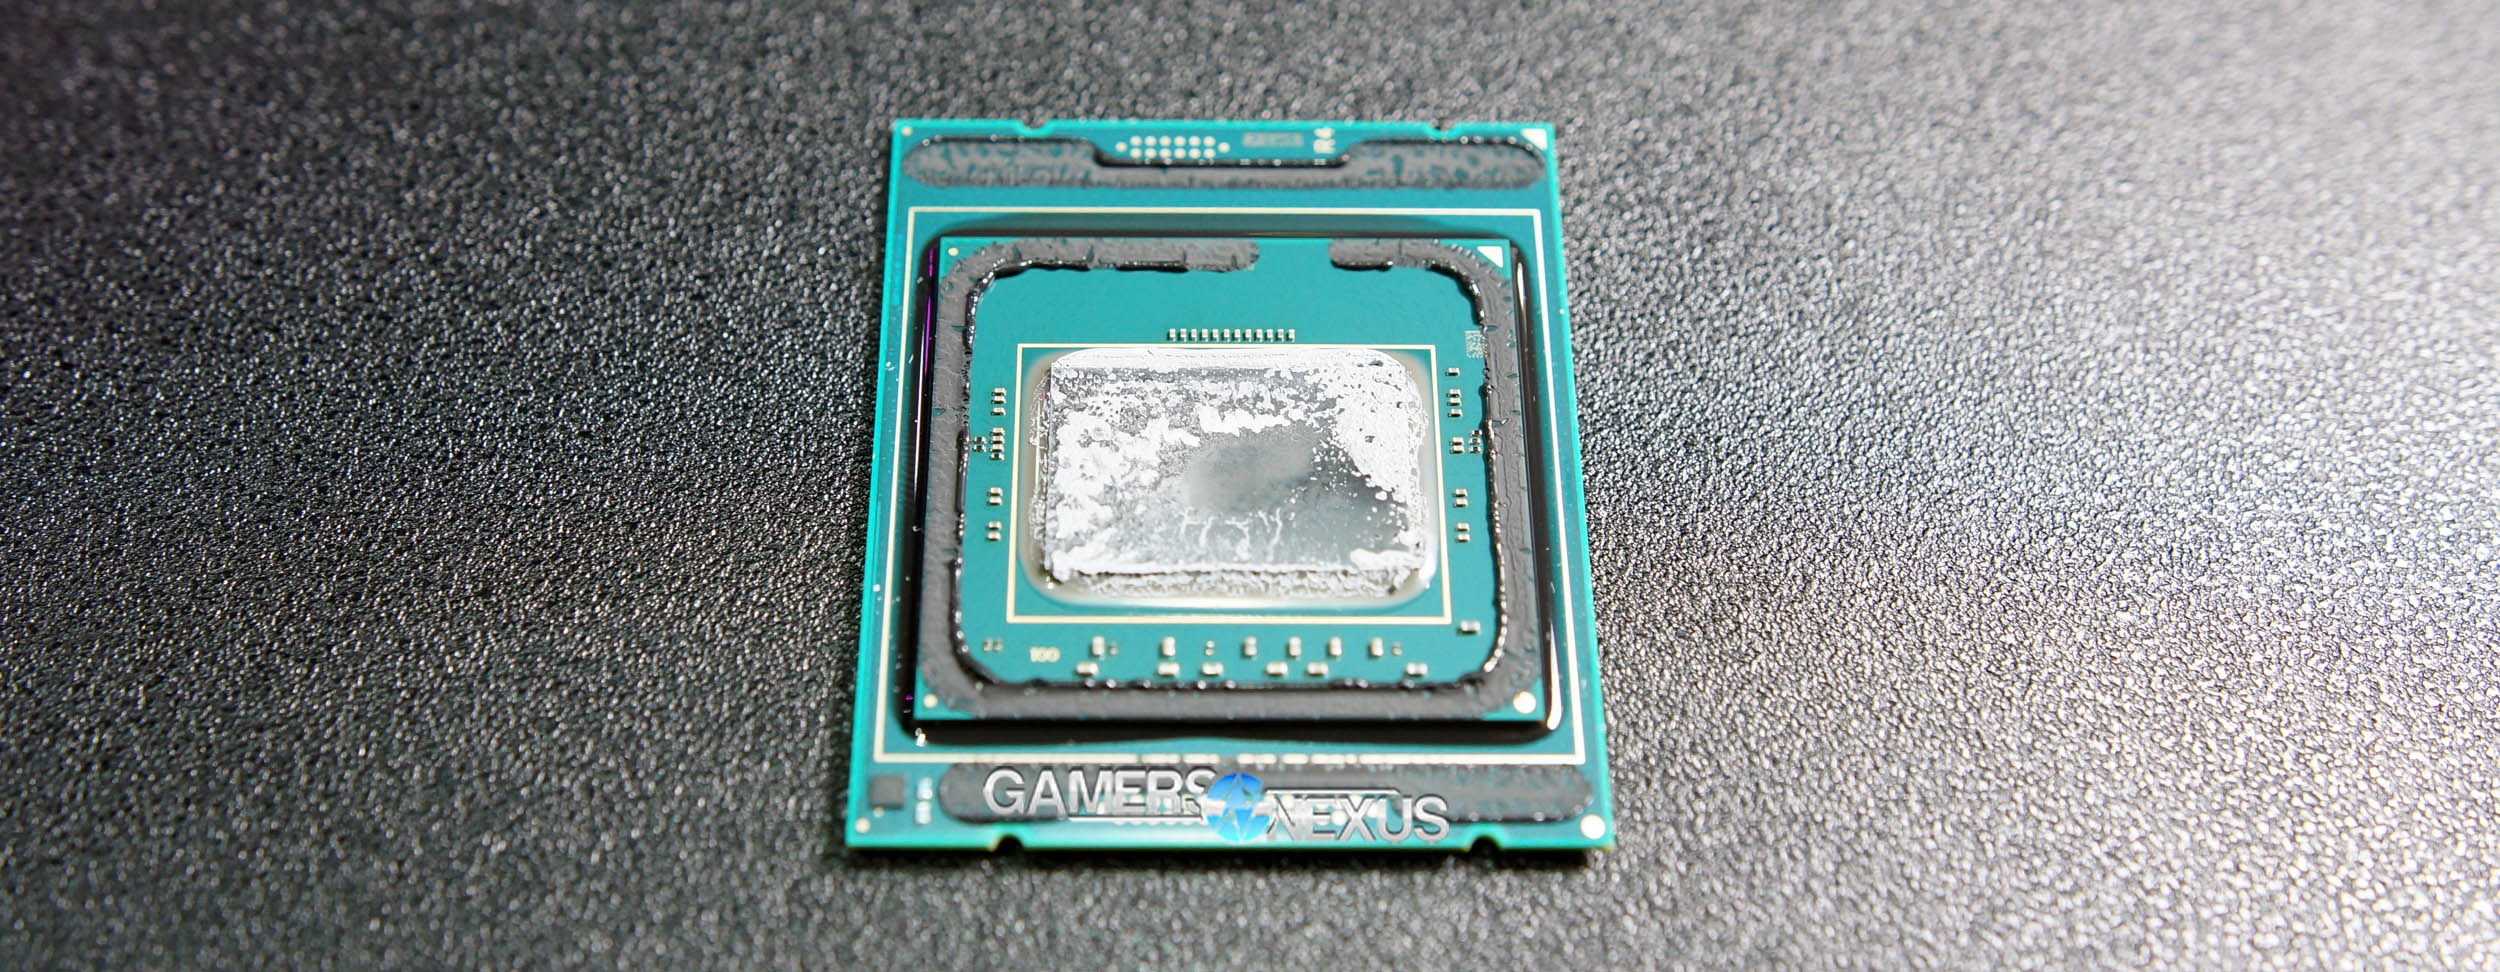
We also think that this ties to the next point of interest, which is Intel’s odd substrate and package layout. When we delidded the i9-7900X, we showed that the CPU almost resembles an LGA115X substrate atop a 2066 substrate. Intel couldn’t answer why the design is like this, citing “manufacturing reasons,” which is the same reason Intel cited for usage of thermal paste rather than solder. Our present hypothesis, having not seen the server CPUs, is that the server CPUs might use more of the lower substrate and ditch the upper substrate, but Intel is keeping the same package for everything. We’re really not sure if there’s a legitimate, technical reason for this approach at this time, as Intel won’t tell us.
As for the CPUs themselves, our current understanding is that the 14C, 16C, and 18C CPUs are derived from 20-core silicon with some cores disabled, but we’re not sure about the lower SKUs – like the 7900X. We’ll learn more with time. We do have some rough die measurements, though, and the 7900X measures in at around 334mm^2. For reference, the previous generation 10C to 24C parts ranged from 246mm^2 to 456mm^2, respectively.
But anyway, the substrate design is genuinely interesting, and we have no idea why Intel took this approach. We do know that they’re still using TIM, though, and that’s something we’ll talk about in a separate video dedicated to the thermals of this CPU. The article will also contain more data on thermals.
Continue to Page 2 for detailed testing methodology.
Test Methodology: Standard & Gaming
Windows 10 b970 was used for testing. R7 CPUs have been retested; some i7 & i5 CPUs have been retested. Game settings were manually controlled for the DUT. All games were run at presets defined in their respective charts. All other game settings are defined in respective game benchmarks, which we publish separately from GPU and CPU reviews.
Average FPS, 1% low, and 0.1% low times are measured. We do not measure maximum or minimum FPS results as we consider these numbers to be pure outliers. Instead, we take an average of the lowest 1% of results (1% low) to show real-world, noticeable dips; we then take an average of the lowest 0.1% of results for severe spikes.
Hardware Used
Core Components (Unchanging)
- NZXT 1200W Hale90v2
- For DDR4 platforms: Corsair Vengeance LPX 32GB 3200MHz*
- ** For Initial Ryzen DDR4: Corsair Vengeance LPX 3000MHz clocked to 2933MHz (See Page 2)
- For Ryzen R5 CPUs, Retested R7 CPUs: GEIL EVO X 3200MHz memory (clocked to 3200MHz)
- Premiere & Blender tests do not exceed 8GB DRAM. Capacity is a non-issue for our testing, so long as it is >16GB
- For DDR3 platforms: HyperX Savage 32GB 2400MHz
- Intel 730 480GB SSD
- Open Air Test Bench
- Cooler #1 (Air): Be Quiet! Dark Rock 3
- Cooler #2 (Cheap liquid): Asetek 570LC w/ Gentle Typhoon fan
- Cooler #3 (High-end): Kraken X62
- EVGA GTX 1080 FTW1
Note: fan and pump settings are configured on a per-test basis.
X299 Platform:
- ASUS X299 Prime Deluxe with latest EFI (0402)
- Corsair Vengeance LPX 3200MHz
AM4 Platform:
- GEIL X 3200MHz CL16 (R5s, R7 1700, R7 1800X)
- GSkill Trident Z 3200MHz CL14 (R7 1700X)
Used for R7 1800X, R7 1700X, R7 1700.
Z270 Platforms:
- Gigabyte Aorus Gaming 7 (primary)
- MSI Gaming Pro Carbon (secondary - for thermal validation)
- i7-7700K (x2) samples from motherboard vendors
Both used for the 7700K.
Z170 Platform:
- MSI Gaming M7
- i7-6700K retail
Z97 Platform:
- Gigabyte Z97X G1 WIFI-BK
- i7-4790K
Z77 Platform:
- MSI GD65 Z77
- i7-2600K
Dx12 games are benchmarked using PresentMon onPresent, with further data analysis from GN-made tools.
Note: We'd like to add the i5, i3, and FX CPUs, but this was enough for now. We'll add those as we expand into coverage of Zen or i5 Kaby Lake products.
Thermal Test Methodology
Thermal measurement on Ryzen is not necessarily trivial, as most software is incorrect or inaccurate in these early days. See this page from our 1800X review for further information, or AMD’s own statement.
Power testing is simply done at the wall. We do not presently tap into the rails, and openly identify this as our weakest point in current test methodology. This is something we will eventually work toward revamping. For now, we use wall meters to determine a power delta in A/B tests.
Test Methodology: VR Benchmarking
We previously ran an introductory piece to the behind-the-scenes process of trying to figure out VR testing, something we started in September. To go through some of the basics:
Two rigs are established. There is a game benchmark machine and a hardware capture machine, which must meet high specifications for storage and for incoming data from the split headsets. The configurations are as follows:
| Intel VR Game Test Bench | |||
| Component | Provided by | Price | |
| CPU | Intel i7-7700K | GamersNexus | $345 |
| Cooler | Asetek 570LC w/ Gentle Typhoon | Asetek GamersNexus | - |
| Motherboard | Gigabyte Z270 Gaming 7 | Gigabyte | $230 |
| RAM | Corsair Vengeance LPX 3200MHz | Corsair | $135 |
| GPU | GTX 1080 Ti Hybrid | NVIDIA | $700 |
| Storage 1 | Plextor M7V | Plextor | $96 |
| Storage 2 | Crucial MX300 1TB | GamersNexus | $280 |
| PSU | NZXT Hale90 v2 1200W | NZXT | $270 |
| Case | Open-air test bench | GamersNexus | - |
And for AMD:
| AMD VR Game Test Bench | |||
| Component | Provided by | Price | |
| CPU | AMD R7 1700 | AMD | $330 |
| Cooler | Asetek 570LC w/ Gentle Typhoon | Asetek GamersNexus | - |
| Motherboard | Gigabyte Gaming 5 X370 | Gigabyte | $213 |
| RAM | Corsair Vengeance LPX 3000MHz | AMD | $120 |
| GPU | GTX 1080 Ti Hybrid | NVIDIA | $700 |
| Storage 1 | Plextor M7V | Plextor | $96 |
| Storage 2 | Crucial MX300 1TB | GamersNexus | $280 |
| PSU | NZXT Hale90 v2 1200W | NZXT | $270 |
| Case | Open-air test bench | GamersNexus | - |
Our hardware capture system is as follows:
| Hardware Capture VR Test Bench | |||
| Component | Provided by | Price | |
| CPU | Intel i7-4790K | GamersNexus | $330 |
| Cooler | Stock | GamersNexus | - |
| Motherboard | Gigabyte Z97X Gaming 7 G1 BK | GamersNexus | $300 |
| RAM | HyperX Genesis 2400MHz | HyperX | - |
| GPU | ASUS GTX 960 Strix 4GB | ASUS | - |
| Storage 1 | Intel 750 SSD 1.2TB | BS Mods | $880 |
| Capture Card | Vision SC-HD4 | NVIDIA | $2,000 |
| PSU | Antec Edge 550W | Antec | - |
| Case | Open-air test bench | GamersNexus | $250 |
The hardware capture system is the most important. We need to sustain capability to process heavy IO, and so use an Intel 750 SSD 1.2TB SSD as provided by our friends at BS Mods. The 1.2TB capacity isn’t just for show, either: Our VR capture files can take upwards of 30-50GB per capture. GamersNexus uses an in-house made compression script (programmed by Patrick Lathan & Steve Burke) to compress our files into a playable format for YouTube, while also allowing us to retain the files without high archival storage requirements. The files compress down to around ~200~500MB, but do not perceptibly lose quality for YouTube playback.
Prior to compression, though, we analyze the files with an extractor tool, which looks at color overlays frame-by-frame to determine (1) if any frames were dropped by the capture machine (they never are, because our storage device is fast & $2000 capture card supports the throughput), and (2) if any frames were dropped by the game machine. The latter happens when the DUT cannot support fluid playback, e.g. if a low-end GPU or CPU gets hammered by the VR application in a way that causes drop frames, warp misses, or other unpleasant frame output.
The VR gaming machine spits out DisplayPort to our monitor, then HDMI to a splitter box. The splitter box feeds into the capture machine via a splitter cable, then into the capture card. The other output in the splitter box goes either to the headset or to the HTC Vive Link Box, which then goes to the headset & the game machine (USB, audio, display).
In total, it’s about ~10 cables in true octopus fashion to connect everything. The cables must be connected in the correct order to get everything working. No output will go to the HMD if they are connected out of sequence.
Data Interpretation: We’re Still Learning
The gaming machine, meanwhile, is running FCAT VR software capture to intercept frame delivery at a software-level, which then generates files that look something like this:
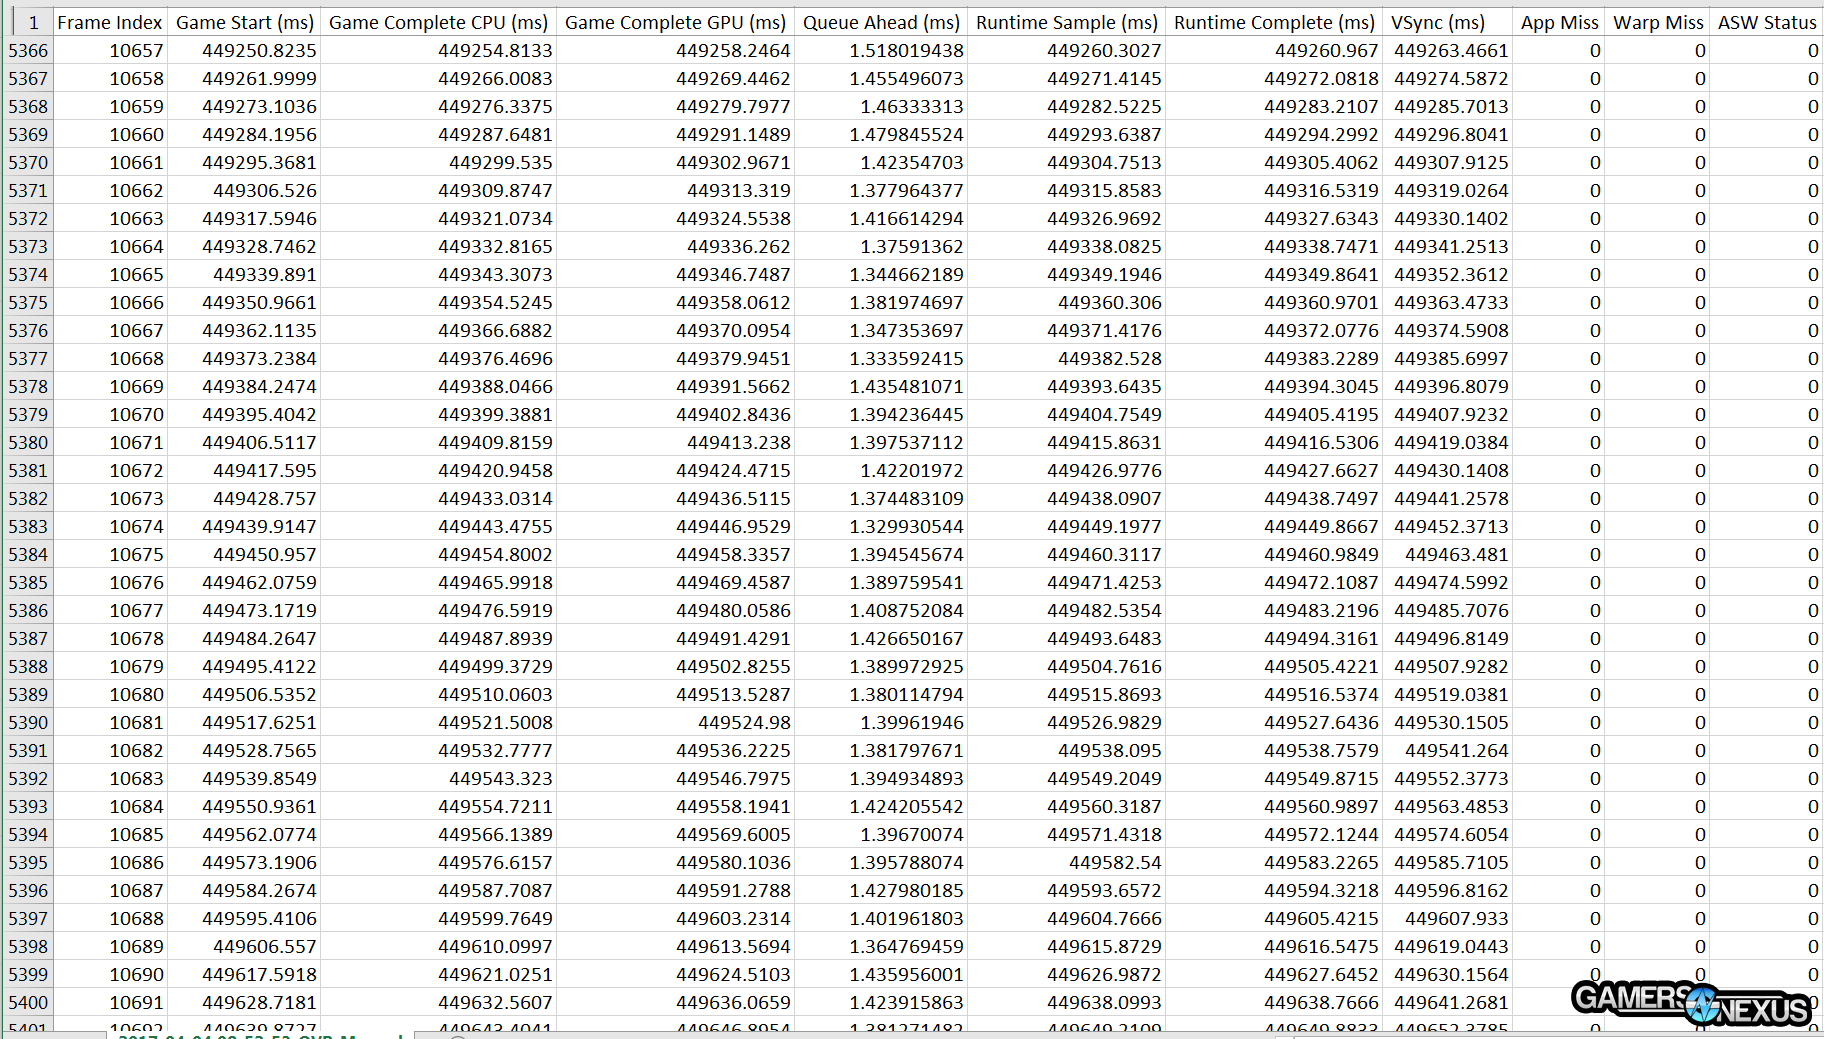
Each file contains tens of thousands of cells of data. We feed this data into our own spreadsheets and into FCAT VR, then generate both chart types from that data. The hard part, it turns out, is still data interpretation. We can identify what a “good” and “really bad” experience is in VR, but identifying anything in between is still a challenge. You could drop 100/m frames on DUT A and 0 on DUT B, and the experience will be perceptibly/appreciably the same to the end-user. If you think about it, 100 dropped frames in a 5400-interval period is still about 1.85% of all intervals missed, which isn’t all that bad. Likely not noticeable, unless they’re all clumped together and dotted with warp misses.
Defining the Terminology
We still haven’t defined those terms, so let’s do that.
Drop Frame: When the VR runtime takes the prior frame and modifies it to institute the latest head position. The VR HMD is reprojecting or adjusting the prior frame, but failing to update animation in time for the next runtime hit. With regard to animation, this is a dropped frame. With regard to user experience, we are updating in a way that avoids inducing user sickness or discomfort (provided there aren’t too many in rapid succession). We can get synthesized frames out of this.
Warp Miss: The VR HMD has missed the refresh interval (90Hz, so every ~11ms +/- 2ms), and doesn’t have time to show a new frame. There is also not enough time to synthesize a new frame. We’ve instead replayed an old frame in its entirety, effectively equivalent to a “stutter” in regular nomenclature. Nothing moves. Animation does not update and head tracking does not update. This is a warp miss, which means that the runtime couldn’t get anything done in time, and so the video driver recasts an old frame with no updates.
Delivered Frame: A frame delivered to the headset successfully (see also: Delivered Synthesized Frame).
Unconstrained FPS: A convenient metric to help extrapolate theoretical performance of the DUT when ignoring the fixed refresh rate (90Hz effective v-sync) of the HMD. This helps bring VR benchmarks back into a realm of data presentation that people are familiar with for “standard” benchmarks, and aids in the transition process. It’s not a perfect metric, and we’re still in the air about how useful this is. For now, we’re showing it. Unconstrained FPS is a calculation of 1000ms/AVG frametime. This shows what our theoretical frame output would be, given no fixed refresh interval, and helps with the challenge of demonstrating high-end device advantages over DUTs which may otherwise appear equivalent in delivered frame output.
Average Frametime: The average time in milliseconds to generate a frame and send it to the HMD. We want this to be low; ideally, this is below 11ms.
Interval Plot: A type of chart we’re using to better visualize frame performance over the course of the headset’s refresh intervals. In a 60-second test, there are 5400 refresh intervals.
Warp misses are miserable experiences, particularly with multiple in a big clump. Warp misses intermixed with drop frames illustrate that the hardware cannot keep up with the game, and so the user experiences VR gameplay that could feel unpleasant physiologically in addition to mechanically.
Learn more about these definitions here, in our previous content. We also spoke with Tom Petersen about these terms.
Test Methodology: Streaming Benchmarks
Stream benchmarking is something that we’re still working on developing. This is our first implementation, and as such, it’s not fully conclusive or indicative of all game streaming performance – but it’s a start.
We’re testing using two types of streaming: (1) Twitch only, (2) Twitch & YouTube simultaneously. We’ll soon add more to this.
For Twitch, the following settings are used:
- 1080p60
- 6Mbps
- H264 “Faster”
For YouTube, the below:
- 1080p60
- 10Mbps
- H264 “Faster”
All of this is fed through OBS and uploaded on a 40Mbps up connection, which is sufficient for the task. We log game performance during streaming, log stream performance, and then combine and align all of the data in spreadsheets later. It’s a manual process right now, but that’ll improve with time.
For now, we’re just using DiRT: Rally on a looping benchmark for 240s. As we continue to improve our understanding of game broadcasting, we’ll add more titles. For now, we wanted something that won’t receive updates and that would be reproducible. The game’s settings are 1080p, Windowed, Ultra, 4xMSAA, and with Advanced Blending enabled.
Three test passes are performed for each benchmark, producing enough data to determine the mean and if additional tests are needed to investigate outliers. Thus far, we haven’t had much of a problem with that scenario. It’s a possibility, though, particularly when relying on the network for benchmarking – hence the multi-pass solution. Our logs presently contain frametimes, framerate, and two metrics that we’re calling “delayframes” and “dropframes” (the latter terminology is from our VR benchmarking).
“Delayframes” are when the CPU couldn’t complete the encode in time to hit the 16.67ms refresh window on our 60FPS stream, but when it was close enough that it followed-up soon after the window passed. As we understand it now, this seems to happen most frequently when the CPU has the headroom to perform the encode, but is bumping into a GPU limitation – e.g. a handshake mismatch between the GPU and CPU at that particular instant.
“Dropframes” are when the CPU cannot keep up with the encoding and gaming workloads simultaneously. Because the software will prioritize local playback to streamed playback, the CPU will drop frames intended for delivery to the stream in order to better keep pace with the host system. An extreme instance might be dropping every other frame, which would have a look comparable to micro-stutter in incompatible multi-GPU gaming scenarios.
We have a lot more to learn and do here. It’s not complete, but it’s a good start.
Continue to the next page for Blender, Premiere, and Synthetic benchmarks.
Intel i9-7900X Blender Rendering Benchmark vs. 6900K, Ryzen
Using GN’s in-house Blender scene, including optimizations for rendering on CPUs (16x16) or GPUs (256x256) as appropriate, we found the i9-7900X effortlessly chart-topped all other tested products when in its stock configuration. The 7900X completed the scene render in 21.5 minutes, using its 20 threads to render 20 tiles simultaneously. This is the first CPU we’ve tested that managed to outperform a GTX 1080 with CUDA rendering, and that’s counting 256x256 GPU-optimized tile sizes. The 7900X improves over the stock i7-6900K i7 CPU by nearly 8 minutes, or a 26% reduction in time required. That’s massive generationally, and the more competitive pricing of Intel’s modern 10-core part tells us that it was folly to expect Intel didn’t have anything to compete. That said, the R7 1700 overclocked to 3.9GHz comes close to competing with its 28-minute render time, with the 7900X about 23% faster than the $310 part.
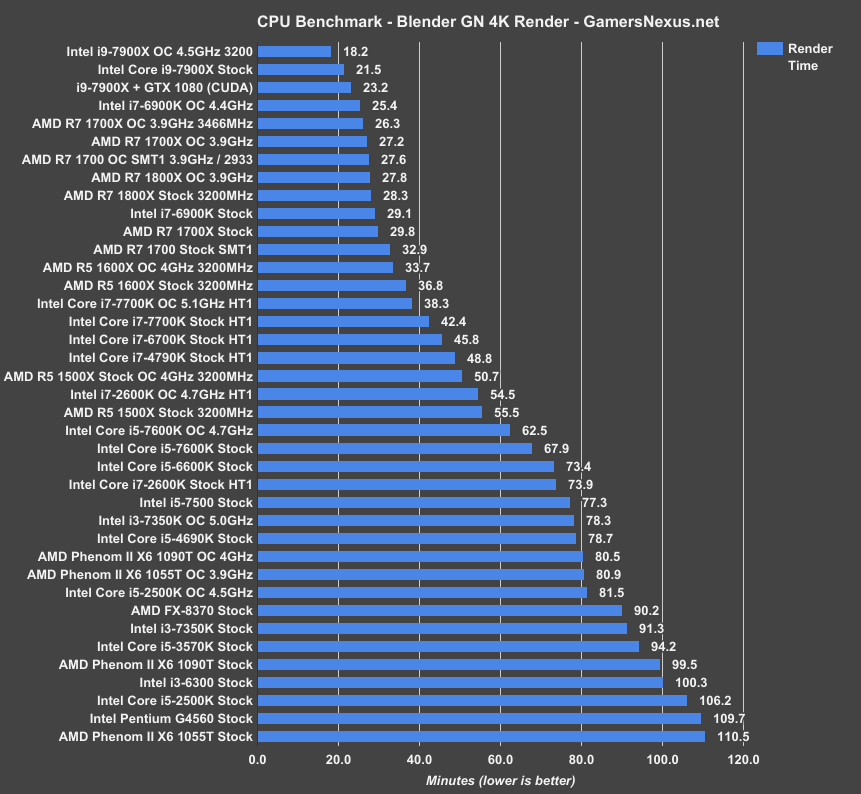
Regardless, there’s no denying Intel’s lead here – for production studios that have budget and would kill for that extra render time, this CPU is a winner. The overclocking headroom to 4.5GHz gets us below 20 minutes, which is also a noteworthy feat. Ryzen, though, should give everyone pause on pricing. If absolute top-end production isn’t the objective and the buyer is more of an enthusiast or artist without a studio budget, the R7 chips can be overclocked to compete reasonably and would be a good buy. They are ultimately a different class of hardware, though, particularly with X299’s memory advantages.
Intel i9-7900X Adobe Premiere Rendering Benchmark vs. 6900K, Ryzen, CUDA
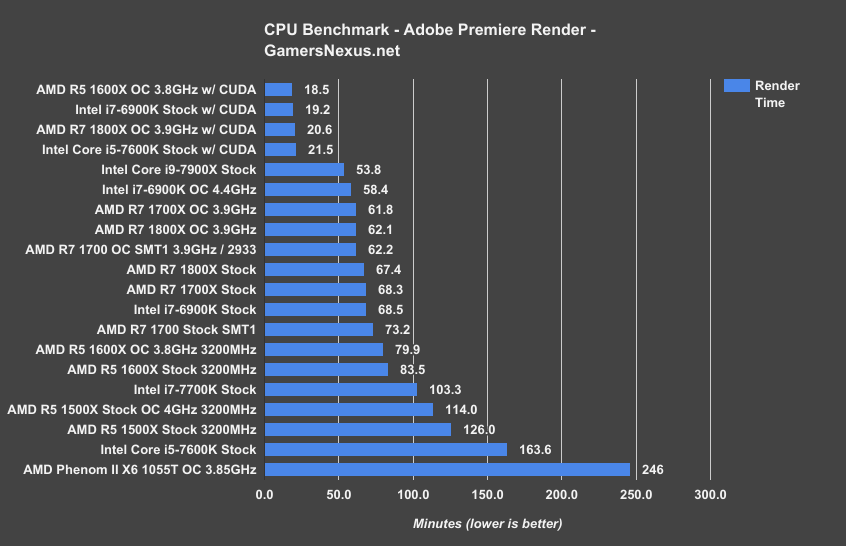
Moving to Adobe Premiere, we’re still slower than Mercury Acceleration with CUDA, but we are seeing steady improvements. Using our EVGA ICX review from February, which includes dozens of clips in various states of post-production, we find the i9-7900X completing the software render in 54 minutes – or about a 7.8% time reduction from the overclocked 6900K, and 21% reduced time required from the stock 6900K. That’s a decent jump. The R7 CPUs complete the render at around 62 minutes when overclocked, leaving the 7900X with a 13% time reduction from the overclocked R7s, though with significantly higher price.
That’s not great value for the average end user, given the $700 price hike, but it’s something production studios could consider. Then again, for this type of Premiere workload, you’re really significantly better off with a GTX 1080 and CUDA. There is something of an advantage in live scrubbing with 4K footage, as we’re learning, but we aren’t benchmarking that yet.
Intel i9-7900X Cinebench Score vs. 1800X, 1700, 6900K
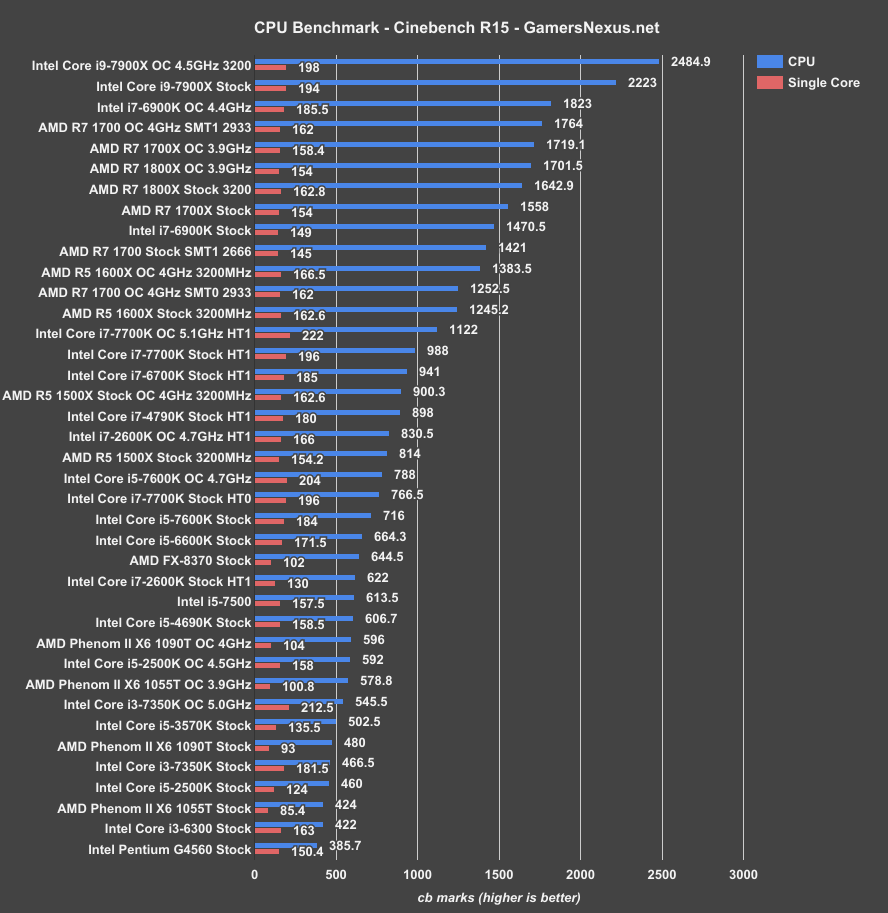
One final benchmark before the games. Cinebench is used as a synthetic tool to represent rendering, something we already did with Blender – but it’s standardized, so we’re showing it here. The i9-7900X performs impressively, scoring 2223 cb marks in the multithreaded test, which is an improvement of 22% over the overclocked 6900K, or 51% over the 6900K stock CPU. It’s no wonder AMD and Intel both like this benchmark so much – it makes their generational improvements look a lot better than we see in real-world scenarios. The 6900X runs about 26% faster than the closest Ryzen CPU on our benchmarks, which has been and remains the price-to-performance king.
Overclocking to 4.5GHz & 1.275 Vcore gets us 2485 cb marks, an improvement of ~12% over stock.
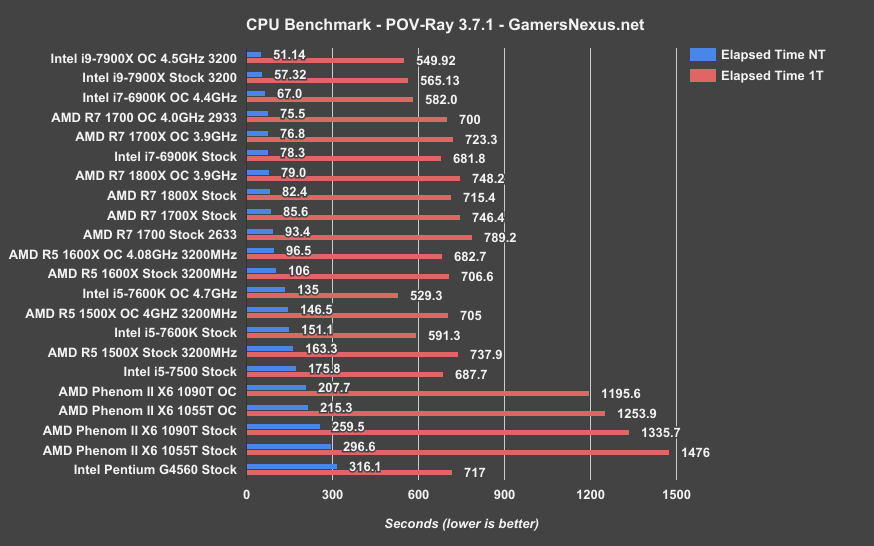
Intel i9-7900X POV-Ray Benchmark
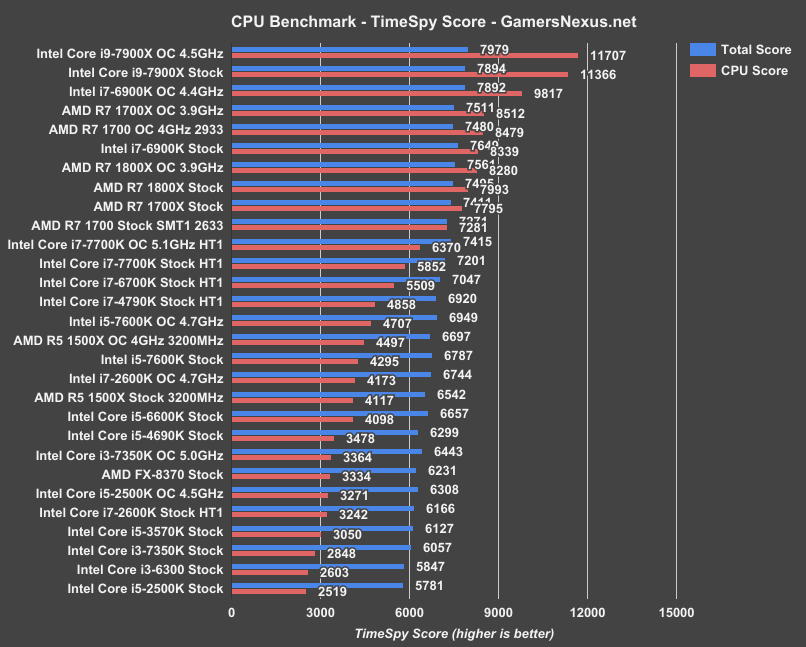
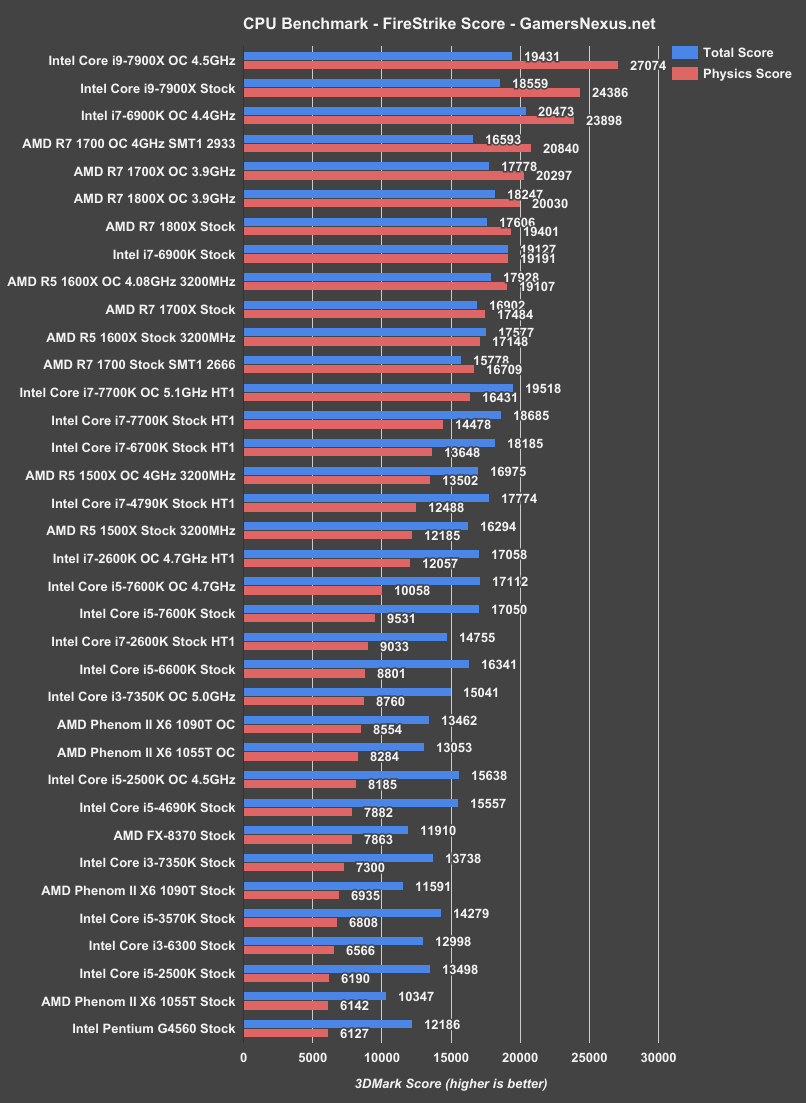
Intel i9-7900X 3DMark – Firestrike & TimeSpy
Continue to the next page for live streaming benchmarks.
Reminder: This is Brand New Testing! Still WIP.
This is the first time we’ve ever done streaming benchmarks, so there’s still a lot to develop methodologically and in presentation methods. This is pretty exciting for us to add, and will soon expand into a wider effort. For now, this is a learning experience for the site, but provides valuable information about the 7900X. Intel was big on pushing multi-stream broadcasting, so we figured we should test that.
We’ve got two main tests here, with one extra test: First, we’re testing streaming just to Twitch at 6Mbps, using H264 to encode a 1080p, 60FPS stream. Second, we’ll stream to both Twitch and YouTube simultaneously, both at 1080p60, with the bit-rates at 6Mbps and 10Mbps, respectively. Finally, we have a baseline FPS benchmark without streaming and then an NVENC benchmark, just to see how GPU encode does.
Delayframes & Dropframes
There’s a lot of data here to process, so it helps to know what metrics we’re working with. Using logging, we’re measuring what we’re calling delayframes and dropframes in addition to usual frametime and framerate metrics. Delayframes happen when the CPU can’t complete encoding the frame in time to hit its 16.67ms refresh target, and tend to be indicative of a GPU limitation, not a CPU limitation. Drop frames occur in these tests because the CPU can’t keep up with the workload, so our export ends up missing frames.
A delay frame can happen when the CPU is running uninhibited – that is, it’s not being completely bogged down by the test – and so we start bumping into GPU limitations.
We’re starting with the R7 1800X and i9-7900X in stock configuration for these tests. Testing methodology is on the “Testing Methodology” page.
Twitch Streaming Benchmark: i9-7900X vs. Ryzen R7 1800X
Let’s start with a single stream first, as it’s the most common.
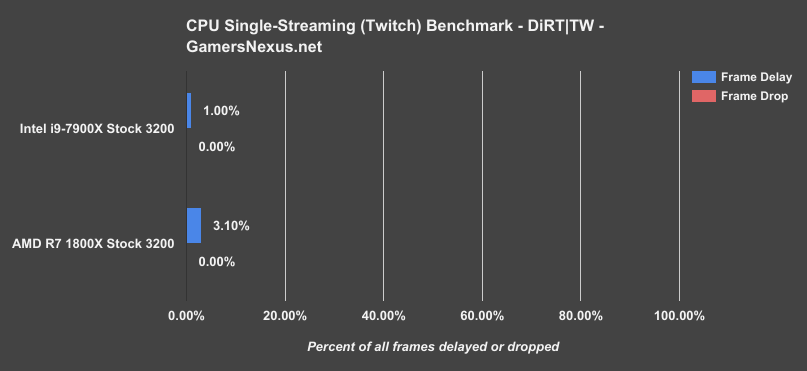
Streaming to Twitch only, we saw no dropframes on the 7900X and no dropframes on the 1800X. Both are adequate performers, with delayframes not noteworthy or perceptibly different.
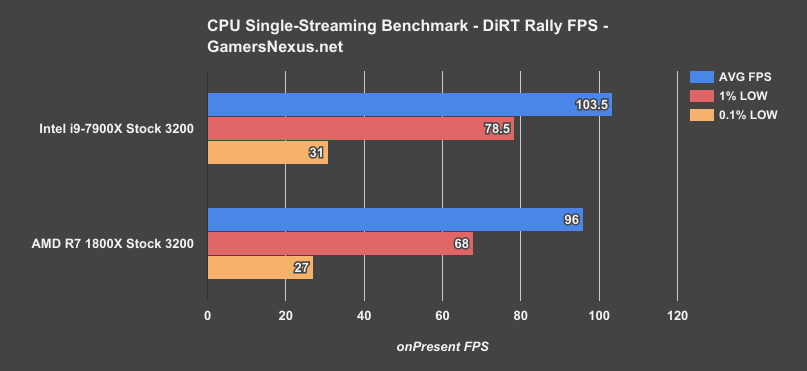
Here’s a look at the differences in terms of framerate.
The i9-7900X posts an in-game framerate of 104FPS AVG, 79FPS 1% lows, and 31FPS 0.1% lows, with the R7 1800X sustaining 96FPS AVG, 68FPS 1% lows, and 27FPS 0.1% lows. Let’s get another chart on the page:
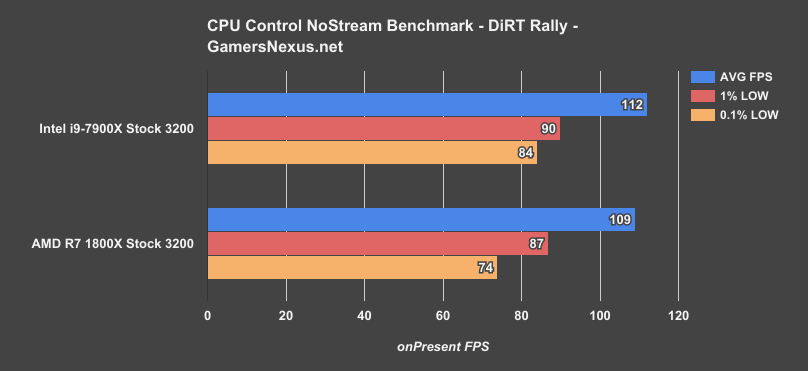
This chart shows the performance when there’s no streaming at all, with just the game being tested. We’re going from 112FPS AVG to 104FPS AVG on the i9-7900X when compared to no stream, with the 1800X going from 109FPS AVG to 96FPS AVG with the Twitch stream. The frametime performance is significantly improved when we stop streaming, and justifies why you would still want a separate capture machine for competitive gaming or games where frametime variability can affect your ability to play.
Twitch + YouTube Streaming Simultaneously: 7900X vs. AMD R7 1800X
Moving on now to our next chart, we’re looking at streaming performance when going to both Twitch and YouTube simultaneously. There’s a lot of data to process here, so we’re just going to start with a chart of Twitch performance when streaming to both services, then go to YouTube. These tests are meant to illustrate performance when outputting to two streaming destinations simultaneously, like when a user has an audience on both YouTube and Twitch. This is becoming increasingly popular, and is traditionally done with a separate capture machine to alleviate load on the gaming machine.
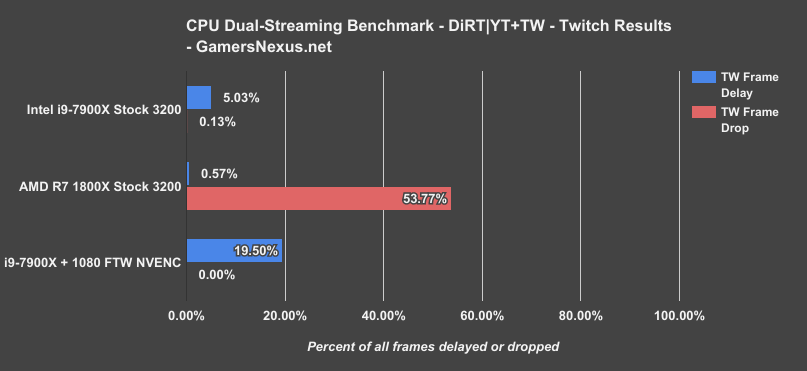
Here’s the chart. Performance to Twitch during this dual-stream benchmark posts 0.13% drop frames on the i9-7900X, averaged across multiple passes of the same duration, which is largely imperceptible to the viewer and the player. Delay frames are at 5.03%, which we think – but we’re still learning, as this is new testing – is because the CPU is performing well enough to bump into GPU limits.
The 1800X has a much harder time with this workload. AMD’s 1800X is dropping 54% of its frames to Twitch, which results in something of a slideshow for playback. For comparison, NV Encoder is still choppy for about 20% of its playback on the 1080 with the 7900X, even with two NVENC engines running. Dropping H264 from “Faster” to “ultrafast” or some lower quality setting would help the 1800X along.
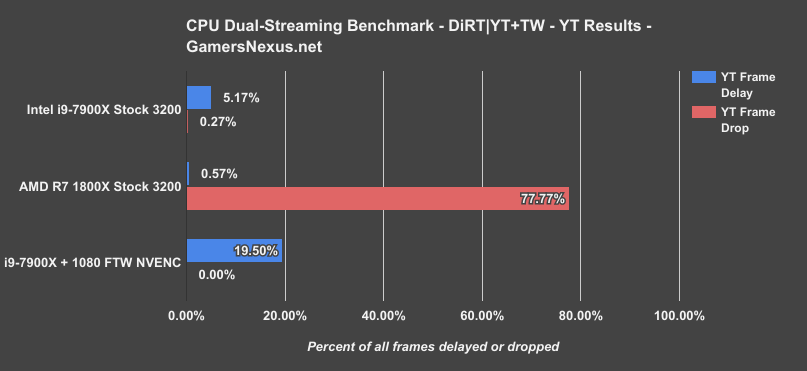
Adding the YouTube chart to the page, the i9-7900X sticks to well below 1% of total frames dropped, with GPU frame lag still around the same level. AMD sees about 78% of its frames dropped here and struggles with this H264 profile and dual stream outputs. To make things easier to understand, we have the actual stream footage that went to YouTube in our video review. Again, remember that while this is going on, we’re also exporting to Twitch – so there’s a lot of encoding going on, and the extra four threads really help Intel out in this particular use case.
Just for sake of understanding performance, here’s a screenshot of utilization on the Ryzen system and on the Intel system when under this intense workload.
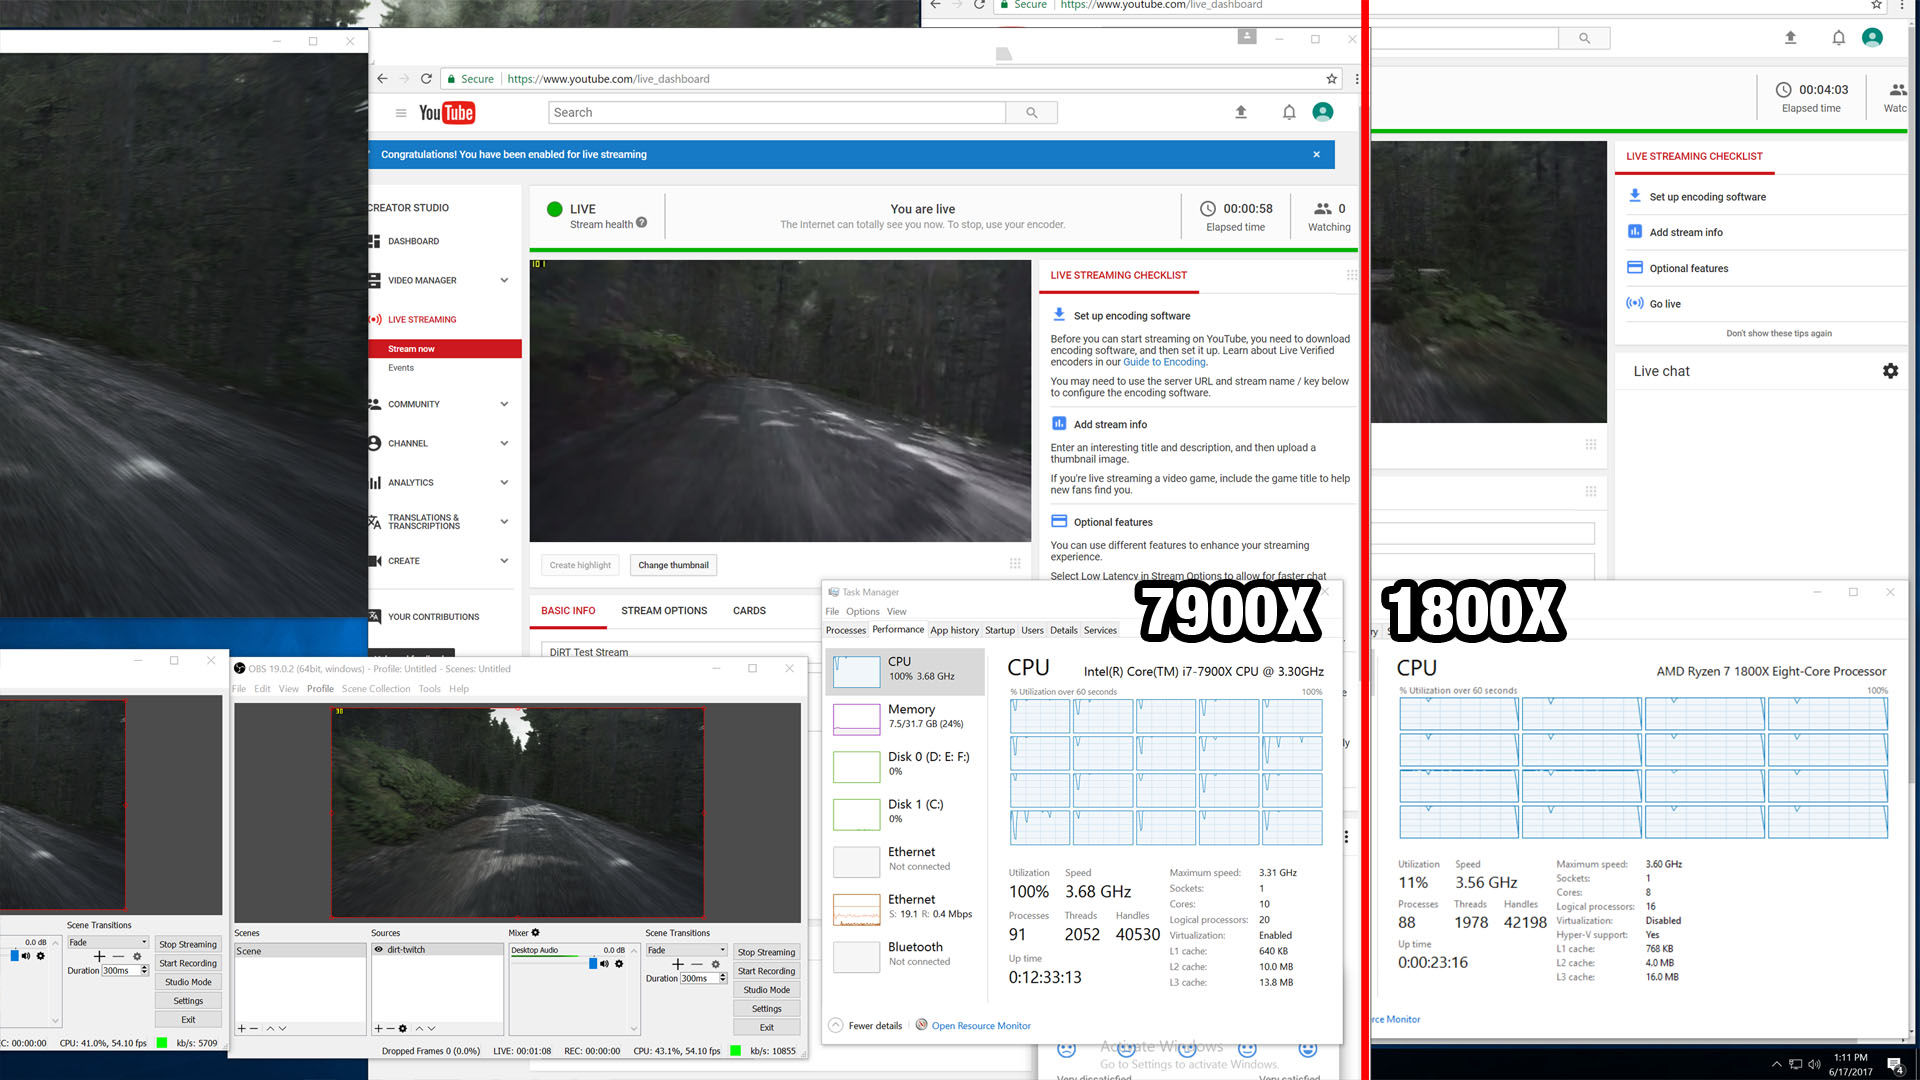
NOTE: People in the YouTube comments seem to be having a hard time with this image. Look at the histograph, not the utilization number. Clearly the right screenshot was taken after the stream terminated. Thought that was more obvious.
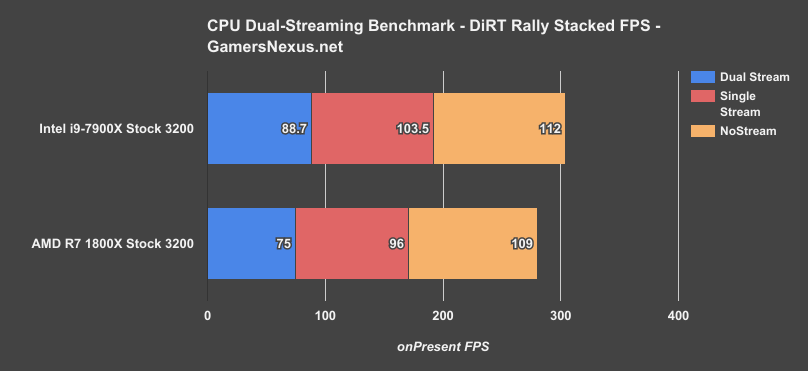
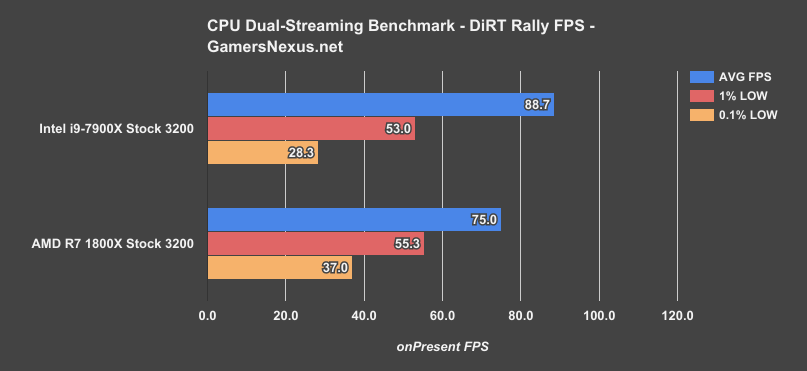
As for FPS, this is what that looks like. This stacked chart shows average FPS of all three tests. We’re down to 75FPS AVG on the 1800X – still fine, if it weren’t for the streams struggling with playback – and 89FPS AVG on the 7900X.
Now we’re faced with the new challenge of analyzing what this means.
Well, first of all, the disparity between the unstreamed content and the streamed content doesn’t show up too much in averages, but really shows up in frametimes. We moved from greater than 70FPS 0.1% lows on both CPUs to around 30FPS on each when dual streamed, and can show a frametime chart to drive that home better.
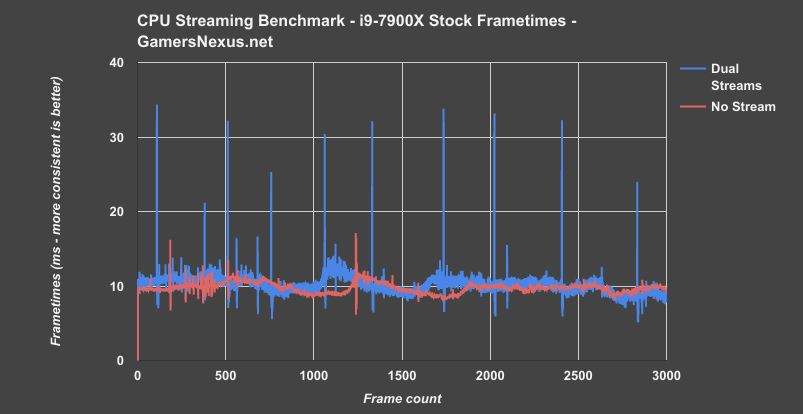
(Showing 0-3000 of >25,000 frames.)
This frametime chart shows dual streams versus no stream on the i9-7900X, clearly illustrating the improved frametime consistency on the benchmark without the streams running. That’s where those 0.1% low numbers are derived – high variability in frame-to-frame latency.
With all of that detailed, a few notes: The Intel i9-7900X is an impressive CPU for this use case scenario, certainly. If you must stream to two sources simultaneously, and if you cannot build a secondary capture machine, then this isn’t a bad solution; in fact, at $1000 for the CPU, it may actually be cheaper than building a dedicated capture machine in addition to the gaming machine.
But you also lose performance. For people who stream competitive games and can’t risk frametime variance, we’d still recommend a standalone stream capture machine in addition to the gaming machine. That is the surest way to eliminate frame-to-frame latency that’s introduced by on-the-fly encoding.
Ryzen does well with a single stream and dominates the price-to-performance argument, particularly considering you could buy an R7 1700, overclock it, and get the same or better performance than the 1800X. And that’d run you way cheaper than a 7900X, while retaining imperceptible differences for a single 1080p60 stream. That said, the 7900X crushes Ryzen in our dual-streaming test. That’s not to say the R7 CPUs couldn’t do it, you’d just have to make a lot more quality sacrifices.
Both CPUs have their place in these various scenarios, as does a capture machine.
Continue to the next page for VR benchmarks.
Read the Debut of This Testing
Let’s move on to another hard set of benchmarks: VR testing. We debuted our VR testing methodology in our R7 1700 versus i7-7700K VR benchmarks, where we noted that the CPUs were imperceptibly different from one another. You would absolutely not be able to confidently tell the difference in a blind test. If you didn’t see our previous VR tests, we’d strongly recommend reading or watching those for a full description of how this procedure works. It’s the most complicated benchmarking we’re currently doing, and we’re not going to re-explain everything here. Check the previous content for that.
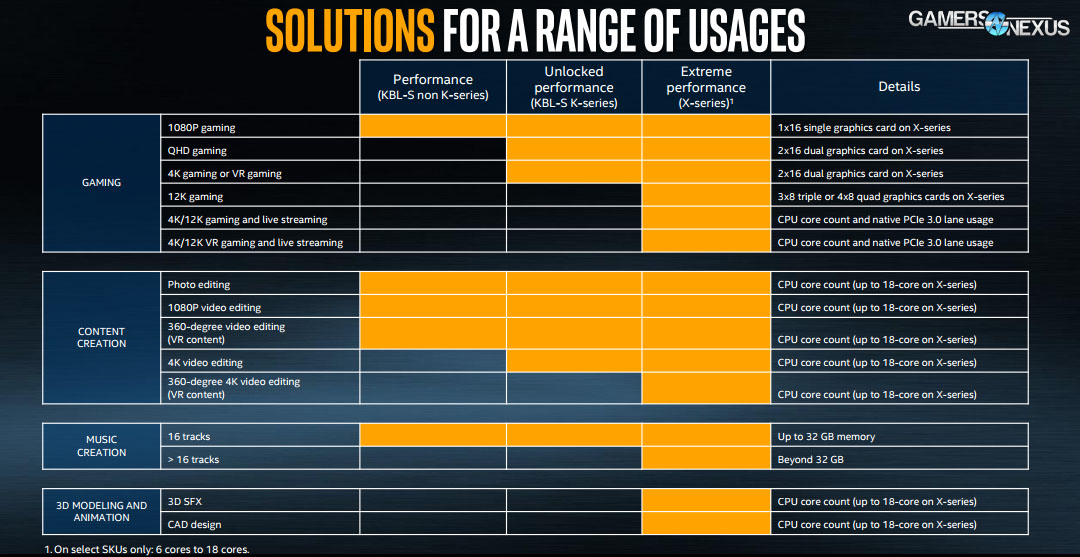
Intel’s Marketing
But the real reason to reintroduce these benchmarks is to sort of prove a point about Intel’s marketing. Leading up to launch of this X series of CPUs, Intel’s marketing slides would lead you to believe that their highest-end products are required for VR gaming, particularly with their note that desktop CPUs without a K demarcation are unfit for VR. That’s plainly false, seeing as Oculus recommends an i5-4590 CPU or better and Vive also recommends an i5-4590 or better, neither of which is a K-SKU. We’ve also benchmarked VR intensively and can attest to non-K performance being fine with the higher-end products.
Before diving further into this criticism of marketing, let’s look at the numbers. The main point here is to compare the 7700K to the 7900X, seeing as Intel indicates the 7900X is a huge step-up from the 7700K for gaming. We do have 1700 numbers, and we have shown them in great detail before, but the main point is Intel vs. Intel, here, seeing as their marketing is self-targeting.
Elite: Dangerous Hardware & Software Capture of i9-7900X
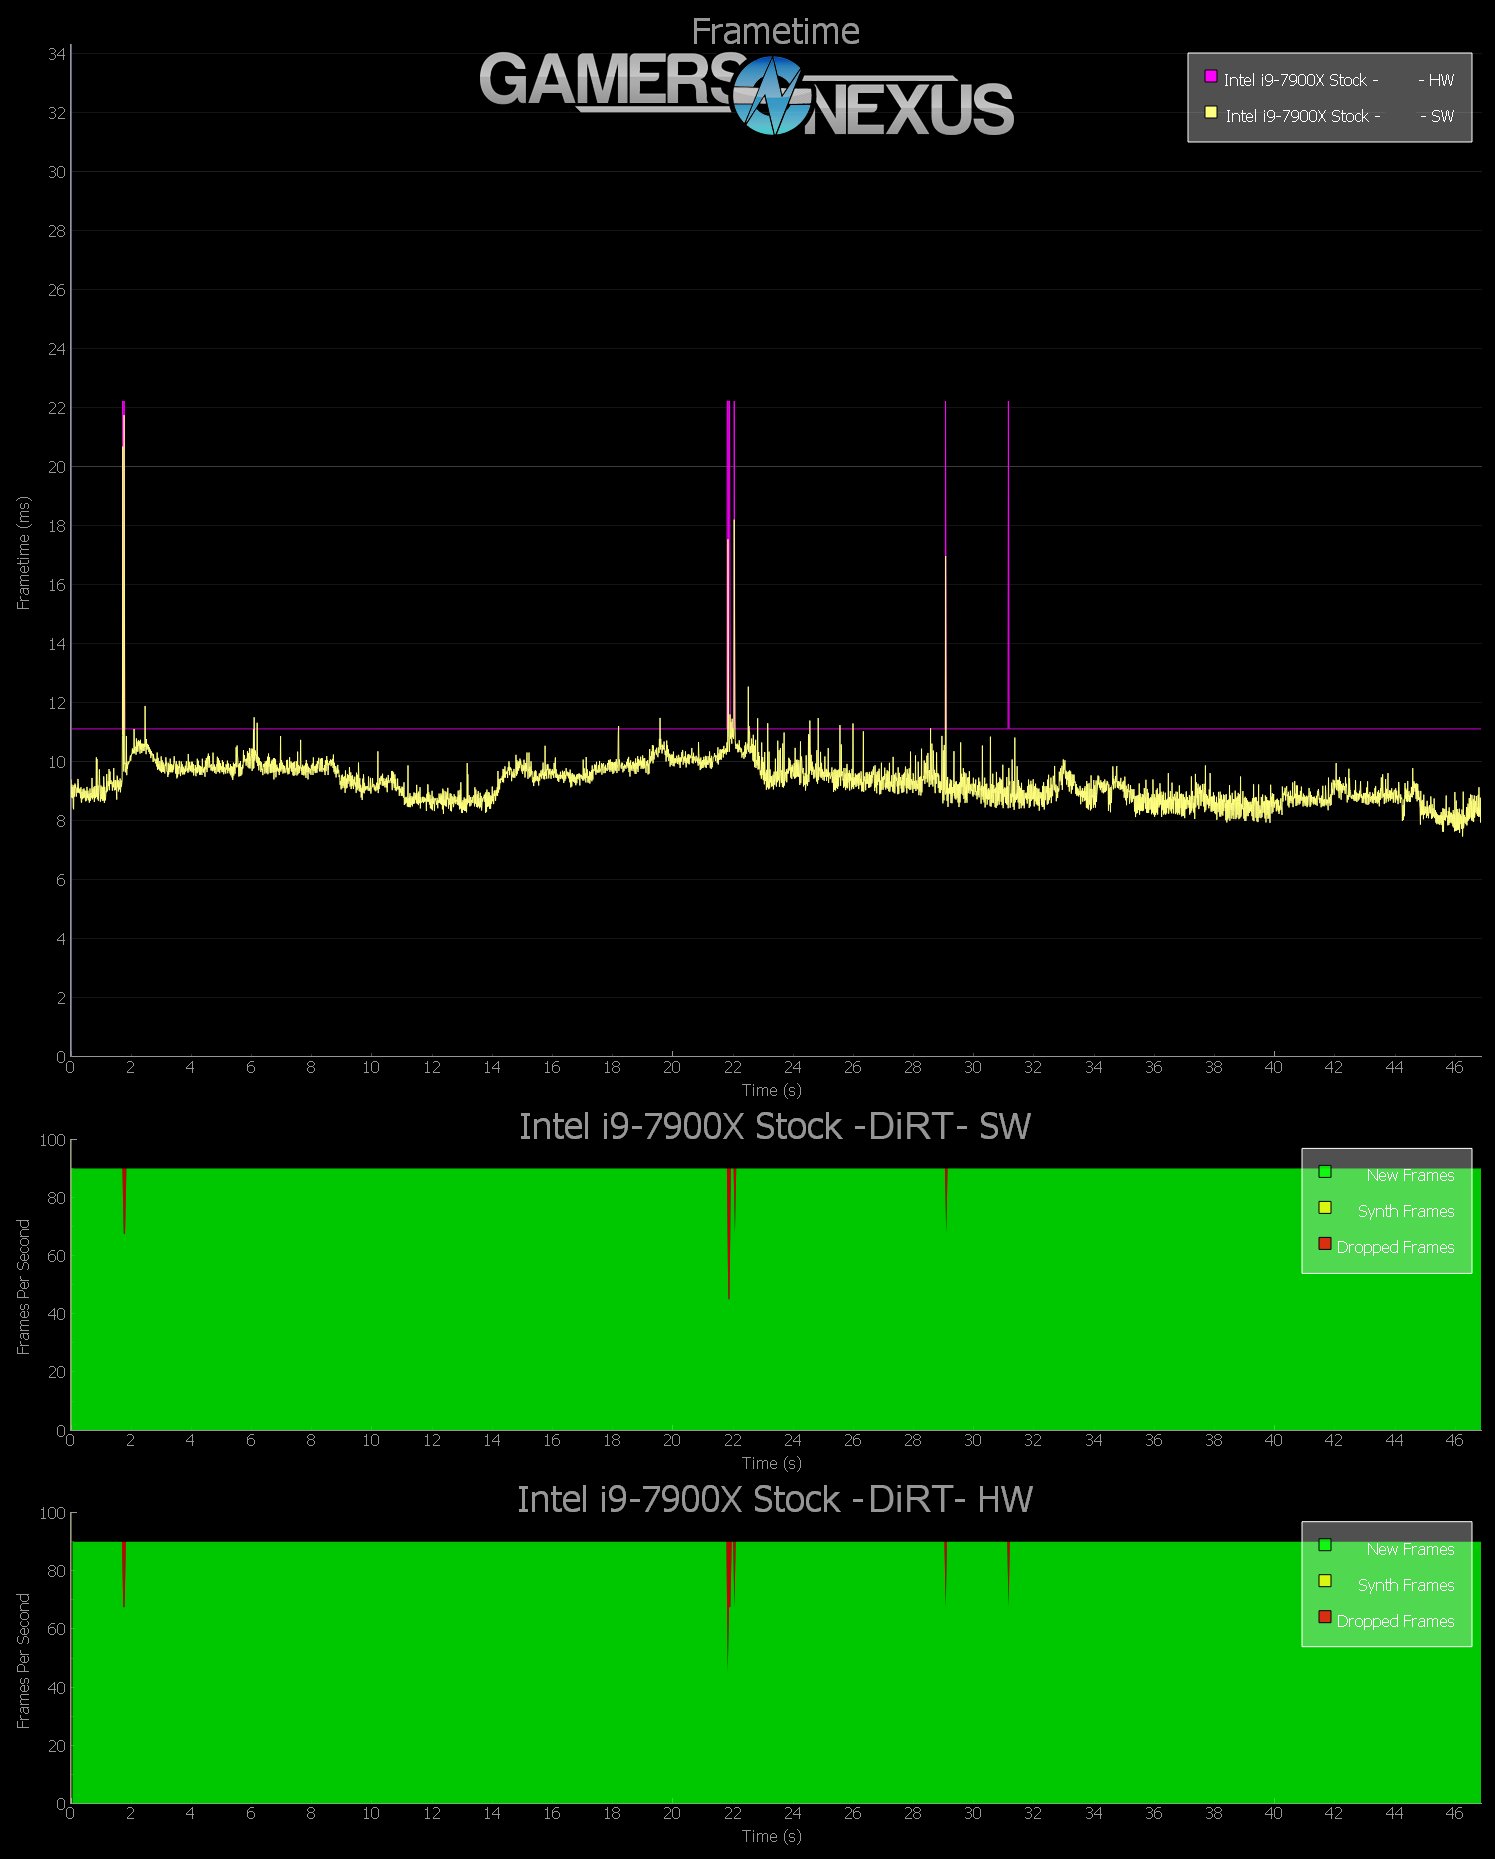
First, here’s an Elite: Dangerous chart of hardware and software capture of the i9-7900X overlayed, showing that the hardware capture – which is done by a separate capture machine – aligns with the software capture performance behavior.
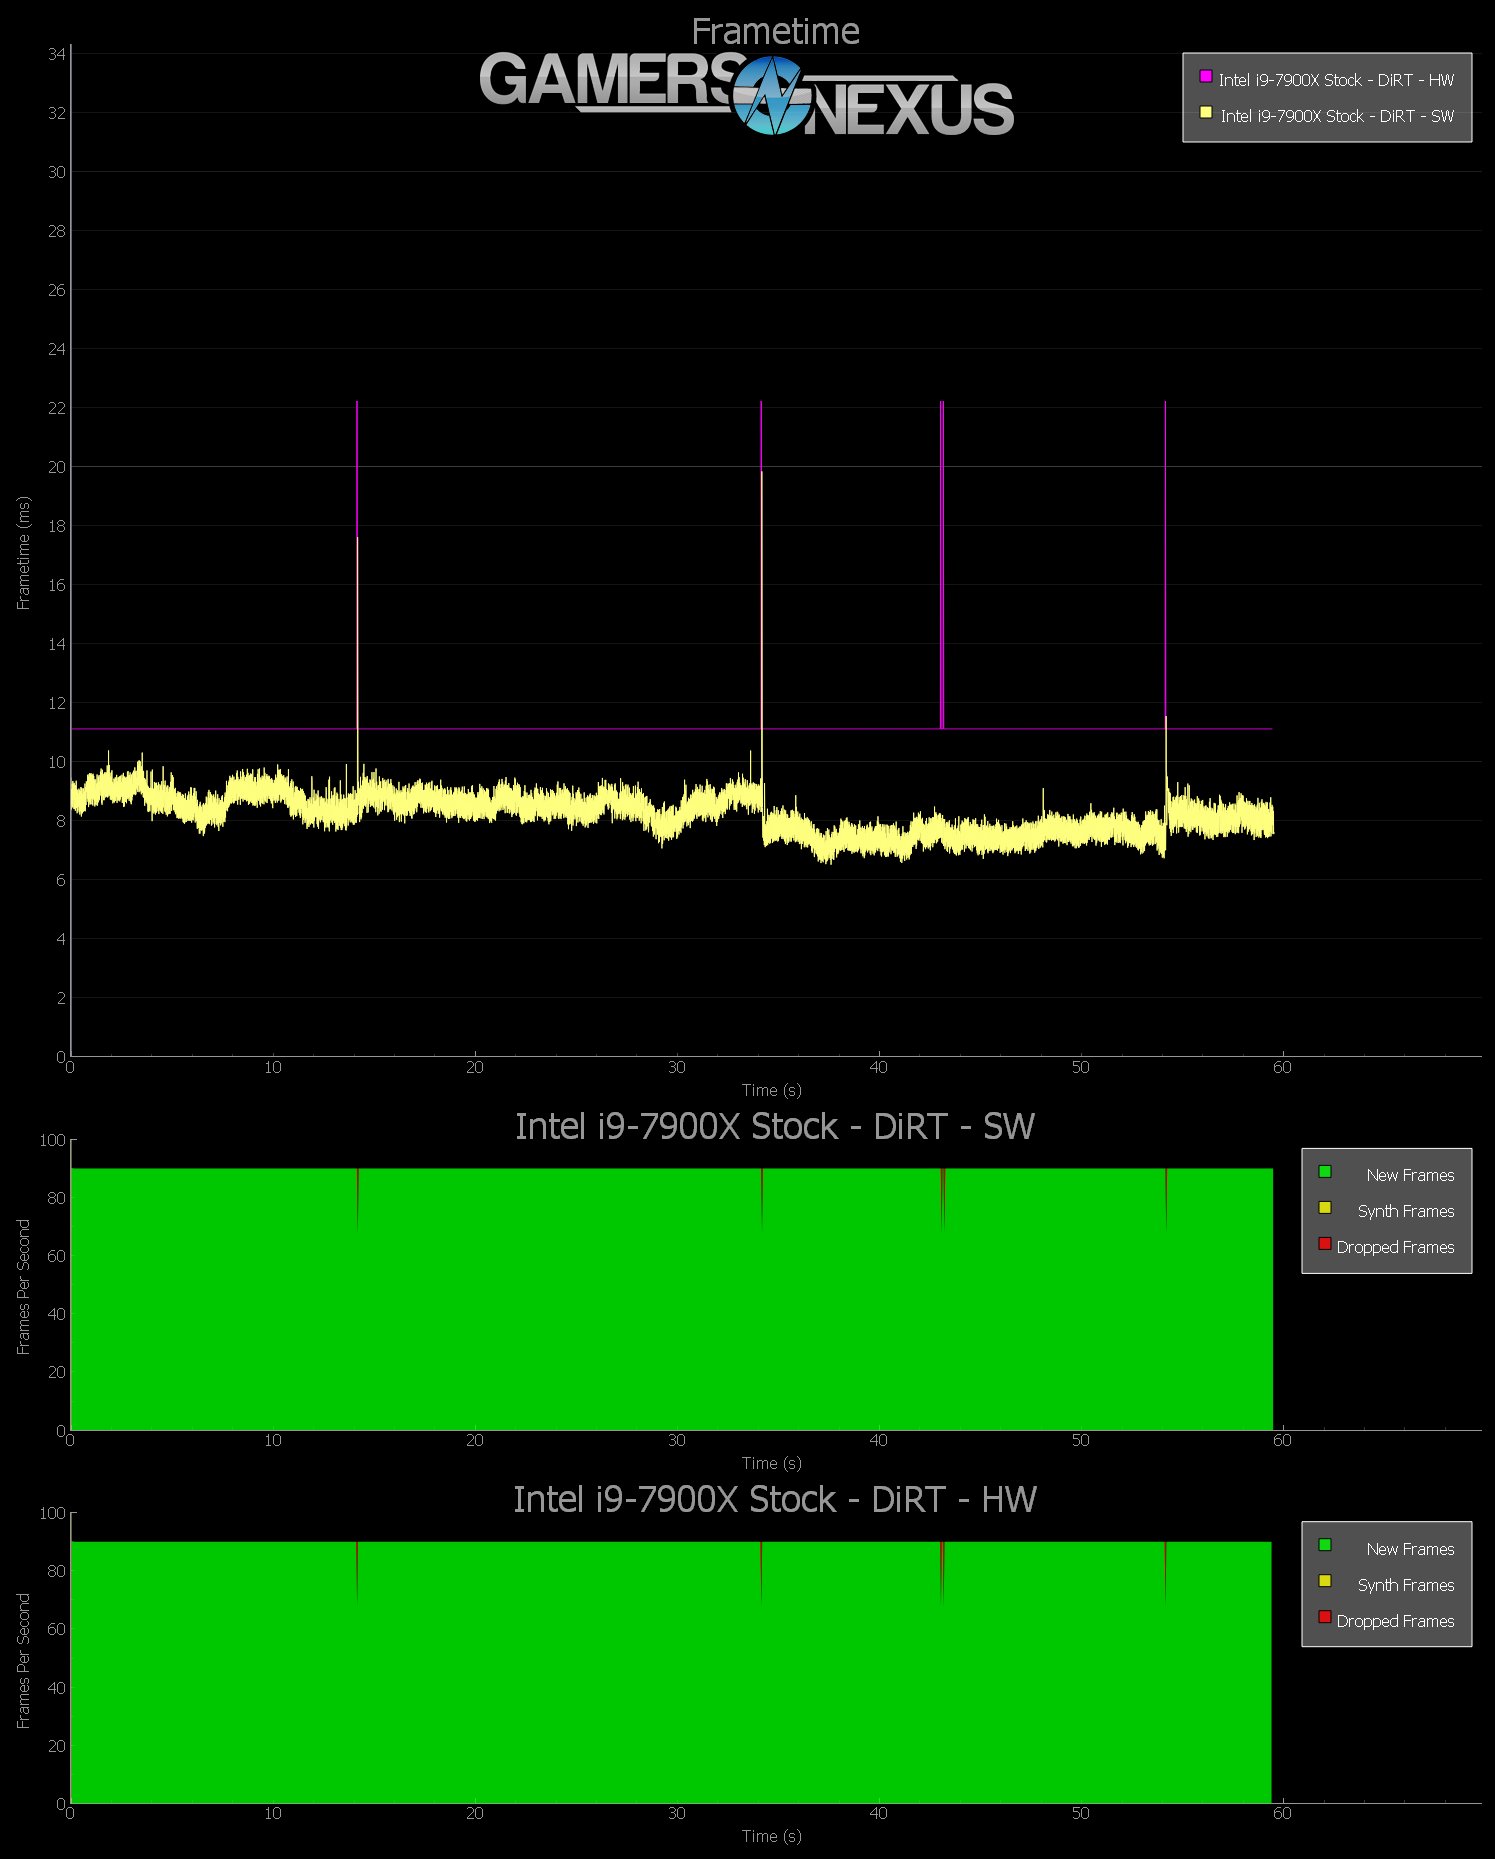
The i9-7900X is experiencing some dropframes, but no warp misses – that’s good, but also expected. No user will ever realistically notice this imperceptible amount of dropframes. We’re talking 5 or so drop frames out of 5400 intervals. That’s completely undetected by a human. You can find the other hardware capture charts in the article.
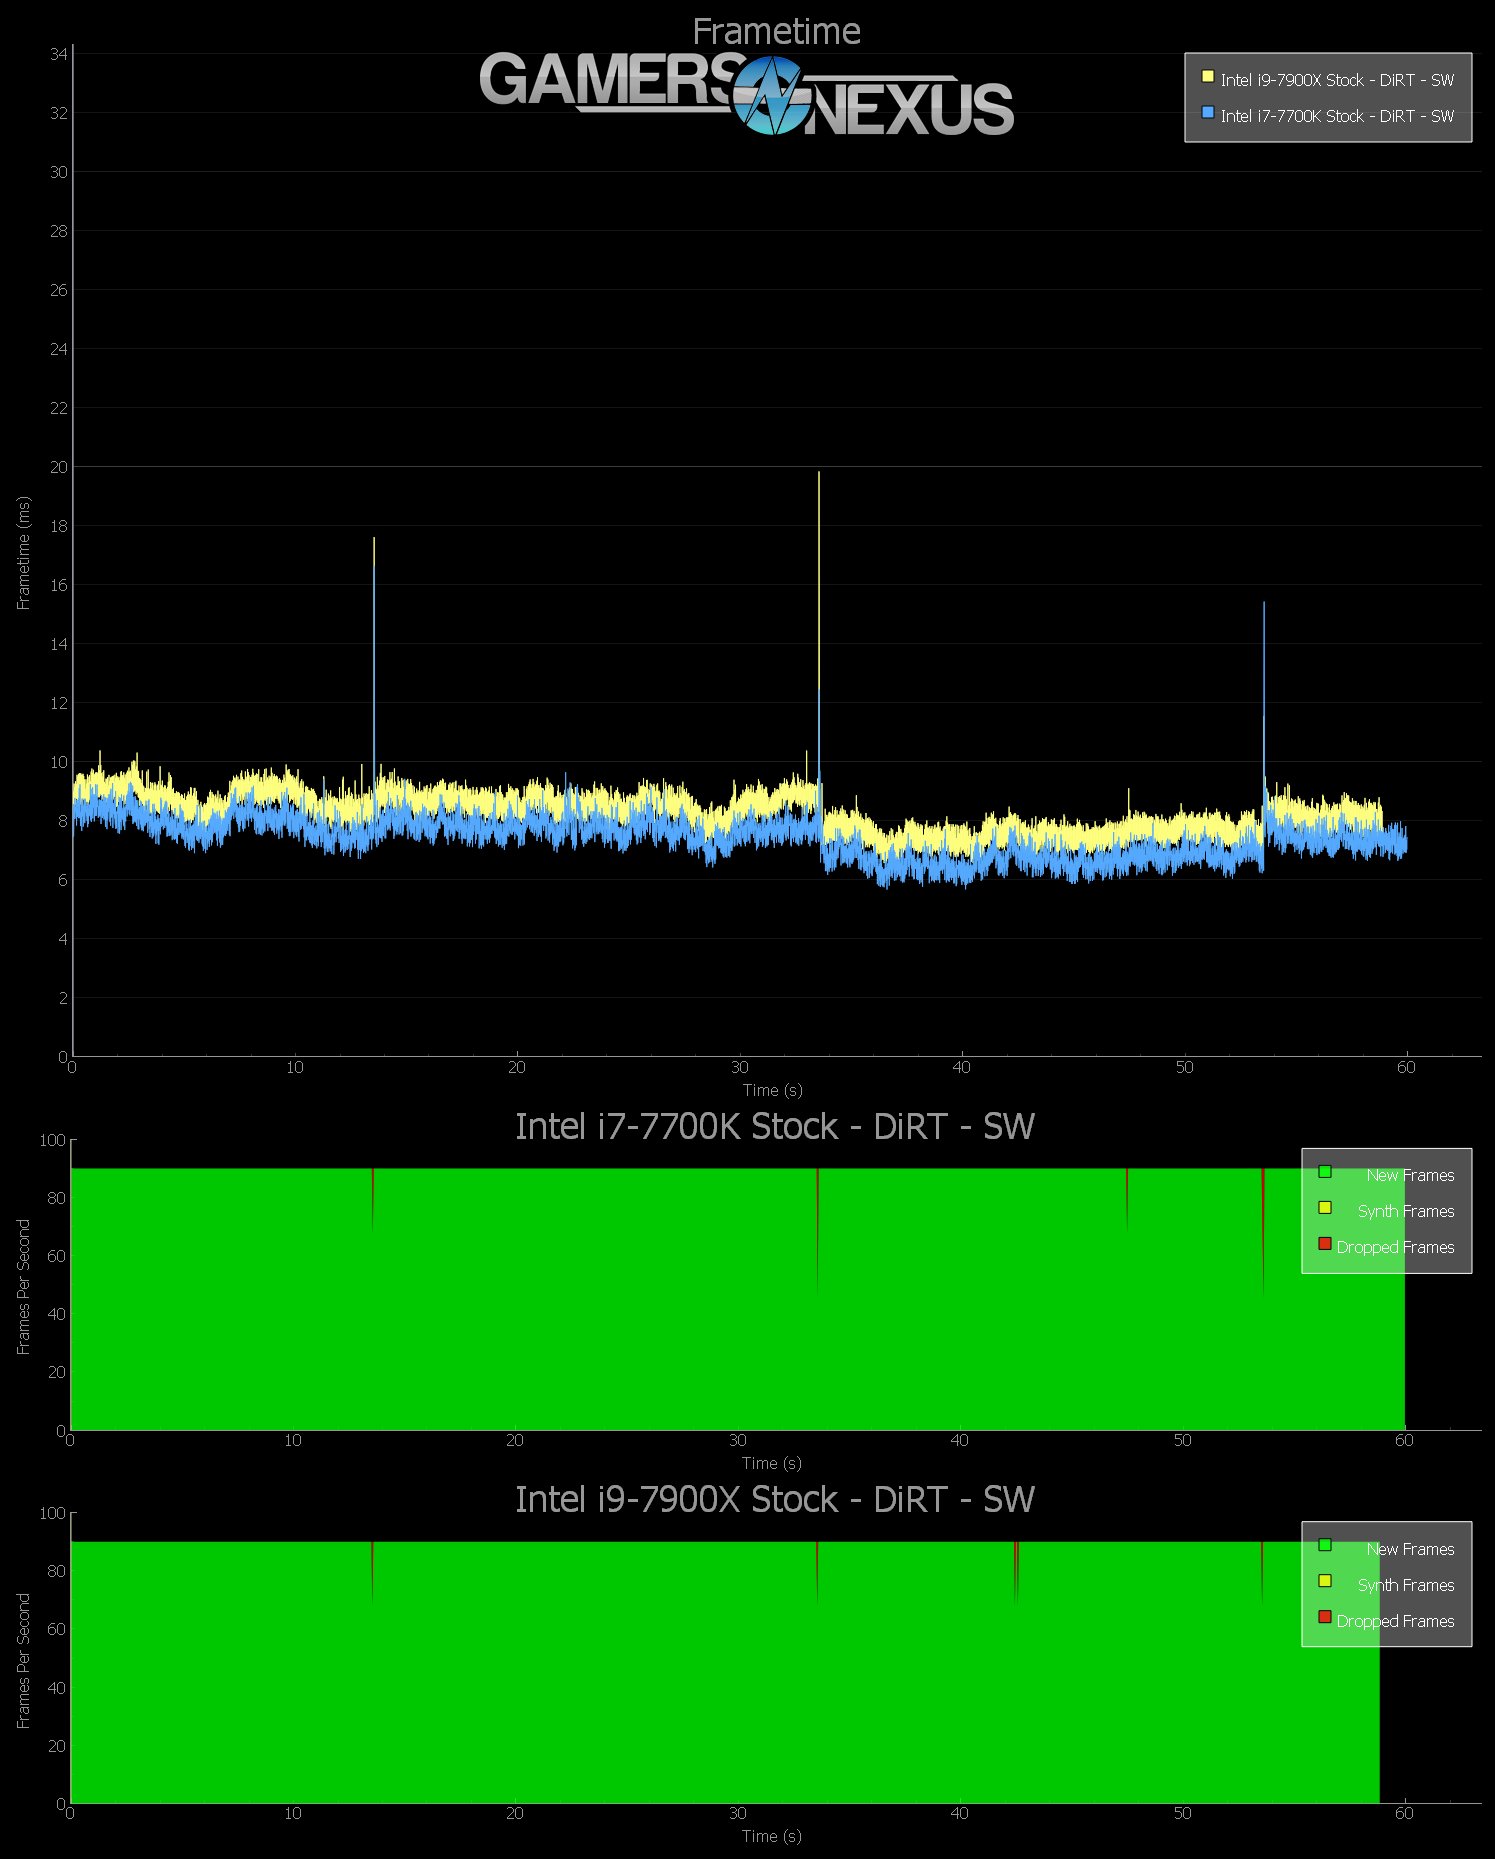
Elite: Dangerous – 7900X vs. 7700K VR Benchmarks
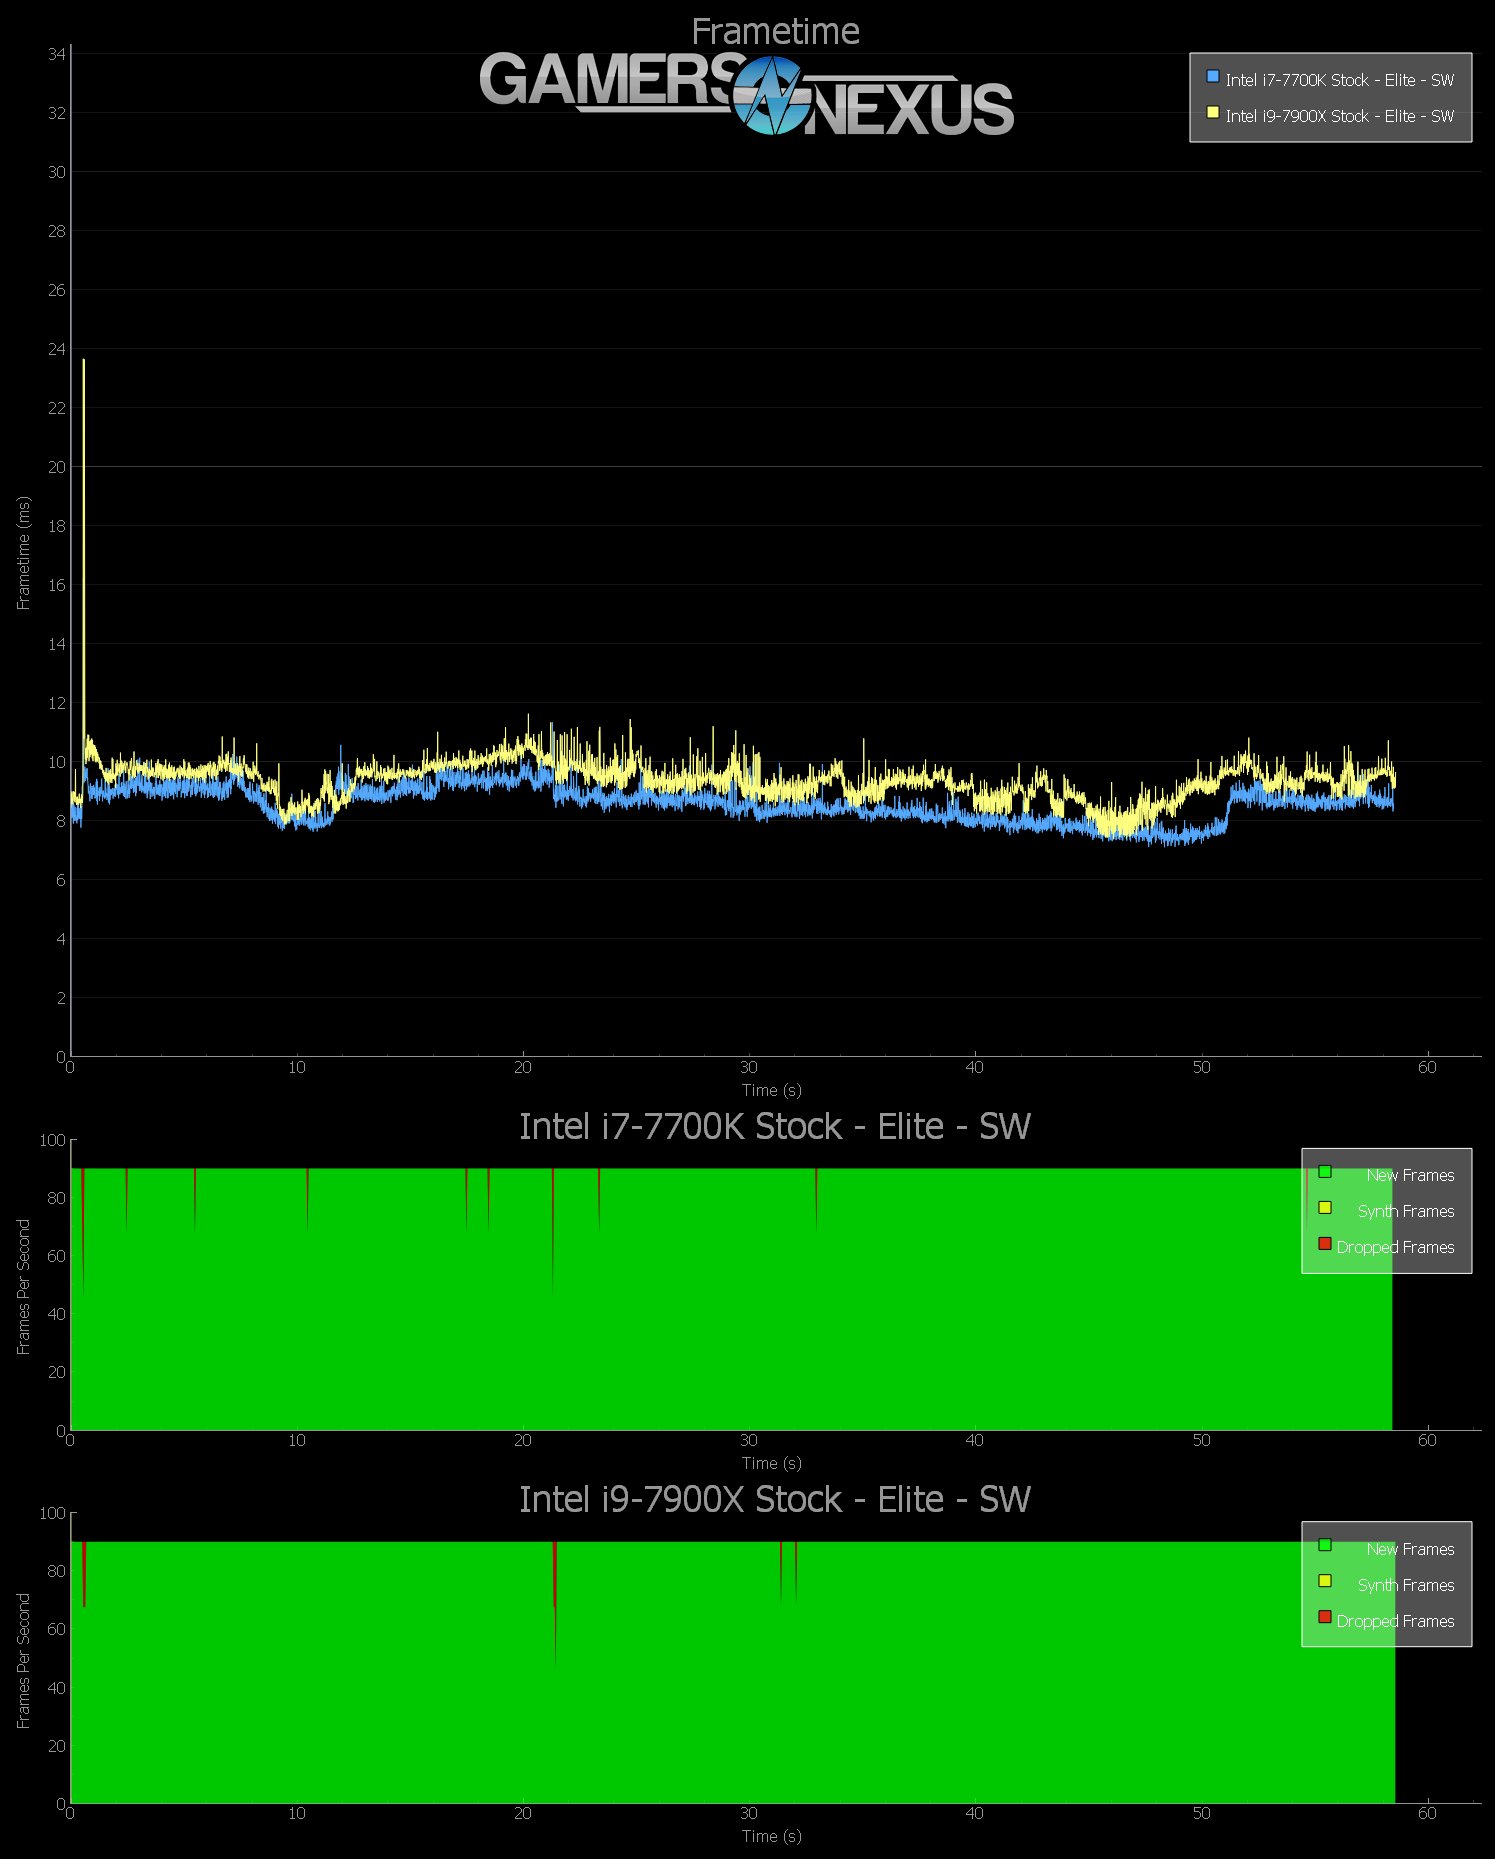
Let’s look at Elite: Dangerous versus the 7700K, shown in blue. The i7-7700K technically outperforms the 7900X here, and that should be somewhat expected – it’s a clock advantage, which is often more beneficial than a thread advantage. That said, the difference is again imperceptible. The two CPUs are effectively identical in perceived performance. But if you were buying for VR gaming and nothing else, this shows that the 7900X is not only unnecessary for VR, but technically closer to the 11-13ms frametime cutoff point before entering into dropframe and warp miss territory, whereas the 7700K stays closer to 9ms average frametimes. Again, with a 90Hz interval, we need to hit that 11ms-13ms target prior to the runtime kicking in and applying warps and finalizing animation.
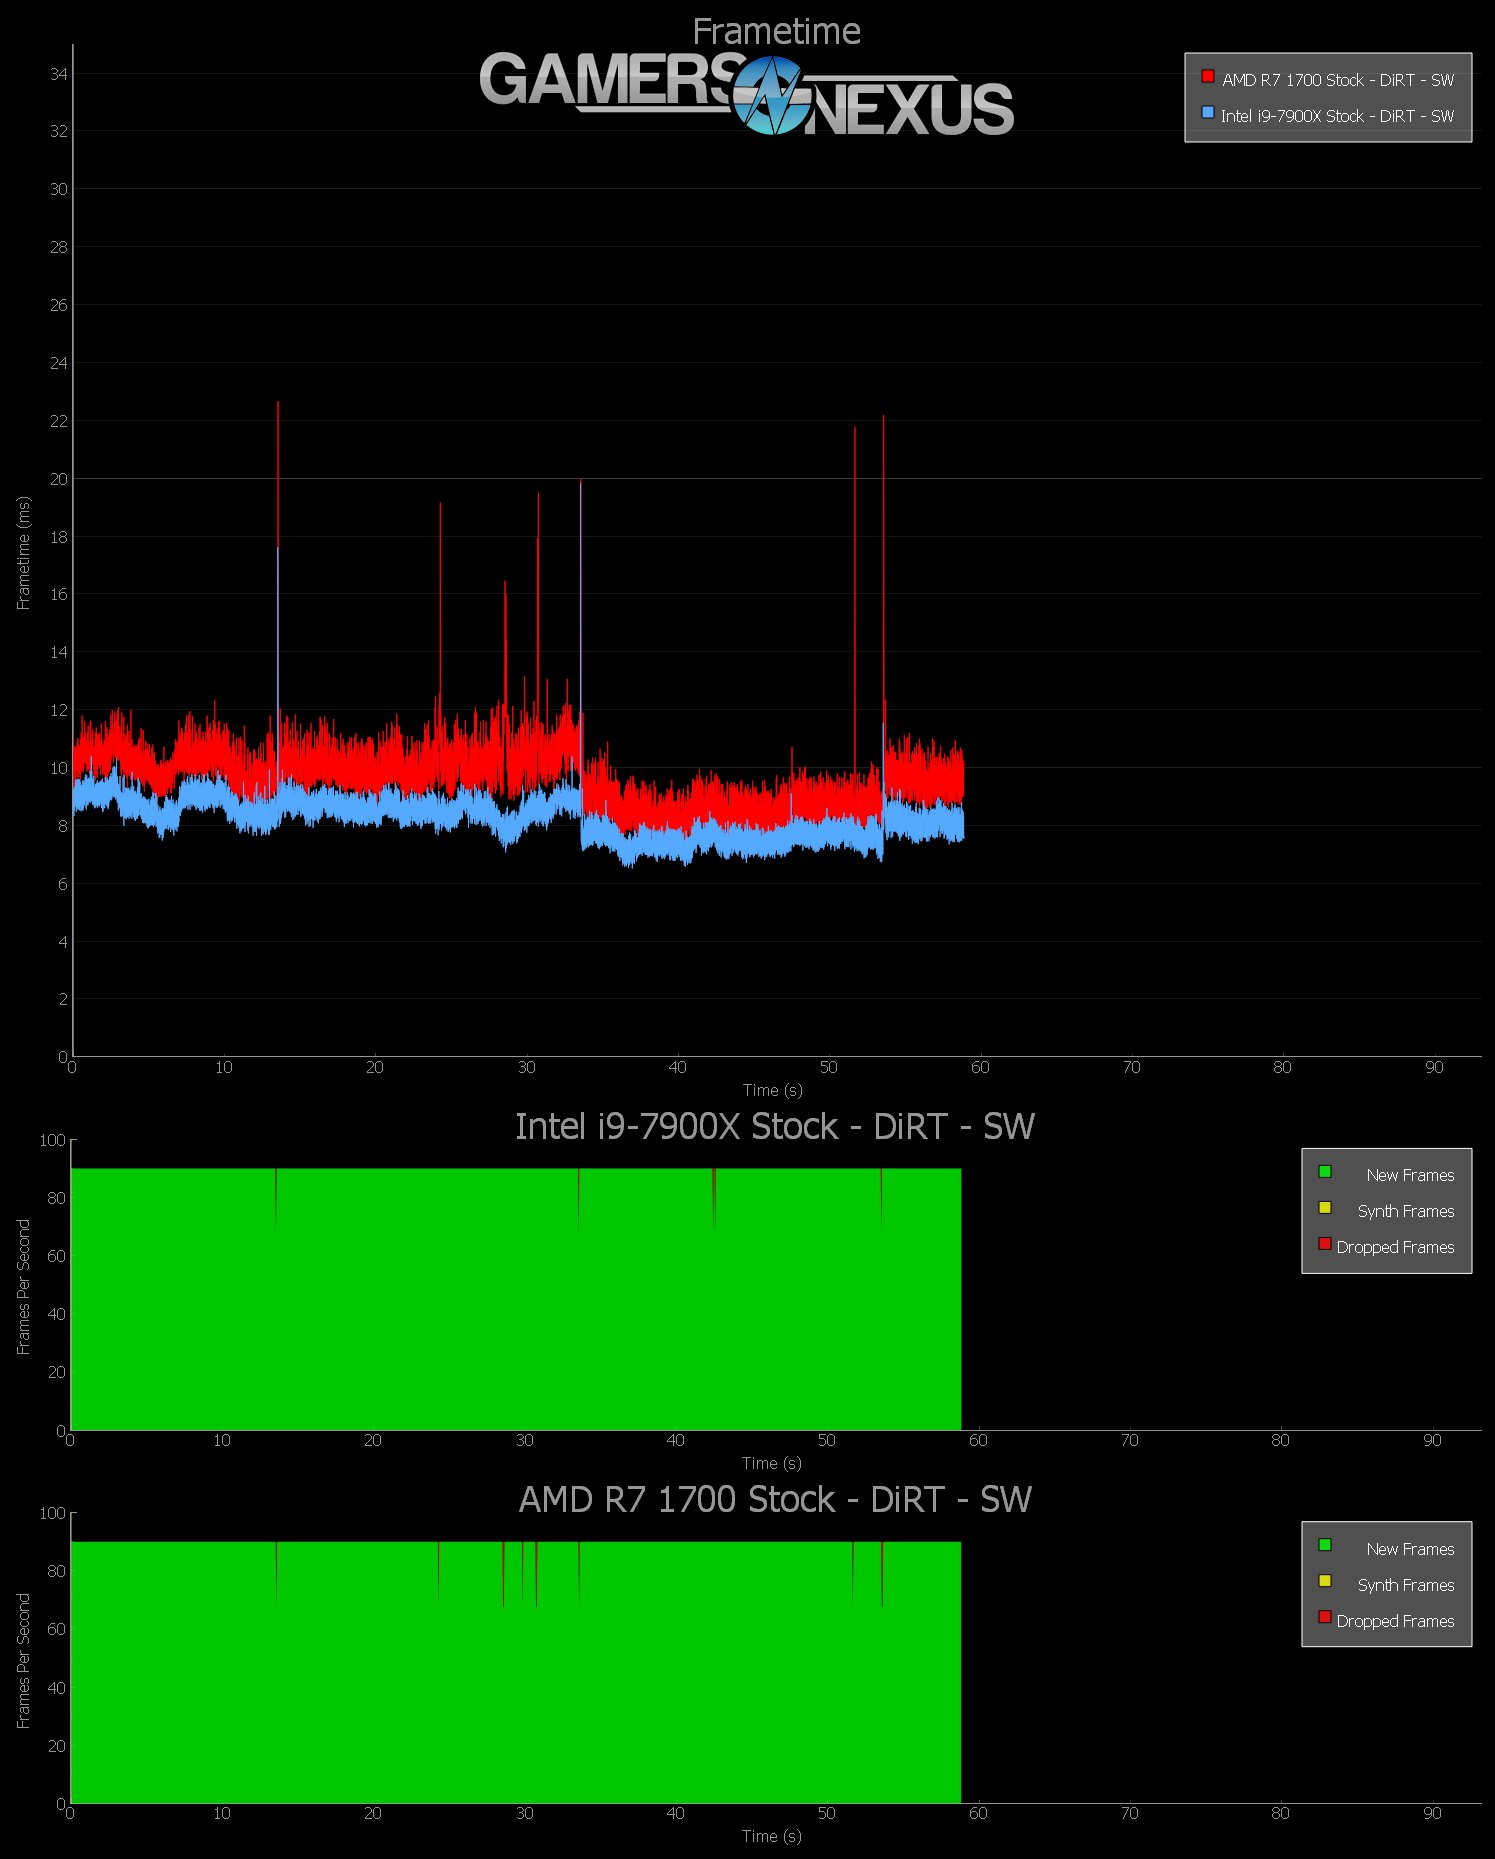
Elite: Dangerous – 7900X vs. R7 1700 VR
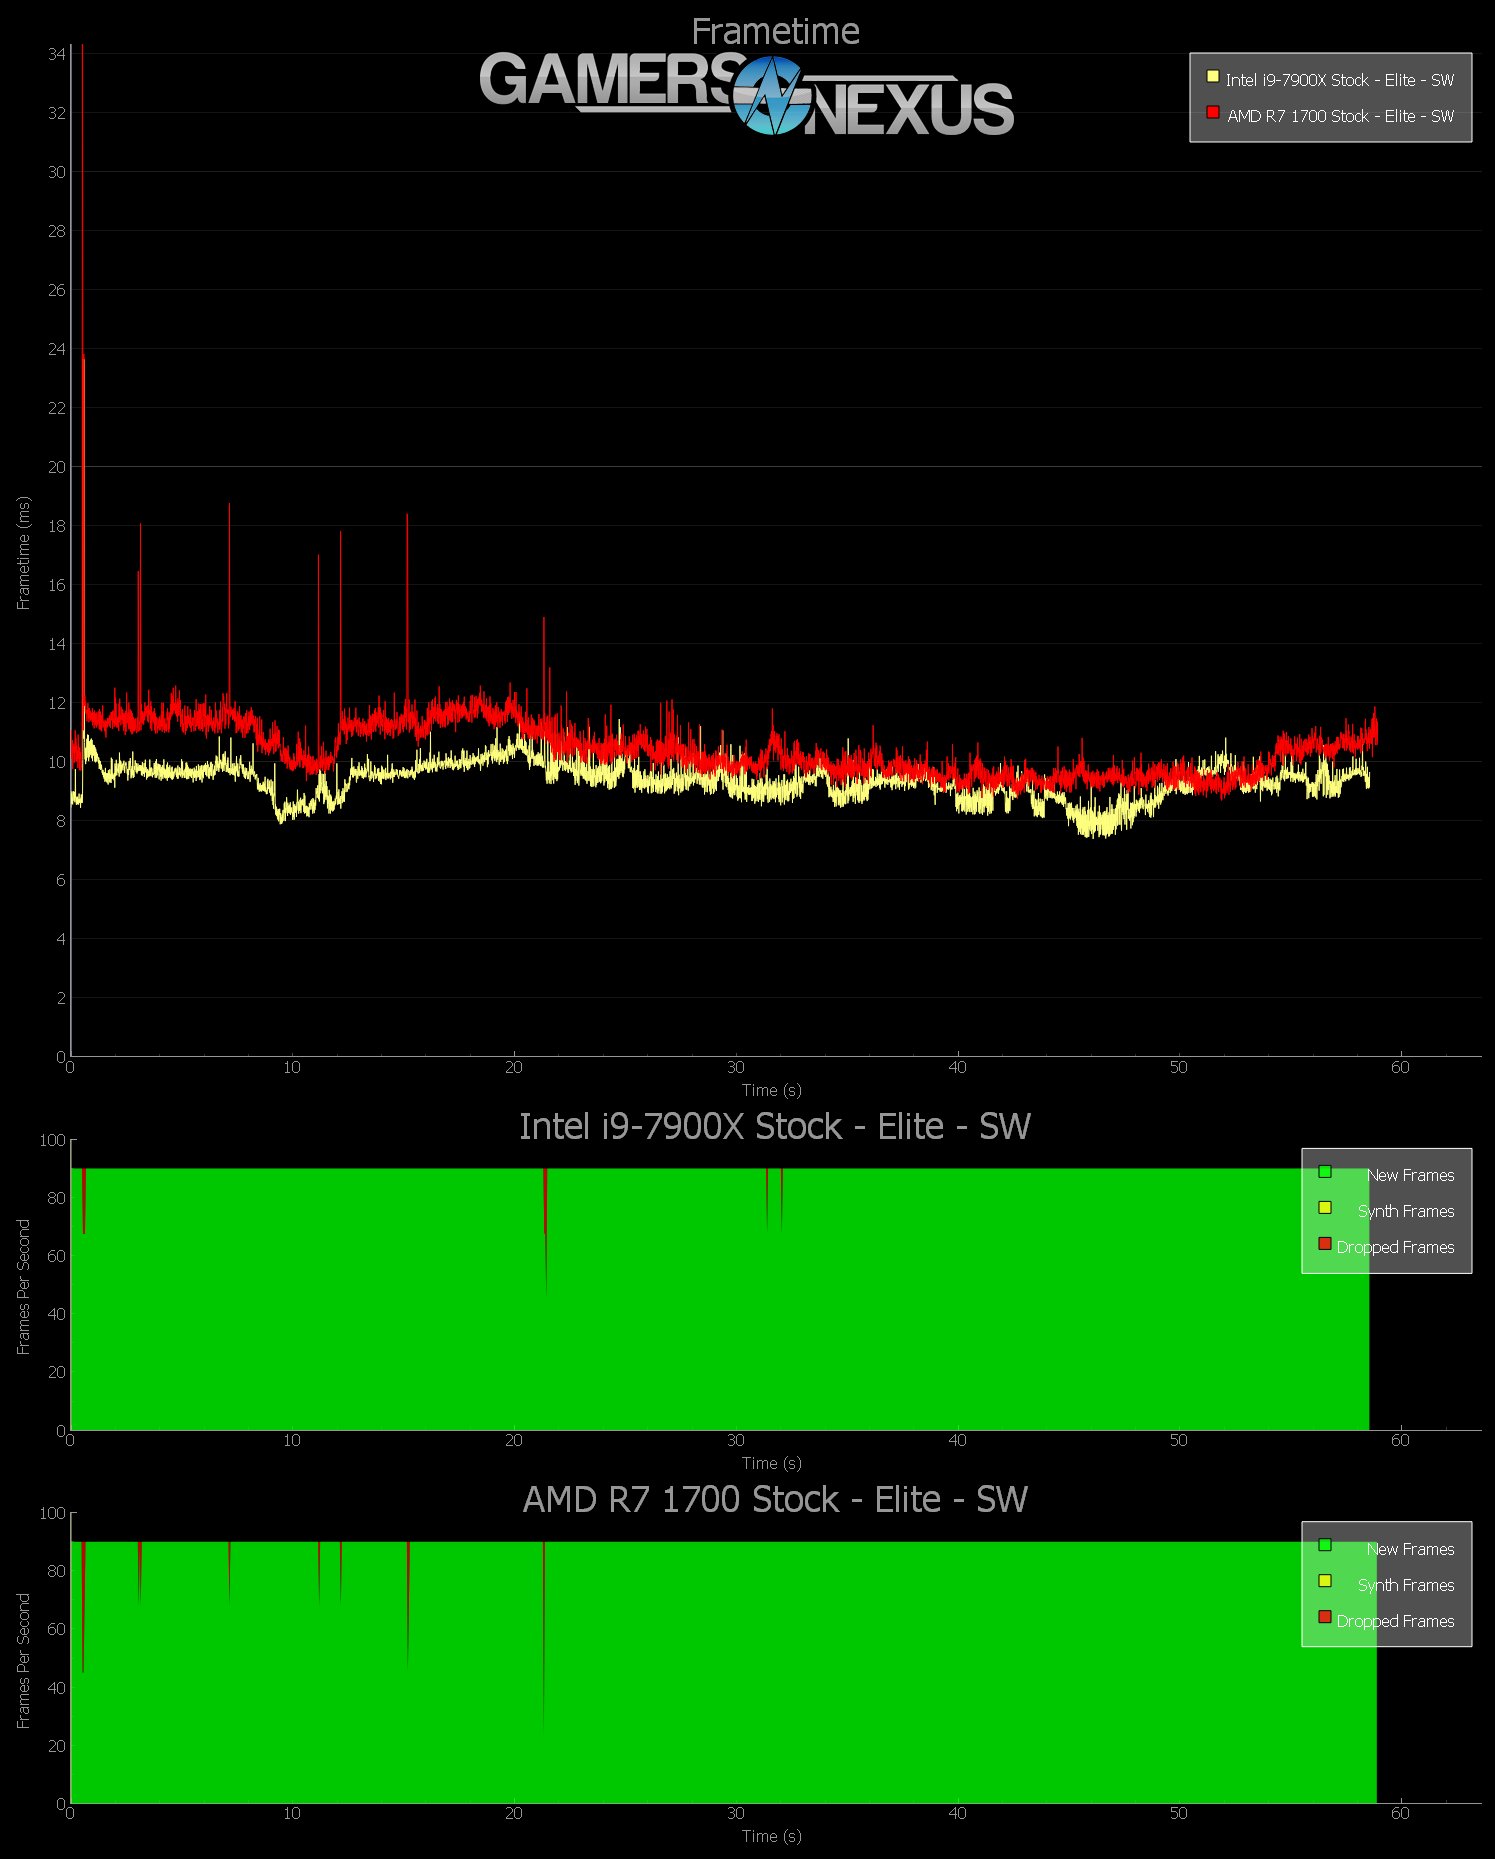
And now, just for a quick showcase, here’s the 7900X and the R7 1700 in stock configuration. The 7900X does indeed outperform the R7 1700, but neither is running past the runtime in any meaningfully different way. In fact, we’ve got a better way to display this data.
Elite: Dangerous VR Benchmarks – FPS & Frametimes
Here’s a bar chart for Elite: Dangerous average frametimes in VR.
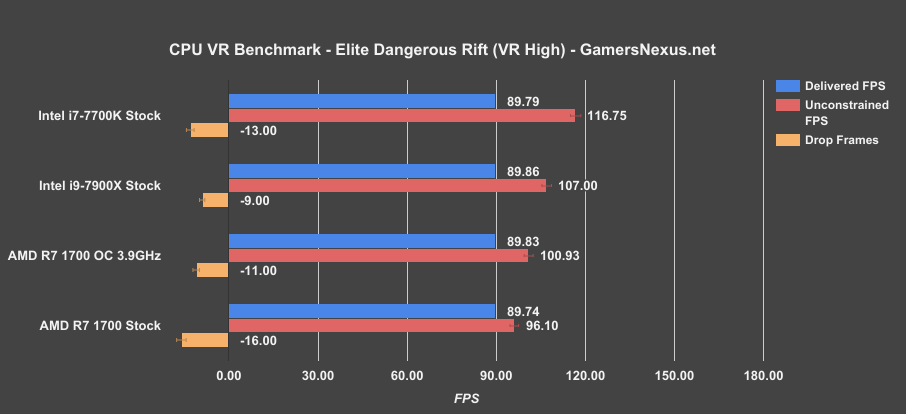
In terms of delivered frames to the HMD, we’re seeing a perfect 90Hz on all headsets. A simple extrapolation of unconstrained frames pegs the i9-7900X below the 7700K stock CPU, but the difference is imperceptible to any human. Our dropped frames are still just 9 out of a total of 5400 intervals, which really isn’t bad. AMD’s 1700 also does well here – really, all of these CPUs are fine. There’s no need for a $1000 7900X to do this VR workload.
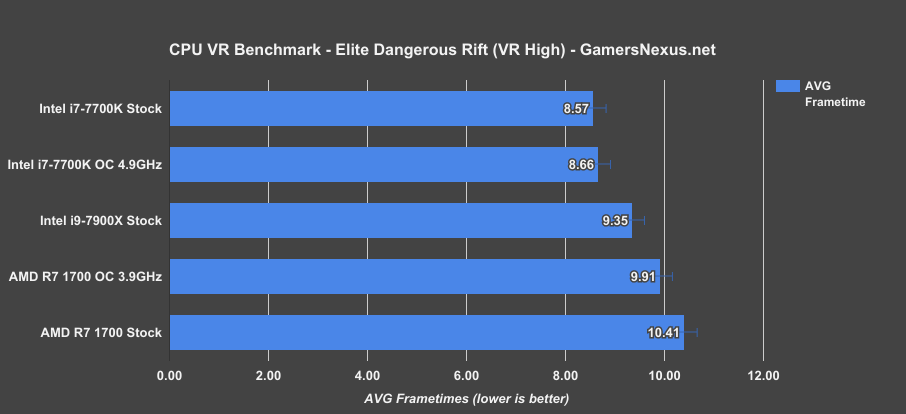
Here’s a look at Elite: Dangerous average frametimes in milliseconds. The i9-7900X runs an average frametime of 9.35ms, +/- 0.25ms as there is some variance in these tests. That’s below the 7700K – for which our stock and OC numbers are effectively identical and are within our error bars – and just ahead of the 1700 OC.
Captured gameplay footage is seen in the video review.
DiRT Rally VR Benchmarks – 7900X vs. 7700K & 1700
First, hardware validation:
With DiRT: Rally, we see a similar experience. The i9-7900X is technically slower in frametimes than the i7-7700K, both stock, though the two are realistically imperceptibly different. The i9-7900X would be a monumental waste of money for VR, considering that Intel’s own i7-7700K is still the best performer we’ve tested for virtual reality.
By this interval plot and frametime chart, the 7900X is again technically better than the R7 1700 – but again, that’s imperceptible, and the 7700K is still technically better than the 7900X at this particular workload.
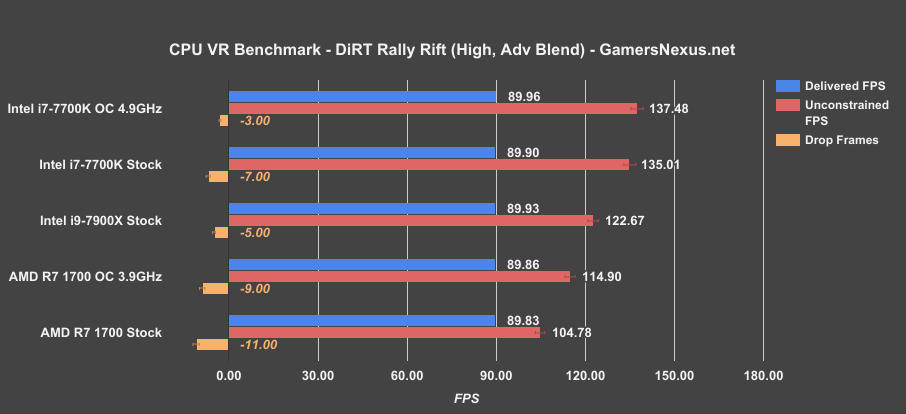
Here are some more bars, since most people find that more palatable. The 7900X lands middle of the pack. None of these CPUs are bad – they all provide 90FPS to the HMD – but again, it’s not worth spending $1000 for VR gaming when two $300ish CPUs from either camp can provide the same experience. And that’s an objective measurement.
As for frametimes, briefly, the 7900X lands at 8.15ms average, between the 8.7ms average of the overclocked 1700 and the 7.41ms average of the 7700K.
Analyzing the VR Gaming Scenario
Performance is good, but it’s not better than Intel’s cheaper products. And that’s fine – really, it doesn’t have to be. But Intel tried to cannibalize its own products – the ones with boxes which it just spent six months slapping “VR Ready” all over – in order to try and find a reason to sell the new ones.
Intel: You don’t have to BS people if you have a good product. There’s nothing that says the CPU has to be the best at everything – stop marketing these things like they are. This is the same talk we had about AMD’s 1800X a few months ago – there are times when marketing only hurts a product’s reception, because there are better products at better prices for that specific task. We saw that with the 1800X and its marketing, and we’re seeing that now with Intel’s marketing. You could play VR games on a non-K SKU just as well, assuming it’s one of the higher-end ones; actually, Oculus and Vive both explicitly recommend i5 CPUs.
Despite marketing, this thing just isn’t any better at VR gaming than the other CPUs we’ve tested.
Continue to the next page for gaming benchmarks & conclusion.
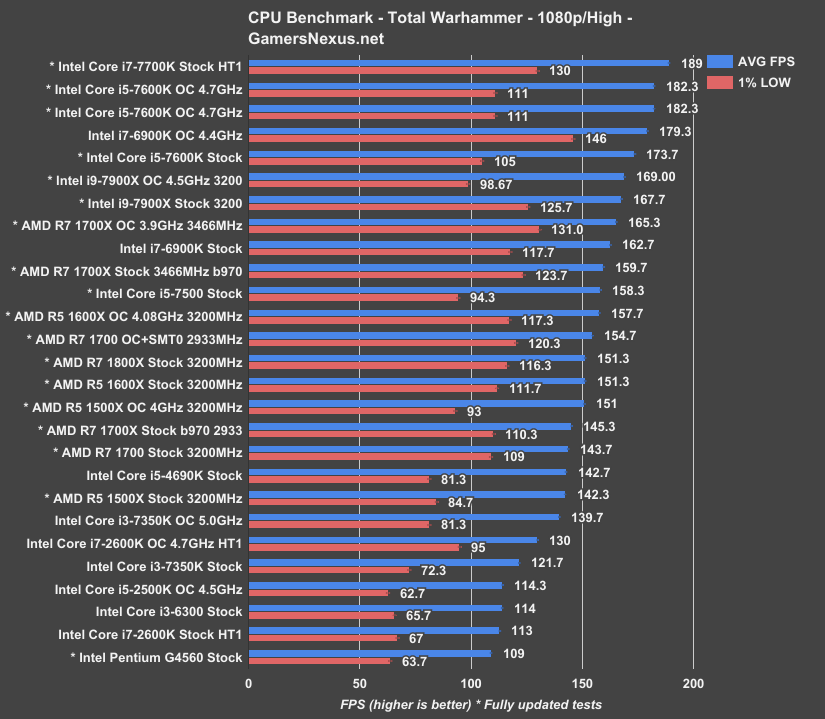
Intel i9-7900X – Total War: Warhammer Benchmark
Total War: Warhammer saw an update post-Ryzen launch that improved performance significantly on both AMD and Intel processors. Intel saw a major uptick in frametime consistency, reflected in our 0.1% lows, and AMD saw a major uptick in SMT-enabled performance. CPUs with an asterisk have been re-tested with this update, while CPUs without the asterisk have not yet been retested. CPUs without the asterisk would see an improvement of a couple percent in AVG FPS if retested.
Stock, the i9-7900X operates at 168FPS AVG, placing it behind the i5-7600K and ahead of the 6900K stock CPU and overclocked 1700X CPU with overclocked RAM. The stock i7-7700K CPU ranks at around 190FPS, where we begin bumping into GPU limitations. This illustrates why HEDT CPUs aren’t really meant for gaming. Some games will use the threads, but many are still frequency-intensive before they are core-intensive.
Intel i9-7900X – Battlefield 1 Benchmark
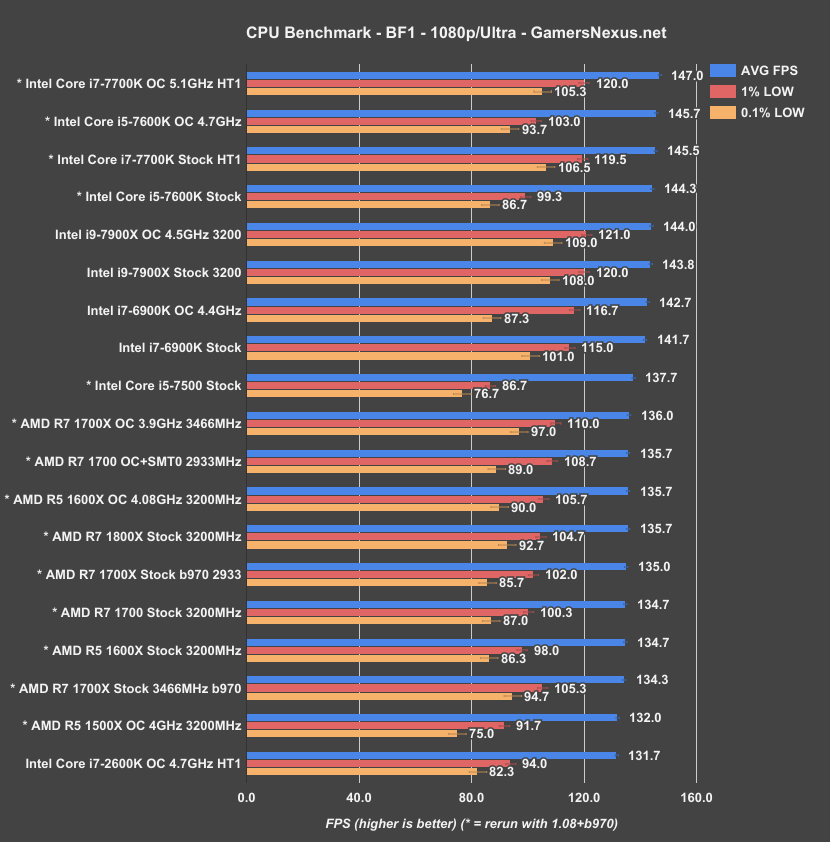
Battlefield 1 also got an update after Ryzen’s launch, moving to version 1.08 and improving CPU bottom-line performance. Again, asterisks on items indicate retesting after 1.07.
The i9-7900X runs 144FPS AVG, placing it roughly tied with the $330 i7-7700K and, better yet, the $240 i5-7600K. The R7 1700X with overclocked core and memory speeds runs 136FPS AVG, marking the 7900X about 5.7% faster. Not a huge gain.
Intel i9-7900X – Metro: Last Light Benchmark
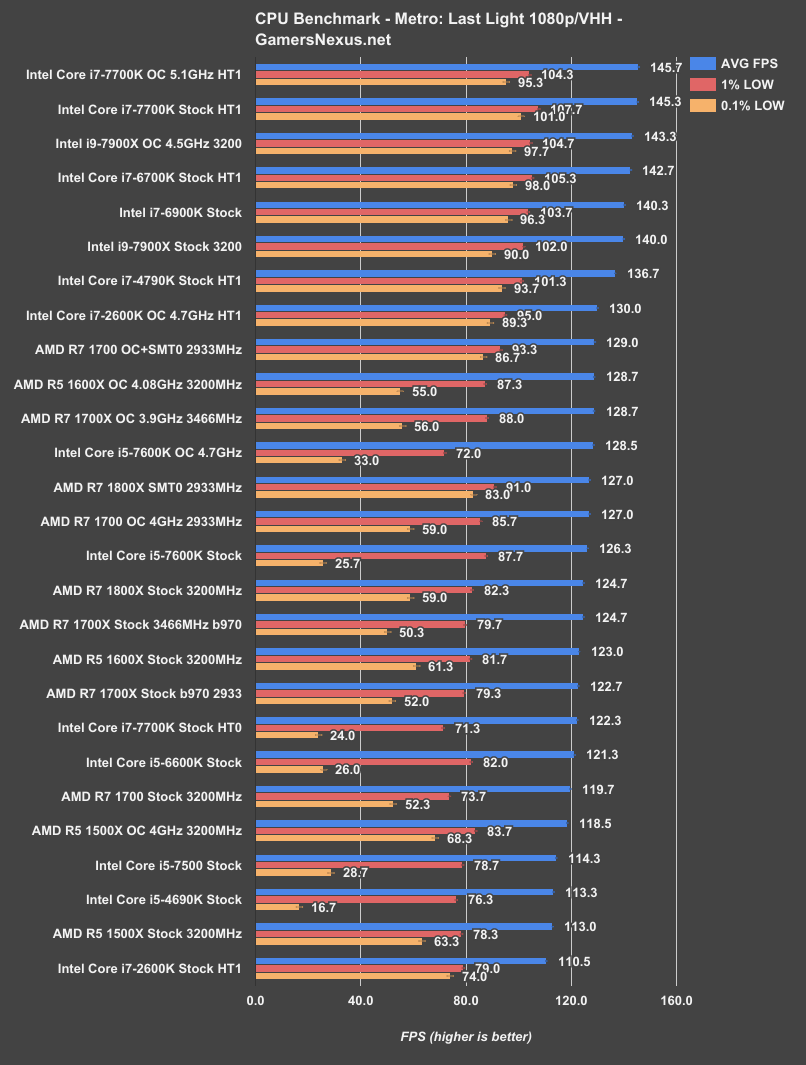
Metro: Last Light hasn’t been updated in ages, which means we have a large database of numbers. More of the same here, really: Not quite a 7700K. These games care more about frequency than cores, for the most part.
Intel i9-7900X – GTA V Benchmark
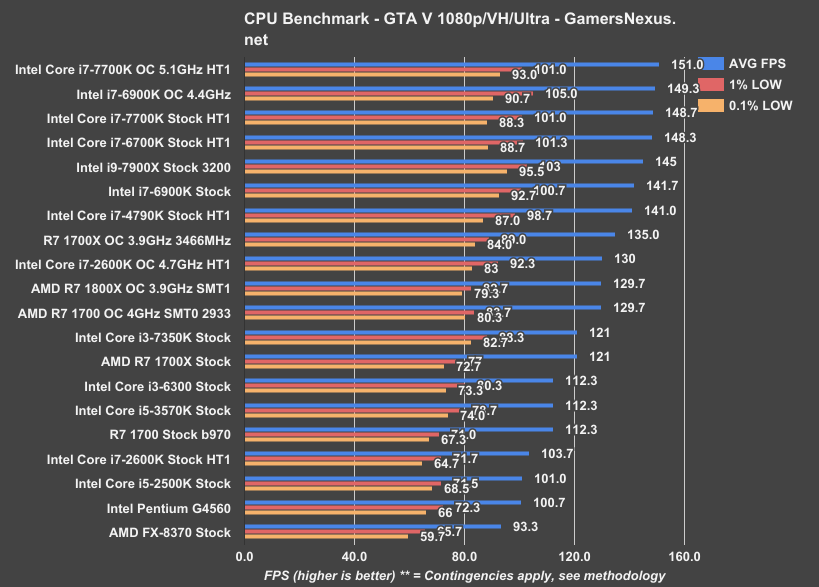
GTA V has issues with CPUs beyond 180FPS, as we’ve detailed, so this chart is somewhat truncated. Same story – a bit slower than the much cheaper 7700K.
Ashes of the Singularity & Escalation
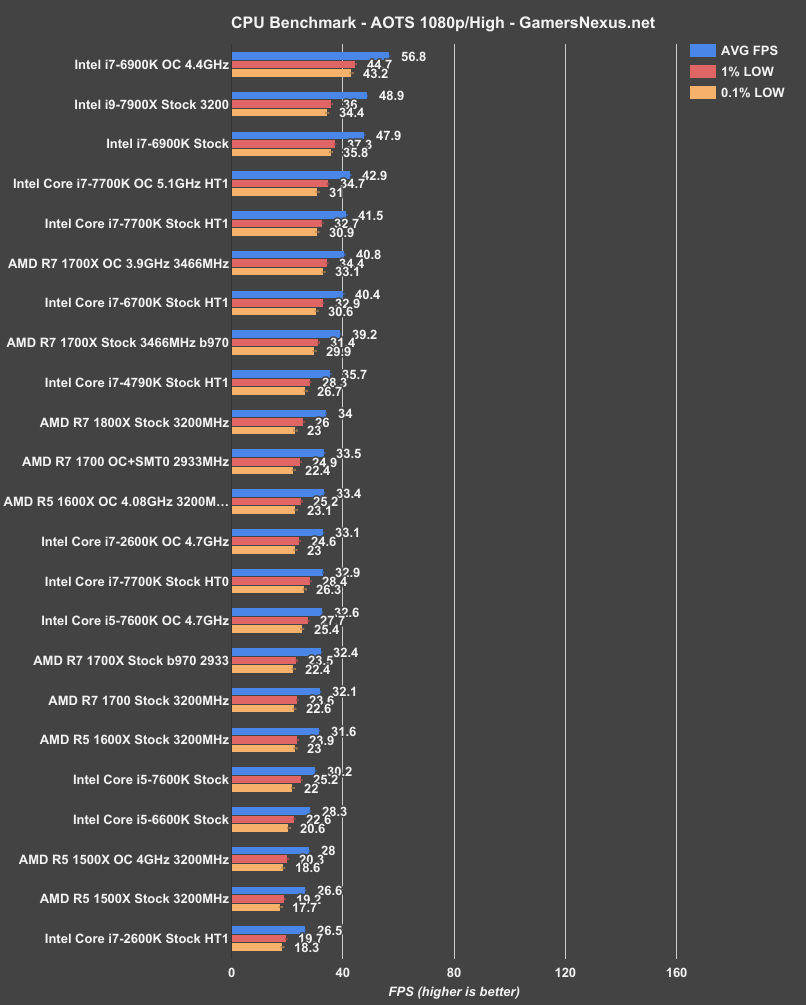
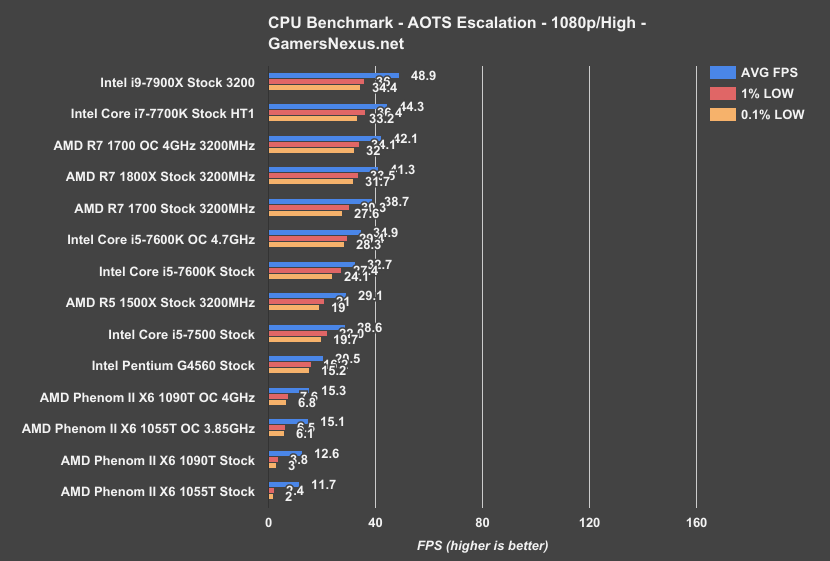
We see some better scaling in these, but Ashes really is a synthetic benchmark, at this point, and not a game. But it is one of the few games – benchmarks, whatever – that will leverage features like explicit multi-GPU or heavy multithreading. We see more of a boost here than elsewhere.
Conclusion: When the i9-7900X Is Worth It (And When it Isn’t)
We’ve still got a lot underway with the i9-7900X ($1000) – thermals and power testing being two major elements that were sacrificed in favor of VR & game stream testing. Both will be run as their own content pieces. We’re just waiting on some new tools.
That aside, we can look at the i9-7900X from the perspective of our benchmarks. Intel claimed that the CPU would excel in multi-stream output scenarios, and it appears that the company was accurate in this statement. Our game stream testing shows fewer than 1% dropped frames with reasonably high quality streaming to two services, which is more than can be said for most other CPUs on the market. Intel’s done a good job here; however, this does come with its caveats. One of them is that, as is always the case with encoding on the gaming system, frametime variability goes up and potentially impacts the playback fluidity. This would mostly be noticeable for competitive streamers who are working with games like CSGO, DOTA2, or Overwatch. In these instances of demanding consistent frametimes, we’d still recommend a secondary capture machine to remove all doubt. In instances where the capture and gaming must be done on the same system, the i9-7900X makes it possible to multi-stream while still carrying gameplay at a reasonable clip. It’s just a matter of that frametime consistency.
For a single stream output, Ryzen still does quite well. The R7 1700 would overclock to readily match an 1800X in our tests and didn’t drop frames in our Twitch-only testing. The 7900X is a bit superfluous for single-game streaming, but does make multi-streaming possible in a way which hasn’t been as affordable before.
Intel gets praise here, as it is deserved. The lowered 10C price makes that performance all the more reasonable for streamers working with a single box. If that frametime consistency isn't a concern, or if working with lower framerate games than what we've tested so far (again: DOTA, CSGO), then Intel has managed to build and price a CPU that would allow a cheaper streaming+gaming build than two individual machines. There's just still a reason for a capture machine, depending.
But there are plenty of use cases where the 7900X makes no sense. VR gaming is one of those, despite Intel’s marketing. The i9-7900X is a monumental waste of money for VR gaming, given its performance is not only imperceptibly different from both the i7-7700K ($330) and R7 1700, but also technically worse than the $330 7700K. “Technically,” of course, because that objective lead by the 7700K isn’t really relevant -- no user will ever see or experience that difference, as all three CPUs output 90Hz to the HMD and do so within runtime limitations. That said, there’s no reason to buy a worse product for more money. We made that exact point with the 1800X review, and we’re making that point again now. The i9-7900X has no place in a machine built only for VR gaming. Buy any $300 CPU instead. Maybe there’s something to be said for “VR content creation,” but then you’re really entering into the realm of a productivity/office machine – there are other benefits to that, like reduced encode/rendering times, that are proven to be beneficial.
And speaking of those productivity tasks, we did see a substantial uptick generationally for Intel’s *900 series HEDT CPUs. The 7900X completed our Blender render in approximately 26% less time than the stock i7-6900K, and in approximately 23% less time than an overclocked R7 1700 CPU. Overclocking the i9-7900X to 4.5GHz (1.275 Vcore) furthered that, improving us another ~12% over the 7900X stock CPU. That time is valuable to the right audience, like a production studio or environment where money is made on time regained. For a lot of folks, though, like enthusiast artists, part-time freelancers, and folks not pulling a full salary on this kind of work, the R7 1700 CPU isn’t too terribly far behind and runs significantly cheaper on both the CPU and platform. It’s also a lot more memory and platform-limited, naturally, but that’s where you’ve got to use your own judgment. If the $700 is worth the additional memory support and speed, it probably means you’re making enough money on this work to write it off as an important expense. If that’s not the case, save the money and go with an R7 1700 CPU, spend 15 minutes on a trivial overclock, and be happy with competitive performance at one-third the price.
Both CPUs have their use cases and audiences, is the point.
Now, with regard to gaming only, the i9-7900X is an absolute no-go. This is not something you buy for a gaming-only machine. Just like the 1800X, the 7900X is wasteful and superfluous for gaming-only builds, and those builds would be better-served with something like a 7700K (~$330) or R5 1600 ($210) in their respective price categories. The i9-7900X does well in our rendering tests, overclocks reasonably, and is a serious performer in multi-stream outputs, with AMD's most direct competition likely coming sometime in early August or late July. It does not do well in price:performance for unstreamed gaming or VR. The extra $700 gains you nothing in either scenario.
We’ve laid-out what it does well and what it’s beaten in, particularly in price:performance. That should assist in making initial decisions. Note that our testing is not fully complete – we have thermals yet to come, among other benchmarks.
Editor-in-Chief: Steve Burke
Video Producer: Andrew Coleman