NVIDIA RTX 2080 Founders Edition Review & Benchmarks: Overclocking, FPS, Thermals, Noise
Posted on
It’s more “RTX OFF” than “RTX ON,” at the moment. The sum of games that include RTX-ready features on launch is 0. The number of tech demos is growing by the hour – the final hours – but tech demos don’t count. It’s impressive to see what nVidia is doing in its “Asteroids” mesh shading and LOD demonstration. It is also impressive to see the Star Wars demo in real-time (although we have no camera manipulation, oddly, which is suspect). Neither of these, unfortunately, are playable games, and the users for whom the RTX cards are presumably made are gamers. You could then argue that nVidia’s Final Fantasy XV benchmark demo, which does feature RTX options, is a “real game” with the technology – except that the demo is utterly, completely untrustworthy, even though it had some of its issues resolved previously (but not all – culling is still dismal).
And so we’re left with RTX OFF at present, which leaves us with a focus primarily upon “normal” games, thermals, noise, overclocking on the RTX 2080 Founders Edition, and rasterization.
We don’t review products based on promises. It’s cool that nVidia wants to push for new features. It was also cool that AMD did with Vega, but we don’t cut slack for features that are unusable by the consumer.
The new nVidia RTX 2080 and RTX 2080 Ti reviews launch today, with cards launching tomorrow, and we have standalone benchmarks going live for both the RTX 2080 Founders Edition and RTX 2080 Ti Founders Edition. Additional reviews of EVGA’s XC Ultra and ASUS’ Strix will go live this week, with an overclocking livestream starting tonight (9/19) at around 6-7PM EST starting time. In the meantime, we’re here to start our review series with the RTX 2080 FE card.
Recapping the Turing Architecture
As a reminder, we wrote a full deep-dive on the new Turing architecture, including a complete look at Big Turing’s TU102 die and its 72 total SMs. For the RTX 2080 Ti, the SM count totals 68, leaving 4 available SMs for another 256 FPUs on future models – perhaps a Titan. The RTX 2080 non-Ti runs significantly fewer SMs, marked down to 46 (for 2944 FPUs), with proportionately reduced ROPs, TMUs, and cache. Again, we recommend learning more about the architecture in our article or video.
We have also completely disassembled the card and cooler, with an additional PCB analysis. We’ll embed the most recent tear-down video below:
As discussed in the architecture video, nVidia is trying to push for important, major changes with Turing. The new architecture represents a shift away from "traditional" gaming and traditional framerate/frametime focus, instead looking to the future of deep learned game art -- like anti-aliasing and supersampling, where nVidia's technology makes tremendous sense and is intelligent in its goals. Ray tracing is undoubtedly a grand and worthwhile goal, and easier means to implement global illumination, caustics, and planar reflections would be welcomed. Most of these things are faked right now, and they're faked damn well, but faking planar reflections can take a lot of manual effort. You start looking at things like creating environment maps to reflect onto the character model, for instance, and those only really work in the specific environs. RTX theoretically sidesteps a lot of this manual effort and frees-up artist time. We just need to see it used, of course, and also need to be sure that non-RTX cards still get a good experience.
Bad Marketing
Marketing comes before the card ever hits the market. Typically, nVidia’s launch campaigns are cohesive and focused, regardless of hardware performance. For this launch, the company seems to be struggling to illustrate what value it thinks the RTX cards will provide to consumers. NVidia knows what it wants to build, but can’t figure out how to market it in a way that connects with the audience. It’s a risk play, and one that may well pay off in the future – but consumers care about today, as they should, and aren’t typically focused on “what will this device do in 5 years?” The marketing has become a transparent grasping of straws, in some instances, including those where nVidia backpedals on its previous generation’s ability to play games at 4K60, instead trying to pretend that was never possible:
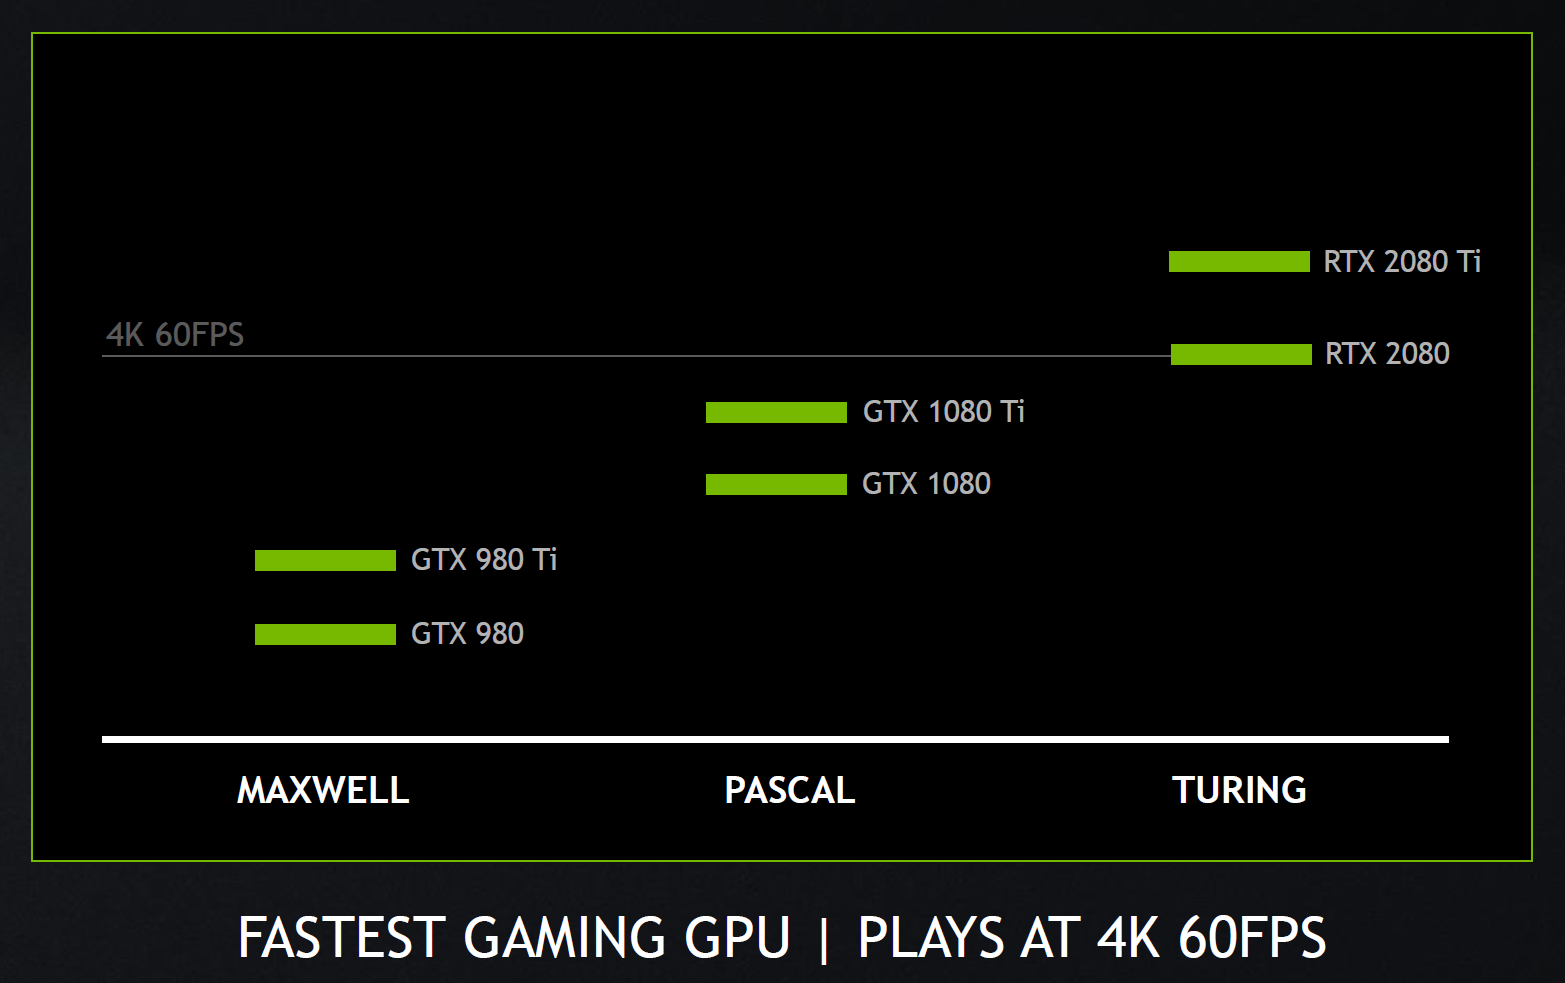
The marketing is bad. There’s no way around it. It is off-putting and has created skeptics of the technology before RTX could ever stand a fair trial. Deceptive charts are not news to launches – we’ve railed against AMD for it in the past – but this particular kind of chart, wherein a single number exists and no scale exists (is that 50 to 70FPS?), is damaging to brand credibility. The numbers were released following earlier skepticism when nVidia failed to post rasterization comparisons to the GTX 10-series cards, further painting the picture of a desperate play that tries to obfuscate the reality of hiked prices and suspect performance. Questionable and non-linear comparisons also call the devices under early questioning. Take this image, for instance:
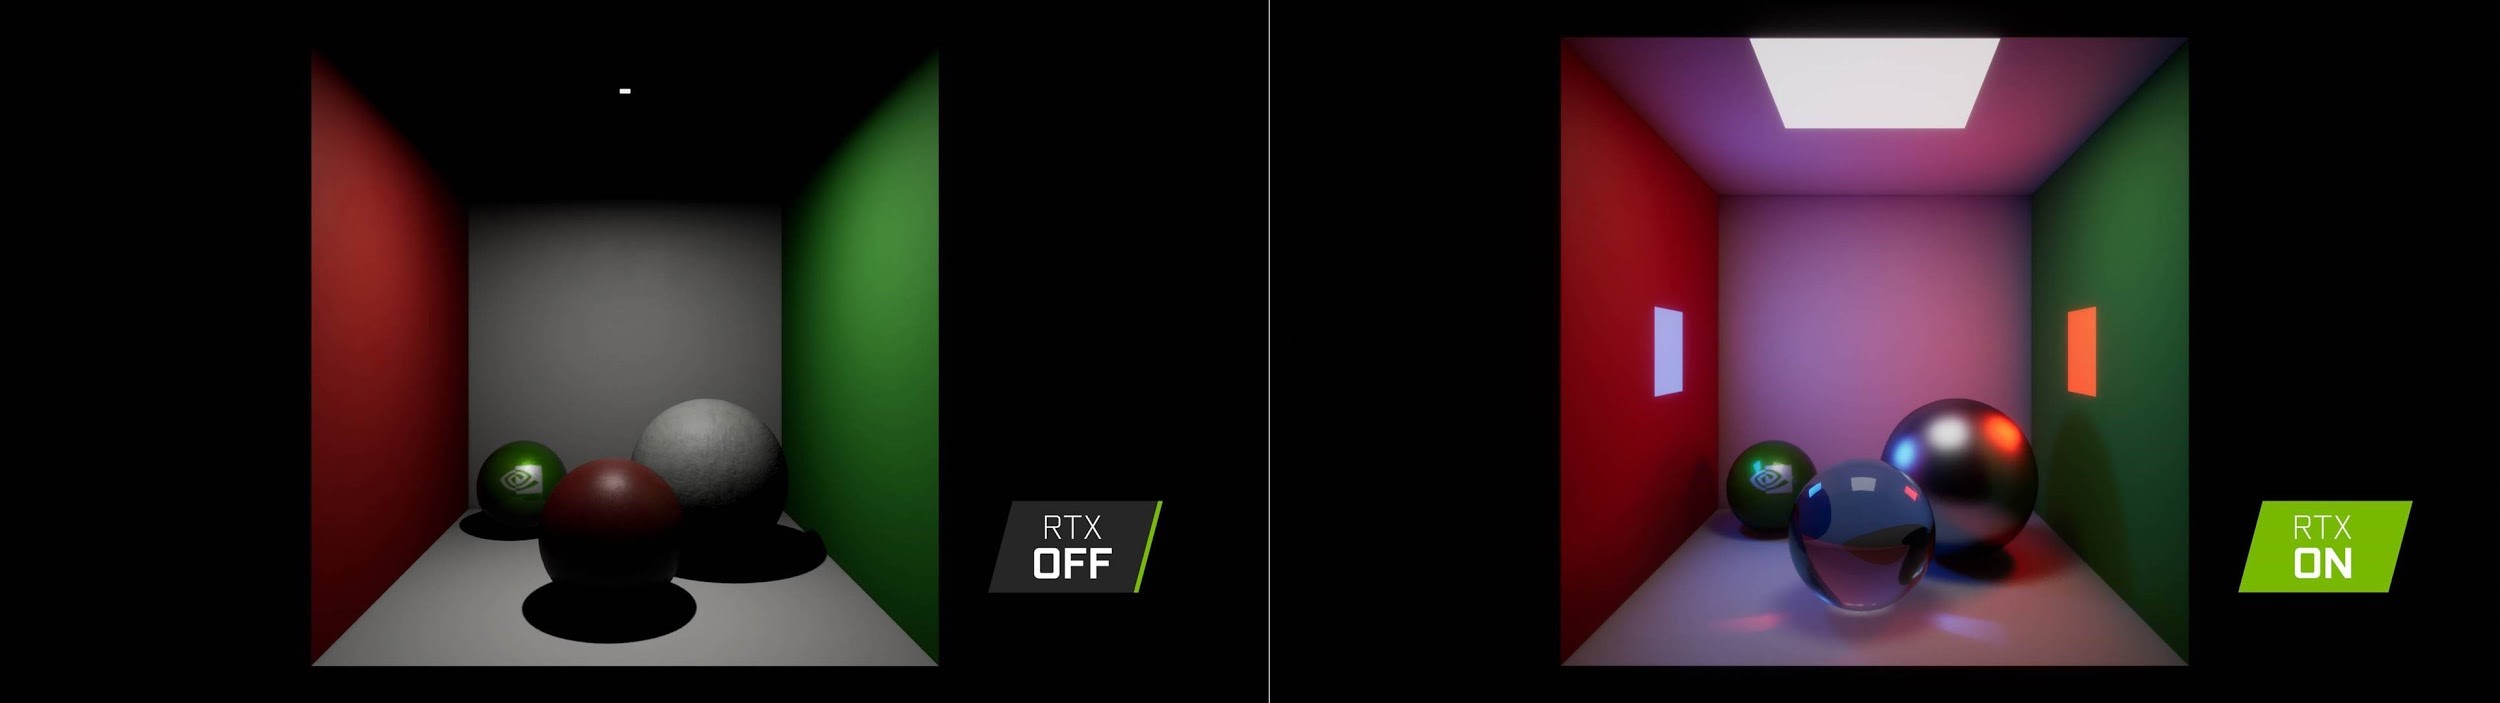
NVidia’s CEO played these back-to-back on stage to a public audience. It’s meant to be a demonstration of global illumination, which would typically use a multi-colored room to bounce light off one surface and onto another. In this example, however, nVidia goes far enough to even change the materials of the objects in comparison. It is a complete non-sequitur comparison. One image has a single point light, looks flat as a result, and is using leather, marble, and metallic materials on the spheres. The other image uses three area lights and changes the materials to a caustic-friendly glass and a shiny metallic. These are completely, utterly incomparable, and nVidia knows better. It is, after all, a graphics company.
This is all very odd, because the ray-traced and global illumination effects are impressive when demonstrated, and really don’t need to be cheated to look good. Thus far, most of the game demonstrations have also lacked full graphics development for “normal” graphics that use the normal tricks. You might typically see cube maps for reflections on windows, planar reflections deployed strategically on windows, or screen space reflections that extend just past the boundaries of the screen for an additional performance cost. Instead of showing games as they’re made today, most of the demos have shown them completely flat, with none of the existing tricks used to “fake” the effect. We understand why nVidia would do this, but disagree with the company’s conclusion: In reality, much of RTX is about enabling developers to implement higher-quality graphics with less effort (nVidia has said so in its own GDC presentations). This is about developers. These cards will help aid future game graphics development, and that doesn’t necessarily make them value-oriented devices.
All of this is compounded by the shipment of cards prior to review publication, which makes it more difficult for purchasers to turn back on early decisions.
An Excellent VRM & PCB Design
We had our XOC expert (Buildzoid) look at the VRM and PCB of the reference boards by nVidia. After the full analysis, embedded below, Buildzoid declared that the nVidia RTX reference boards host the best consumer VRMs that nVidia has made. They’ve done well with the PCB and VRM layout and, at the expense of lower-end partner cards, nVidia has also worked to take some of the dual-axial market. The VRM design is capable of far higher current than the GPU will permit through overclocking utilities, and uses clever design tricks to improve switching efficiency. Learn more below:
Test Methodology
Testing methodology has completely changed from our last GPU reviews, which were probably for the GTX 1070 Ti series cards. Most notably, we have overhauled the host test bench and had updated with new games. Our games selection is a careful one: Time is finite, and having analyzed our previous testing methodologies, we identified shortcomings where we were ultimately wasting time by testing too many games that didn’t provide meaningfully different data from our other tested titles. In order to better optimize our time available and test “smarter” (rather than “more,” which was one of our previous goals), we have selected games based upon the following criteria:
- Game Engine: Most games run on the same group of popular engines. By choosing one game from each major engine (e.g. Unreal Engine), we can ensure that we are representing a wide sweep of games that just use the built-in engine-level optimizations
- API: We have chosen a select group of DirectX 11 and DirectX 12 API integrations, as these are the most prevalent at this time. We will include more Vulkan API testing as more games ship with Vulkan
- Popularity: Is it something people actually play?
- Longevity: Regardless of popularity, how long can we reasonably expect that a game will go without updates? Updating games can hurt comparative data from past tests, which impacts our ability to cross-compare new data and old, as old data may no longer be comparable post-patch
Game graphics settings are defined in their respective charts.
We are also testing most games at all three popular resolutions – at least, we are for the high-end. This includes 4K, 1440p, and 1080p, which allows us to determine GPU scalability across multiple monitor types. More importantly, this allows us to start pinpointing the reason for performance uplift, rather than just saying there is performance uplift. If we know that performance boosts harder at 4K than 1080p, we might be able to call this indicative of a ROPs advantage, for instance. Understanding why performance behaves the way it does is critical for future expansion of our own knowledge, and thus prepares our content for smarter analysis in the future.
For the test bench proper, we are now using the following components:
GPU Test Bench (Sponsored by Corsair)
Component | Courtesy of | |
CPU | GamersNexus | |
GPU | This is what we’re testing! | Often the company that makes the card, but sometimes us (see article) |
Motherboard | ASUS | |
RAM | Corsair | |
PSU | Corsair | |
Cooler | NZXT | |
SSD | Plextor 256-M7VC | GamersNexus |
Separately, for the initial RTX 20-series reviews, we are using 10-series board partner models instead of reference models. This is because we know that most of the market, for fact, is using board partner models, and we believe this to be the most realistically representative and relatable for our audience. We acknowledge that the differences between the RTX and GTX reference cards would be more pronounced than when comparing partner cards, but much of this is resultant of poor cooler and reference card solutions in the previous generation. It creates, in our eyes, an unrealistically strong appearance for incoming cards on dual-axial coolers, and does not help the vast majority of users who own board partner model 10-series cards.
RTX 2080 Founders Edition Game Benchmarks
For games, as mentioned above, we work to isolate common game engines, important APIs, and realistic game settings.
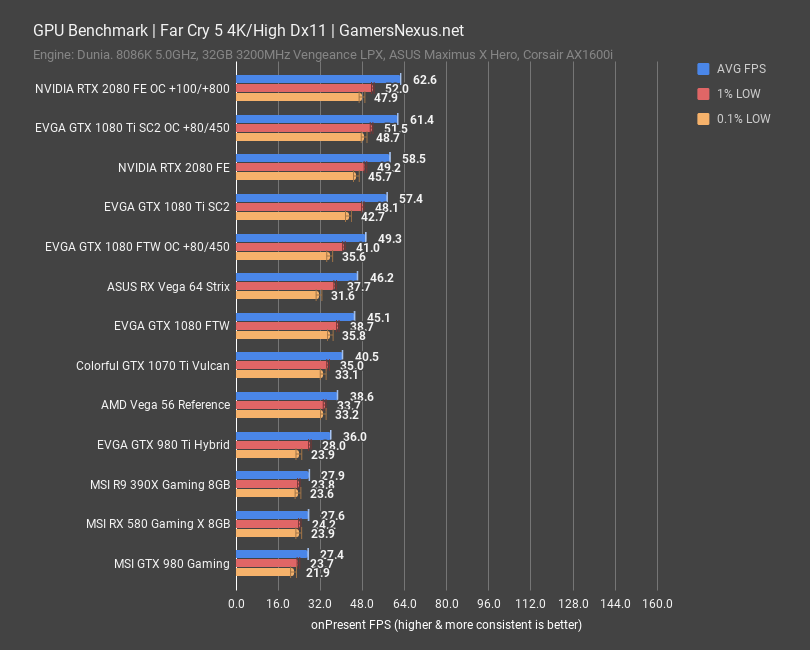
Far Cry 5 RTX 2080 Benchmarks
Far Cry 5 uses the Dunia engine, used by Ubisoft Montreal. Far Cry 5 at 4K has the RTX 2080 FE card at 59FPS AVG, planting it functionally tied with a board partner 1080 Ti at 57FPS AVG. Our error margins on the graph define room for test variance. The 1080 Ti performs functionally equivalently to the RTX 2080 FE under these settings. The RTX 2080 gains on the GTX 1080 FTW by about 30% generationally, bumped up from 45FPS previously. Vega 64 is in the same boat – it’s about a 30% performance gain for the RTX card. For reference, the RTX 2080 leads the GTX 980 by over 2x, and on the 980 Ti by about 63%. Overclocking the 2080 puts it at 63FPS AVG, roughly equivalent with the overclocked 1080 Ti.
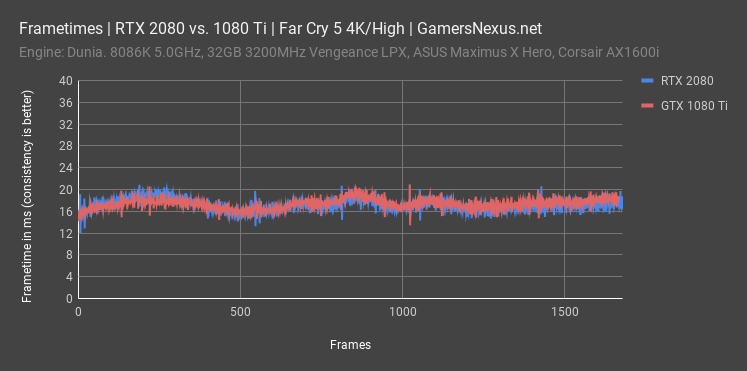
Here’s a frametime plot of the RTX 2080 and the GTX 1080 Ti, as these cards perform functionally equivalently. They also make sense to compare when considering the advantaged price position of GTX 1080 Tis. Note also that a lot of nVidia’s launch marketing for RTX has revolved around the “experience,” in big quotes. Well, between these two, the experience is identical. There is hardly any performance difference across this cross-section of data. Just as a reminder, frametime plots are to be read as time in milliseconds between frame presents, with 16ms equating a rough 60FPS throughput. Lower frametime is better, but consistency is even more important.
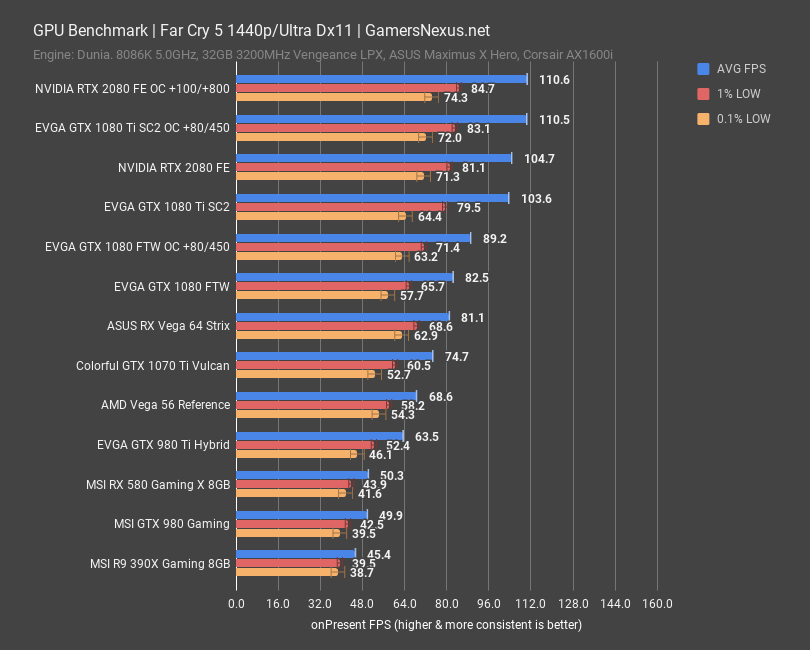
1440p is next: At this resolution, the RTX 2080 FE runs at 105FPS AVG, which places it as roughly equivalent with the 1080 Ti SC2. Lows are also within our margin for error, marking frametimes as roughly equivalent. Generational improvement over the GTX 1080 is 27%. The RTX 2080 has a bigger improvement at 4K than 1440, but not by much. Vega 64 is between the 1080 FTW and the overclocked 1080 FTW. Overclocking the 2080 FE to +100/+800 landed us around 111FPS AVG, with lows reasonably sustained and not suffering from inconsistencies – so that’s good behavior from an overclock. The 1080 Ti ends up tied, again, even when both are overclocked.
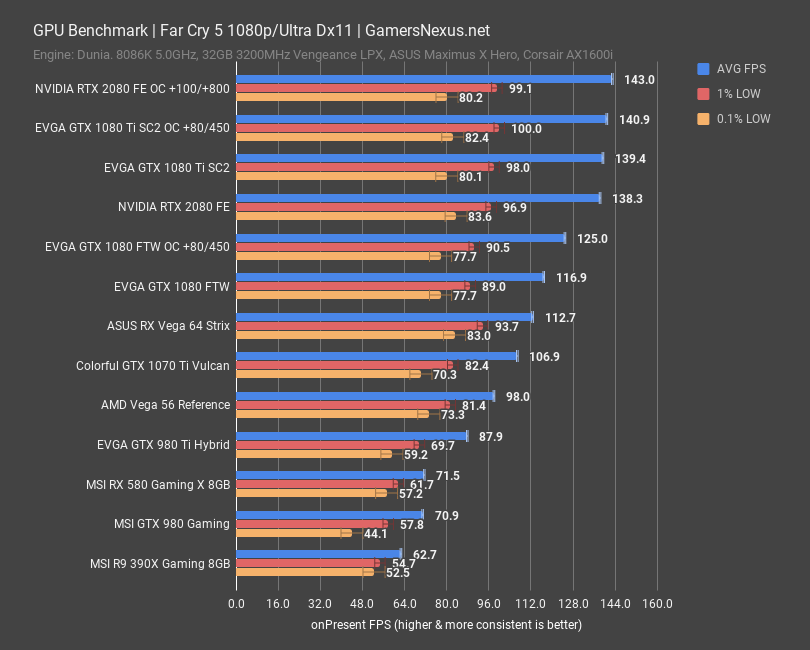
1080p is interesting only for scalability purposes: At this configuration, the 2080 FE runs at 138FPS AVG, or only 18.3% ahead of the GTX 1080. That is a significant drop from the previous 30% gains at 4K. The higher percent gains would also reflect to lower resolution, heavily anti-aliased scenarios, as you’re sampling the screen X more times with anti-aliasing, thus producing the same amount of load on the render pipeline. The improvement to ROPs produces much of this scaling difference.
Sniper Elite 4 RTX 2080 FE Benchmarks vs. GTX 1080
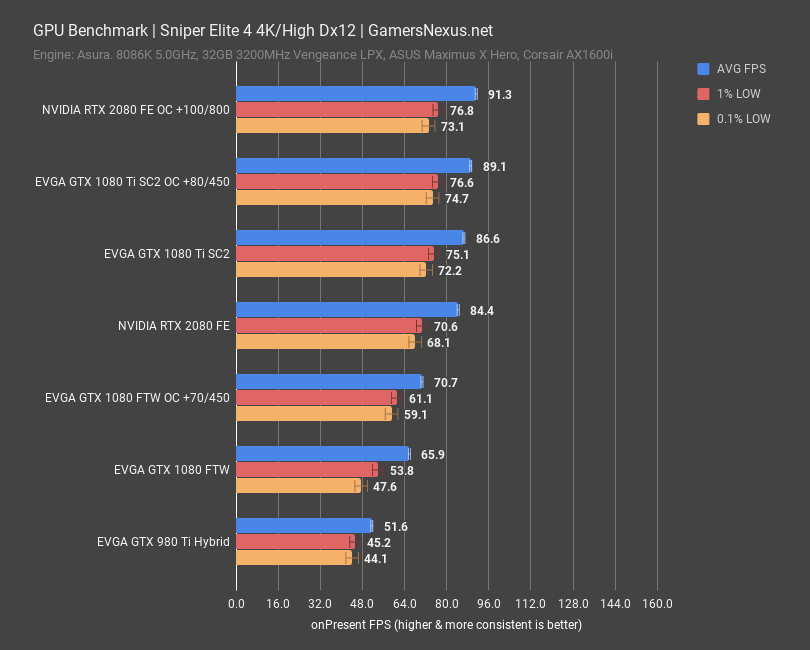
Sniper Elite 4 has one of the best DirectX 12 implementations available, and was what tipped us off to Volta’s shift to asynchronous compute performance on the Titan V. This game stands as a means to illustrate how modern APIs perform on cards with better asynchronous operation scheduling. At 4K and High settings, the RTX 2080 FE averaged 84FPS AVG, with lows at 68FPS for 0.1%. The GTX 1080 Ti SC2 managed 87FPS when stock, demonstrating, again, near equivalence – but it is one that exits error margins. The Ti pulls ahead by 2.6%. Overclocking both the 2080 and the Ti, the cards again face equivalence – we’re at 91FPS AVG for the 2080 and 89FPS AVG for the 1080 Ti, with the 1% and 0.1% lows both extraordinarily similar. The GTX 1080 non-Ti averages 66FPS, allowing the 2080 a generational improvement of 28%. Not as large of an improvement as the Titan V led us to expect, but still an improvement. Unfortunately, that improvement also comes with a massive price hike and could be matched for a cheaper 1080 Ti.
F1 2018 RTX 2080 Benchmarks
F1 2018 is next. This game uses the EGO engine and is built by Codemasters, standing as a good representation for other EGO engine games.
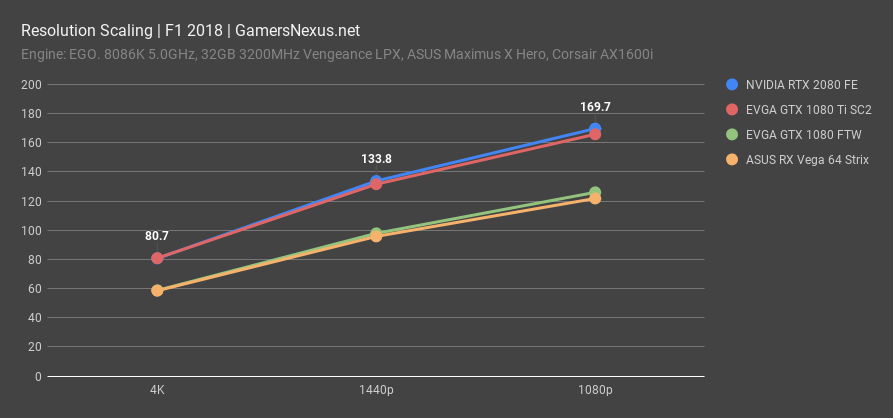
Let’s start with a different image: This is a resolution scaling chart for F1 2018, demonstrating the performance at 1080p, 1440p, and 4K high with the same graphics settings. The demonstration helps us visualize average FPS across resolutions. At 4K, the RTX 2080 is roughly equal with the 1080 Ti, which is not at what we expected – we expected to see it begin to pull away.
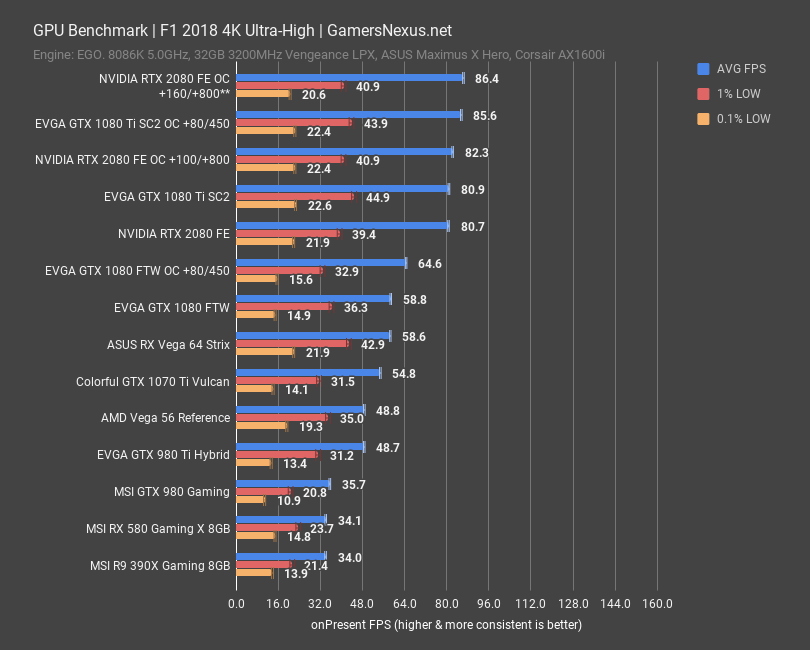
At 4K, the RTX 2080 FE performs at 81FPS AVG, with lows demonstrably low for all cards in this game. This is roughly tied in all metrics with the GTX 1080 Ti SC2. It would lead the FE 1080 Ti by a few percent, but that’s hardly impressive. Overclocking both the 1080 Ti and 2080 results in another rough equivalence at 4K. Scaling from the 2080 stock over the 1080 stock’s 59FPS is about 37%, marking the largest leap we’ve seen generationally thus far. Interestingly, this particular title is a demonstration of thermal-frequency response on the RTX 2080: When overclocked, we are running into a thermal cap limit and dropping frames hard. Full fan speeds permit an additional couple frames per second at the expense of 60dBA of noise.
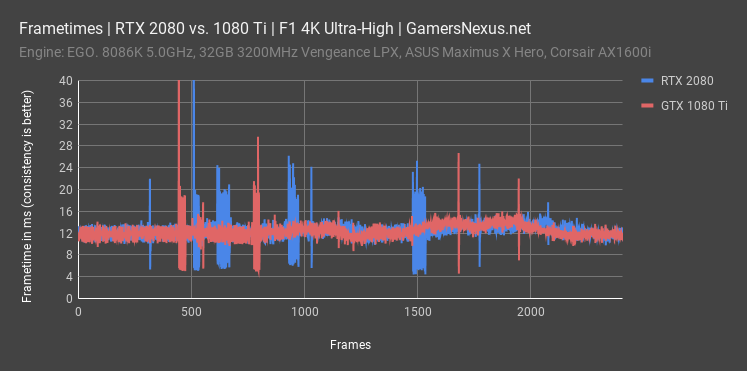
Here’s another frametime plot to help illustrate performance. We are comparing the 1080 Ti and the 2080; despite being identified by different names, these two cards are the most immediately comparable in price, thus making them the closest consumer comparison.
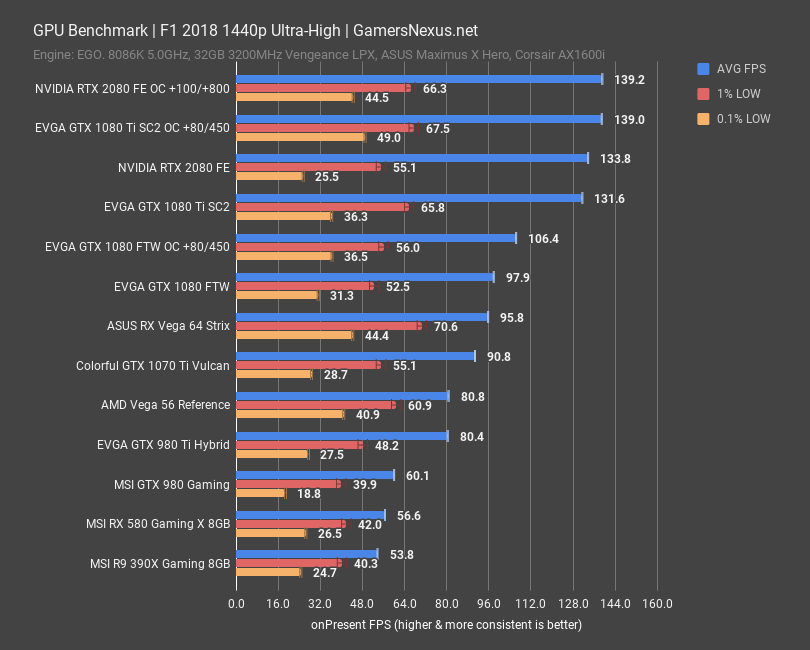
1440p posts the 2080 at 134FPS AVG, which is about 1.8% ahead of our 1080 Ti performance. Then again, standard deviation of the average is approximately +/- 0.8FPS, resulting in functional and observational equivalence. For scaling, the 2080 is 36.7% faster than the GTX 1080, keeping the same scaling.
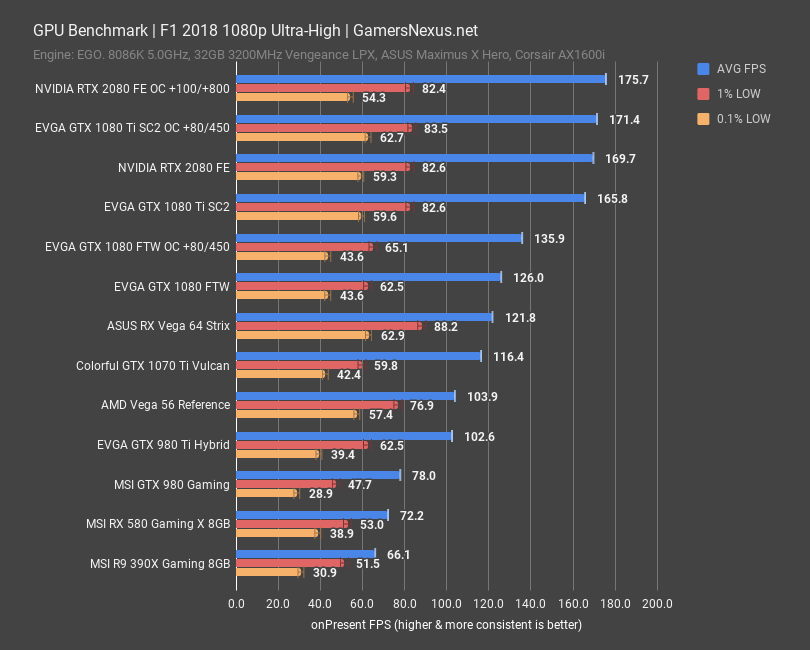
At 1080p, scaling drops to 35%, which is still a big jump. This is an instance where the ROPs and FPU jaunt is largely beneficial, even in more traditional rasterization. For reference, the 2080 outperforms the GTX 980 by about 120%, marking over a 2x gain across a 4-year period. The GTX 980 launched on September 18, 2014.
Shadow of the Tomb Raider 2018 GPU Benchmark
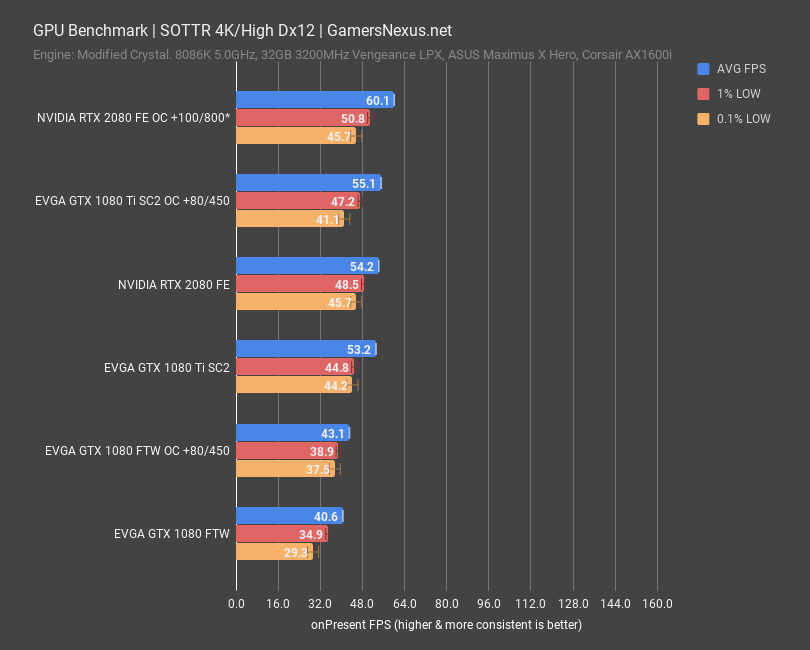
Shadow of the Tomb Raider is next and uses an in-house engine. At 4K, we measured the RTX 2080 FE at 54FPS AVG, with lows well-timed at 46FPS for the 0.1% lows and 49FPS for the 1% lows. This tightness of latency is a good path to a smoother experience. Overclocking allows the RTX 2080 FE a lead of 5FPS, or 9%. For the 1080 Ti, we’re at rough equivalence by all metrics. It is within error margins. The GTX 1080 runs at 41FPS AVG, affording the RTX 2080 stock card a 33% lead.
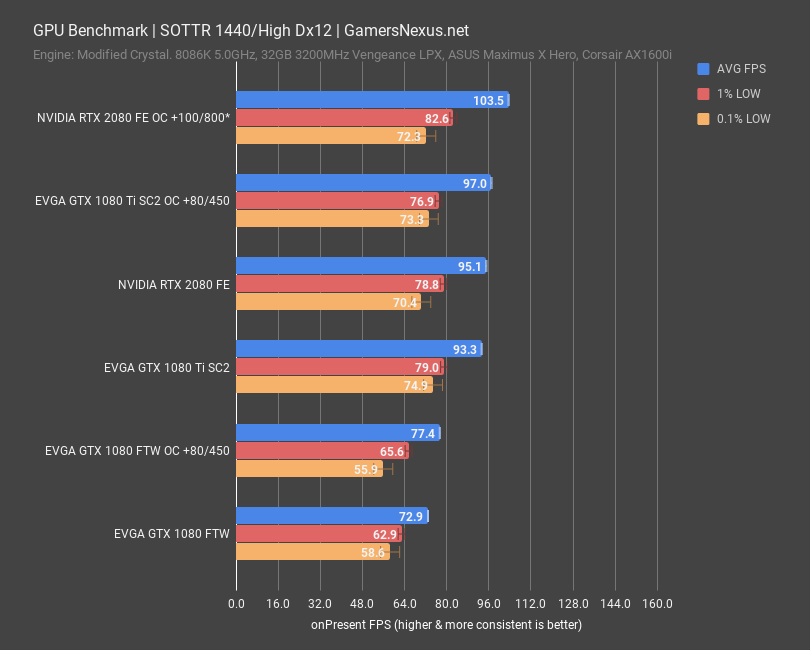
1440p posts the RTX 2080 at 95FPS AVG, affording it a measurable-but-imperceptible 2% advantage over the GTX 1080 Ti. Overclocked, we see the same behavior as before – the RTX card plants itself at 104FPS AVG, or a lead of 6.7% over the overclocked 1080 Ti. That’s not a guaranteed gain, mind you, and it does cost an extra couple hundred dollars. Scaling over the GTX 1080’s 73FPS AVG allows the RTX 2080 a lead of 30.5%.
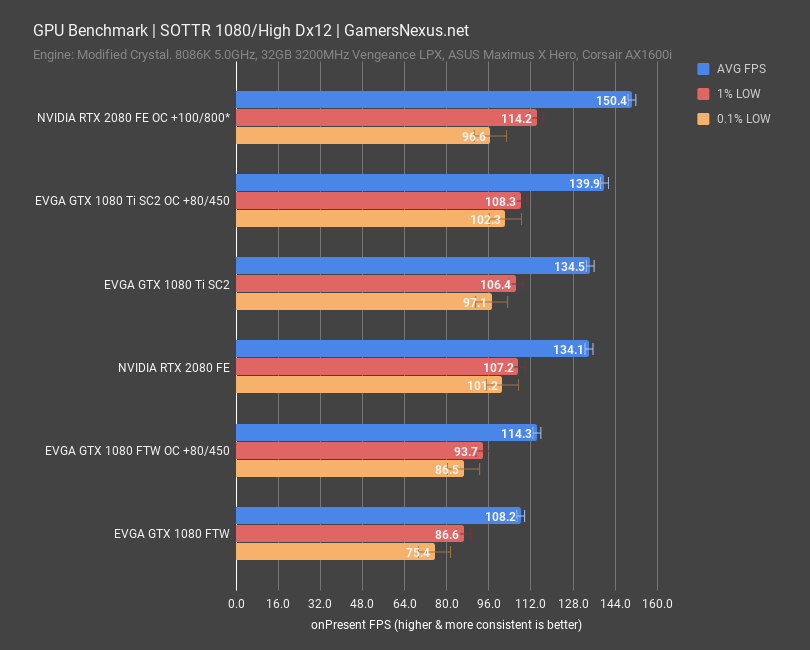
Strictly to illustrate this point, here’s a quick glance at 1080p. For this one, the gap between the RTX 2080 FE’s 134FPS AVG and the 1080’s 108FPS AVG shrinks to a 23.9%. The lead is dropping against resolution, as shown elsewhere. Note also that we observed a significantly higher standard deviation on the RTX 2080 overclocked card than on any of the others. This was a result of the thermal limits being hit. It’s not shown here, but we measured a massive standard deviation of 7FPS on the overclocked 2080. For perspective, all the other cards, including the stock 2080, had a standard deviation of around 0.5FPS.
GTA V GPU Benchmark – RTX 2080 vs GTX 1080 Ti
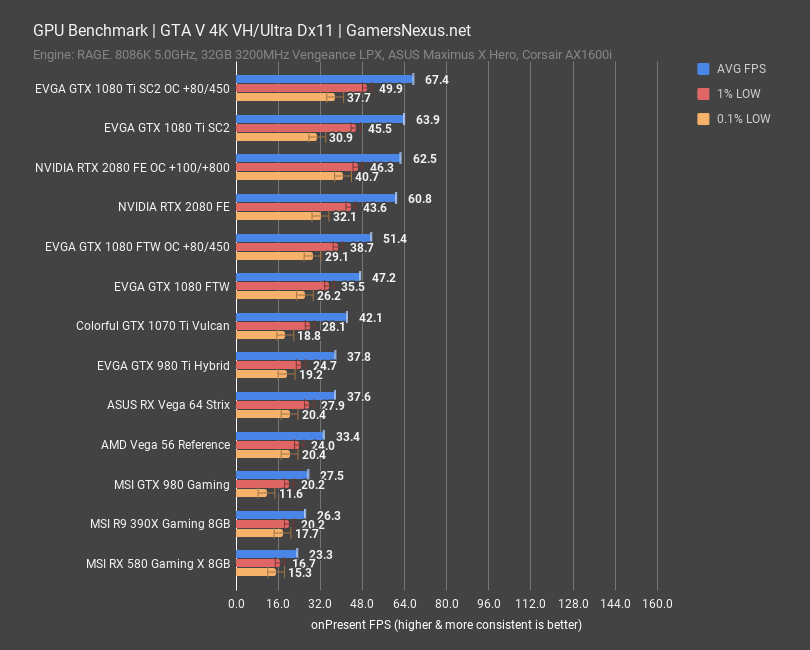
GTA V gives us another fully populated chart and runs on the RAGE engine. At 4K, the RTX 2080 FE manages 61FPS AVG, marking it as below the 1080 Ti. We retested this twice, actually, and went to 10 test passes for validation. Even with all the retests, the 1080 Ti SC2 is consistently ahead of the RTX 2080 by 5.1%. That’s a marked, noteworthy improvement in the 1080 Ti, eliminating the RTX 2080 from consideration for this game. The value isn’t there. Compared to the GTX 1080 FTW, it’s about 29% faster, but being outperformed by a 1080 Ti overshadows this growth.
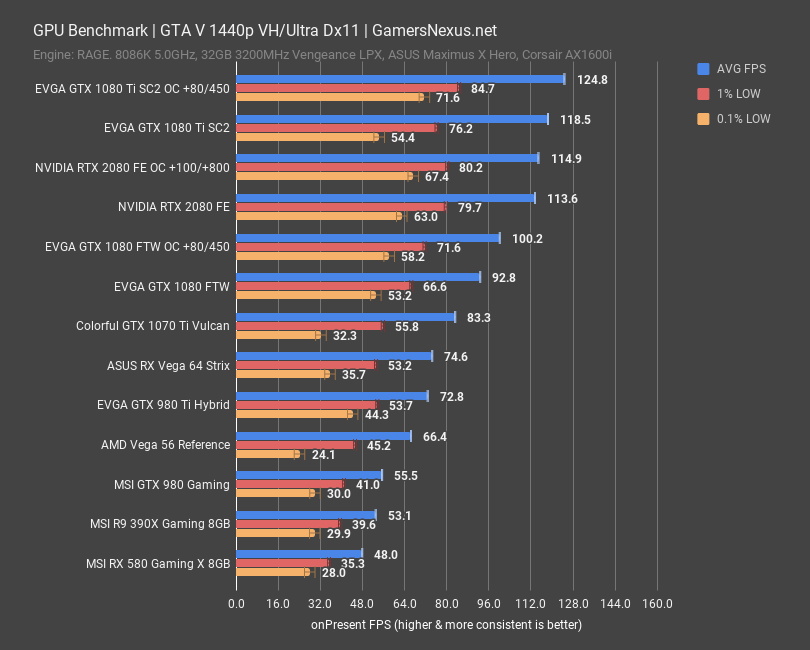
At 1440p, we see more of the same. The 1080 Ti outperforms the RTX 2080 by 4.3%. The competition is better, except the competition is also made by NVIDIA. Vega 64 runs closer to the GTX 1070 Ti, down around 75FPS AVG. We’ll skip 1080p, as it’s more of the same.
RTX 2080 Overclocking Steps & Results
Overclock stepping is next. You already saw overclocking results, but that was for a frequency that was stable across all games. We also did some additional testing.
| RTX 2080 FE Overclock Stepping | TimeSpy Extreme Stress Test | GamersNexus.net | |||||||||
| Peak Frequency | AVG Frequency | Core Offset | Core Voltage | Memory Frequency | Memory Offset | Power | Fan Speed | Active Temp | Pass/Fail |
| 1950 | 1875 | 0 | 1000 | 7000 | 0 | 0 | 41 | 72 | P |
| 1950 | 1890 | 0 | 1038 | 7000 | 0 | 124 | 50 | 75 | P |
| 1980 | 1980 | 100 | 1038 | 7000 | 0 | 124 | 52 | 76 | P |
| 2010 | 2000 | 125 | 1038 | 7000 | 0 | 124 | 55 | 76 | P |
| 2040 | 2030 | 150 | 1038 | 7000 | 0 | 124 | 55 | 76 | F - App Crash |
| App Crash - Relaunch after cool-down period | |||||||||
| 2070 | 2055 | 150 | 1038-1050 | 7000 | 0 | 124 | 41 | 72 | P |
| 2070 | N/A | 175 | 1038-1050 | 7000 | 0 | 124 | N/A | N/A | F - Black Screen |
| Black Screen - Relaunch after cool-down period | |||||||||
| 2085 | 2055 | 150 | 1038-1050 | 7000 | 0 | 124 | 41 | 65 | P |
| 2085 | 2040 | 160 | 1038-1050 | 7000 | 0 | 124 | 41 | 75 | P |
| 2085 | 2055 | 160 | 1038-1050 | 7000 | 0 | 124 | 100 | 63 | P |
| 2085 | 2070 | 160 | 1038-1050 | 7000 | 0 | 124 | 100 | 61 | P |
| 2085 | 2055 | 160 | 1038-1050 | 7000 | 0 | 124 | 100 | 63 | P |
| 2085 | 2070 | 160 | 1038-1050 | 7400 | 400 | 124 | 100 | 62 | P |
| 2085 | 2070 | 160 | 1038-1050 | 7800 | 800 | 124 | 100 | 62 | P |
| 2085 | 2070 | 160 | 1038-1050 | 8200 | 1200 | 124 | 100 | 62 | F - Flickering, Corruption |
| Flickering, Corruption - Relaunch after cool-down period | |||||||||
| 2115 | N/A | 160 | 1038-1050 | 8200 | 1200 | 124 | 100 | 51 | F - Crash |
| 2115 | N/A | 160 | 1038-1050 | 8000 | 1000 | 124 | 100 | 51 | F - Crash |
| 2115 | 2085 | 160 | 1038-1050 | 7900 | 900 | 124 | 100 | 53 | P |
| 2115 | 2070 | 160 | 1038-1050 | 7900 | 900 | 124 | 100 | 59 | F - Crash |
| 2085 | 2070 | 160 | 1038-1050 | 7800 | 800 | 124 | 100 | 62 | P |
Here’s our overclock stepping chart for the RTX 2080 FE card. We learned a lot in this process. Full stock, we peaked at 1950MHz and averaged 1875MHz while maintaining a temperature of 72 degrees or below. More on this later. The frequency pushed to 1890MHz without any offsets when only increasing to maximum power throughput. As we began to increase the offset, we found that 2070MHz was our average when under load and with a 100% fan speed – this is important, as Turing’s frequency under Boost 4.0 is dependent upon thermals. The all-time peak frequency was 2115MHz, but we ran into power perfcap limits that did not permit higher frequency. It’s odd, because the PCB can withstand far, far more amperage. NVidia has limited Turing’s overclocking capabilities and current throughput severely, and in ways which are non-linear with its overall improvements over the previous generation. Regardless, we also managed an 800MHz stable memory offset.
These stats were only true while operating at 59.4dBA with 100% speed fans, mind you. Allowing auto fan speeds to take control, we hit thermal limits hard at 2040MHz. A few of the cells in this chart are highlighted for thermal and frequency response. Just like Pascal, Turing drops clocks as temperature increases, even if it’s well under the new 87-degree throttle point. We noticed that temperatures below 63 degrees permitted higher frequencies, averaging around 2070MHz instead of 2055MHz. We also noticed this trend apply at 75C diode temperature, pushing frequency down to 2040MHz.
RTX 2080 Founders Edition Noise Testing & Acoustics
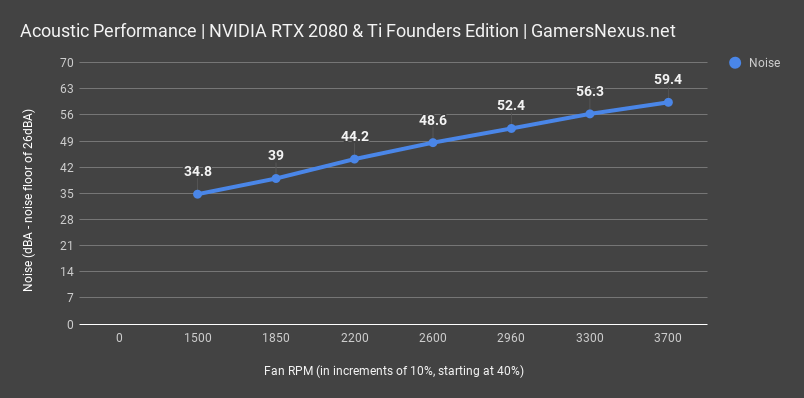
Speaking of noise, here’s a chart of the RTX 2080 Founders Edition’s percentile-based fan noise. We will show comparative noise-normalized thermal data versus previous-generation 1080 Ti coolers momentarily.
The fans have a maximum speed of approximately 4200RPM when bursting, but will stop at 3700RPM when manually set to 100%. The minimum fan speed on the FE card is 41%, or 1500RPM. At the minimum fan speed, we observed an idle noise output of 34.8dBA in a room with a noise floor of 26dBA. We measured 40.3dBA at 52% fan speed, which is the speed we used for noise-normalized thermal testing that we’ll show in a moment. At 100% speeds, which are required for peak OC performance, we measured a noise level of 59.4dBA. Most commonly during gaming workloads, the card will operate maximally around 44dBA.
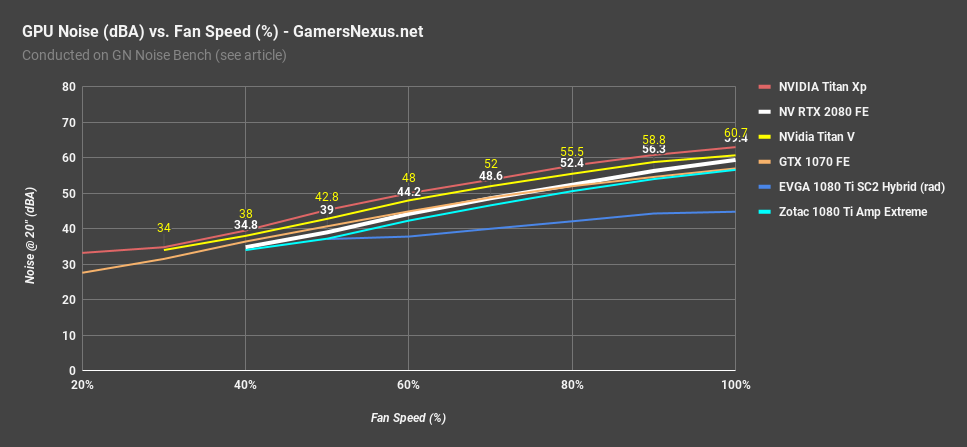
For perspective, we also have this chart to illustrate where NVIDIA’s fan curve stands in comparison to some of its previous products. The RTX 2080 FE fan curve vs. acoustic response is less aggressive than the overly loud Titan Xp and the desperately hot Titan V coolers, sitting closer to the 1070 FE cooler.
RTX 2080 FE Thermal Testing & VRM/VRAM Temperatures
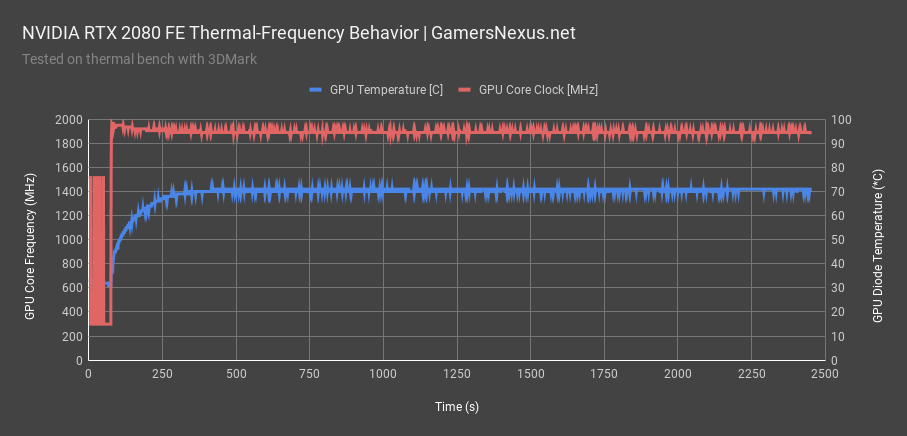
Moving into thermal testing, we’ll start with the frequency-thermal response on a full-stock RTX 2080 FE card. This is data for a card that hasn’t been torn apart and is exactly as you’d receive it from the factory, with no changes to anything.
Over a 30-minute 3DMark test, we observed frequency decay at key temperature thresholds, with drops primarily around the 60-63 degree mark and again in the 70s. You can see a slight frequency fall-off from 1965MHz to 1895MHz by end of test, which is normal behavior for nVidia’s GPUs with Boost 3.0 and, as we can see now, Boost 4.0.
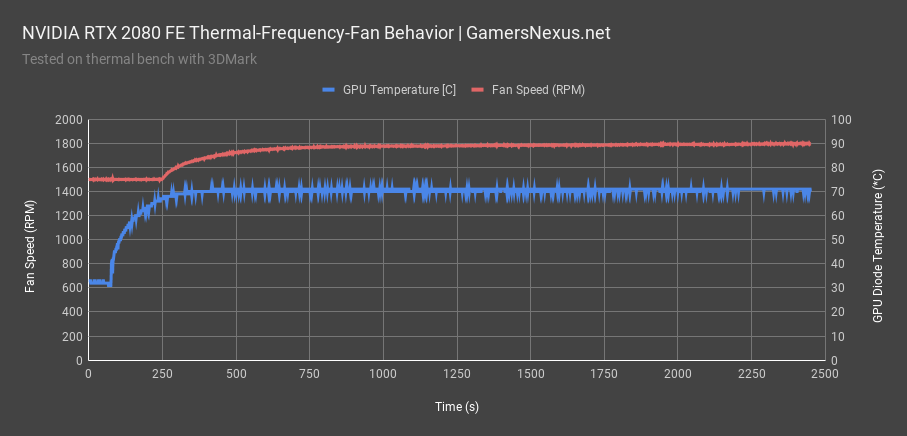
This chart shows the fan speed versus GPU core thermals. The fan ramp begins late, starting at around 68 degrees Celsius for core temperature. After that point, it ramps to about 1800RPM and remains there, as the GPU is within operating spec for the fan-speed-vs-temperature lookup table. It’d go higher if the GPU core ran warmer, like it did in FurMark.
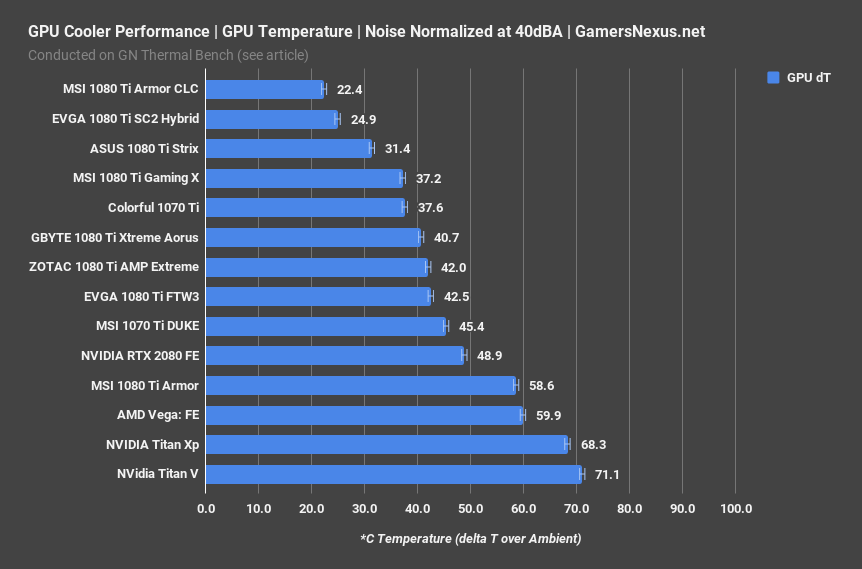
Noise Normalized Thermals
Comparatively, noise-normalized thermals for the RTX 2080 FE aren’t completely terrible. Keep in mind that this card draws a lot less power than the Ti, which we’ll talk about momentarily, but is still relatively power-hungry in sum. We don’t presently have other RTX device data, but will be adding it as we test board partner cards. For now, we offer an incomparable comparison against previous generation designs – strictly for some perspective. The RTX 2080 FE, at 40dBA of noise for all devices, manages a reasonable GPU temperature of 49 degrees delta T over ambient. We monitor ambient temperature second-to-second and calculate a delta, mind you, so this is closer to around 72 degrees in hard measurement. That puts the 2080 as better than the dismal 1080 Ti Armor and Titan Xp blower. The Titan Xp is the most directly comparable: It’s a large, high-TDP device with an nVidia reference design, and it’s beaten thoroughly by the 2080 FE. The FE does run significantly warmer than most 1080 Ti partner models, but is also a completely different device, and so these results are only useful insofar as some perspective. We’ll add RTX cards to this chart as they launch and arrive in the lab.
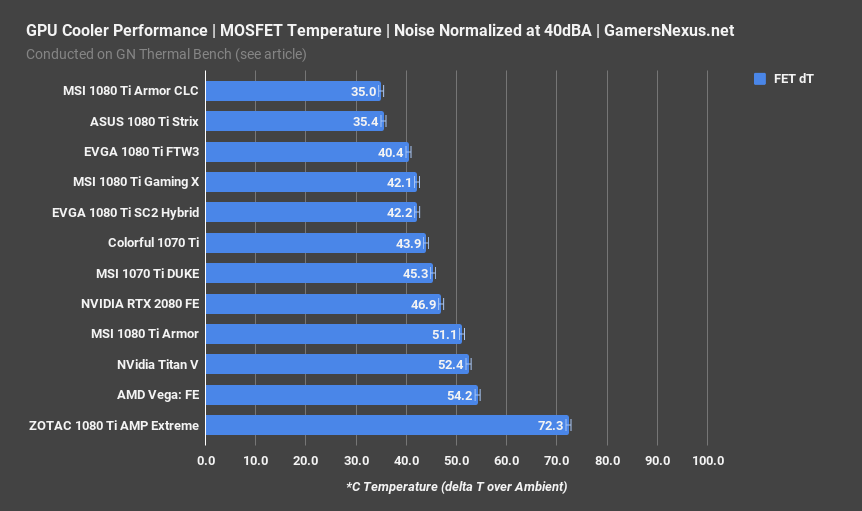
For VRM MOSFET temperatures, we stuck thermocouples all over the card and measured a VRM MOS temperature of about 46.9 degrees Celsius over ambient, making this better than the Amp Extreme, 1080 Ti Armor, and Titan V, but worse than all the partner model Tis from last generation.
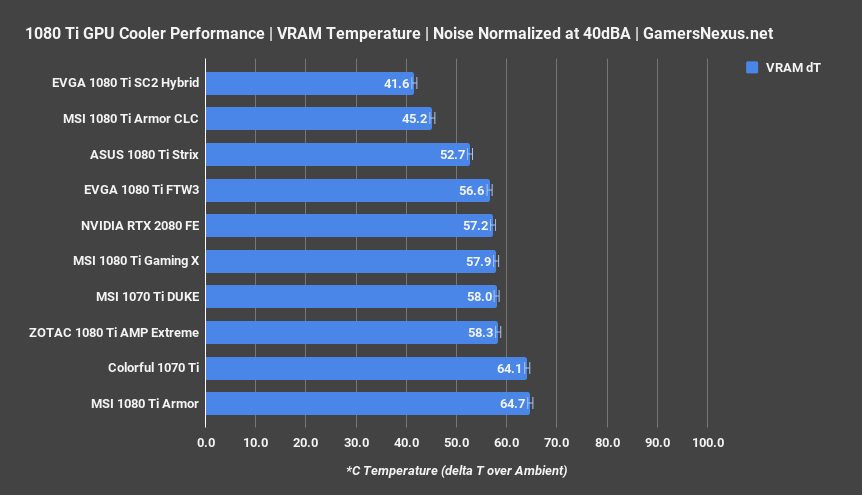
Finally, VRAM temperature is completely incomparable in a like-for-like, as we’re now looking at GDDR6 rather than GDDR5X. For this, we measured a temperature of 57.2 degrees delta T over ambient, which is within GDDR6’s operating range.
As a final point of comparison on power, we ran some brief tests measuring current draw on the PCIe cables. We did not measure at the PCIe slot, and so have not produced full power charts at this time. In order to fully know the power consumption, we would need to measure both the slot and cables. For now, we've observed that the 2080 FE hard locks to 15.0A in most titles, which is partly resultant of Boost 4.0 and partly resultant of nVidia's power limitations. Most perfcap limiters are power-related on this card. Separately, we also observed that the 1080 Ti SC2 pulls closer to 16-17A under the same conditions, but we do not know the PCIe slot draw, and so aren't sure if the 2080 is pulling more power there.
Conclusion: Is the RTX 2080 Worth It?
No -- not yet.
The card is fine, and what nVidia is trying to do is commendable and, we think, an eventual future for gaming technology. That does not mean that it's worth the price at present, however. The RTX 2080 is poor value today. NVidia's own GTX 1080 Ti offers superior value at $150 less, in some cases, or $100 less on average. The cards perform equivalently, and yet the 1080 Ti is cheaper and still readily available (and with better models, too). The RTX cards may yet shine, but there aren't any applications making use of the namesake feature just yet -- at least, not any outside of tech demonstrations, and those don't count. Until we see a price drop in the 2080, compelling RTX implementations in an actually relevant game, or depleted stock on the 1080 Ti, there is no strong reason we would recommend the RTX 2080 card.
On the upside, the nVidia Founders Edition PCB and VRM are of superior quality, and we question how much value board partners will be able to add (electrically) for this generation. It seems that nVidia will chip away at relevance for AIB partners in the dual-axial market, as it'll be difficult to beat the reference PCB design. The cooler, as usual, could use work -- a lot of it -- but it's certainly improved over Pascal's blower cooler. We still wouldn't recommend the reference card for air cooling, but for an open loop build, its VRM will be difficult to outmatch.
We also want to again recognize the direction nVidia is trying to push. More framerate offers limited usefulness, at some point, and although this is partially a means to play-out the current process node, it also offers merit for developers. We think the RTX cards would be interesting options for game developers or, as software updates to support Tensor/RT cores, potentially 3D artists. The cards are objectively good insofar as their performance, it's just that there needs to be a value proposition or RTX adoption -- one must be true, and presently, neither is. The goal to sidestep manual graphics tuning for planar reflections, caustics, and global illumination is a noble goal. Most of these effects require artist oversight and artist hours, like creating an environment map to reflect lights (this could be done in nVidia's Sol demo, for instance), creating cube maps to reflect city streets in windows, or faking caustics and refractions. With a toggle to ray trace and sample, things would be much easier. It's not here today, and we cannot review a product based on what might be here tomorrow. We will revisit the product if and when RTX games roll-out.
We would recommend 1080 Ti purchases in the $650-$700 class presently. If your region has the 2080 and 1080 Ti price-locked, well, the 2080 is equivalent in performance and would be a worthwhile purchase. We can't justify the extra $100-$150 in the US, but recognize that price equivalence would swing in favor of the 2080.
Editorial, Testing: Steve Burke
Video: Keegan Gallick & Andrew Coleman