EVGA RTX 2070 Black Review vs. GTX 970, 1070, Vega 64, & More (Overclocking, FPS, Thermals, Noise)
Posted on
After the post-apocalyptic hellscape that was the RTX 2080 launch, NVIDIA is following it up with lessons learned for the RTX 2070 launch. By and large, technical media took issue with the 2080’s price hike without proper introduction to its namesake feature—that’d be “RTX”—which is still unused on the 2070. This time, however, the RTX 2070 launches at a much more tenable price of $500 to $600, putting it at rough price parity with the GTX 1080 hanger-on stock. It becomes easier to overlook missing features (provided the buyer isn’t purchasing for those features) when price and performance parity are achieved with existing products and rendering techniques. This is what the RTX 2070 looks forward to most.
Our EVGA RTX 2070 Black review will focus on gaming benchmarks vs. the GTX 1070, GTX 970, Vega 64, and other cards, as well as in-depth thermal testing and noise testing. We will not be recapping architecture in this content; instead, we recommend you check out our Turing architecture deep-dive from the RTX 2080 launch.
RTX 2070 Block Diagram
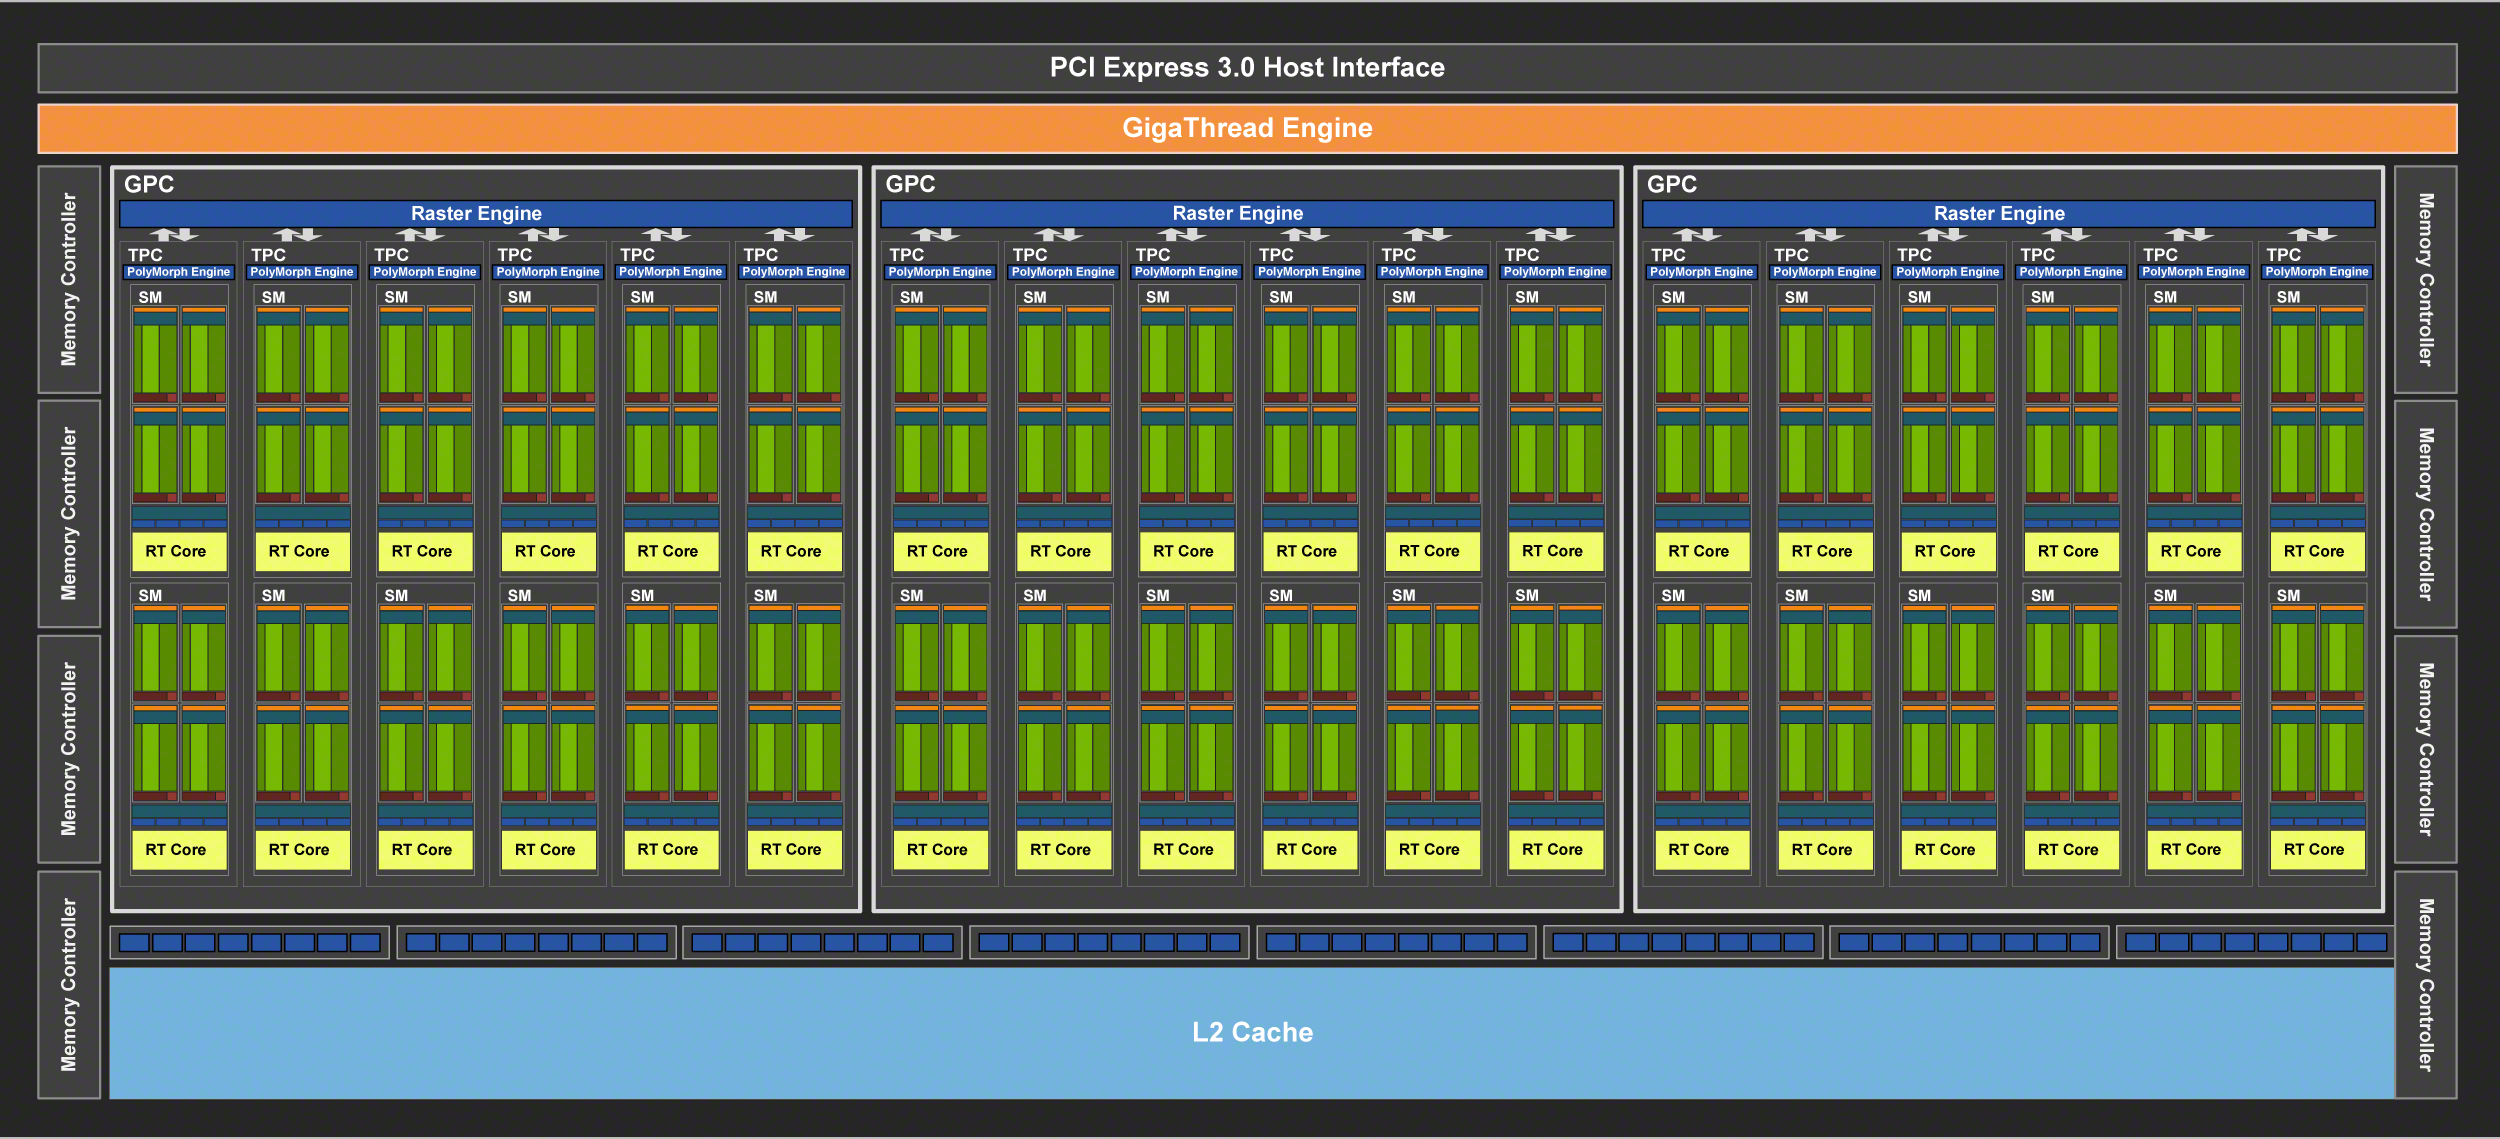
The block diagram for the TU106-400 GPU is above. It’s the same structure as what we discussed with TU102, except hacked in half for a total of three GPCs. The rest of the containerization remains the same, and we’d recommend watching our Turing architecture discussion for more of that. In short, there’s still one overarching command processor at top that deals with shoving things into GPU memory from the PCIe bus and tasking the workload out, then there are three GPCs, each of which contains six TPCs, each of which contains two SMs, which then contains 64 FPUs. The end total is 2304 FP32 FPUs. Read the Turing architecture deep-dive for more information on this.
EVGA’s RTX 2070 Black & nVidia’s Revised Sampling Guidelines
EVGA’s RTX 2070 is a $500 model which carries no additional branding, it’s just “RTX 2070.” Technically, we’re told that the card is an EVGA RTX 2070 Black edition, but we’d assume the limited margin on a $500 unit prohibited EVGA from investing in the additional ink.
For this round of review units, nVidia is asking partners to handle product sampling. This isn’t abnormal for non-halo launches; however, in addition to this, nVidia also required that board partners ship a $500 (MSRP) SKU to reviewers and noted that more expensive models must be accompanied with MSRP SKUs. From what nVidia tells us, this is to help combat issues with partners sending only their most expensive models, resulting in skewed price-to-performance reporting that never sees cards at MSRP. We don’t find this wholly unreasonable, given that we end up buying most of the ultra low-end models typically, since partners aren’t too keen to share their cheapest cooling solutions with the press. All of this results in a bit of a battle between partners and nVidia: The partners rely on NV for performance of the GPU, and so must differentiate from competitors in cooler quality; the supplier relies on partners to not paint a picture of being priced out of affordability, and so wants the MSRP units to actually be dispatched. Both are reasonable needs and wants, it just so happens that the supplier has ultimate choice in the direction followed.
For this launch, you’ll likely see more $500 SKUs than we would have otherwise, and the more expensive coolers won’t get as much coverage until later.
Points of Interest for 2070: Memory Bandwidth
As we progress through the benchmark charts for this review, we’d recommend paying close attention to scaling performance across resolutions. A good point of comparison would be the GTX 1080 and RTX 2070, where performance disparities emerge at 1080p and often converge at 4K. In these scenarios, memory bandwidth is potentially a limiter of the RTX 2070’s full stride. Memory bandwidth requirements increase faster than the FLOPS requirement increases, in some cases. Memory overclocking demonstrates this well.
Test Methodology
Testing methodology has completely changed from our last GPU reviews, which were probably for the GTX 1070 Ti series cards. Most notably, we have overhauled the host test bench and had updated with new games. Our games selection is a careful one: Time is finite, and having analyzed our previous testing methodologies, we identified shortcomings where we were ultimately wasting time by testing too many games that didn’t provide meaningfully different data from our other tested titles. In order to better optimize our time available and test “smarter” (rather than “more,” which was one of our previous goals), we have selected games based upon the following criteria:
- Game Engine: Most games run on the same group of popular engines. By choosing one game from each major engine (e.g. Unreal Engine), we can ensure that we are representing a wide sweep of games that just use the built-in engine-level optimizations
- API: We have chosen a select group of DirectX 11 and DirectX 12 API integrations, as these are the most prevalent at this time. We will include more Vulkan API testing as more games ship with Vulkan
- Popularity: Is it something people actually play?
- Longevity: Regardless of popularity, how long can we reasonably expect that a game will go without updates? Updating games can hurt comparative data from past tests, which impacts our ability to cross-compare new data and old, as old data may no longer be comparable post-patch
Game graphics settings are defined in their respective charts.
We are also testing most games at all three popular resolutions – at least, we are for the high-end. This includes 4K, 1440p, and 1080p, which allows us to determine GPU scalability across multiple monitor types. More importantly, this allows us to start pinpointing the reason for performance uplift, rather than just saying there is performance uplift. If we know that performance boosts harder at 4K than 1080p, we might be able to call this indicative of a ROPs advantage, for instance. Understanding why performance behaves the way it does is critical for future expansion of our own knowledge, and thus prepares our content for smarter analysis in the future.
For the test bench proper, we are now using the following components:
GPU Test Bench (Sponsored by Corsair)
Component | Courtesy of | |
CPU | GamersNexus | |
GPU | This is what we’re testing! | Often the company that makes the card, but sometimes us (see article) |
Motherboard | ASUS | |
RAM | Corsair | |
PSU | Corsair | |
Cooler | NZXT | |
SSD | Plextor 256-M7VC | GamersNexus |
Separately, for the initial RTX 20-series reviews, we are using 10-series board partner models instead of reference models. This is because we know that most of the market, for fact, is using board partner models, and we believe this to be the most realistically representative and relatable for our audience. We acknowledge that the differences between the RTX and GTX reference cards would be more pronounced than when comparing partner cards, but much of this is resultant of poor cooler and reference card solutions in the previous generation. It creates, in our eyes, an unrealistically strong appearance for incoming cards on dual-axial coolers, and does not help the vast majority of users who own board partner model 10-series cards.
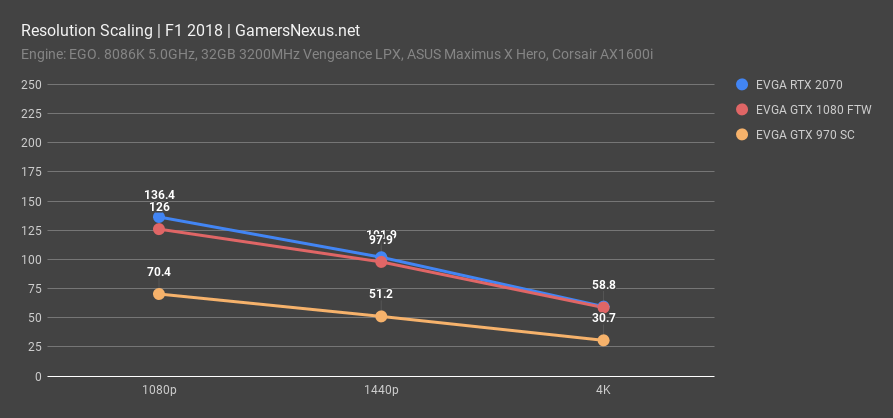
RTX 2070 vs. RTX 2080 & 1070 Benchmark: F1 2018 4K
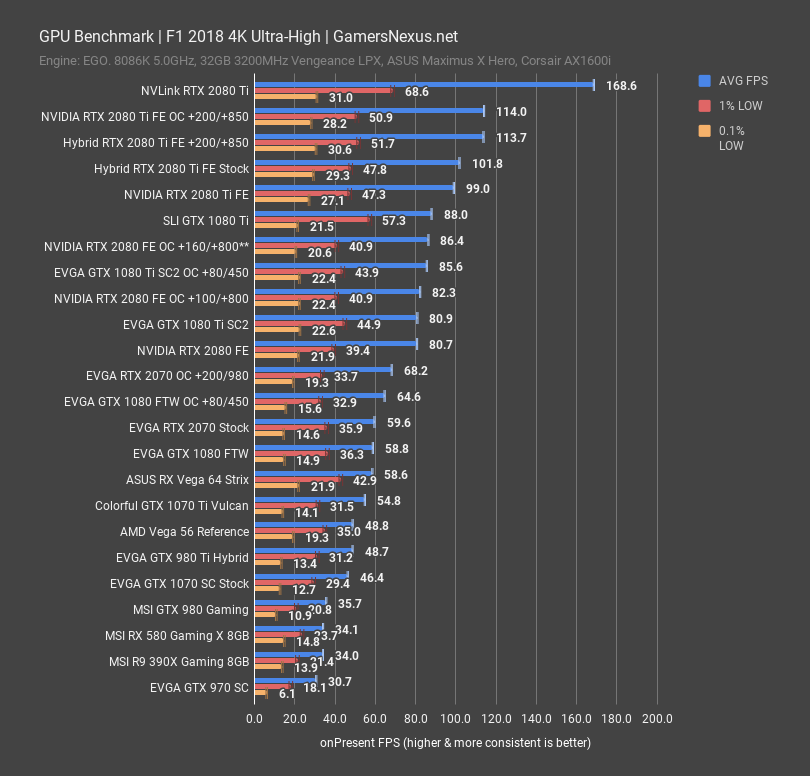
F1 2018 is an EGO Engine game by Codemasters, offering a stand-in benchmark for comparison against most other Codemasters or racing games. This game is highly GPU-intensive, even at 1080p. We’ll work toward that resolution.
At 4K, we observed F1 2018 placing the EVGA RTX 2070 at approximately the same level of performance as a board partner EVGA GTX 1080 FTW from last generation. We’re at around 60FPS on each, with the difference within margin of error. We managed to overclock our RTX 2070 fairly high, something we’ll discuss momentarily, to outperform the overclocked GTX 1080 by about 5.6%. This is within silicon lottery territory, granted, and we previously found that overclocked 1070 Tis mostly equate overclocked 1080s. Generationally, the RTX 2070 operates approximately 28% faster than the GTX 1070 SC from last generation. It is about 94% faster than one of the world’s best-selling video cards, the GTX 970 from a few years ago. Note that the scaling here should diminish with resolution. AMD’s Vega 56 operates at 49FPS AVG, permitting the 2070 about a 20% lead.
RTX 2070 vs. GTX 970, Vega 64 Benchmark: F1 2018 1440p
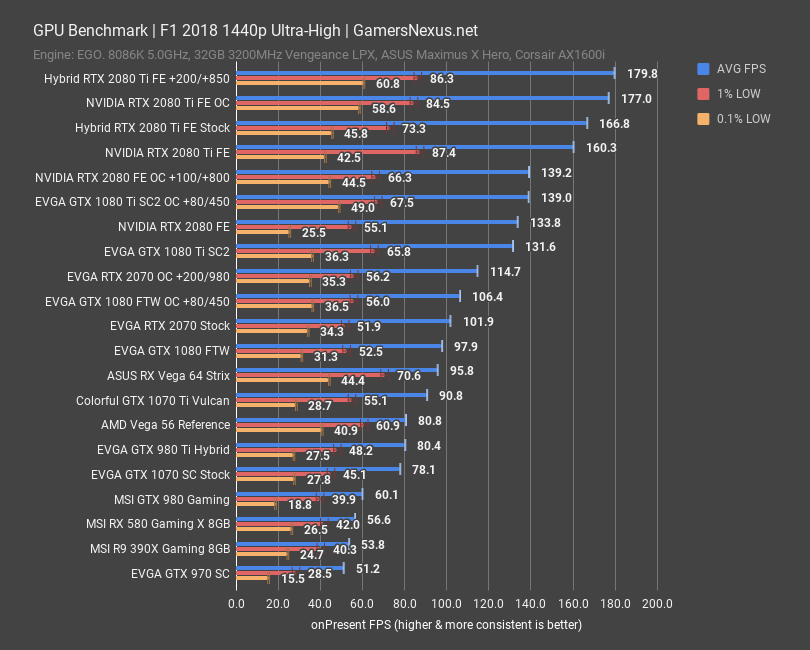
At 1440p, the RTX 2070 scales approximately 4% over the GTX 1080 that we tested, operating an average framerate of about 102FPS. The GTX 1070 Ti maintains a 91FPS AVG, and the GTX 1070 SC maintains a 78FPS AVG. The RTX 2070 holds about a 30% lead over the GTX 1070 SC at this resolution. Vega 56 maintains an 81FPS AVG, placing it between the 1070 Ti and 1070. For anyone on a GTX 970, you’re looking at an approximate 2x increase in performance in this test. The RTX 2080 offers a gain of about 30% over the 2070 at a price hike of $300.
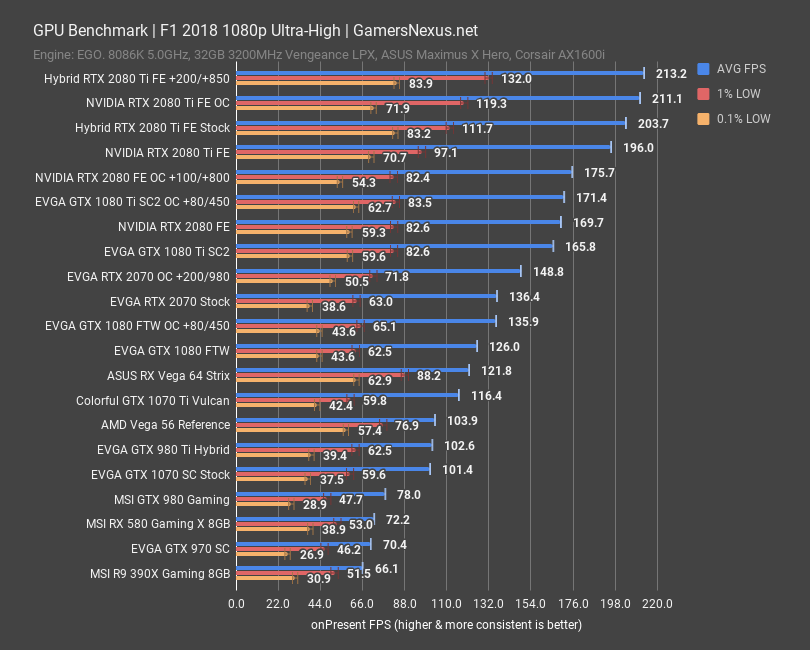
RTX 2070 vs. GTX 970 & 1070 Benchmark: F1 2018 1080p
Finally, for 1080p, the RTX 2070 manages a 136FPS AVG, which still isn’t CPU-bound. Overclocking pushes us another 12FPS higher, for a marked gain of 9%. Here’s where it actually gets interesting: The RTX 2070 now posts a gain of about 8% over the GTX 1080, whereas 4K had them at near equivalence. We believe this is because 4K pushes the memory bandwidth requirement harder, where the 2070 had relatively marginal gains over the GTX 1080.
Resolution Scaling Deltas on RTX 2070 vs. GTX 1080 (F1 2018)
Just to visualize it, here’s a chart showing performance deltas between the 2070 and 1080 as resolution scales. Notice that the performance delta starts to grow at 1440p, then widens at 1080p. At 4K, the 2070 becomes choked by its memory bandwidth and meets the GTX 1080.
Sniper Elite DirectX 12 Benchmark: RTX 2070 vs. RTX 2080, 1080 Ti, 980 Ti, Vega 64
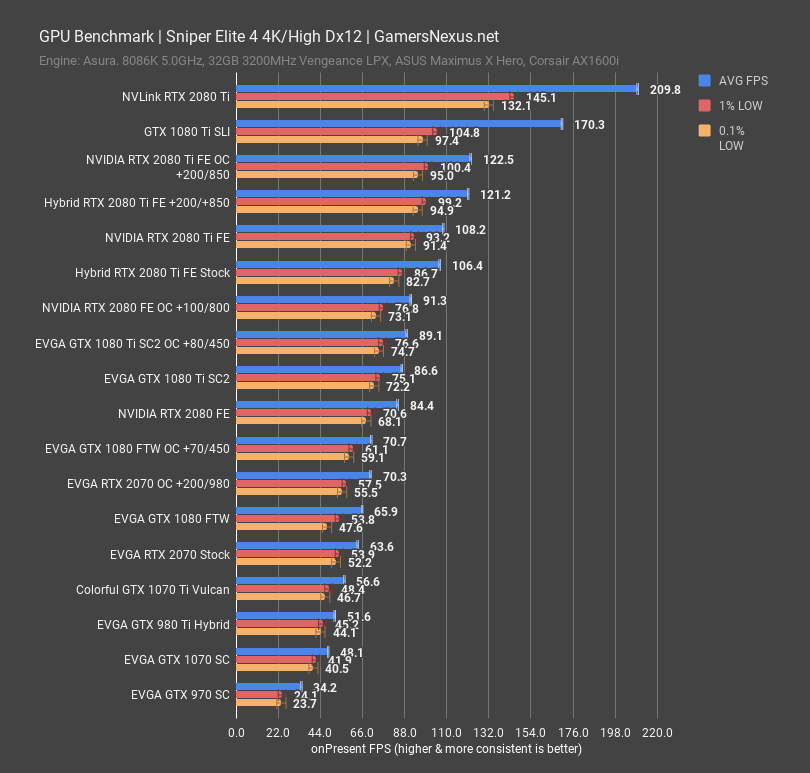
Sniper Elite 4 is another good test scenario. This game runs on the Asura engine and is among the best-built games from a performance standpoint. We use this game sometimes partly synthetically, as its DirectX 12 and asynchronous compute integrations are the primary points of interest. We restrict testing to 4K on this one; at least, we will until the lower-end cards come out. This is because it already posts such strong performance.
At 4K, the RTX 2070 manages a 64FPS AVG in Sniper Elite 4, marking parity with the GTX 1080’s 66FPS AVG. This is outside of our error margin, but is overall insignificant to the player. For scaling, we see the GTX 1070 at 48FPS AVG and allowing the RTX 2070 a gain of 32%. The GTX 970 operates a 34FPS AVG, again nearing a 2x gain in the 2070.
RTX 2070 Frametimes vs. GTX 970 & GTX 1070
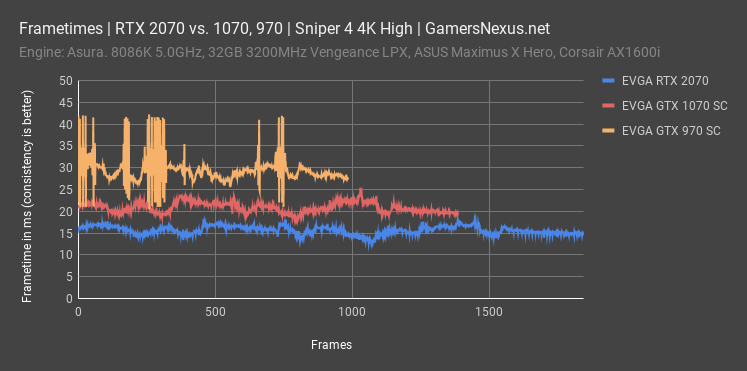
This chart shows frametimes between Turing, Pascal, and Maxwell generations. This is the best way to look at performance. Although framerate is flawed in significant ways, it remains standardized and easiest to read. We’ve been pushing more frametime plots as performance measures. Lower is better on this chart, and even more important than being low is being consistent. The left axis depicts the on-present frame-to-frame interval in milliseconds. The spikier the present interval, the worse the experience and fluidity of frame throughput. For reference, 16ms would be 60FPS. The GTX 970 experience is significantly more prone to choppy frame throughput and its frametimes are inconsistent overall. This inconsistency is more problematic than anything else. The GTX 1070 and RTX 2070 both maintain consistent frame-to-frame intervals.
4K RTX 2070 Far Cry 5 Benchmark vs. GTX 1070, 1080
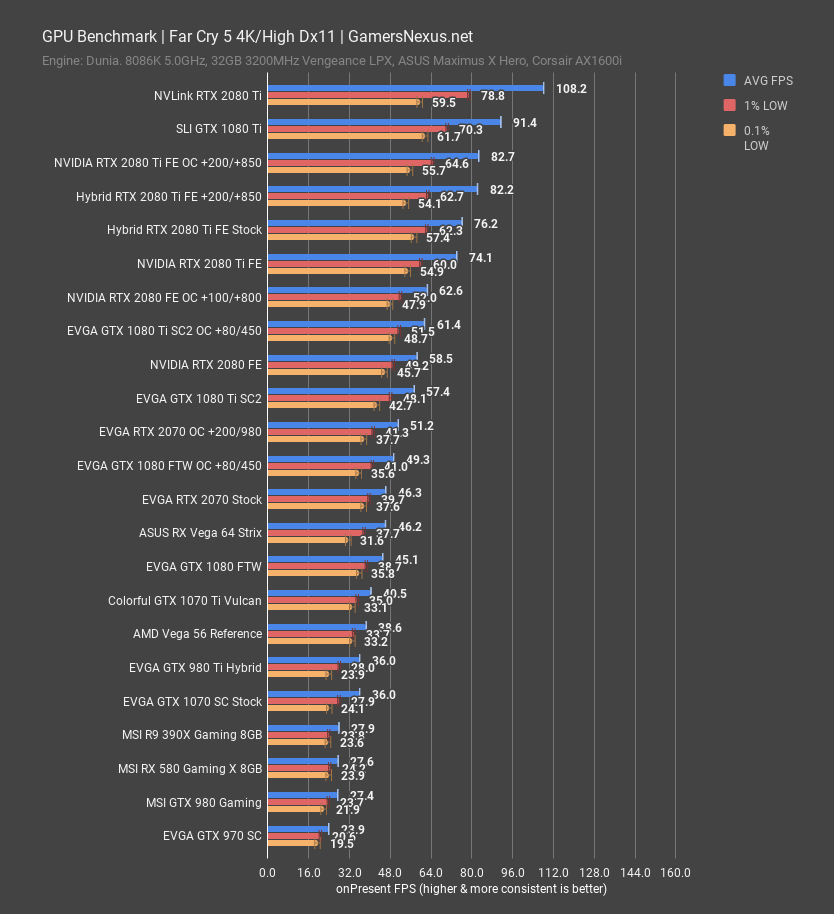
Far Cry 5 uses the Dunia engine and is a Ubisoft title. The game is another GPU-intensive option for testing, thriving particularly on particle effects and geometric complexity in character models.
At 4K, the RTX 2070 operates a 46FPS AVG, with lows relatively tightly timed and in the 30s. The GN-coined 1% and 0.1% low values are representative of similarly smooth frametime performance to what you’d see in the previous chart. The GTX 1080 is again at rough parity, with the GTX 1070 at 36FPS AVG. In this title and at 4K, the 2070 performs about 29% faster than the GTX 1070. The GTX 970 is about half the 2070’s performance. The 2080’s 59FPS AVG leads the 2070 by about 26%.
1440p RTX 2070 Far Cry 5 Benchmark vs. GTX 1070, 1080
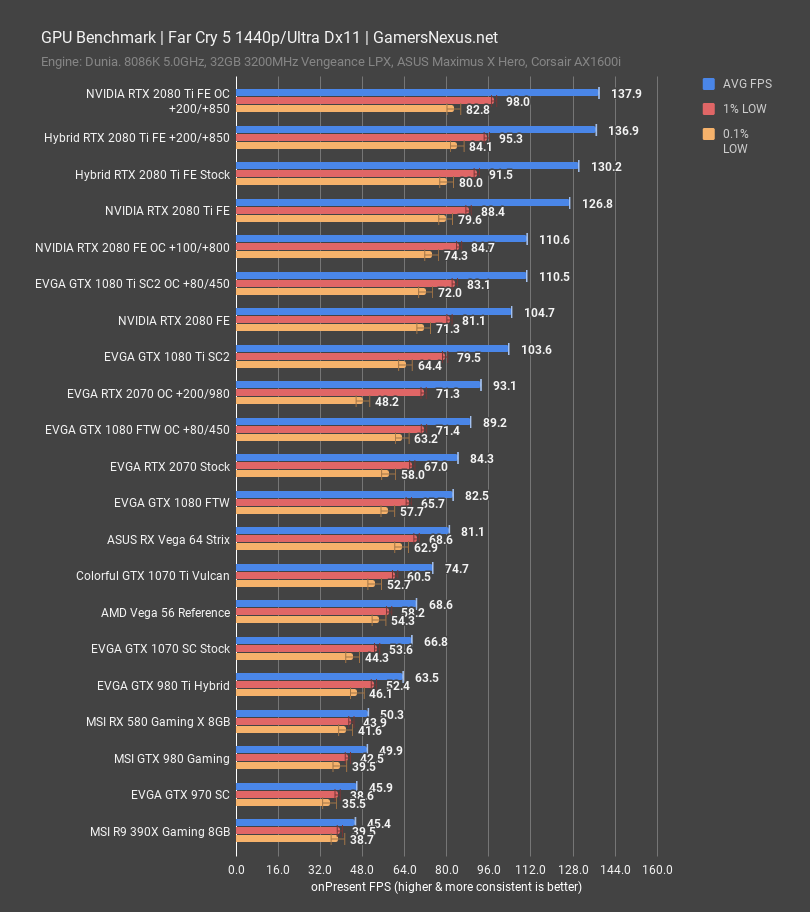
At 1440p, we see the 2070 again at rough parity with the GTX 1080, including rough price parity. Vega 64 is also nearby, operating at 81FPS AVG and at rough parity with the 2070 and 1080.
1080p RTX 2070 Far Cry 5 Benchmark vs. GTX 1070, 1080
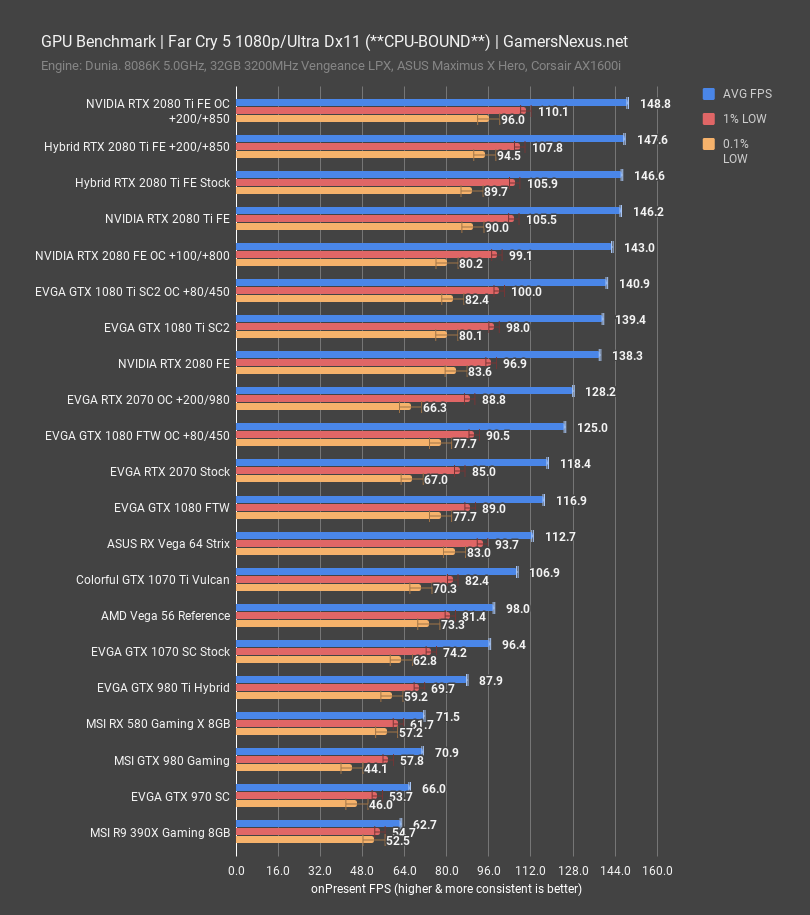
1080p is less valuable at the high-end, as we begin hitting CPU bottlenecks with the Ti-class cards. The 2070 manages a 118FPS AVG, about equal to the 117FPS AVG of the 1080. We are within silicon quality variance between these two chips, given how nVidia’s Boost algorithm behaves. Let’s move on to another chart.
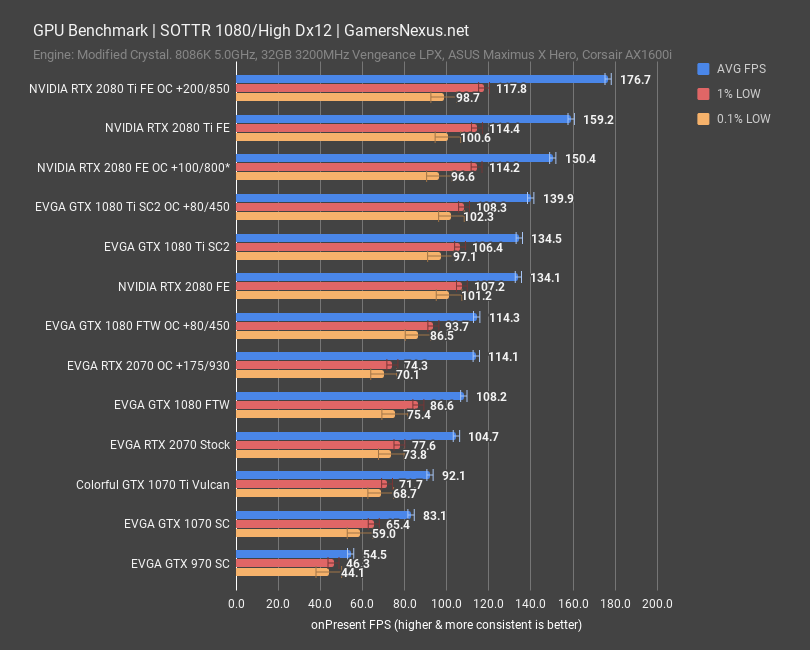
4K Shadow of the Tomb Raider GPU Benchmarks: RTX 2070 vs. 2080, Vega 64
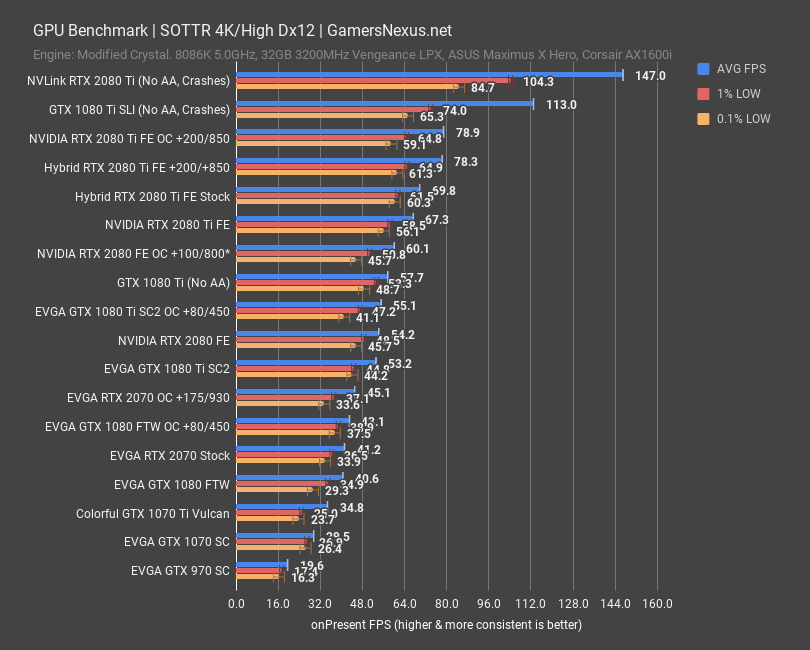
Next up, Shadow of the Tomb Raider – the eventual RTX title that is still awaiting more proper RTX support and tuning. This is an Eidos and Square Enix game that runs on a modified Crystal engine. At 4K, the RTX 2070 manages a framerate of about 41FPS – not bad, really, but not good enough to hold these settings. Dropping to lower settings would permit playability. Compared to the GTX 1070’s 30FPS, it’s still a significant performance increase, and one which allows parity with the GTX 1080.
1440p Shadow of the Tomb Raider GPU Benchmarks: RTX 2070 vs. 2080, Vega 64
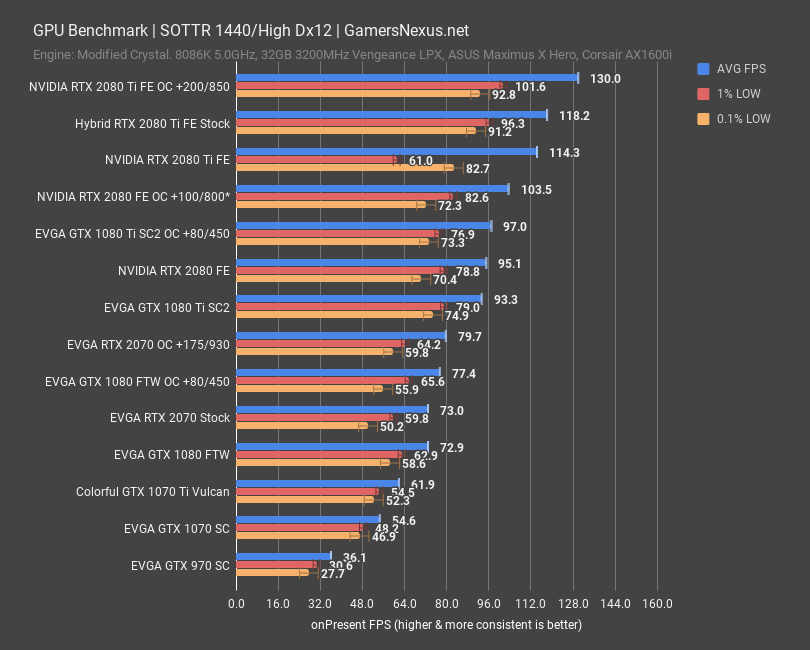
1440p positions the 2070 in a more playable spot while running these settings, holding an 80FPS AVG when overclocked – though we did have to drop our OC – or 73FPS stock. The 2070 is again at parity with the 1080, again posts rough 33% gains over the 1070, and again splits the difference with the 1070 Ti.
1080p Shadow of the Tomb Raider GPU Benchmarks: RTX 2070 vs. 2080, Vega 64
4K GTA V GPU Benchmark in 2018: RTX 2070 vs. GTX 1070
Grand Theft Auto V remains one of the most-played games today, and runs on the RAGE engine by Rockstar Games. The benefit of this game is that it is fairly mature at this point, and so future updates that impact performance are unlikely. This is valuable.
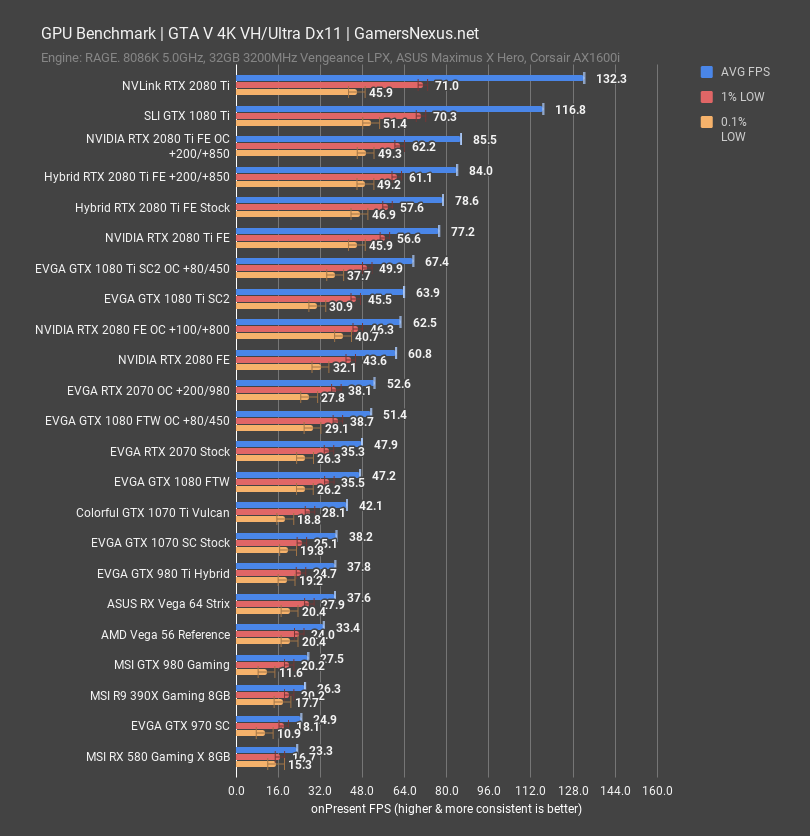
At 4K, the 2070 operates at functional equivalence to the 1080 and is within error margins. Overclocking provides the 2070 a slight lead, but not one which exits silicon quality variance. The RTX 2080 manages a 27% boost over the 2070, and the 2070 manages a 25% boost over the GTX 1070. The GTX 970 is, again, about half the speed of the 2070.
1440p GTA V GPU Benchmark in 2018: RTX 2070 vs. GTX 1070
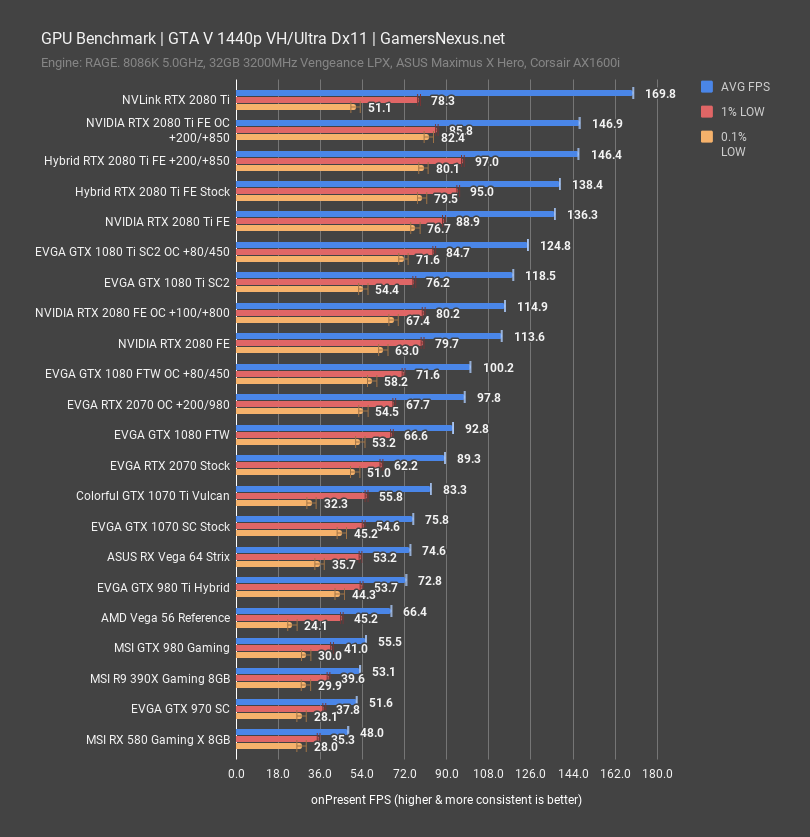
Here’s another interesting spin: In this game, going to 1440p allows the 1080 to take the lead, contrary to what we saw in F1. This is the opposite problem: Memory bandwidth isn’t the issue in this one, as the performance is scaling worse than the 1080 as resolution scales down. It’s more likely that this behavior is resultant of better driver tuning in Pascal for GTA at this time.
1080p GTA V GPU Benchmark in 2018: RTX 2070 vs. GTX 1070
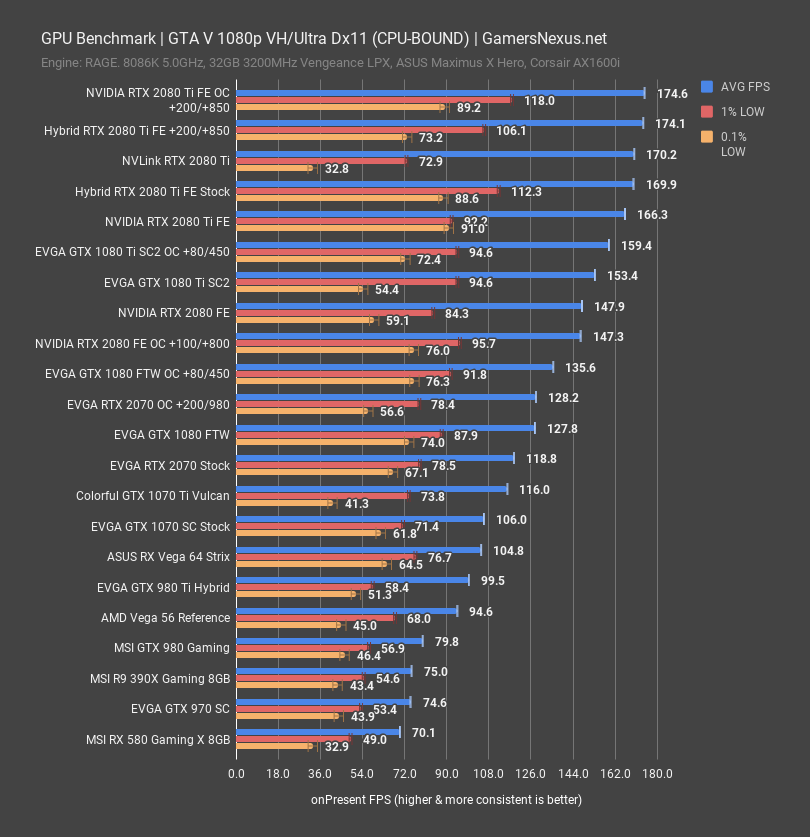
1080p also shows scaling opposite of expectations set by F1. We are presently uncertain as to why this particular game performs opposite to F1 in resolution scaling, but are still researching.
Ashes of the Singularity: Escalation DirectX 12 Benchmark: RTX 2070
Finally, Ashes of the Benchmark runs on the Nitrous engine, and is more parts benchmark than game, at this point. To Star Dock’s credit, it is very well optimized as a DirectX 12 benchmark.
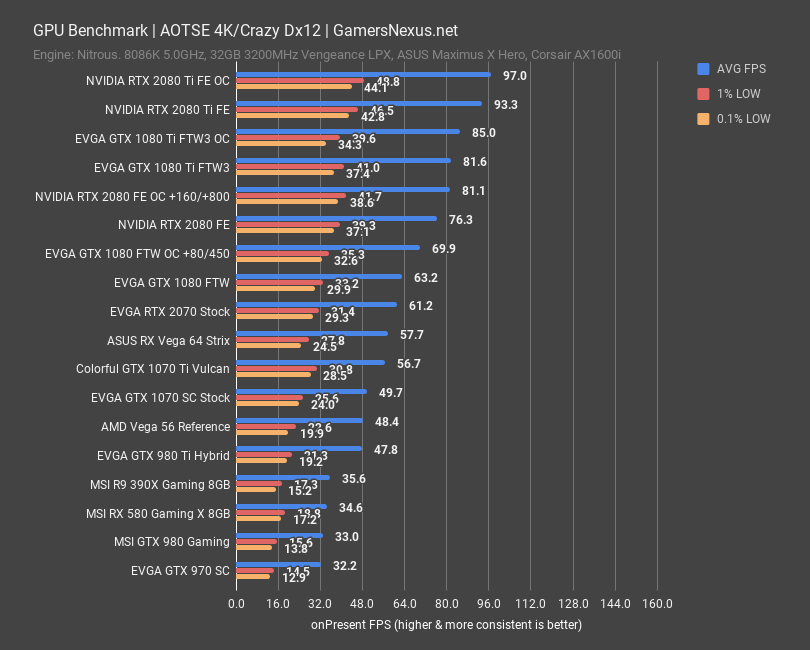
This one is almost entirely synthetic and can become CPU-bound, so we’ll stick to 4K and Crazy. At these settings, the RTX 2070 is comparable again to the GTX 1080, but is outside of error margins in its differences. The 1080 maintains a 3.2% lead. Meanwhile, the RTX 2070 is about 6% faster than the similarly-priced Vega 64 card. In this regard, AMD is starting to re-enter the conversation as an option, as we’re no longer only talking about the ultra high-end. We never particularly liked 64, instead favoring 56 a great deal over it, but the point remains the same: Vega is a reasonable competitor and is a bit cheaper, and therefore should be considered in addition to the 1080 alternative.
RTX 2070 Overclocking & Benchmarks
Overclocking follows the same process as what we extensively detailed in our RTX 2080 review, but we now enter the fray with more knowledge of memory straps and delta clocks. This is largely thanks to guidance from professional overclocker KINGPIN, who provided oversight on GPU memory overclocking.
| EVGA RTX 2070 Overclock Stepping | TimeSpy Extreme Stress Test | GamersNexus.net | ||||||||||
| Peak Frequency | AVG Frequency | Core Offset | Core Voltage | Memory Frequency | Memory Offset | Power | Fan Speed | Active Temp | Pass/Fail | Perfcap |
| 1800 | 1730 | 0 | 981 | 7001 | 0 | 100 | 1816 | 61 | P | PWR |
| 1830 | 1785 | 0 | 1060 | 7001 | 0 | 114 | 1976 | 63 | P | PWR |
| 1890 | 1860 | 100 | 1060 | 7001 | 0 | 114 | 2017 | 63 | P | PWR |
| 1935 | 1910 | 150 | 1060 | 7001 | 0 | 114 | 2048 | 63 | P | PWR |
| 1950 | 1925 | 175 | 1060 | 7001 | 0 | 114 | 2053 | 63 | P | PWR |
| 1995 | 1950 | 200 | 1060 | 7001 | 0 | 114 | 2053 | 63 | P | PWR |
| 2010 | 1990 | 225 | 1060 | 7001 | 0 | 114 | 2053 | 63 | F - Application Stall | PWR |
| Fail - Application Stall | ||||||||||
| 1995 | 1935 | 200 | 1060 | 7981 | 980 | 114 | 2000 | 63 | P | PWR |
| 1995 | 1935 | 200 | 1060 | N/A | 1030 | 114 | 2000 | 63 | F | PWR |
| Fail - Application Stall | ||||||||||
| 1995 | 1970 | 200 | 1060 | 7981 | 980 | 114 | 3800 | 41 | P | PWR |
| 1995 | 1950 | 200 | 1060 | 7981 | 980 | 114 | 3800 | 53 | P | PWR |
The EVGA RTX 2070 base model operates a peak frequency of about 1800MHz when full stock, averaging roughly 1730MHz in our TimeSpy Extreme workload. Note that this will vary based upon workload. We immediately noticed that power is the only perfcap, here. Increasing the power target to a maximum of 114% and changing nothing else, we were able to push the peak clock up another 30MHz, with the average frequency increasing by about 50MHz. From there, we manually tuned until finding stability at about 2000MHz peak and with an offset of 980MHz on the memory. In our RIPJAY testing, we found that 980MHz is one of the memory straps, as is 930MHz and, we think, 1240MHz. Keeping temperatures below 50C will allow clocks to average about 1970MHz on this card and under these conditions, but we found steady state restricting us closer to 53-60 degrees Celsius. More on thermals next. As previously, and as indicated on this chart, core temperature heavily impacts overclocking capabilities.
This card is a strong overclocker but is severely limited by its power consumption. It is possible that higher-end cards with custom VBIOS builds will have meaningful overclocking gains.
EVGA RTX 2070 Black Temperature & Thermals
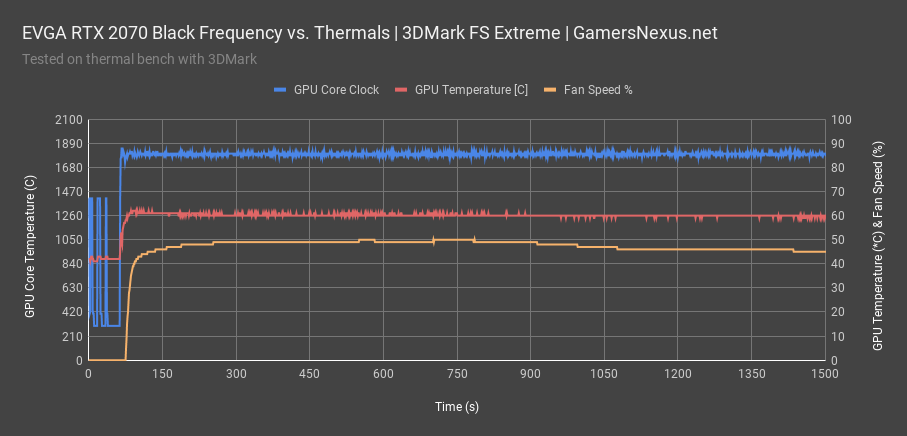
This next chart shows frequency over time plotted against thermals. The value in this chart is illustrating if or when the GPU clock throttles to control for thermals. In this instance, with EVGA’s cooler, we aren’t observing temperature climb past about 61-63 degrees Celsius when left to auto controls. EVGA’s BIOS modulates fan speed to regulate for a rough 61-63 degree temperature, typically maintaining an RPM of about 1800. We’ll talk about this as it impacts noise later. The peak frequency starts at about 1845MHz in this Firestrike Extreme test, then drops down to a range of 1770MHz to 1815MHz once we’re north of about 53 degrees. This is normal Boost behavior for nVidia cards.
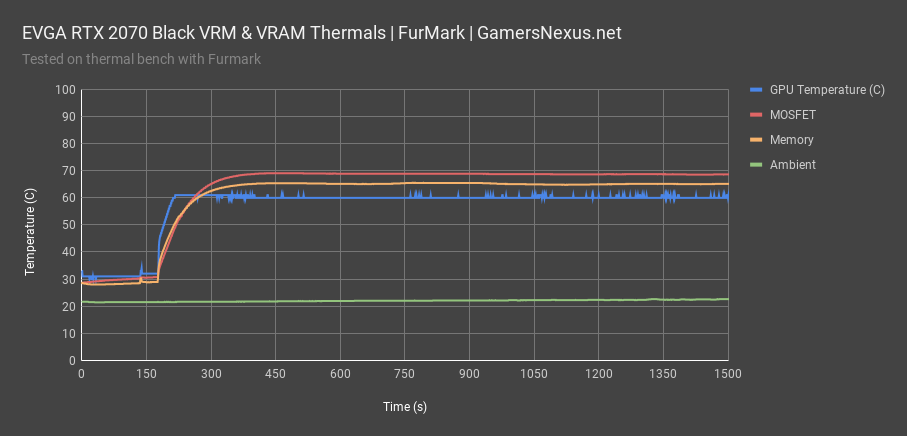
This chart is a bit of unique GN testing, where we stick thermocouples to the hottest MOSFET and hottest GDDR6 memory module. We use a power virus workload for this test, wherein the GPU remains close to about 60 degrees Celsius when following EVGA’s stock VBIOS for thermal-noise response. The hotspot NCP MOSFET measures at about 69 degrees Celsius, and the hottest memory module measures 66 degrees Celsius. These are actually very good results thermally. Memory modules typically want to stay under 90 degrees, at least for GDDR5, and MOSFETs can take up to and over 125 degrees. In this instance, EVGA’s cooler is more than adequate, even for a model which is clearly cheap in every other department. Killing LEDs and frills and investing all the spend into the cooler was a good move. Aside from the obvious power constraints, this MSRP unit is actually a decent thermal performer. That’s a rarity for low-end models.
EVGA RTX 2070 Black vs. 2070 Founders Edition Noise Levels
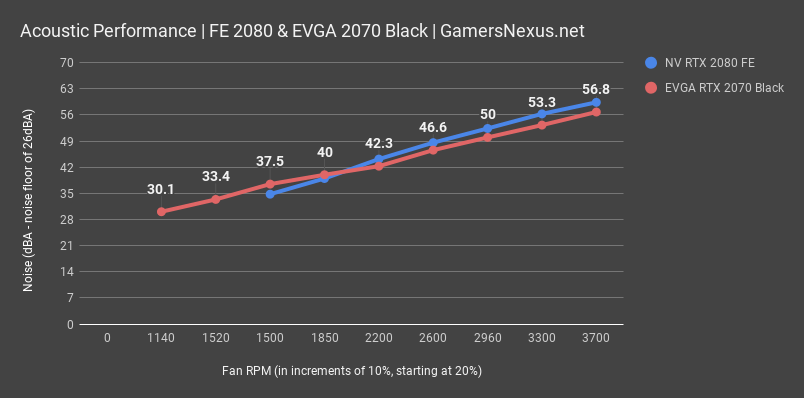
The EVGA RTX 2070 Black tries to stay around 60 degrees Celsius, so its acoustic performance will hinge upon your room and case ambient temperatures. For our testing in an ambient environment of about 21C, this had us typically around 1800 to 1900RPM, where noise levels were about 40dBA. The EVGA card is overall quieter than the FE designs at each RPM level, maxing-out at 56.8dBA when at 100% speed, or 3800RPM. We typically found that the card sat around 40dBA in a noise floor of about 26dB.
Conclusion: Is the RTX 2070 Worth It?
The trouble is that we’re looking at a 30% performance increase over the GTX 1070 for a 30% price increase. While this might sound like a fair trade on paper, the reality is that we already had this option. It’s functionally a re-release of the GTX 1080, except you can think of it as coming with RTX capabilities for “free.” The difference being, of course, that we simply can’t use those RTX functions just yet, and we can’t recommend buying a promise. From a value perspective, this is a significant improvement over the 2080 launch, but still unexciting. The GTX 1070 offered upwards of a 50-60% performance jump over the 970 for a 25% price jump, moving the bar from $330 to between $380 and $450. Most cards fell under $430. The RTX 2070 offers 30% more performance for 30% more money, and therefore is neither offensive nor exciting.
Eventually, Pascal stock will dry-up and leave us with no choice against the similarly priced GTX 1080. That’ll simplify things. At present, the driving reason one might buy an equally priced GTX 1080 over an RTX 2070 would be for superior partner models (which are now cheap – you can get an FTW cooler instead of an SC/Black cooler, for instance). Beyond that, the 2070 bears better driver upgrade paths going forward.
Then there’s Vega, which has been easy to overlook in recent months. NVidia has done well to dominate the high-end, where AMD presently has zero competition. This also means that the discussion, at least as it pertains to the Ti-class cards, has only ever pitted nVidia’s products against its other products. AMD has been left out of those comparisons as the price and performance gap is too large to consider. In this scenario, AMD’s Vega 64 and Vega 56 cards re-enter the fray, with the latter primarily being viable with heavy modifications (like the ones we did). Vega 64 can be had for around the same price as the 2070, and theoretically should remain more accessible than Pascal as last-gen fades to RTX.
Editorial, Testing: Steve Burke
Video: Andrew Coleman