Intel i9-9900K CPU Review: Solder vs. Delid, Streaming Benchmarks, & Gaming vs. 2700(X), 8700K, More
Posted on
Intel’s i9-9900K’s most boasted feature in all marketing is its solder, so we decided to test thermals with the new soldered interface, then delid the CPU and put thermal paste back on it for more testing. It’s backwards from what we typically do (which is removing paste for liquid metal), so we’ll be looking at soldered vs. paste tests, gaming benchmarks, Blender workloads, overclocking, and livestreaming benchmarks in our review of the i9-9900K today. Benchmarks include comparative testing versus the Intel i7-8700K, AMD R7 2700 (and overclocked/2700X variant), R7 1700, i9-7900X, 7960X, and more. The full list of primarily featured CPUs is below.
This new series of Intel CPUs adorns the “9000” suffix. The main CPUs are the 9900K, an 8C/16T part (4.7GHz all-core), the 9700K (8C/8T), and the 9600K (6C/6T). Despite the naming convention and marketing play at being a “9th Gen,” these products are a refreshed Coffee Lake architecture (still 14nm). Of note, the Z390 motherboards work with 8000-series CPUs, like the 8700K, and the Z370 boards mostly work with the 9000-series CPUs. Some exceptions apply here, but just check the manuals and support listings before making purchases. Power delivery can be a concern on the lower-end Z370 boards when considering 9900K CPUs.
Other than this, the entirety of marketing has felt largely centered on “STIM,” or soldered thermal interface material. After years of complaining from technical media, including our own outlet, Intel is finally moving back toward the Sandy Bridge era of solder. It’s an Indium solder – a soft one – but that’s something we’ll talk about momentarily.
Other key items of note include the price: The i9-9900K is expensive, priced at around $530 on Amazon. For perspective, the 8700K costs about $370 (6C/12T), the R7 2700 non-X is about $250 and can be overclocked to equivalence with a $300 2700X, and the 7900X is about $900. The 9900K is significantly more expensive than the previous high-end Intel desktop CPU, and therefore significantly more expensive than the R7 2700(X). Of course, we still need the perspective of performance to understand whether that price difference gets anything meaningful.
MCE, Vdroop, Overclocking
A few notes before beginning with the review:
Vdroop rears its head on the ASUS Maximus XI Hero that we used for 9900K testing. On this motherboard, an input of 1.4V with LLC level 7 resulted in a voltage of about 1.341V when running 8C, or about 1.35V with 6C. ASUS is aware of this. The 8086K seems to be less affected on the same motherboard.
Update: We have learned that the ASUS BIOS text is incorrect in describing the behavior of LLC at level 7. The text states: "The load-line is defined by the Intel VRM specification and affects the level of voltage supplied to the processor. Higher load-line calibration settings result in reduced VDroop at the expense of voltage overshoot and will increase CPU temperatures due to higher voltage under load. Select from level 1 to 7 to adjust the load-line above. Level 1 = greater Vdroop, Level = 7 minimum VDroop." [sic] In reality, Level 8 is now the highest setting, and level 7 will no longer be minimum vdroop. In this regard, the behavior is correct, and there is not any vdroop outside of expectations. It is only the description text that was wrong.
Separately, MCE also makes a bit of a comeback.
We have noticed that ASUS’ Maximus XI Hero we used follows Intel’s spec for boosting and power behavior, unlike some other boards. We noticed that Gigabyte and MSI tend to run over spec as their ICCMAX is not limited in the way that ASUS limits its own. You can still bypass these settings with overclocking, but stock, they should follow Intel’s spec. This can impact scores in reviews to some extent.
Test Components
Tested CPUs primarily include the below list:
- Intel i9-9900K
- AMD R7 2700
- AMD R7 2700X
- Intel i7-8700K
- AMD R5 2600
- AMD R5 2600 OC (2600X stand-in)
- Intel i5-8600K
- Intel i9-7900X
- Intel i9-7960X
- AMD R7 1700
- Intel i7-4790K
Motherboards used for testing are as follows:
- ASUS Maximus XI Hero Z390
- Gigabyte Gaming 9 Z370
- Gigabyte Z97X Gaming G1 BK
- ASUS Crosshair VII Hero X470
- ASUS Crosshair VI Hero X370
- Gigabyte X299 Gaming 9
Constants used are as follows:
- All desktop platforms: 2x 8GB 3200MHz Corsair Vengeance LPX 16-18-18-36 DDR4
- (Exception: Z97X uses HyperX Savage 2133MHz DDR3)
- All quad-channel HEDT platforms: 4x 8GB 3200MHz Corsair Vengeance LPX 16-18-18-36 DDR4
- Corsair AX1600i PSU
- NZXT Kraken X62 at 100% speeds
Windows 10 version 1803 was used for all testing with Windows Update disabled. PresentMon is used for framerate data logging, with custom scripts for capturing data accurately.
Click "Next" to continue to Page 2: Solder vs. Delid Paste Performance
Solder vs. Thermal Paste Performance
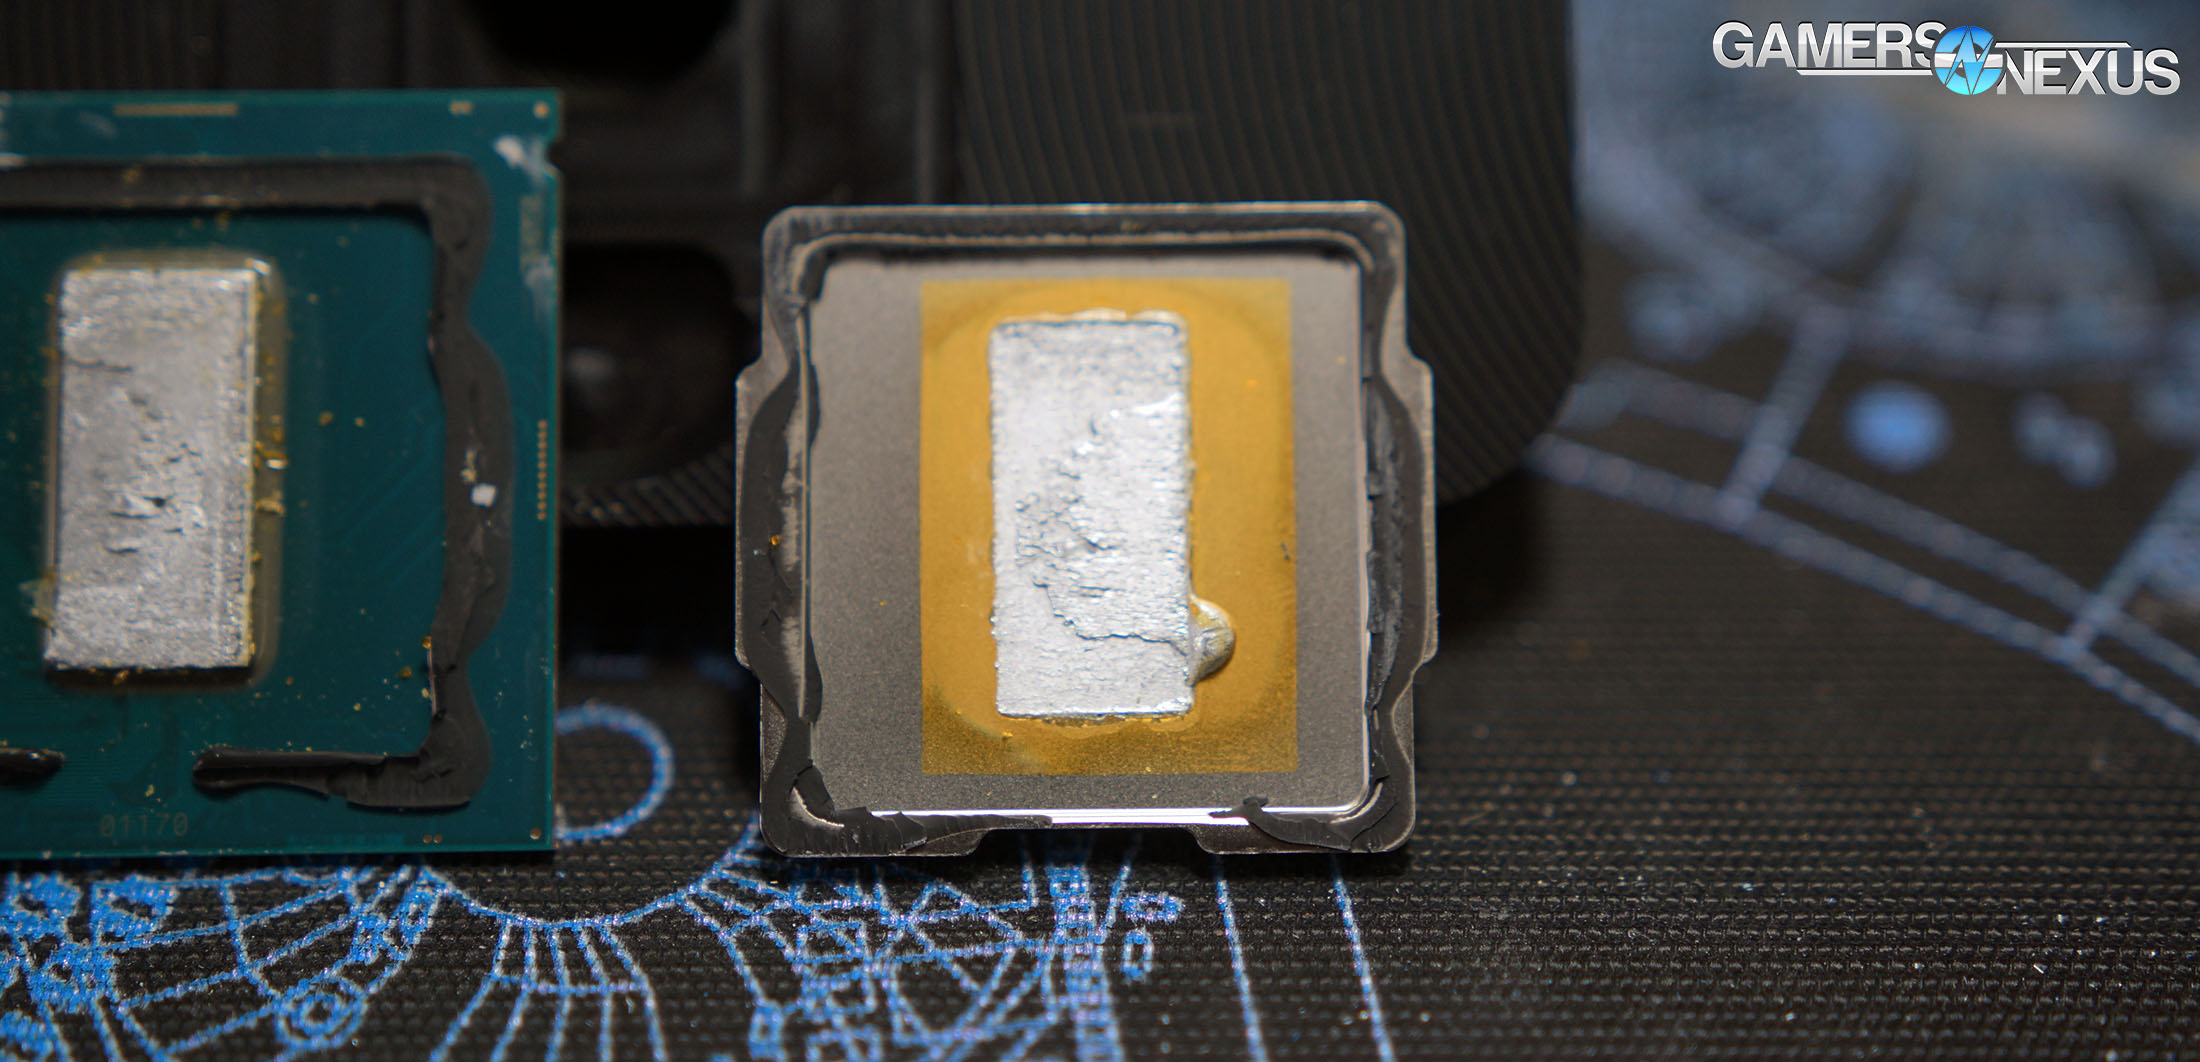
Intel’s “STIM,” or soldered thermal interface material, has been the company’s biggest bragging point for the i9-9900K launch. We delidded the i9-9900K, cleaned all of the solder off of the CPU, and then re-lidded it with Thermal Grizzly Hydronaut thermal paste. Basically, we went backwards – we did the opposite of what’s normally done in a delid. Cue the clip of talking with Gordon from PC World about not being able to complain.
Let’s investigate whether it’s worth doing for the 9900K’s solder.
Testing Methods & Approach
We did a few things for this testing: First, we collected all stock performance numbers and gaming numbers without delidding it, so let’s just make that clear right away. This was done after all other testing. Secondly, we originally had a clever idea to disable two cores on the 9900K and fix the voltage and frequency to equivalent values as you’d find on the 8086K. After delidding the 9900K and after speaking with Der8auer, we learned that the 9900K isn’t perfectly comparable to the 8086K – not even if disabling two cores. The 9900K actually has a thicker die package atop the substrate, which impacts results in ways we can’t account for with our clever trick. The die is also larger, which means it dissipates heat over a wider area and will run cooler. For this reason, our 8086K results we ran are actually not as comparable as we wanted – instead, we will compare the 9900K with solder to the 9900K with Hydronaut. If you’d like to see results with liquid metal, we’d strongly encourage you to go visit Der8auer’s channel and watch his content. He did additional testing with delidding and collaborated with us on our results. We have completed our own liquid metal testing, but will be publishing it post-review with some extra data.
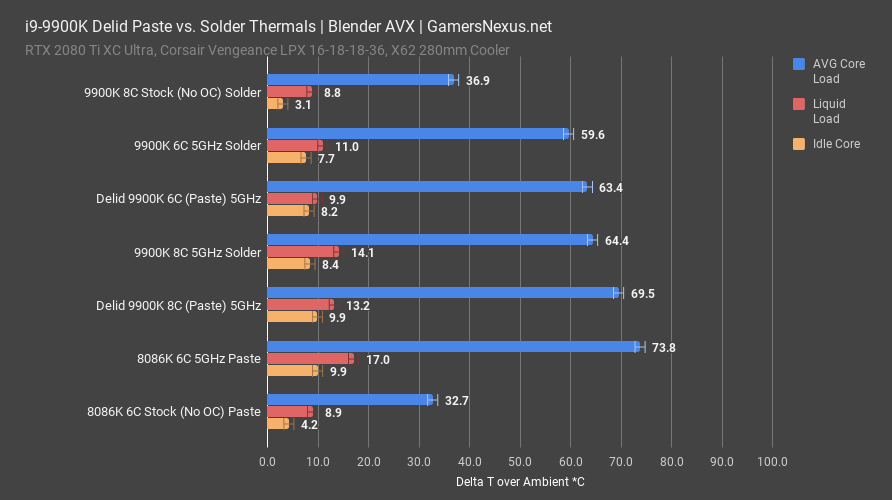
Getting into our results, let’s focus on just the 9900K numbers. The 9900K with solder, clocked to 5GHz and with all cores enabled, and set to a 1.341V after Vdroop is counted. This result operated an average core temperature of 64.4 degrees Celsius over ambient, with ambient logged every second. We also logged current into the EPS12V rails every second, which is important for data accuracy. At 64 degrees core and 14 degrees over ambient liquid, the most direct comparison is the 9900K delidded, running 8 cores, and also at 5GHz. This one operates at 69.5 degrees over ambient, for a rough 5-degree increase over the solder. That’s 5C by switching from solder to Hydronaut. The thing Intel bragged about so much, its solder, is not much better than a high-end thermal paste. It is worse than delidding and liquid metal, but we’ll encourage you to watch Der8auer for that data.
Keeping just the 9900K SKUs in focus, we can next look at the 6C test we ran: It’s the same thing here, with about 63 degrees over ambient for the delid, or about 59.6 for the stock solder version. The 8086K tests are still here, but as we learned from Roman and our own investigation, it’s clear that this data is incomparable enough to not bother mentioning. We still wanted to leave it here for reference, though.
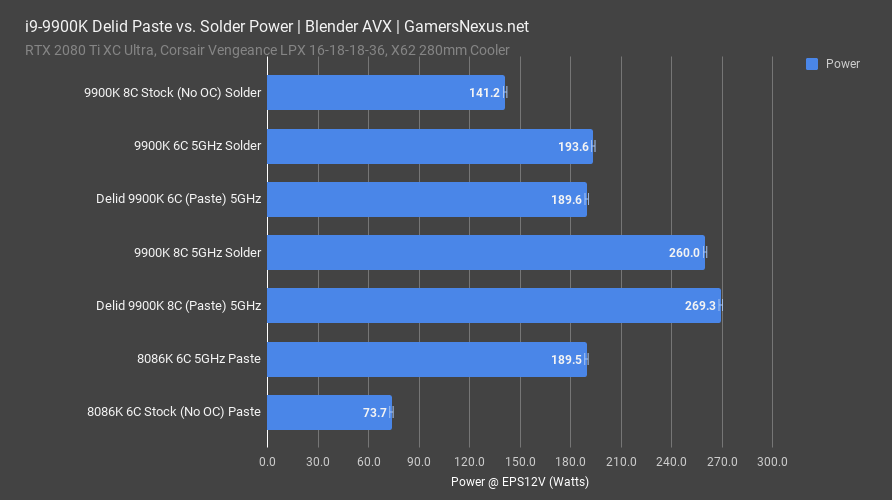
As for power and voltage during these tests, here’s what we were looking at: Power consumption for the 9900K 6C 5GHz test was 194W, close enough to the 189.6W power consumption of the 9900K 6C delid test to be comparable. The 8C variation of the 9900K measured 260W, put up against 269W in our delidded test. This is within reasonable control, although the delidded variant might be marginally cooler if we could have dropped another 9W. Voltage was also logged and measured 1.341V for all 8C tests and 1.35V for all 6C tests. There was vdroop as a result of ASUS’ BIOS.
Solder is a reversion back to the Sandy Bridge era, and one that has been needed to get an extra couple hundred MHz out of the existing process. This is still an improvement over thermal paste, but it’s not perfect. The reason it isn’t perfect is largely because of how thick the solder layer is, whereas liquid metal can run a much thinner interface to the IHS.
Click "Next" below to continue to Page 3: Streaming & Multitasking CPU Benchmarks
Streaming Benchmarks
Note: This streaming section is heavily scripted for the video portion of the review, as we play back clips side-by-side for the benchmark comparison. We will not be removing these references in the article version, so you’ll want to check the video for playback comparisons.
Streaming benchmarks are next. We define this testing in the article linked below. We’ll play some side-by-side clips without revealing the CPUs while explaining this testing. For the basics, we are testing with OBS for capturing gameplay while streaming at various quality settings. Generally, Faster is a good enough H264 quality setting, and is typically what we use in our own streams. Fast and Medium improve quality at great performance cost, but quickly descend into placebo territory at medium and beyond. Still, it offers a good synthetic workload to find leaders beyond the most practical use cases. We are testing with Fortnite and DOTA2 on the 9900K and 2700X when both are stock. Fortnite is set to ‘high,’ as is DOTA2, and both are 1080p and streamed at 60FPS. We also measure baseline performance without any active streams to better understand performance loss from streaming. Streaming is heavily multithreaded, so for people who want a “multi-tasking” workload, this is it.
Streamer-Side FPS in Fortnite
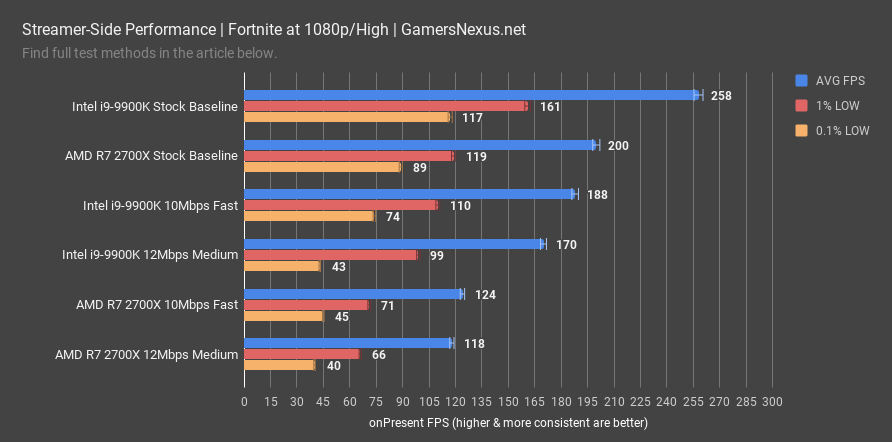
Starting with streamer-side FPS in Fortnite, we observed a baseline framerate of 258FPS AVG when not streaming at all. We were hitting GPU constraints at the top-end in this benchmark. The lows remain moderately timed, at 161FPS 1% and 117FPS 0.1% low. The R7 2700X is next, and operates at 200FPS AVG for its baseline performance. In terms of frametimes, we’re looking at about 3.9ms for the 9900K versus 5ms for the 2700X. With the 9900K streaming at 10Mbps and using Fast H264 encoding, we lose about 27% off the baseline and land at 188FPS AVG. Lows remain spaced proportionately to the average. The 2700X drops to 124FPS AVG, losing about 38% off its baseline. That doesn’t mean it’s worse, necessarily, because we also need to look at viewer-side frame throughput. Remember, there are two pieces to this, and that’ll come up next. At 12Mbps and Medium encode, which increases quality at a huge performance cost, the 9900K falls to 170FPS AVG, with lows now entering worse territory at 43FPS 0.1% low. The 2700X falls to 118FPS AVG.
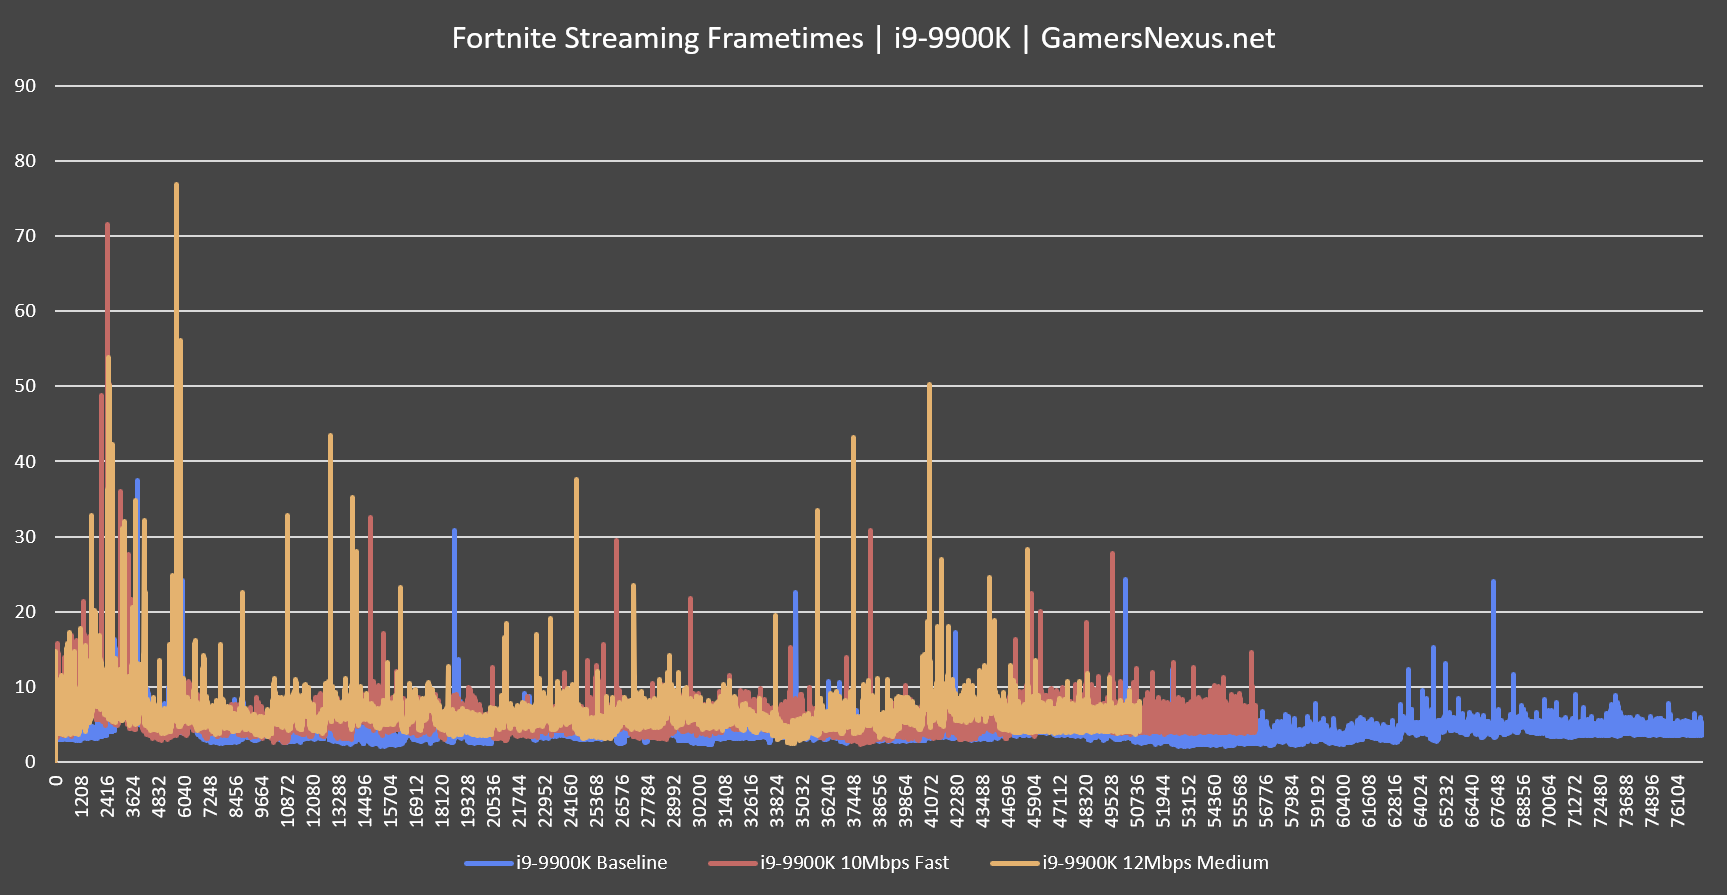
Here’s a frametime plot of the 9900K at 10Mbps Fast versus 12Mbps Medium and baseline. For these plots, the most important metric is consistency of the plot, alongside lower overall values. Lower is better, but more consistent is better than lower. We are looking at the interval frame-to-frame, with 16ms equating 60FPS. The 12Mbps/Medium result occasionally spikes close to 80ms frametimes, which can create a noticeable stutter or latency difference between surrounding frames.
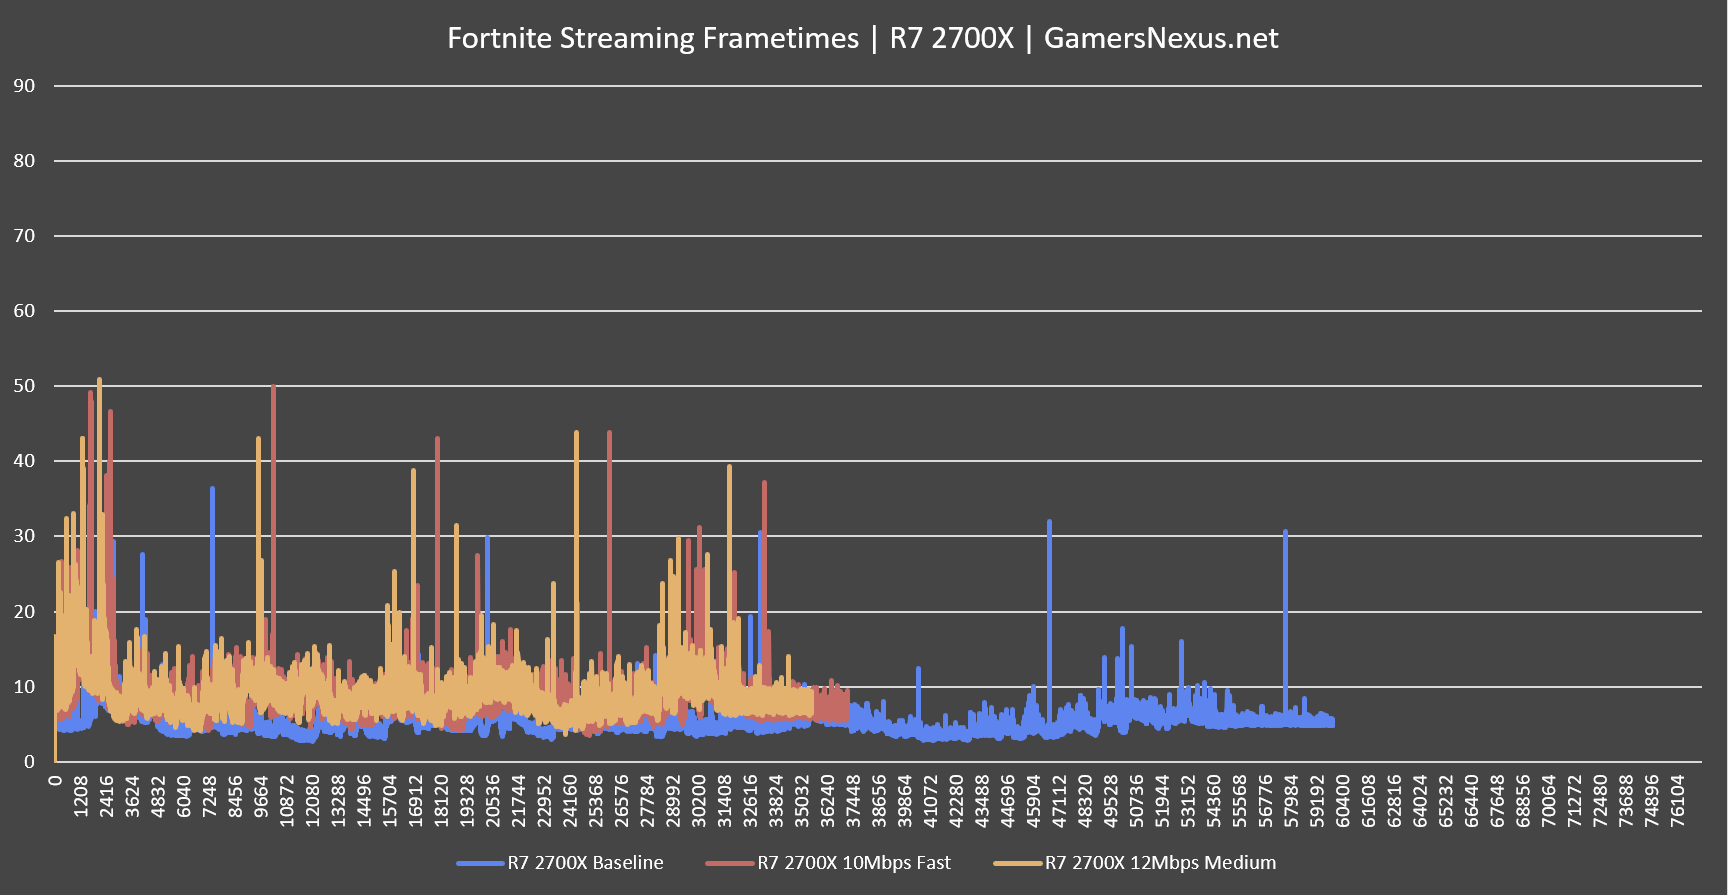
And here’s the 2700X plot. Performance is overall lower as a result of the lower frequency, but the baseline and 10Mbps Fast results are still relatively consistent. Although we don’t see a spike up to 80ms this time, we must also note that a single frame at 80ms is not the norm on the 9900K, either. We are seeing consistent frame intervals of 40ms on both products when streaming at the torture load.
Let’s take a look at some side-by-side footage of Fortnite at 10Mbps and Fast (see the video for this part). We won’t reveal which CPU is which until the end of the clip. For the streamer, the take-away is that the streamer gets a good experience on both platforms. Intel is technically superior here, but cost is a consideration as well – we’ll talk about that in the conclusion. For now, either platform looks playable to the streamer. What we need to know is if the output is any good to the viewer, as they are the most important part of the equation here. That’s what you’ve been looking at here.
Viewer-Side FPS in Fortnite
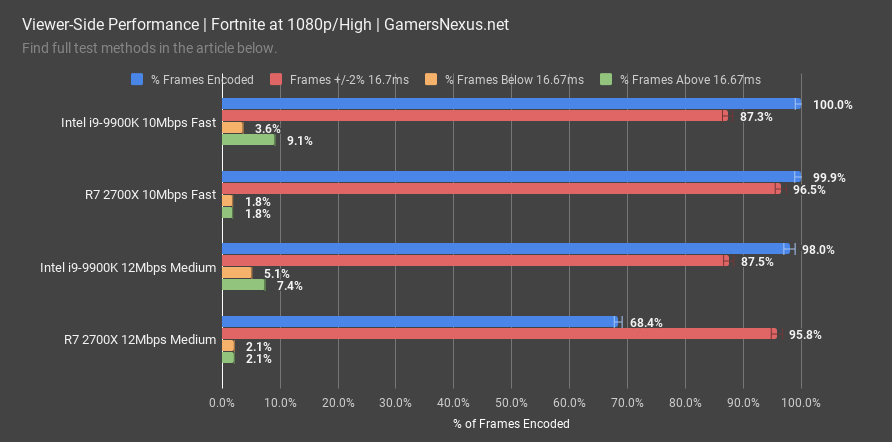
Viewer experience is boiled-down to percent of frames delivered at 1080p 60FPS via YouTube. In our testing, both the 2700X and 9900K were able to deliver 100% of frames at 10Mbps and Fast encoding, which is perfectly adequate for any streamer, really. The 12Mbps Medium quality setting is entering placebo territory, though still has some benefits. With Fast encoding the 9900K delivered 87% of its frames within 16.67ms, or 60FPS. The 2700X delivered 96.5% of its frames within the same window. We have seen this behavior before, and have found that Intel stabilizes its delivery when manually managing process priority. This has something to do with task scheduling on each device. With Medium settings, Intel’s 9900K is impressive in its ability to still deliver a consistently good viewer experience at 98% of all frames encoded. The 2700X delivers just 68.4% of its frames in the same test, a result of its lower frequency. Let’s get a side-by-side of these up. Again, with this quality setting, it’s leaning into placebo territory. We want to emphasize that the 2700X is still perfectly good for streaming and gaming simultaneously, you’d just want to keep it to 10Mbps and Fast. Intel can maintain higher quality settings, but it may be an unnecessary level of quality – it just depends on how serious you are about streaming. Ultimately, a secondary system would still improve low-end frametimes.
Streamer-Side FPS in DOTA2
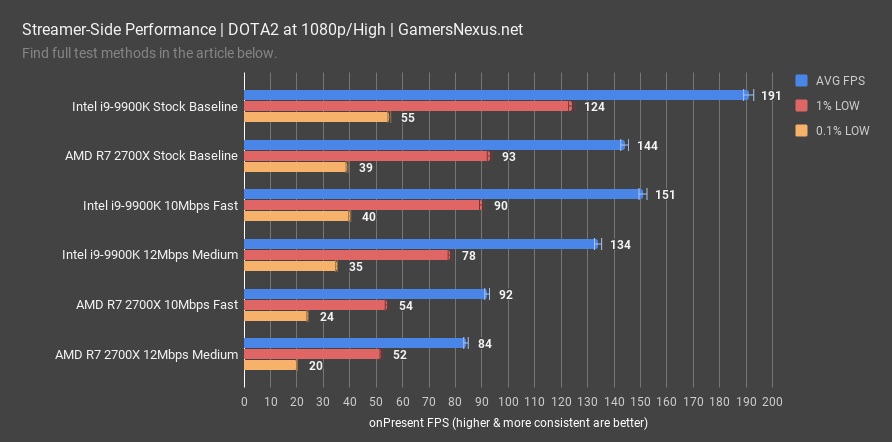
Moving on to DOTA2, we start again with streamer-side FPS. This is what the host of the stream sees. DOTA2 tends to favor Intel CPUs hard for the frequency dependence, following Amdahl’s Law well, and positions the 9900K at the top of the chart. The CPU outputs 191FPS AVG, with lows mixed at 124FPS and 55FPS 0.1%. The 2700X manages 144FPS AVG baseline. When we start streaming, those numbers drop to 151FPS for the 9900K with Fast settings, or 134FPS when under Medium settings. The 2700X drops to 92FPS and 84FPS, respectively. Here’s some side-by-side of the 2700X and 9900K when using 10Mbps/Fast settings. Overall, both are reasonable performers for the streamer. The 12Mbps/Medium frametimes get a bit jumpy, particularly on the 2700X with a 0.1% low of 20FPS, but it isn’t terrible.
Viewer-Side FPS in DOTA2
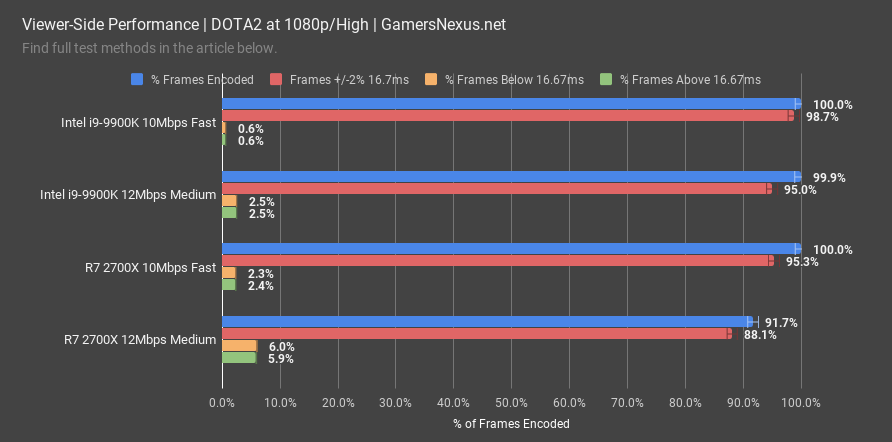
Viewer-side performance is where it matters. For this one, the 9900K and 2700X both manage to encode 100% of frames at 10Mbps/Fast. This means that viewers will see all 60 frames per second when viewing the stream, and so will not be able to perceive a quality difference between the 9900K and 2700X. They are functionally the same, lending favor to the 2700X for its value proposition. If you did want more quality, the 12Mbps/Medium playback retains a lead for the 9900K at functionally 100% of frames encoded, with the 2700X falling to 92% of frames encoded. You’re looking at side-by-side footage of the 2700X and 9900K at 12Mbps and Medium. We’ll reveal them at the end of the clip. This isn’t terrible, and can be compensated for with a permanent overclock or with a slight reduction in settings. The 2700X does better here than what we saw in Fortnite. Part of this comes down to resource allocation. Frame-capping either game on the streamer-side would also help, although that may be inadvisable for some ultra-competitive players. Let’s reveal those CPUs before moving on.
Streaming Power Consumption
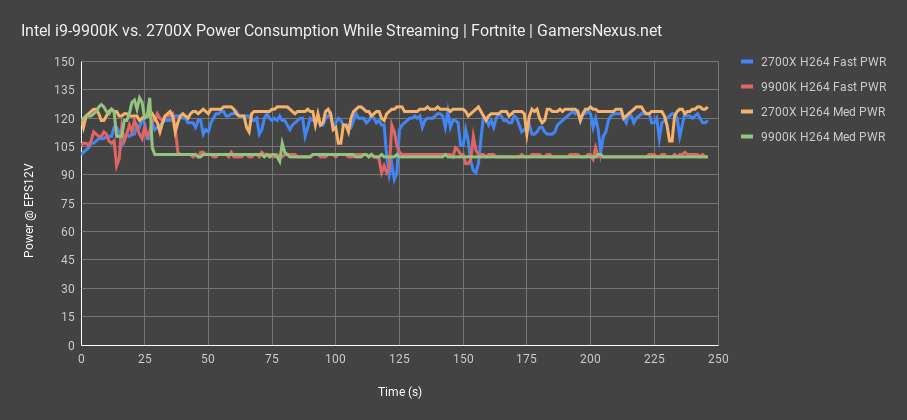
Power consumption while streaming is an interesting topic. This chart is for Fortnite power consumption. With the ASUS Maximus XI Hero that we used for our 9900K, a stricter adherence to Intel’s stock policies means we see a sharp drop-off in power consumption when testing under full stock conditions. The CPU falls to 100W load and stays there, leaving more performance available if we were to remove power targets and limits. Some of the other motherboards shipping today will exit these Intel power specs and draw more power. The 2700X pushes closer to about 120W-125W draw. Intel manages to achieve better overall combined throughput for the player and viewer while maintaining a lower power consumption, for which the 9900K deserves acclaim. It is, of course, significantly more expensive, and that is a big factor to play into our conclusion.
Click "Next" below to continue to game benchmarks.
Game Benchmarks
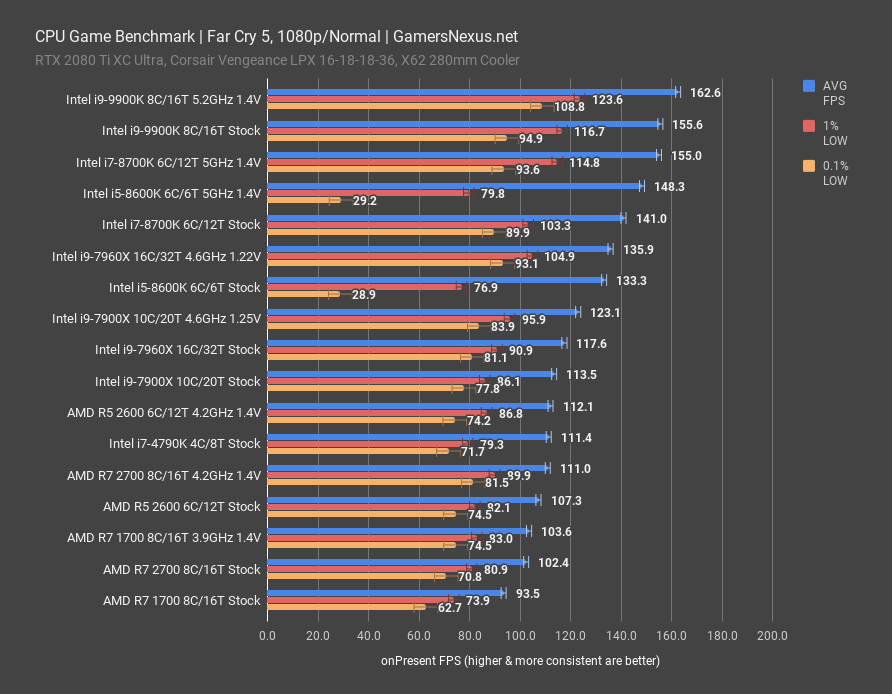
Far Cry 5 CPU Benchmark – Intel i9-9900K vs. 2700, 8700K
Far Cry 5 is next. This one runs on the Dunia Engine by Ubisoft.
At 1080p, the 9900K pushes 157FPS AVG, 119FPS 1% lows and well-timed 102FPS 0.1% lows. Overclocked, the 9900K ends up at 163FPS AVG, for a reasonable gain of 4.5% over the stock 9900K. The 8700K ends up around 155FPS when overclocked to 5GHz, meeting the stock 9900K at near equivalence. The stock 8700K sits closer to 141FPS AVG. When looking at the i5 CPUs, we noticed a clear drop in frametime consistency as the frame-to-frame interval became more sporadic, represented by the i5-8600K’s 0.1% low metric. The R7 2700 at 4.2GHz, meanwhile, ended up 111FPS AVG, within margin of error of the overclocked R5 2600 at the same frequency target. These are within variance of each other, and can be considered roughly equal. The 9900K has a clear lead in Far Cry 5, and performance follows a similar trend as in Assassin’s Creed. Both are Ubisoft games, but they are different engines – although those engines may share code.
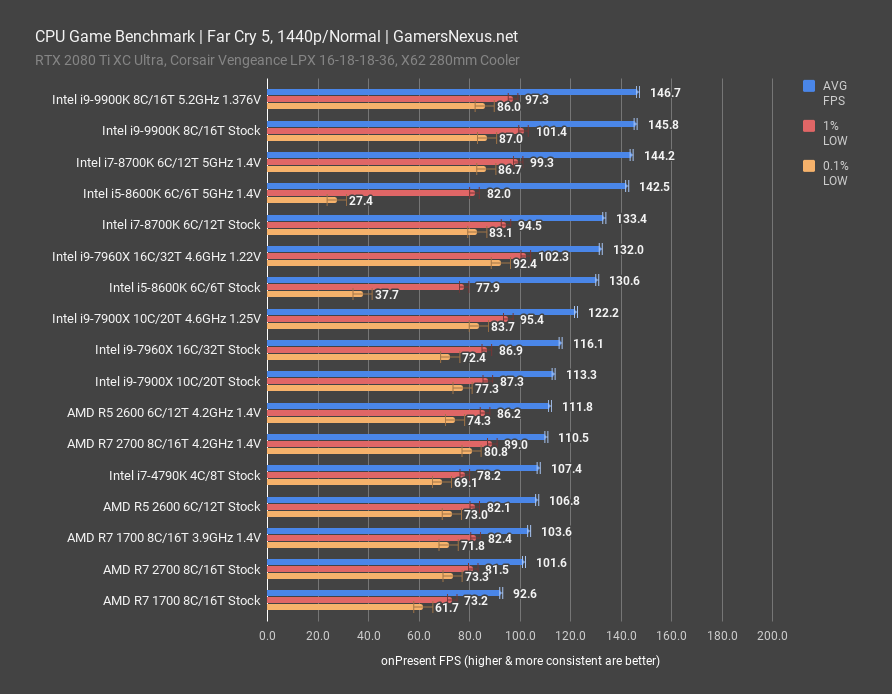
At 1440p, performance becomes capped at around 147FPS AVG as the GPU is leaned on more heavily. The 9900K maintains 146FPS AVG, the 8700K at 5GHz again meets its performance, and the 8600K does the same – except its thread deficit does pose problems for frame-to-frame interval consistency. The 2700 at 4.2GHz posts roughly the same performance as before, as we’d expect, because it is almost fully CPU-constrained. The OC 2700 and 2700X are not fast enough to keep up with 1440p throughput under normal settings with the 2080 Ti. If we were to boost settings to high options and fully leverage the GPU, then the natural expectation is that all results will be dragged down to meet the GPU cap.
F1 2018 CPU Benchmark – Intel i9-9900K vs. 2700 Overclocked, 8700K, 4790K
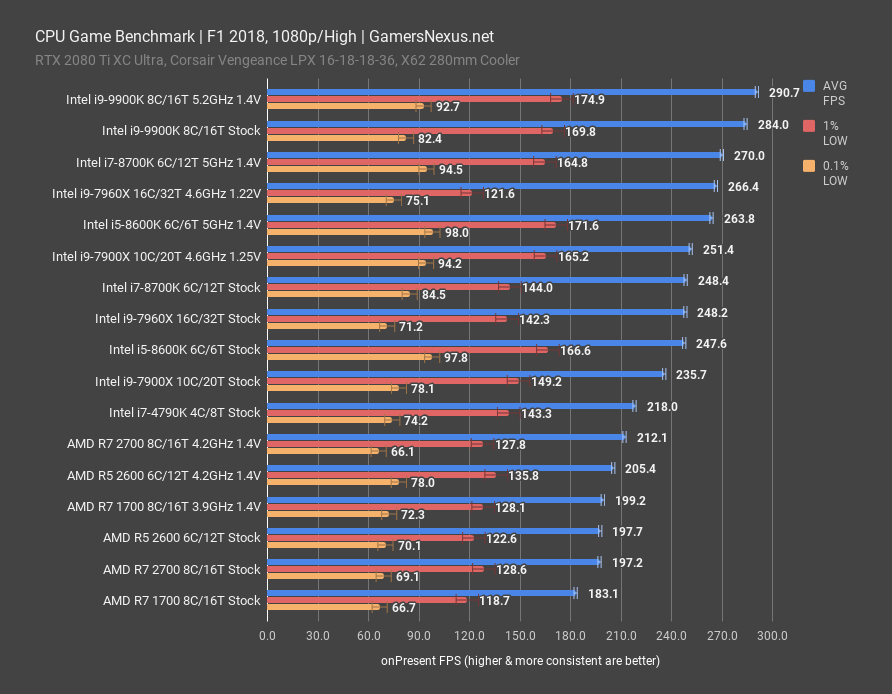
F1 2018 runs on the EGO engine by Codemasters and is our first representation of a game that nears 300FPS. It’s at this point that most people would probably be happy with just about any CPU on this chart, even the R7 1700 and its 183FPS result. The 9900K posts an impressive 284FPS AVG when stock, thanks to coupling with the 2080 Ti, and the overclock pushes it to 291FPS AVG. For the 8700K at 5.0GHz, we see a 270FPS AVG result that permits the 9900K stock CPU a lead of 5.2%. If we compare the stock 8700K’s 248FPS AVG to the 9900K, the difference is closer to about 14%. That’s with both stock. The 2700 at 4.2GHz ends up at 212FPS AVG, with lows still reasonably timed. This posts a 27% improvement in the 9900K, although that is sort of a misleading stat at this point: Because FPS scales non-linearly, a 27% gain at nearing 300FPS means a lot less than a 27% gain at 60FPS. The difference from 48FPS an 60FPS is often noticeable in gameplay, whereas the difference between 270FPS and 212FPS is less observable.
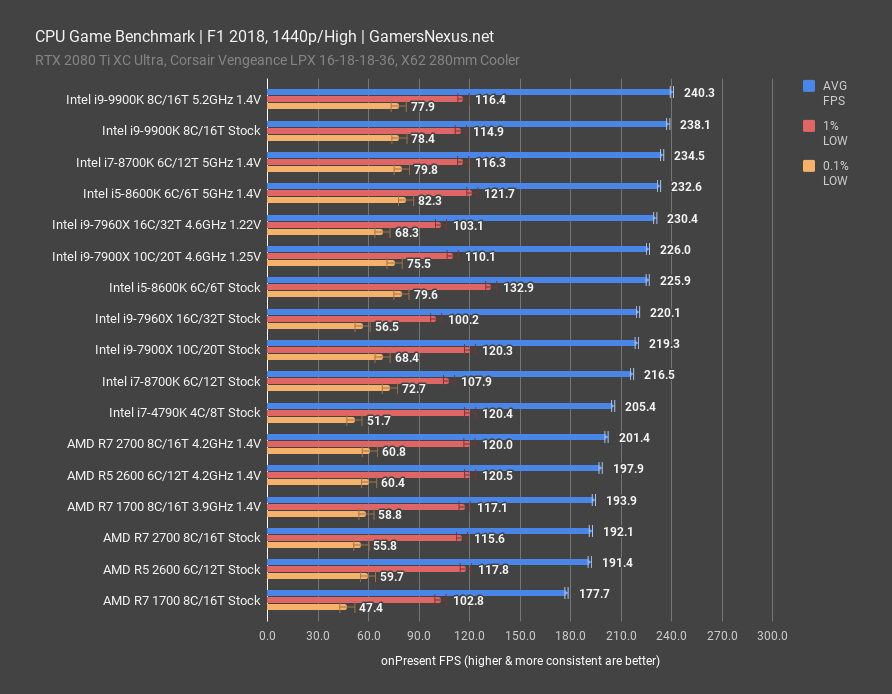
Moving on to 1440p, the 9900K is now squished down to 240FPS by the RTX 2080 Ti bottleneck. This limits overclocking improvements heavily, and also caps the 9900K stock CPU to 238FPS AVG. The 8700K is just behind at 235FPS AVG. The 2700 at 4.2GHz manages 201FPS AVG, posting a slight dip in spite of the GPU limitation. We have seen this in the past with AMD CPUs, like in Battlefield 1 from last year’s testing.
Assassin’s Creed: Origins CPU Benchmark – Intel i9-9900K vs. 2700X, 4790K, 8700K, R7 1700
Assassin’s Creed: Origins uses the AnvilNext 2.0 game engine by Ubisoft and runs on DirectX 11.
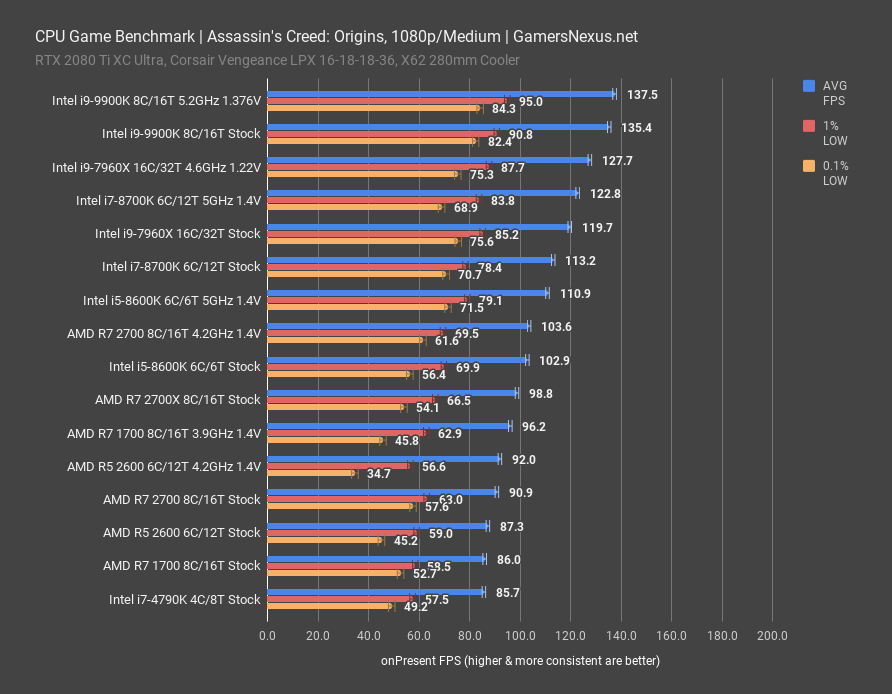
At 1080p and medium settings, we are minimally GPU-constrained in an otherwise GPU-intensive game. The i9-9900K leads the pack at 135FPS AVG when stock, and also illustrates that we are hitting GPU bottlenecks at this point. The overclock only gains us 2FPS, or 1.5%, and so we can’t see the unconstrained performance with this game. Still, we balance between realism and proper methodology. Going lower than medium is unrealistic, and so we will point toward our other unconstrained tests for examples of top-end performance. Still, the 9900K leads the 8700K stock CPU’s 112FPS AVG by 21% when both are stock. Overclocking the 8700K pushes it up to 123FPS AVG, closing the gap, but only because we are limited by the GPU on the 9900K. This is a realistic example of how even a 2080 Ti can become bound by a 9900K.
The 2700X was only tested in ACO and Ashes to illustrate that it is functionally the same as an overclocked 2700, just as a reminder. In this game, we see the 2700X land between an overclocked 2700 at 4.2GHz and a stock 2700, expectedly. The overclocked 2700posts 104FPS AVG results. This puts it ahead of the stock 8600K and led by the 9900K stock CPU by about 31%. This is also why we recommend buying the non-X CPUs in most instances. The 9900K holds a clear lead here, but that’s not unexpected, at this point.
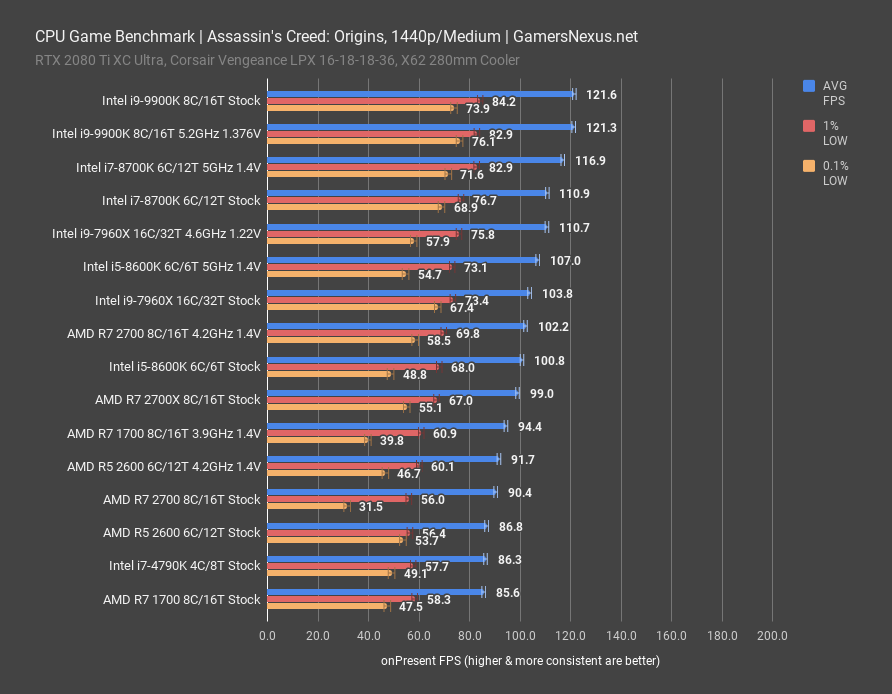
At 1440p, Assassin’s Creed: Origins illustrates a clear GPU limit at 122FPS AVG, where the 9900K sits under both configurations. The stock and overclocked results are tied, with the difference being within margin of error. The 8700K isn’t far behind, at 117FPS AVG, and the 2700 at 4.2GHz posts a 102FPS AVG result. Differences absolutely still exist at 1440p, but they do diminish.
Civilization VI CPU Benchmark – 9900K vs. 2700, 7900X
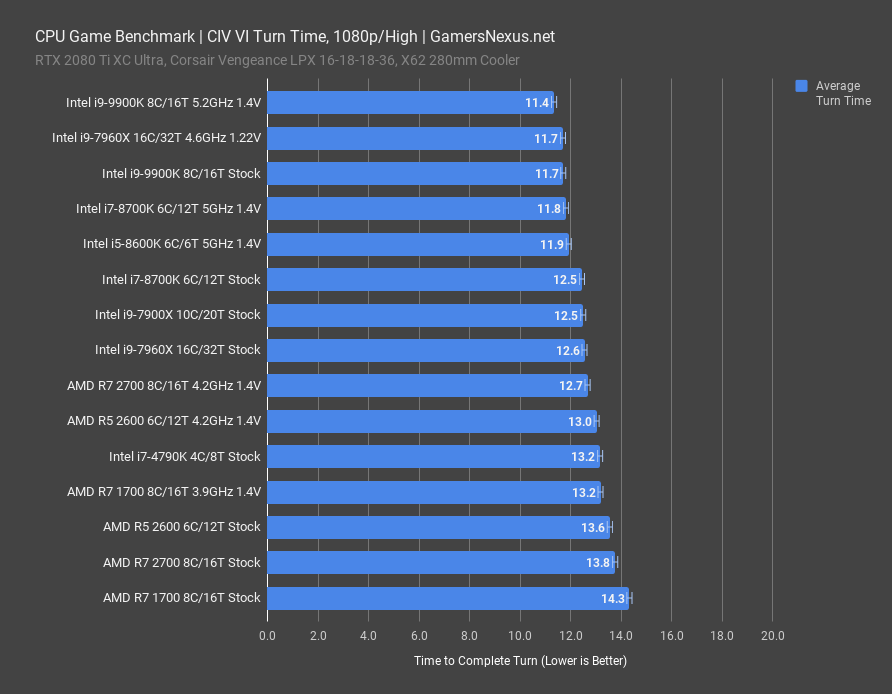
For CIV VI, we use the AI benchmark to analyze turn time processing. This is represented in a unit of time, not frames per second, and so we’re looking at number of seconds to process a single turn. This is taken from an average of five turns processed. If it takes a CPU 10 seconds to process 1 turn, and you have 6 AI in the game, that would be about 1 minute per full rotation before it is the player’s turn again. A faster CPU reduces this wait time. Resolution is also irrelevant here – the results would be the same at 1440p.
The 9900K leads when overclocked, posting a turn completion time of 11.4 seconds. Remember, lower is better. The stock 9900K operates at 11.7 seconds per turn, with the 7960X overclocked to 4.6GHz tied at 11.7 seconds. CIV VI seems to like frequency to some degree, as we are seeing a boost in the 7960X from 12.6 seconds when pushed to 4.6GHz. This statement of frequency dependence, following Amdahl’s Law, is further reinforced when looking at the 8700K and 8600K 5GHz results, both of which end up around 11.8 and 11.9 seconds. The R7 2700 at 4.2GHz ends up at 12.7 seconds per turn. The total time requirement to complete turns is reduced by 8% on the 9900K versus the overclocked 2700, which is the same as a stock 2700X. It’s an 8% time reduction in the most suitable comparison.
GTA V CPU Benchmark – 9900K vs. R7 1700, 4790K, 8700K
GTA V runs on the RAGE engine from Rockstar and is our oldest tested title, but popular enough to remain on the bench for now.
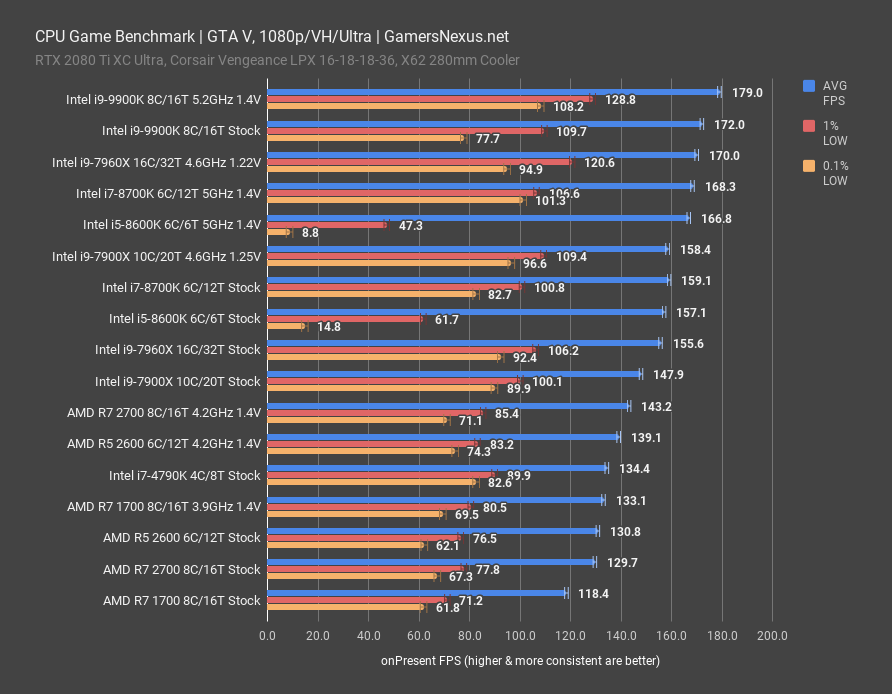
At 1080p and with High and Very High settings, the 9900K operated around 172FPS AVG, boosted by the 5.2GHz overclock to 179FPS AVG. Note that we are running into engine limitations here, best illustrated by the dismal i5 results for the 8600K. This is a story we busted open about a year ago, but it’s worth reiterating: When i5 CPUs bounce off of the 187FPS marker, they instantly stutter hard. To resolve this, you’d actually want to run a lower average framerate in GTA so that it avoids the frame limiter at the high-end. This issue seems to primarily affect i5 CPUs, as we discovered previously. It’s clear that Rockstar also hasn’t fixed it since the discovery.
Either way, the primary focus is elsewhere. The 8700K stock CPU posted a 159FPS AVG, with the overclocked result at 168FPS AVG. That’s a marked gain which puts it near the 9900K stock CPU. Like most games, GTA does like frequency first-and-foremost.
The R7 2700 at 4.2GHz – again, basically a 2700X – ends up at 143FPS AVG, allowing the stock 9900K about a 20% lead. This is about what we’d expect.
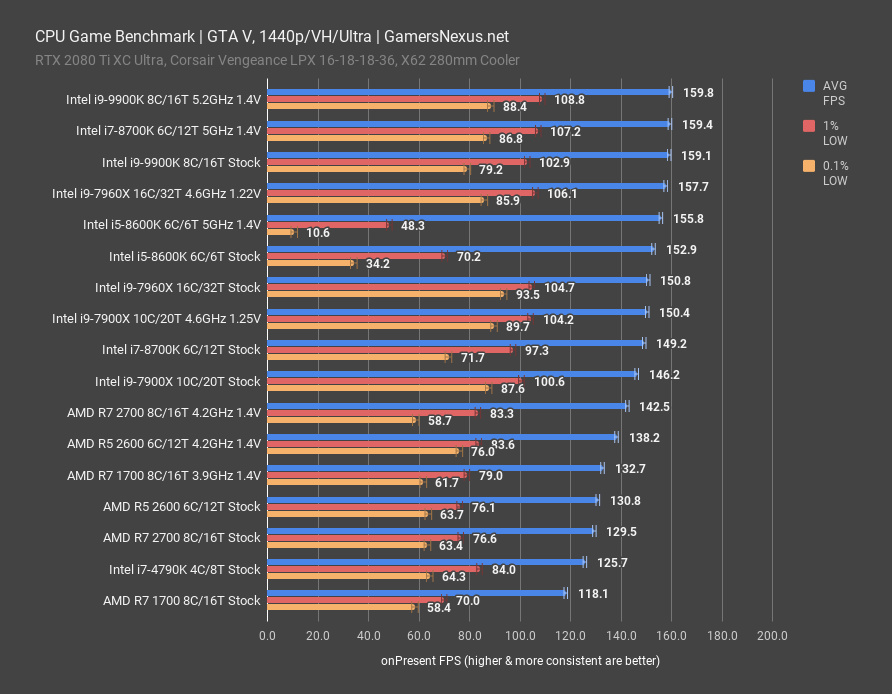
At 1440p, scaling remains about the same, it’s just the ceiling has dropped down. The 9900K now caps at 160FPS AVG when overclocked or stock, as do the 8700K and 7960X. This is a result of hitting the GPU limit. The R7 2700 at 4.2GHz still remains below that limit, and so posts a similar result to its result at 1080p. We’re at around 143FPS AVG on the 2700X stand-in, here.
Blender CPU Rendering Benchmark – 9900K vs. 7900X, 7960X, 2700(X)
Blender performance is up next. As a reminder, we completely overhauled our test methodology, test bench, and updated Windows for this review. This means that we no longer have dozens of CPUs for comparative data and must rebuild slowly.
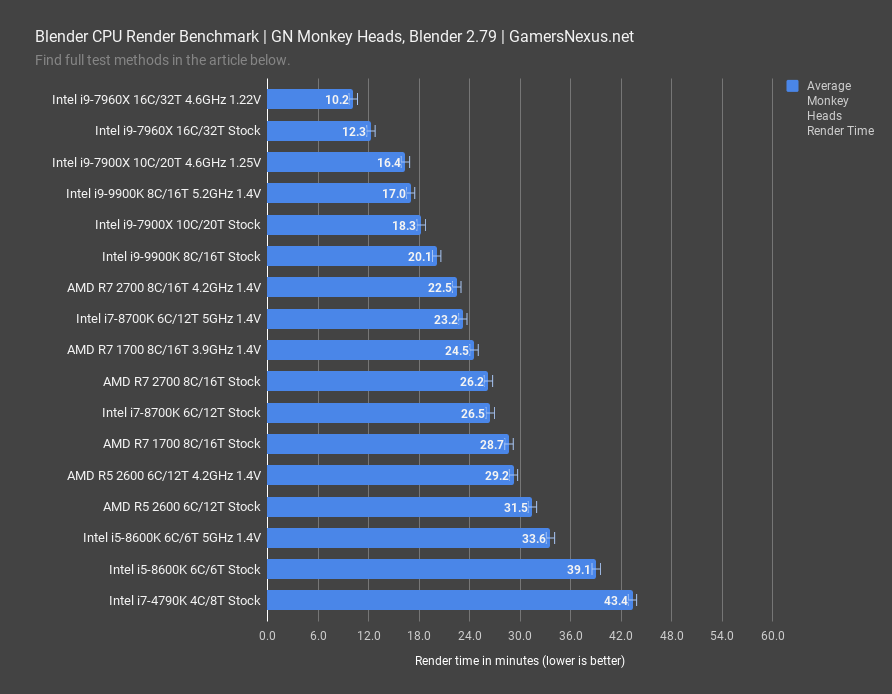
For our in-house GN monkey head render that’s built specifically for CPU stressing, the 9900K finishes the image in 20 minutes, marking it as 9% slower than the stock i9-7900X X299 CPU. Given that the 7900X was nearing $1000 at launch, this is a good target to hit. Overclocking the 9900K to 5.2GHz pushes us to a 17-minute completion time, roughly tying with a moderately overclocked 7900X. The 7960X is the fastest we’ve retested so far, and for perspective, the additional threads allow it a noteworthy time reduction of 38% when overclocked to 4.6GHz versus the 7900X overclocked to 4.6GHz. If thread-intensive 3D rendering is your thing, there is still great value in the higher-end CPUs. This primarily is true when you need more memory than is available on GPUs, as CUDA rendering is still more cost-effective for most use cases. Running out of memory is more of a problem on GPUs, though.
As for the 2700X, that is represented by our overclocked R7 2700 at 4.2GHz. Remember: AMD uses the same CPUs all the way down the line, so overclocking a 2700 to this degree is the same as buying a 2700X. The 2700X or overclocked 2700 both end up at 22.5 minutes, for a speed improvement of 11% on the stock 9900K, or 24% on the overclocked 9900K.
![]()
Our next render test is a single frame from the GN intro animation, which we’ll play back now. This animation is a high-sample image with ray tracing and stresses different parts of the devices. For this one, the 9900K stock CPU finishes in 22.5 minutes, compared to the stock 7900X and overclocked 9900K at 20.8 minutes. The overclocked 7900X still manages a time reduction of 13% from its thread advantage. The overclocked 2700 at 4.2GHz completes the render in 26.6 minutes, allowing the 9900K overclocked CPU a time reduction of 22% to 20.8 minutes. Whether that’s worth the extra money is dependent upon how time-intensive your workloads are.
Conclusion
As always, for those who jump to the conclusion, we’re going to recommend that you read the parts of the article applicable to you. That’s where all our effort goes, ideally leading you to your own conclusion.
The short version is this: Intel gets credit for using solder on the 9900K, despite it not really being the best due to thickness of the solder and silicone adhesive. Intel also gets credit for being the “best” CPU on the gaming charts – but the word “best” is tricky, here. The 9900K is not the best value, nor is it the best price, but it does have the highest throughput in a technical sense. The question is whether or not the player can notice those extra frames; for a lot of people, we know the answer is “yes,” especially the hyper-competitive among you. For many others, of course, the difference between 212FPS and 270FPS may be entirely irrelevant, or playing at 4K might largely nullify the advantages. Further, FPS scales non-linearly – a 27% gain at 60FPS (from 48FPS) produces a tangible difference in gaming, while a 27% gain at 212FPS to 270FPS won’t be nearly as visible. It is likely imperceptible to many.
Regardless, Intel gets credit for being fast with games, beating the 2700X at its own rendering games in Blender, and finally being soldered. AMD gets credit for being better value, forcing Intel’s hand (the solder is out of necessity, mind you, to get an extra couple hundred MHz), and for maintaining the “best” option in the R5/i5 class. The 9900K isn’t really a direct comparison with the 2700 ($250) or 2700X, anyway. The price disparity is huge. The 2700 can be had for significantly cheaper, then overclocked for still-good gaming performance, while leaving more budget for better GPUs or RAM.
The performance gap looks a lot worse for AMD when summed-up as a percentage, but in reality, as illustrated above, that percentage is potentially misleading. Statistics can be funny in that way. We’re talking differences of 3.7ms frametimes vs. 4.7ms frametimes, in some of these games, and the level to which most people can detect that delta is questionable. One could argue that the faster CPU will “age better,” but that’s a tough argument – the usable life of the system may expire before that argument matters.
We appreciate the 9900K’s gaming performance, we just suggest that buyers carefully consider budget. If there are budgetary constraints, consider reallocating some of the CPU fund toward higher-end video cards or RAM. If there is no constraint, well, Intel’s is the chart-topper.
Test Lead, Editorial, Testing: Steve Burke
Testing: Patrick Lathan
Video: Andrew Coleman