Today we’re reviewing the Intel i5-9600K CPU, a 6-core 8th-Generation refresh part that’s been badged as a 9000-series CPU. The 9600K is familiar to the 8600K, except soldered and boosted in frequency. The new part costs roughly $250 and runs at 3.7GHz base or 4.6GHz turbo, with an all-core closer to 4.3GHz, depending on turbo duration tables. When we last reviewed an i5 CPU, our conclusion was that the i7s made more sense for pure gaming builds, with the R5s undercutting Intel’s dominance in the mid-range. We’re revisiting the value proposition of Intel’s i5 lineup with the 9600K, having already reviewed the 9900K and, of course, the 8700K previously.
As a foreword, note that the R5 2600's current and maintaining price-point of $160 makes it a less direct comparison. The 2600X, which would perform about where an overclocked 2600 performs, is about $220. This is also cheaper, but still closer to compare. Even closer is the R7 2700, which is $250-$270, depending on sales. The 2700 maintains at about $270 when sales aren't active. The most fair comparison by price would be the 2700, then, not the by-name comparison with the R5 2600(X) CPUs.
Test Components
Tested CPUs primarily include the below list:
- Intel i9-9900K
- AMD R7 2700
- AMD R7 2700X
- Intel i7-8700K
- AMD R5 2600
- AMD R5 2600 OC (2600X stand-in)
- Intel i5-8600K
- Intel i9-7900X
- Intel i9-7960X
- AMD R7 1700
- Intel i7-4790K
Motherboards used for testing are as follows:
- ASUS Maximus XI Hero Z390
- Gigabyte Gaming 9 Z370
- Gigabyte Z97X Gaming G1 BK
- ASUS Crosshair VII Hero X470
- ASUS Crosshair VI Hero X370
- Gigabyte X299 Gaming 9
Constants used are as follows:
- All desktop platforms: 2x 8GB 3200MHz Corsair Vengeance LPX 16-18-18-36 DDR4
- (Exception: Z97X uses HyperX Savage 2133MHz DDR3)
- All quad-channel HEDT platforms: 4x 8GB 3200MHz Corsair Vengeance LPX 16-18-18-36 DDR4
- Corsair AX1600i PSU
- NZXT Kraken X62 at 100% speeds
Windows 10 version 1803 was used for all testing with Windows Update disabled. PresentMon is used for framerate data logging, with custom scripts for capturing data accurately.
Intel i5-9600K Benchmark vs. R7 2700, R5 2600, i7-8700K – Far Cry 5
Far Cry 5 is where the i5 CPUs really start to fall apart. This game is an interesting one to start with a frametime plot instead of an FPS chart, as the frametime performance metrics are the most important to illustrate player experience.
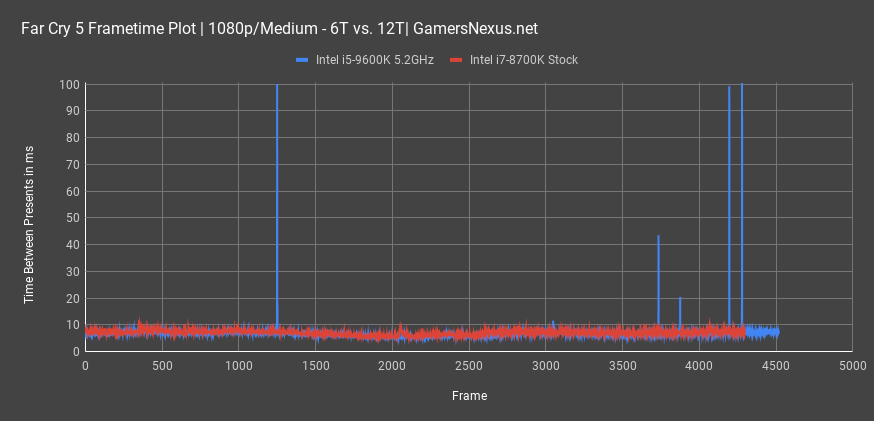
At 1080p/Normal, the 9600K slams into a wall at 100ms three times throughout the course of the test. To explain how this is bad, consider that a single frame at 60FPS takes 16.67ms to present. At 100ms, you’re waiting for 1/10 of a second until you get an update to your game. That’s noticeable. We have other frames that are hitting 40ms and 20ms. 20ms on its own wouldn’t be horrible, but it would need to be a constant 20ms. To bounce between 7ms and 20ms is observable to the user and means that you feel more stuttering playback in the game. This is noticeably jarring performance in Far Cry, and it’s happening even on a 5.2GHz overclock. That shows us that Far Cry wants those extra cores – at least, in theory.
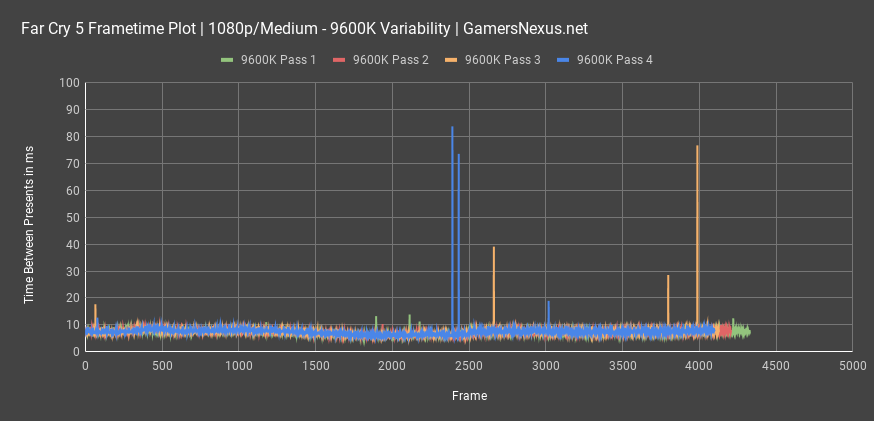
Here’s a closer look at just the 9600K when running stock, no overclock this time: We can really only fit a few lines on this chart due to the nature of it, so with just 4 passes plotted, we can see that two of them exhibit similarly bad frametime consistency behavior. Two of the lines spike hard, to a point where it becomes noticeable in gameplay, while the other two are perfectly fine. The curious thing here is that the behavior is sporadic, but is consistently spurious on just the lower thread-count CPUs.
Let’s convert this back into a normal FPS chart for easier comparative data.
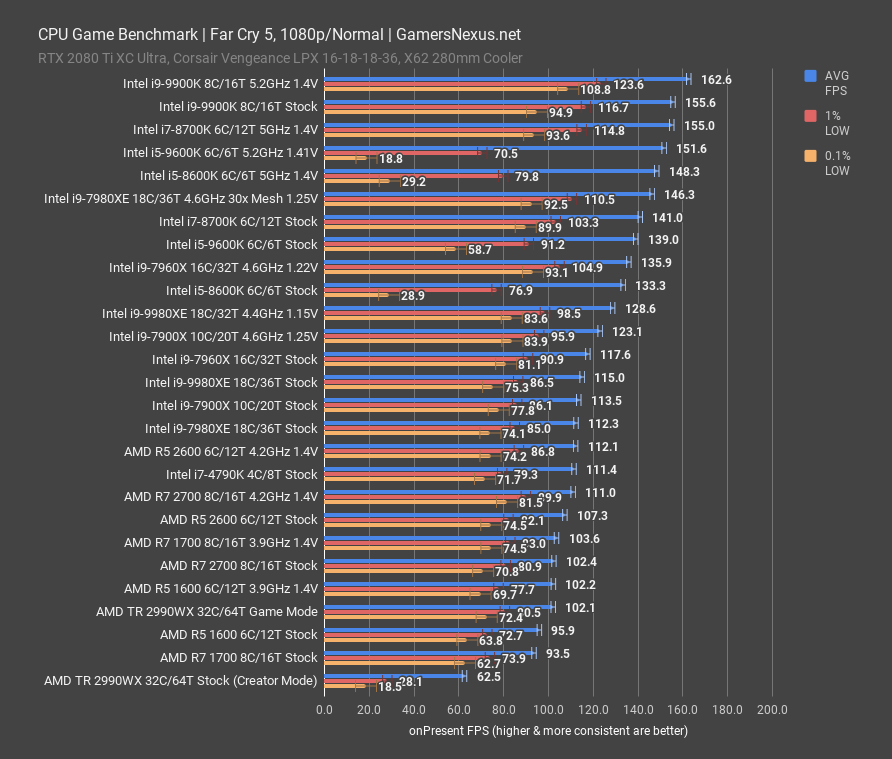
This is exactly why we say FPS plots are of limited usefulness in some cases: If you look at the 9600K’s stock result, it averages out to 59FPS for 0.1% lows, or 91FPS for the 1% lows. Those are both good numbers and are completely acceptable. In reality, that’s from averaging results that are all over the place and outside of normal error margins. It’s jumping around between 25FPS 0.1% and 100FPS 0.1%, resulting in an average that looks reasonable, but a gameplay experience that is 50% bad. If 50% of the experience is bad, it is, by definition, not a good experience. Averages have limited usefulness here, but the AVG FPS is about 139 and 152 when overclocked, comparable to the 8700K at both stock and overclocked levels. The difference is that the 8700K has better frametime consistency and is observably better in gameplay. As for the R7 2700, that ends up at around 111FPS AVG at 4.2GHz, with lows measuring within a range of 71FPS to 87FPS. Still a wide range of variability in the title, but nothing like what we saw a moment ago. The stock performance is about 102FPS AVG.
All of this said, before the AMD fans run to post absolutes about how Ryzen is more “fluid” or “smoother” 100% of the time, note that this is not true in every instance. In many games, as you’ll see today, the 9600K doesn’t have this issue and is technically superior in raw gaming performance. Far Cry seems to be somewhat anomalous in its behavior. That’s not to downplay the issue at all or downplay Ryzen’s positioning, but people often get carried away from a single chart and draw sweeping conclusions that are untrue when considering the broader scope.
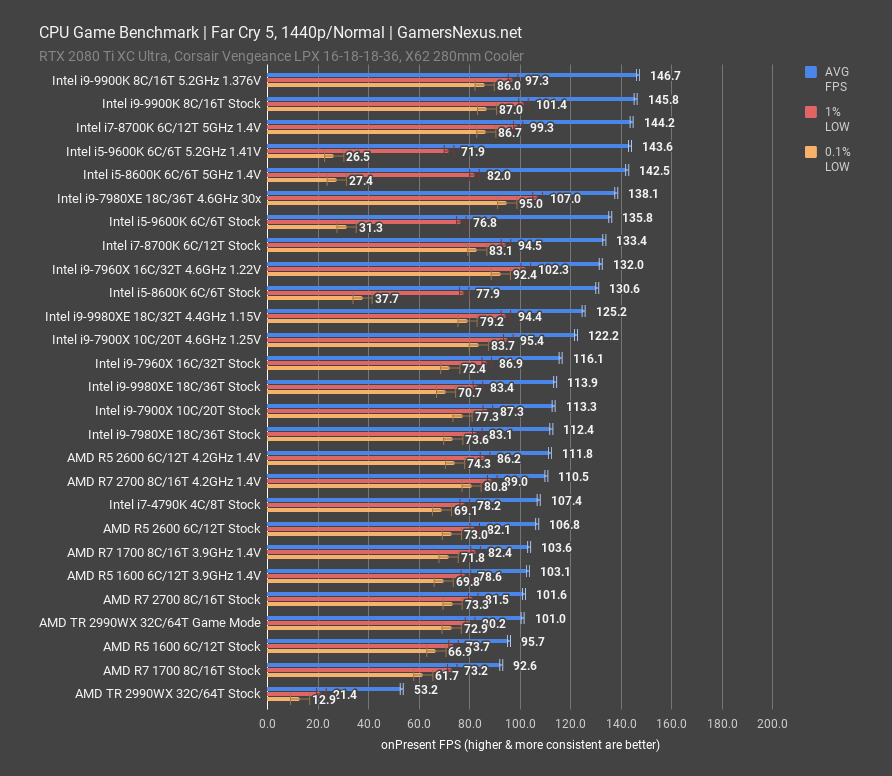
At 1440p, these performance results largely sustain: We see spurious performance across the i5 CPUs, including the stock 9600K – now averaging lower in the 0.1% department than previously – and the overclocked variant. The 8600K is in the same boat. None of the i7, i9, R7, or R5 CPUs seem to experience this behavior. The R7 2700 is, again, at about 102FPS AVG when stock, or about 111FPS when overclocked to 4.2GHz all-core.
Intel i5-9600K Benchmark - Assassin’s Creed: Origins
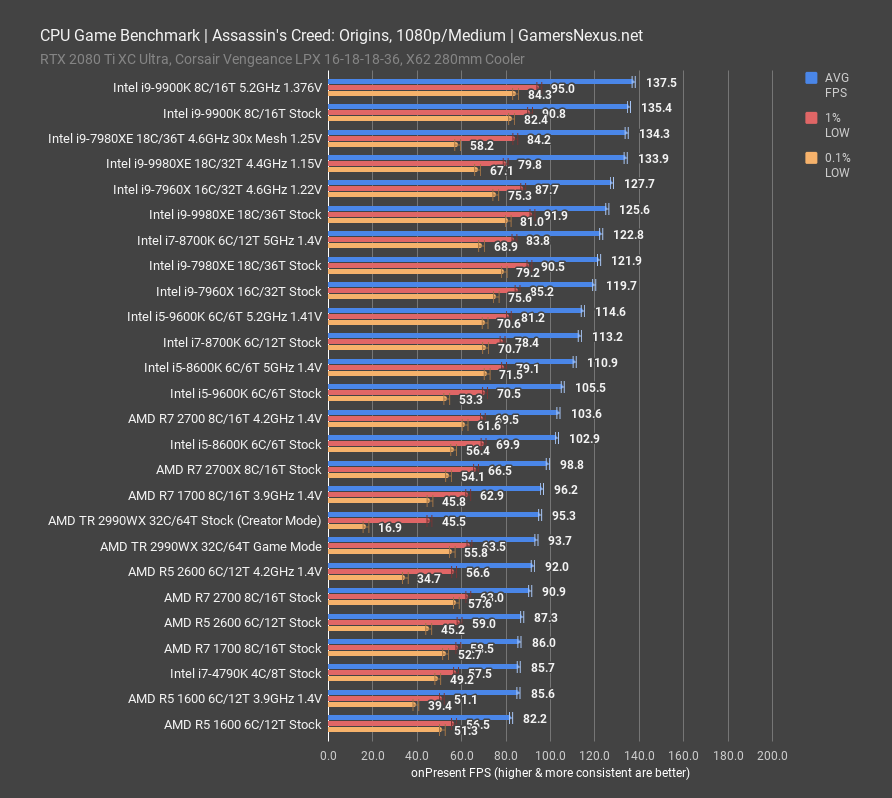
In Assassin’s Creed: Origins at 1080p/Medium, the Intel i5-9600K operates at about 106FPS AVG when stock, with lows at 71FPS and 53FPS. The immediate competitor is the R7 2700 at 4.2GHz, at about 104FPS AVG and being within error margins (indicated by the error bars on the chart). The top half is dominated by Intel CPUs, indicating that, although this game does make more use of cores than others, frequency is still king here. The R5 series CPUs run at around 87-92FPS AVG, depending on overclock. The R5 2600 would be the more traditional head-to-head competitor if considering launch MSRP of the Ryzen 5 CPUs, but given the perspective of price, the R7 2700 is a more directly priced competitor. For the 9600K and 2700 at parity in cost, performance is also at rough parity; that is, until you overclock the 9600K: Overclocking the 9600K to 5.2GHz pushes it up to 115FPS AVG, a stark climb that increases distance from Ryzen in this game.
Let’s get a frametime plot on the screen:
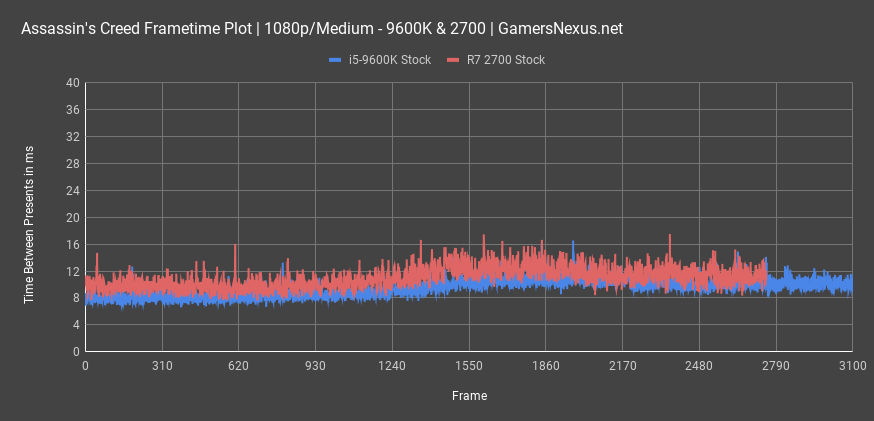
As a reminder, these are the most important charts when analyzing performance, as FPS distances itself from the core metric of time between frames. Ultimately, high FPS is pointless if the consistency of delivery is spurious, with time between frames getting smoothed over in averaging and being poor representations of user experience.
In this frametime plot, lower is better and more consistent is better than lower. 16ms would be about 60FPS. Both the R7 2700 and i5-9600K are of relative consistency with frame throughput. Neither has excessive spikes. The worst spike is about 17ms, which is an unnoticeable 3ms jump over the frame prior. This plot looks perfectly fine for each CPU. Although the 9600K does maintain a lead in maintaining lower frame-to-frame intervals, the question is how noticeable this is to most users.
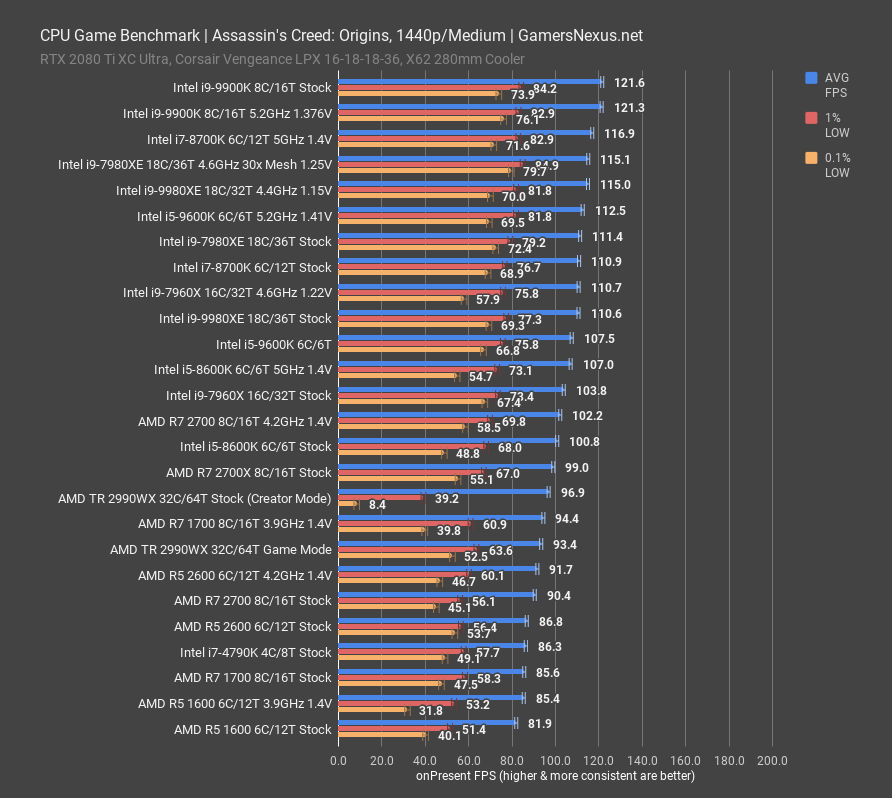
We retested the 2700 at 1440p with this review, as we noticed it had a spurious 0.1% frame dip that seemed uncharacteristic of performance elsewhere. With these new numbers, the R7 2700 operates at 90FPS stock, with lows reasonably timed at 56 and 45. The 9600K runs at 103FPS AVG, about the same as before, and the overclock is about 108FPS AVG. Not much of a drop, as we’re becoming more GPU limited at this point.
Intel i5-9600K vs. 2700, 8700K, 9900K - CIV VI Turn Time Benchmark
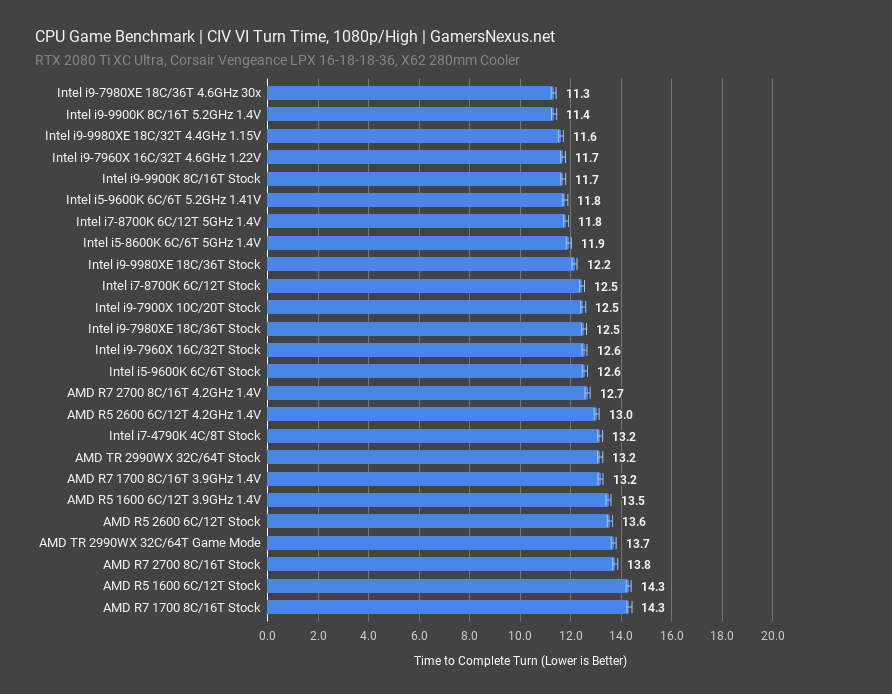
For Civilization VI turn time testing, we’re looking at the period of time it takes for an AI player to process its actions, tested for 15 iterations and then averaged. The i5-9600K ends up at 12.6 seconds turn time when stock, which is comparable to the i7-8700K at stock performance. Civilization has never really leveraged cores as much as it has frequency, although our chart-topping 7980XE does prove that cores can still be leveraged, even if in a less exaggerated fashion.
Overclocking the 9600K gets it to 11.7 seconds per turn, cutting off about 1 second per player for a net 5-second reduction across a full turn pass. The R7 2700 at 4.2GHz is about tied with the stock 9600K at 12.7 seconds, and is at about 13.8 seconds stock. Again, comparing this to the 2600, you can see that the cores aren’t as desirable as the slightly higher base clock on the 2600. We are also within some reasonable error, here, so the difference is insignificant between the R5 and R7.
Intel i5-9600K Benchmark - F1 2018
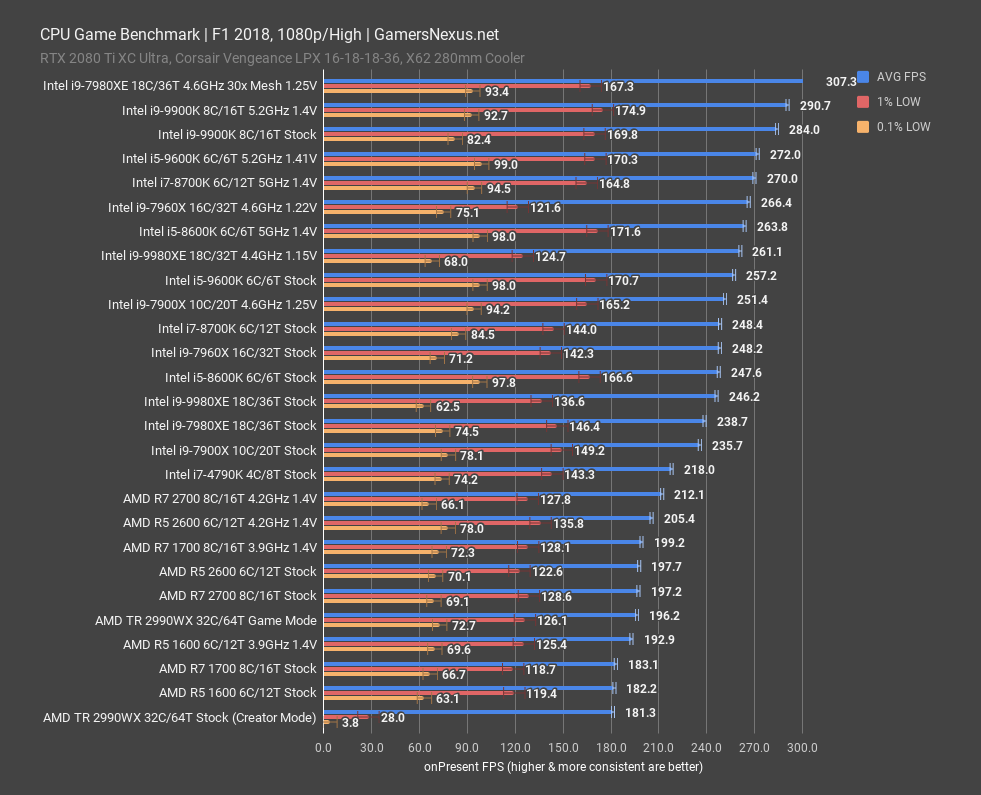
F1 2018 at 1080p/High is up next. This game makes for a good CPU benchmark, as illustrated by our maximum FPS of over 300 with the 7980XE OC CPU. The 9600K ends up at 257FPS AVG when stock, with the overclocked 5.2GHz 9600K at 272FPS AVG. That’s a sizable gain, but in the scope of hundreds of frames per second, we do enter territory where fewer people care about this level of speed. The R7 2700 at 4.2GHz runs 212FPS AVG, or about 200FPS when stock.
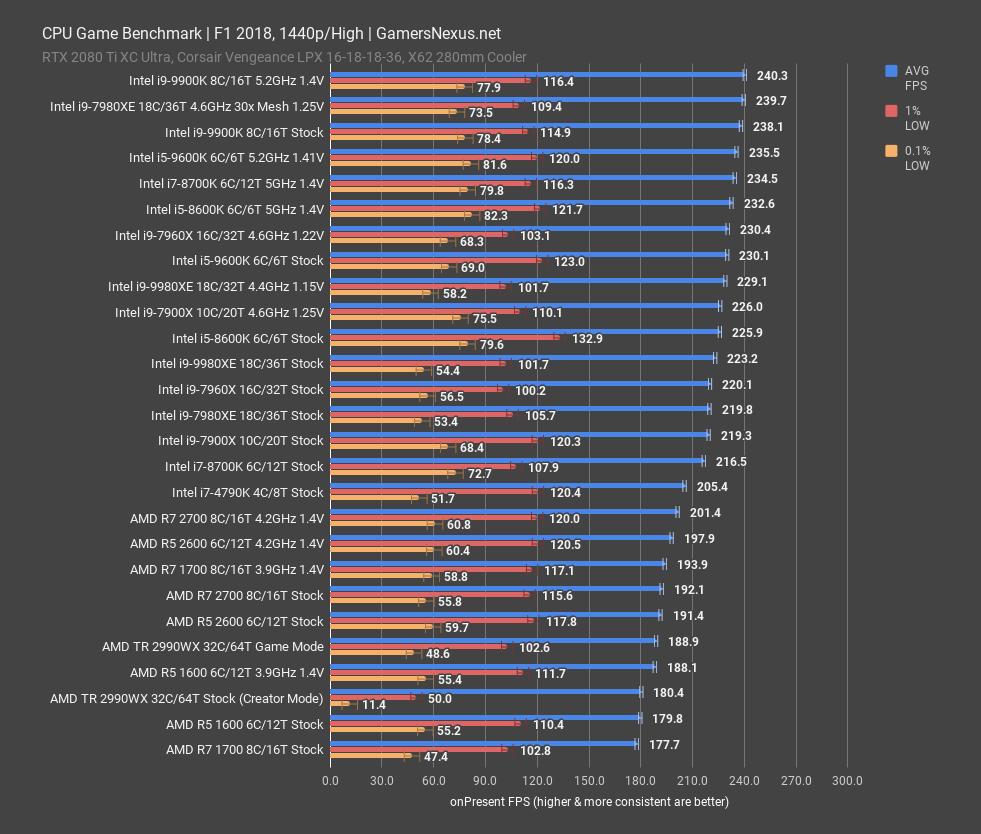
At 1440p, scaling is similar but truncated by the GPU. The 9600K stock ends up at 230FPS AVG, with the 8600K at about 226FPS AVG – no real changes generationally. Note that error margins are wider on the 1% and 0.1% lows due to the extremely high framerates we’re dealing with.
Intel i5-9600K Blender Benchmarks
The i5 CPUs really aren’t ideal for production tasks, but if you’re primarily a gamer and occasionally do some rendering work, this data might be helpful. Blender is extremely thread-intensive for its tile-based approach to rendering, where each CPU thread is tasked with one section of the scene. For our renders, we typically use optimized tile sizes of roughly 16x16 pixels on CPUs. GPUs tend to do better with sizes like 256x256 or higher.
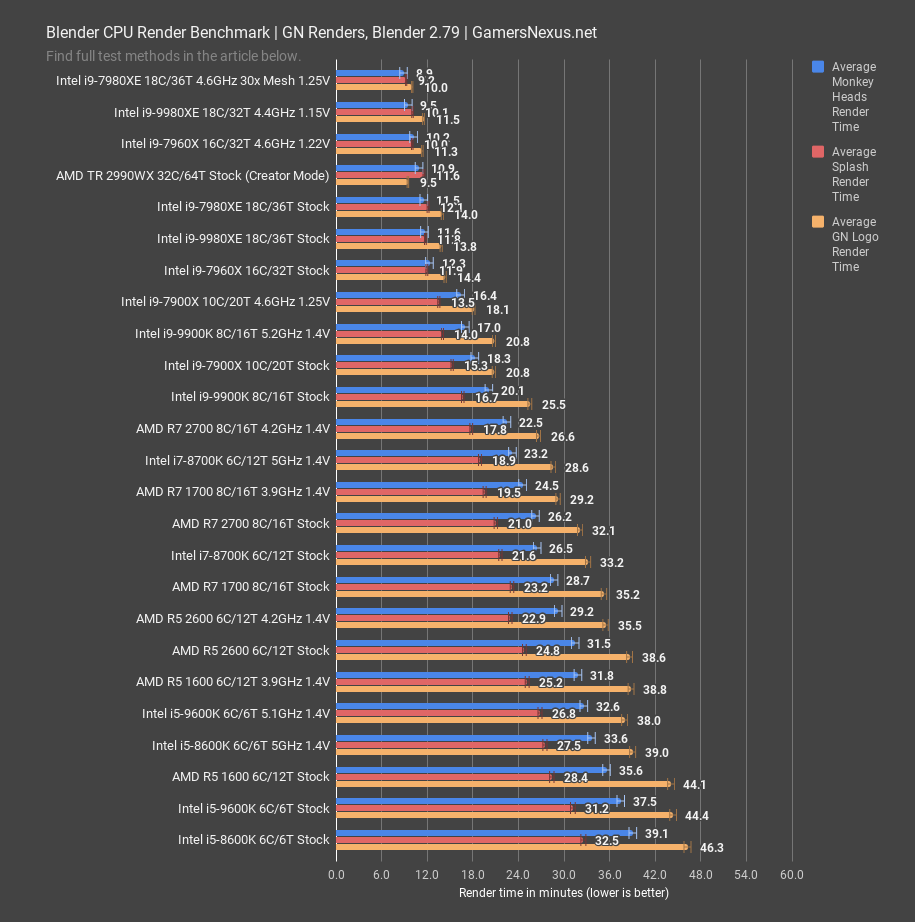
The 9600K ends up taking approximately 44 minutes to render the GN logo, our most intensive animation, which is roughly tied with last year’s GN award winning R5 1600 at 44 minutes. This is where, unlike in frequency-bound gaming use cases, losing hyperthreading really starts to hurt the i5. Overclocking the 9600K to 5.2GHz does significantly bolster its performance, to be fair, and lands it at around the same point as the R5 1600 when overclocked to 3.9GHz. It’s 38 minutes for the 9600K and 38.8 minutes for the 1600 OC – but note that we’re sorted by the monkey head render.
Speaking of, the monkey head render has the 9600K at 37.5 minutes, which isn’t much of an improvement on the 8600K. This is slower than the R5 1600’s render of the monkey heads by about 2 minutes per frame. Just for perspective, the same-priced R7 2700 ends up at 32 minutes for the GN logo render, which puts it on par with the 8700K. This is a significant performance increase over the same-priced i5-9600K, even when it’s overclocked. Stock-to-stock, the R7 2700 reduces render time by about 28%. That’s absolutely noticeable and, if you do any amount of 3D rendering workloads on the CPU, it’s worth going for the R7 instead. If this never happens, the 9600K might still be in the running. The 9600K will be advantaged in applications like Adobe Premiere, where frequency is more important than threads.
Conclusion: Is the i5-9600K Worth It?
By name and by marketing (and original MSRP), the i5 CPU is most comparable to the R5 CPUs. The R5 2600’s current $160 price-point makes it a less direct comparison, and the 2600X, which would perform about where an overclocked 2600 performs, is about $220. This is also cheaper, but still closer to compare. Even closer is the R7 2700, which is $270 normally (or ~$250 during current sales). This is the closest comparison.
We would favor an i7-8700K if you must go Intel – like for systems with the highest refresh rate possible – while staying below the price of the i9-9900K. We would favor an R7 2700 in heavily-threaded applications or games which are more dependent upon threads than the mean (e.g. Far Cry 5). The 9600K is still often superior in raw framerate, but does suffer frametime consistency hits in games like Far Cry 5. In those instances, it would be a worse experience insofar as its consistency of frame delivery. In the other games we tested, the 9600K holds a lead in gaming performance. It also suffers in Blender, the side-effect of fewer cores, making the R7 a better choice for anyone legitimately using the heavy multithreading in tile-based rendering applications. If you’re just gaming, the 9600K is often better – but not always, and that inconsistency is the key to our inability to offer a firm recommendation. We’d favor an i7-8700K (if budget can stretch) for pure gaming workloads, but the i5-9600K and R7 2700 choice requires more nuance. For anyone working with Blender in addition to gaming, the R7 2700 is a better choice. For pure gaming, the 9600K is “better” in most the games we tested, but that frametime inconsistency in some games causes us to hesitate.
The i5 remains hard to justify, even with its two-core increase. Intel remains the best option for gaming-only builds in the i7 class, but struggles to prove consistent value in the i5 class. That’s a problem – if the value is inconsistent, it is sometimes better to opt for a more consistent (if sometimes weaker) alternative, if only because the experience is then predictable.
Editorial, Testing: Steve Burke
Video: Andrew Coleman, Keegan Gallick