Today, we’re reviewing the NVIDIA Titan RTX for overclocking, gaming, thermal, and acoustic performance, looking at the first of two cards in the lab. We have a third card arriving to trade for one defective unit, working around the 1350MHz clock lock we discovered, but that won’t be until after this review goes live. The Titan RTX costs $2500, outbidding the RTX 2080 Ti by about 2x, but only enables an additional 4 streaming multiprocessors. With 4 more SMs and 256 more lanes, there’s not much performance to be gained in gaming scenarios. The big gains are in memory-bound applications, as the Titan RTX has 24GB of GDDR6, a marked climb from the 11GB on an RTX 2080 Ti.
An example of a use case could be machine learning or deep learning, or more traditionally, 3D graphics rendering. Some of our in-house Blender project files use so much VRAM that we have to render instead with the slower CPU (rather than CUDA acceleration), as we’ll run out of the 11GB framebuffer too quickly. The same is true for some of our Adobe Premiere video editing projects, where our graph overlays become so complex and high-resolution that they exceed the memory allowance of a 1080 Ti. We are not testing either of these use cases today, though, and are instead focusing our efforts on the gaming and enthusiast market. We know that this is also a big market, and plenty of people want to buy these cards simply because “it’s the best,” or because “most expensive = most best.” We’ll be looking at how much the difference really gets you, with particular interest in thermal performance pursuant to the removal of the blower cooler.
Finally, note that we were stuck at 1350MHz with one of our two samples, something that we’ve worked with NVIDIA to research. The company now has our defective card and has traded us with a working one. We bought the defective Titan RTX, so it was a “real” retail sample. We just wanted to help NVIDIA troubleshoot the issue, and so the company is now working with it.
Test Methodology
Testing methodology has completely changed from our last GPU reviews, which were probably for the GTX 1070 Ti series cards. Most notably, we have overhauled the host test bench and had updated with new games. Our games selection is a careful one: Time is finite, and having analyzed our previous testing methodologies, we identified shortcomings where we were ultimately wasting time by testing too many games that didn’t provide meaningfully different data from our other tested titles. In order to better optimize our time available and test “smarter” (rather than “more,” which was one of our previous goals), we have selected games based upon the following criteria:
- Game Engine: Most games run on the same group of popular engines. By choosing one game from each major engine (e.g. Unreal Engine), we can ensure that we are representing a wide sweep of games that just use the built-in engine-level optimizations
- API: We have chosen a select group of DirectX 11 and DirectX 12 API integrations, as these are the most prevalent at this time. We will include more Vulkan API testing as more games ship with Vulkan
- Popularity: Is it something people actually play?
- Longevity: Regardless of popularity, how long can we reasonably expect that a game will go without updates? Updating games can hurt comparative data from past tests, which impacts our ability to cross-compare new data and old, as old data may no longer be comparable post-patch
Game graphics settings are defined in their respective charts.
We are also testing most games at all three popular resolutions – at least, we are for the high-end. This includes 4K, 1440p, and 1080p, which allows us to determine GPU scalability across multiple monitor types. More importantly, this allows us to start pinpointing the reason for performance uplift, rather than just saying there is performance uplift. If we know that performance boosts harder at 4K than 1080p, we might be able to call this indicative of a ROPs advantage, for instance. Understanding why performance behaves the way it does is critical for future expansion of our own knowledge, and thus prepares our content for smarter analysis in the future.
For the test bench proper, we are now using the following components:
GPU Test Bench (Sponsored by Corsair)
Component | Courtesy of | |
CPU | GamersNexus | |
GPU | This is what we’re testing! | Often the company that makes the card, but sometimes us (see article) |
Motherboard | ASUS | |
RAM | Corsair | |
PSU | Corsair | |
Cooler | NZXT | |
SSD | Plextor 256-M7VC | GamersNexus |
NVIDIA Titan RTX Overclocking
| NV Titan RTX Overclock Stepping | TimeSpy Extreme Stress Test | GamersNexus.net | ||||||||||
| Peak Frequency | AVG Frequency | Core Offset | Core Voltage | Memory Frequency | Memory Offset | Power | Watts | Fan Speed | Active Temp | Pass/Fail |
| 1920 | 1800 | 0 | 0.96 | 1750.2 | 0 | 100% | 280 | 1515 | 75 | P |
| 1905 | 1830 | 0 | 0.975 | 1750.2 | 0 | 114% | 318 | 1516 | 88 | Throttle |
| 1860 | 1815 | 100 | 0.975 | 1750.2 | 0 | 114% | 300 | 1517 | 88 | Throttle |
| 1965 | 1955 | 100 | 1.018 | 1750.2 | 0 | 114% | 327 | 3700 | 66 | P |
| 1995 | 1980 | 125 | 1.018 | 1750.2 | 0 | 114% | 328 | 3700 | 66 | P |
| 2025 | 2010 | 150 | 1.018 | 1750.2 | 0 | 114% | 330 | 3700 | 66 | P |
| 2040 | 2025 | 175 | 1.018 | 1750.2 | 0 | 114% | 330 | 3700 | 66 | P |
| N/A | N/A | 200 | N/A | N/A | N/A | N/A | N/A | N/A | N/A | F - Crash |
| Fail - Application Crash | ||||||||||
| 2085 | 2040 | 175 | 1.018 | 1750.2 | 0 | 114% | 320 | 3700 | 62 (post-crash) | P |
| 2050 | 2030 | 175 | 1.018 | 1995.2 | 980 | 114% | 320 | 3700 | 65 | P |
| 2040 | 2030 | 175 | 1.018 | 2030.2 | 1120 | 114% | 330 | 3700 | 66 | P - Lite Flicker |
| 2040 | 2030 | 175 | 1.018 | 2030.2 | 1080 | 114% | 330 | 3700 | 66 | P |
Overclock stepping comes up first. You’ll need to know this information to go with our gaming benchmarks. The Titan RTX overclocking process follows the same steps as the 2080 Ti, and becomes instantly throttled by its cooler under the out-of-box fan curve built into VBIOS. Under complete stock settings, we saw an average frequency of about 1800MHz in TimeSpy Extreme, with a 1920MHz peak frequency. Power measured about 280W through GPUZ, though we have separate measurements later. The fan seems to stick to around 1515RPM to maintain a thermal target of 75 degrees Celsius.
Maximum power target is 114%, leaving us with a limited amount of room to increase performance. We ended up at 1830MHz average, up 30MHz, and that’s without any core frequency offsets. We were also instantly throttling at 88 degrees, causing the clock to bounce around between 1780MHz and 1850MHz. A few steps later, we blasted the fan speed to 3700RPM, or maximum speed, and saw performance uplift in a significant fashion. This is an illustration of how stock coolers are limited. Now, traditionally, some people have complained to us that we were being too harsh on NVIDIA blower coolers for this type of card, because their idea was that you stack a bunch of blower cards into a tight box for rendering, in which case it’s more effective and removing heat from the system than axial coolers. This time, now that NVIDIA has switched coolers, that argument no longer stands. It’s just a straight worse cooler than any partner would provide, and yet doesn’t even offer the only benefit a blower would offer, which is better performance in scenarios with multiple cards back-to-back. We eventually crashed with a 200MHz offset, then found core clock stability with a 175MHz offset. Maximum frequency was 2085MHz when around 62 degrees Celsius, finding a resting point at 2040MHz peak under 66 degrees for the core. Average frequency landed at 2030MHz, with the max stable memory frequency offset at 1080MHz, which we think is one of the memory straps.
We could push this card harder with a bigger power offset. With 100% fan speeds, the noise levels are intolerable for most users, but the thermal performance is acceptable for overclocking. The trouble is that, just like the previous RTX cards, we become bound by an overprotective power target and voltage limitations. We might try and mod VBIOS to see if we can surpass this, or might just rip one of the shunt resistors off the board and do Buildzoid’s mod.
Anyway, that’s our overclock setting for the tests. Overclocking is limited on this one, and that’s entirely because of the power limit. GPUZ was reading power draw at 330W when overclocked, but the VRM can handle far more than this, as our 2080 Ti reference PCB analysis demonstrates, and this is the same PCB as that.
Titan RTX vs. 2080 Ti, SLI, & 1080 Ti Benchmarks - Sniper Elite 4
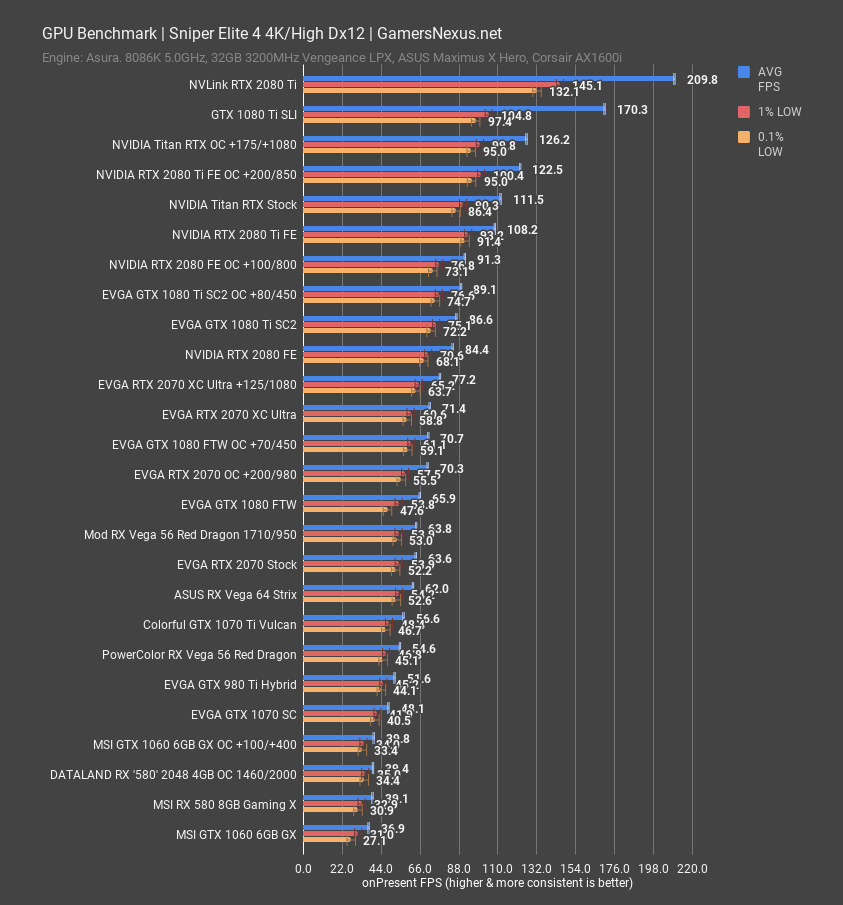
Our game benchmarks will start with Sniper Elite 4, which is one of the best-built games with a modern API. Using DirectX 12, Async Compute, and 4K/high settings, the NVIDIA Titan RTX ends up at 112FPS AVG, with lows at 90FPS and 87FPS 1% and 0.1% low. For comparison, 1080 Tis in SLI do about 170FPS AVG, or SLI 2080 Tis do 210FPS AVG. We also observed the 2080 Ti at about 108FPS AVG, establishing a difference of about 4FPS, or 8.96ms average frametimes for the Titan versus 9.2ms frametimes for the 2080 Ti. We can’t think of many humans, if any, who can identify a 240-microsecond difference in frame-to-frame intervals.
Overclocking the Titan RTX to about 2040MHz core gets it to 126FPS AVG, outperforming the overclocked 2080 Ti by about 3%. The next thing we need to test is NVLink Titan RTXs, which we’ll work on immediately after this.
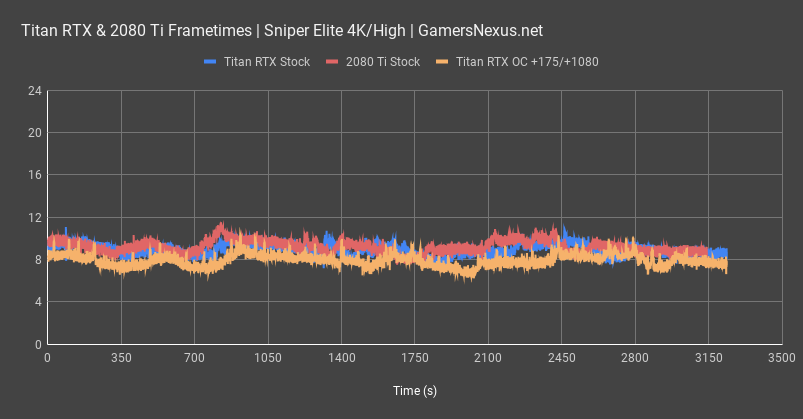
Here’s a look at frametimes between the stock Titan RTX and stock 2080 Ti cards. As a reminder, frametimes are the most accurate representation of frame-to-frame pacing, or the interval of time from one frame to the next, and are the best way to objectively illustrate the raw experience without any averaging. Both cards perform roughly the same. Lower is better and more consistent is best, but these cards are both low in frametime and consistent in frametime. NVIDIA has done well with frametime consistency for this generation, for the most part, and neither of these cards experiences a noteworthy frametime spike or hang. It would be difficult to tell the two apart. For reference, 16.667ms is 60FPS with 8 at about 120FPS. What we care about here is that there’s never more than an 8ms deviation from the mean, and so the user is unlikely to detect any hitching or interruption of fluidity. Some people call this “smoothness.”
Overclocking the Titan RTX introduces more frametime variance, as you’ll see in its line plot, but nothing severe. We’re regularly hitting 3ms frametime increases over baseline, from 7ms to 10ms in some cases, but this is still relatively fluid and generally unnoticeable to the user.
Titan RTX Gaming Benchmark vs. 2080 Ti – F1 2018
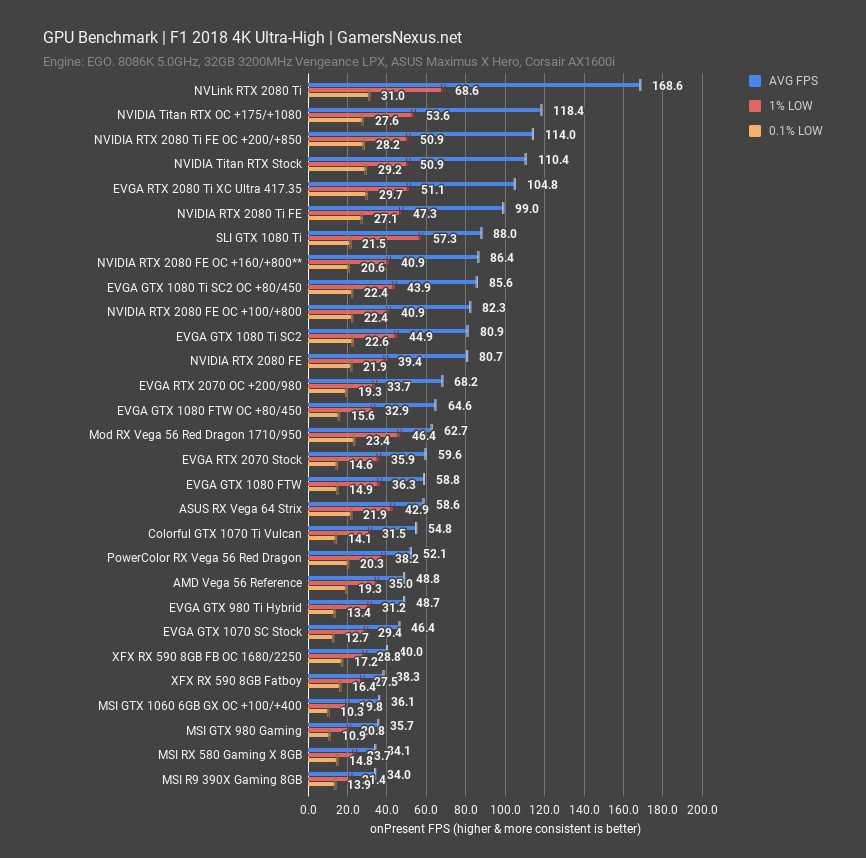
F1 2018 gives us a look at the EGO engine with DirectX 11, moving back to more widespread APIs and away from the shining example of Dx12 that is Sniper Elite 4.
For F1 2018 at 4K and ultra-high, we’re clearly GPU-bound with high ceilings set by the CPU. In our CPU reviews, you’ll see FPS as high as 300 with the right CPU, so this is a good means to really test limits of the GPU and avoid limiting influence from the CPU. This is further illustrated by the SLI 2080 Tis at 169FPS AVG, clearly pulling away from the pack. As for the Titan RTX, that ends up at 110FPS AVG stock, placing it just ahead of the 2080 Ti FE’s 99FPS AVG, or the 2080 Ti XC Ultra’s 105FPS AVG. Maximally, the gap is no greater than 10%, and that reduces to about 5% with the AIB partner model 2080 Ti. Overclocking the Titan gets it to 118FPS AVG, just ahead of the overclocked 2080 Ti FE at 114FPS AVG.
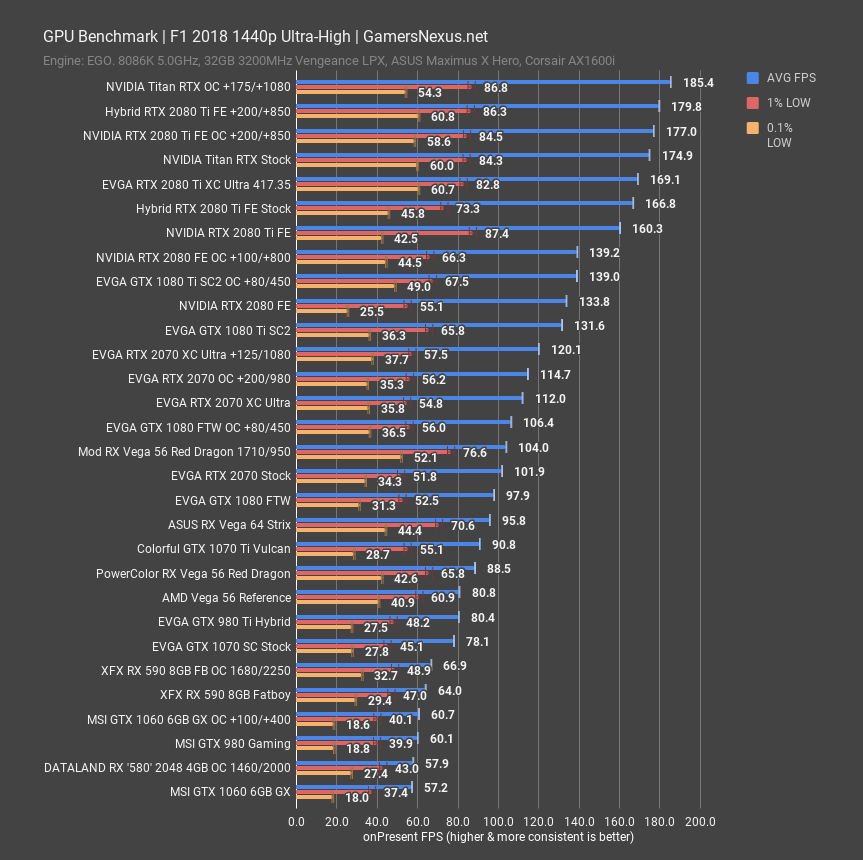
At 1440p, the overclocked Titan RTX runs at 185FPS AVG and with lows at 87FPS 1%, putting it just above the 2080 Ti FE Hybrid overclocked card by about 3%. The Titan RTX stock card hits 175FPS AVG, sandwiching it between the overclocked 2080 Ti and stock 2080 Ti XC Ultra at 170FPS AVG, or stock 2080 Ti FE at 160FPS AVG. Differences here are minimal, which is probably expected when considering that the Titan RTX only adds 4x SMs to the GPU, moving to 72 SMs from 68 SMs, so the lacking performance makes sense.
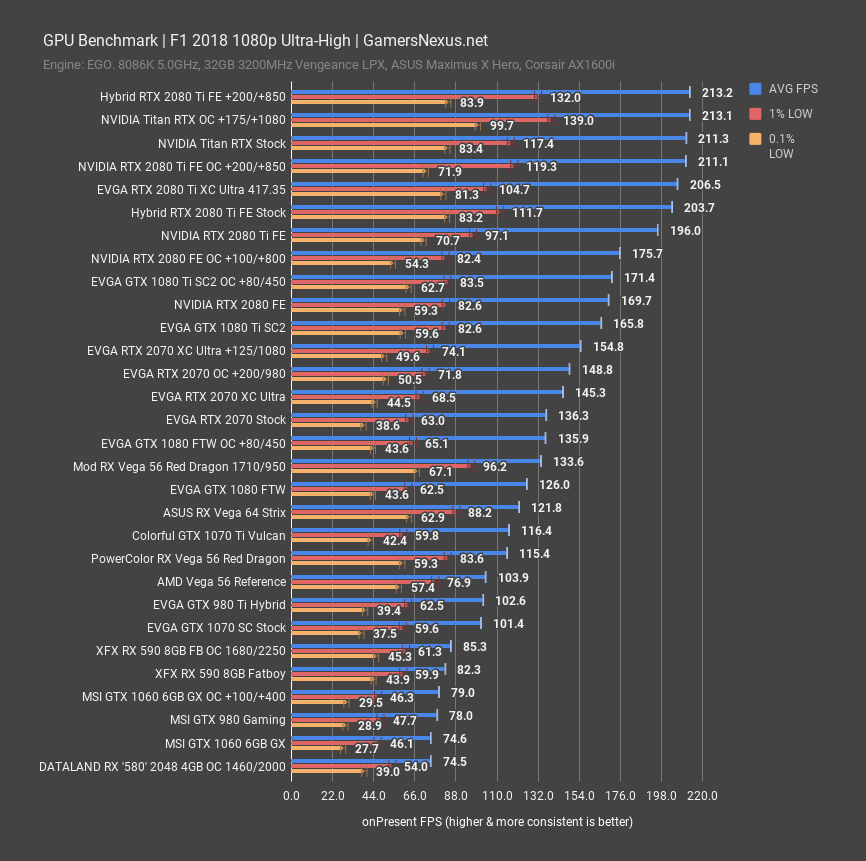
At 1080p, we clearly slam into a bottleneck at about 213FPS AVG. This is becoming a CPU-bound scenario, and so the results here are relatively meaningless. All we learn is that this CPU can’t keep up with the cards at 1080p.
Shadow of the Tomb Raider – Titan RTX Benchmark
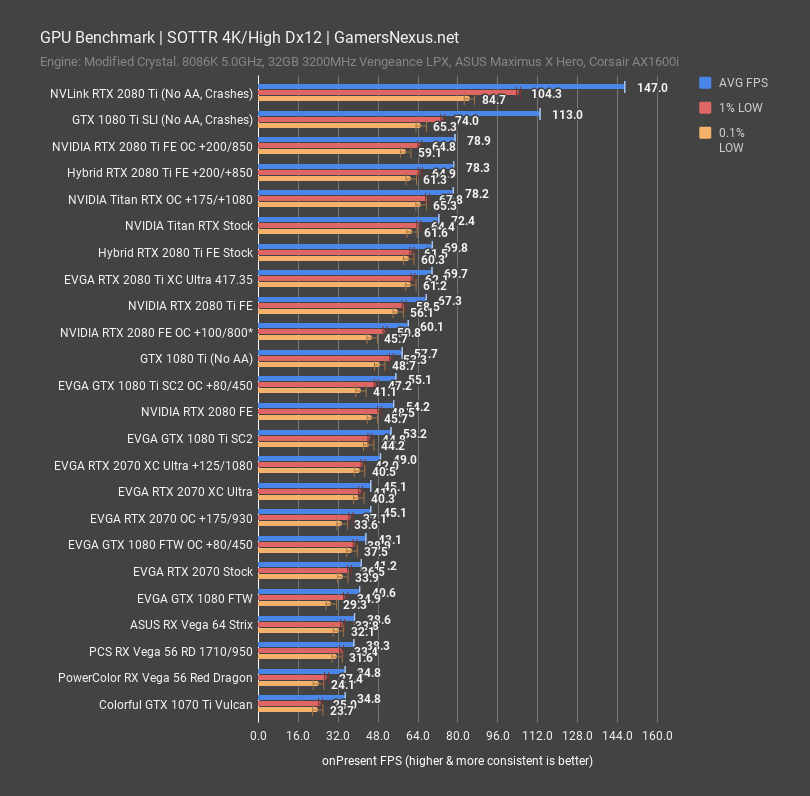
Shadow of the Tomb Raider is a DirectX 12 title that’s still relatively recent. For this one, note that the SLI tests were conducted without anti-aliasing as TAA causes issues with alternate frame rendering as a result of the lack of previous frame data on each card.
The Titan RTX ends up at 72FPS AVG for stock performance, which isn’t much better than the 2080 Ti FE’s 67FPS AVG. The 7.6% performance uplift is undesirable in the face of a 100% price increase, but note again that the bigger reason to buy this card is for its VRAM increase, not for any other reason. That’ll mostly benefit non-gaming applications. Overclocking the Titan RTX puts it at 78FPS AVG, which is about the same as overclocking a 2080 Ti card, although our 2080 Ti was able to push higher in core clock. This is part silicon lottery and likely part thermal density.
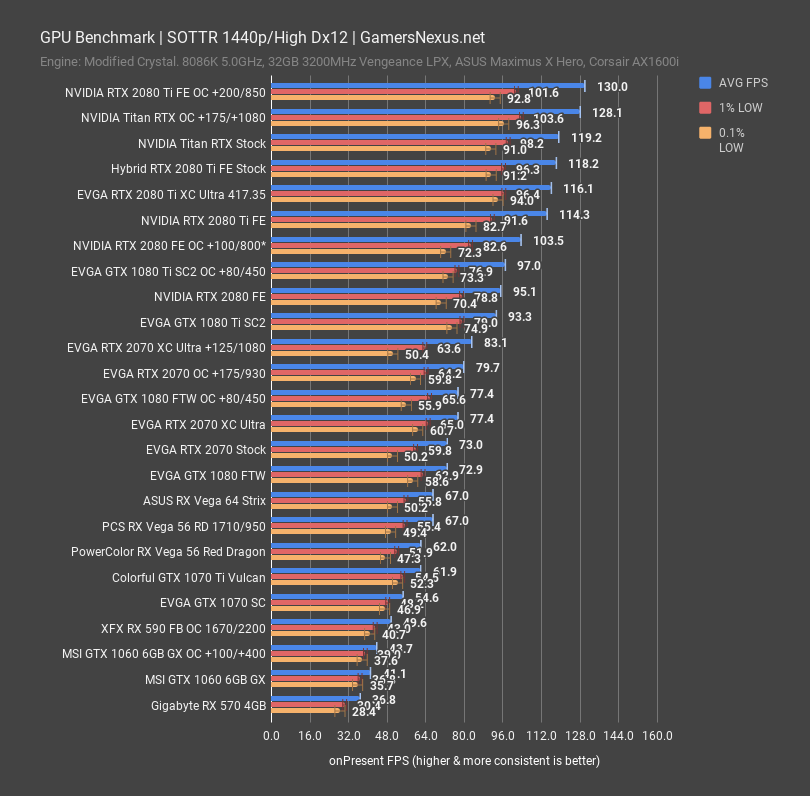
At 1440p, the Titan RTX runs at 119FPS stock, which is functionally tied with the 2080 Ti FE when unconstrained thermally by way of Hybrid mod. The 2080 Ti XC Ultra sits at 116FPS AVG, with the FE at 114FPS AVG. Overclocking puts the 2080 Ti in the lead, again due to a higher clock, with the Titan RTX just behind at around 128-130FPS AVG.
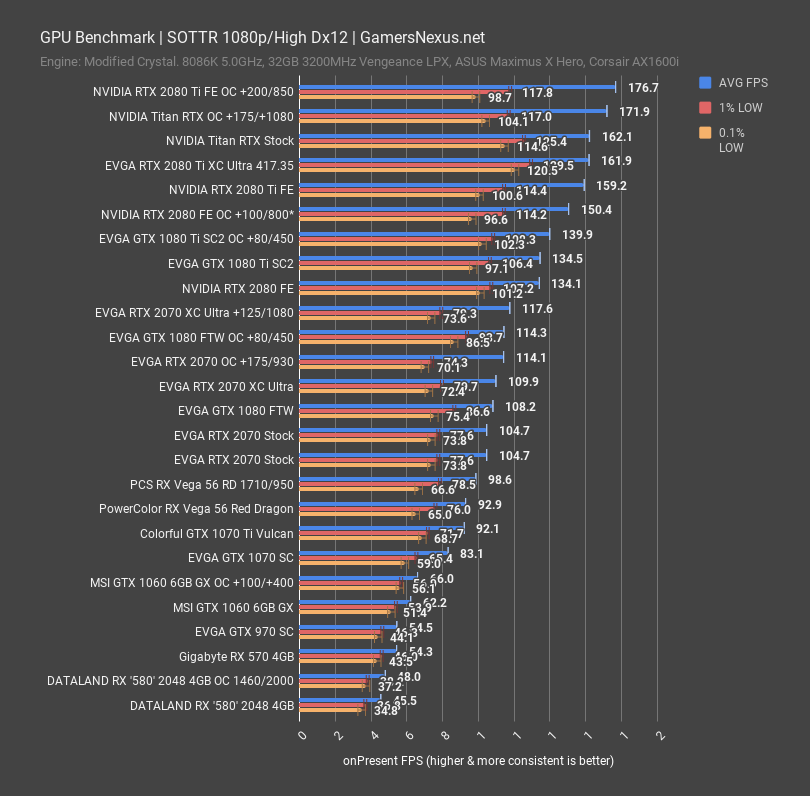
At 1080p, the cards still show scaling and haven’t run into a hard limit yet, but we do see tha the Titan RTX and 2080 Ti XC Ultra – and 2080 Ti FE, for that matter – are all about the same performance level. There is functionally no difference between these devices.
Titan RTX Benchmark - GTA V
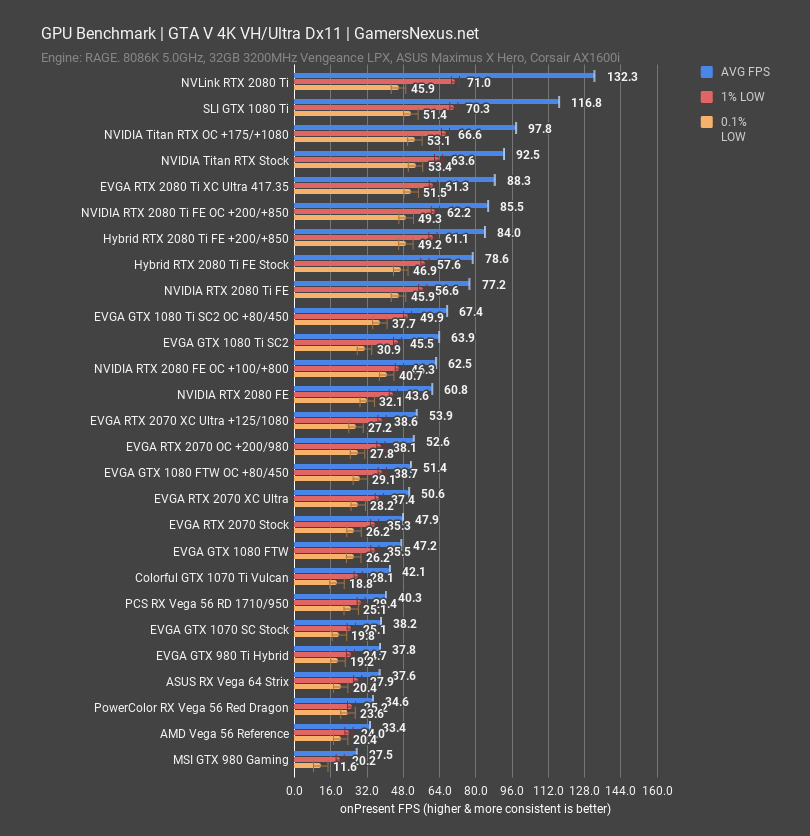
GTA V gives us an interesting spin on results. For this one, tested first at 4K, the Titan RTX runs at 93FPS AVG, outperforming both the stock and overclocked 2080 Ti FE card. The 2080 Ti XC Ultra ends up at 88FPS AVG and would surpass the Titan RTX with an overclock. Overclocking the Titan RTX gets it to 98FPS AVG, still outperformed by the dual GPU classes above it. Although the Titan card looks better here than in some games, it is still clearly not worthwhile for gaming use cases.
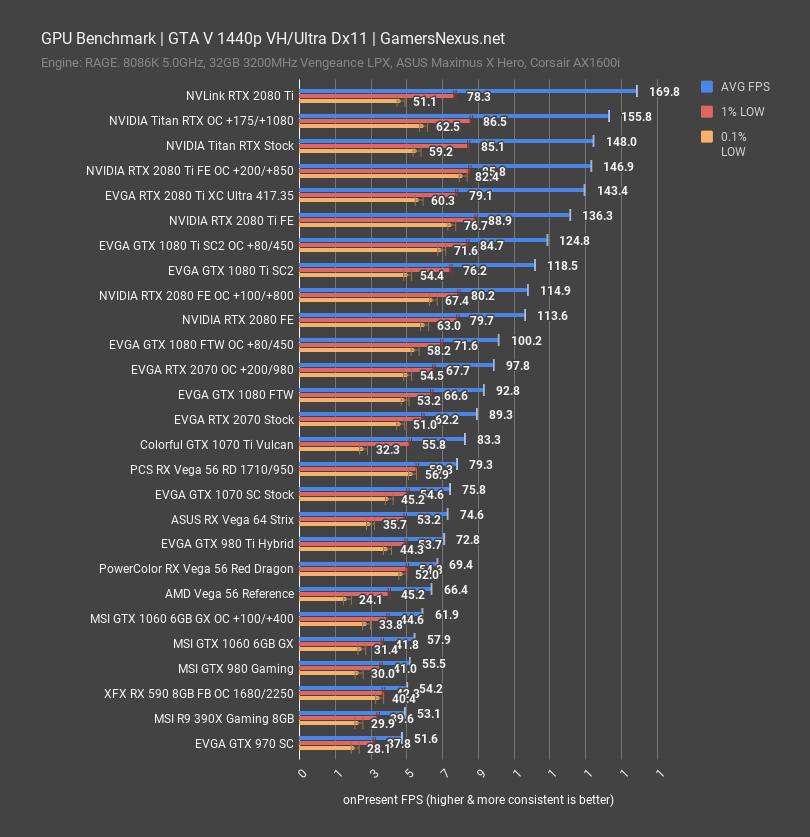
At 1440p, the Titan RTX ends up near the top at 156FPS AVG, where we’re beginning to become bound by the game engine. This engine frame caps at 187.5FPS, making it impossible to see how much more headroom there is for the SLI cards, for instance. Still, the Titan RTX stock card ranks about even with an RTX 2080 Ti FE overclocked, establishing no meaningful difference.
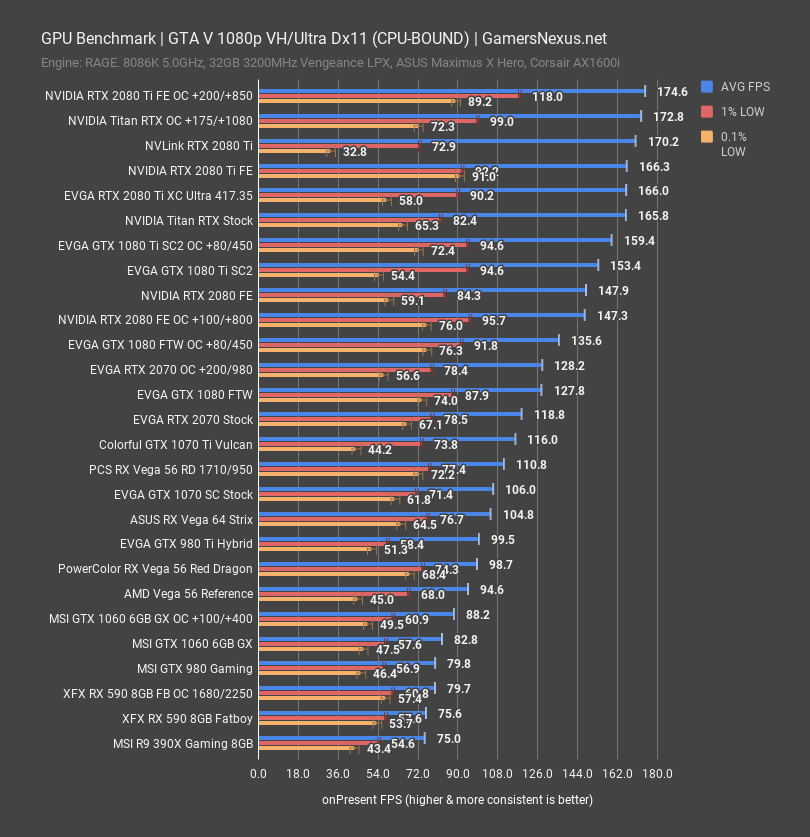
We have 1080p results, but it’s CPU-bound to a point that everything becomes equal. There’s nothing to learn here, so let’s move on.
Titan RTX Benchmark & Overclocking – Far Cry 5
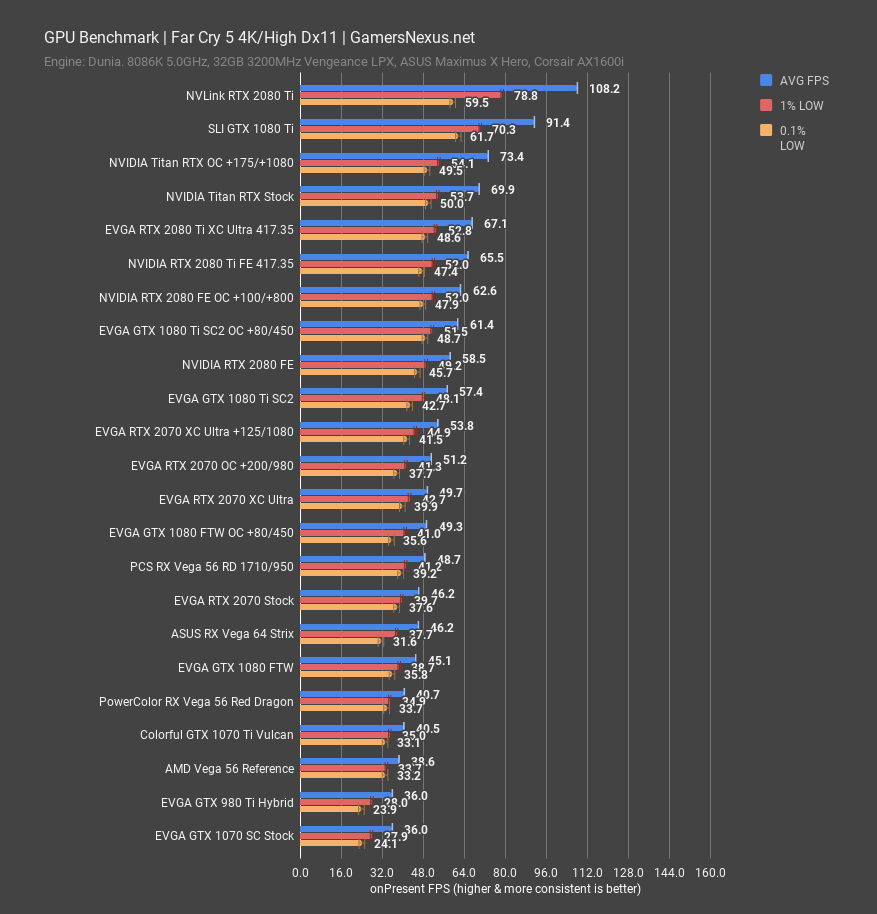
Some recent game updates made it apparent that it was worth retesting in Far Cry 5, so we reran the 2080 Ti FE numbers for this one. The Titan RTX ends up at 70FPS AVG, with the overclocked variant gaining 5% performance to 73FPS AVG. The 2080 Ti retested lower than its result from a few months ago, placing instead at 66FPS AVG, with the XC Ultra at 67FPS AVG. The Titan RTX ends up ahead by about 6-7% when all are retested on these drivers and with this game update.
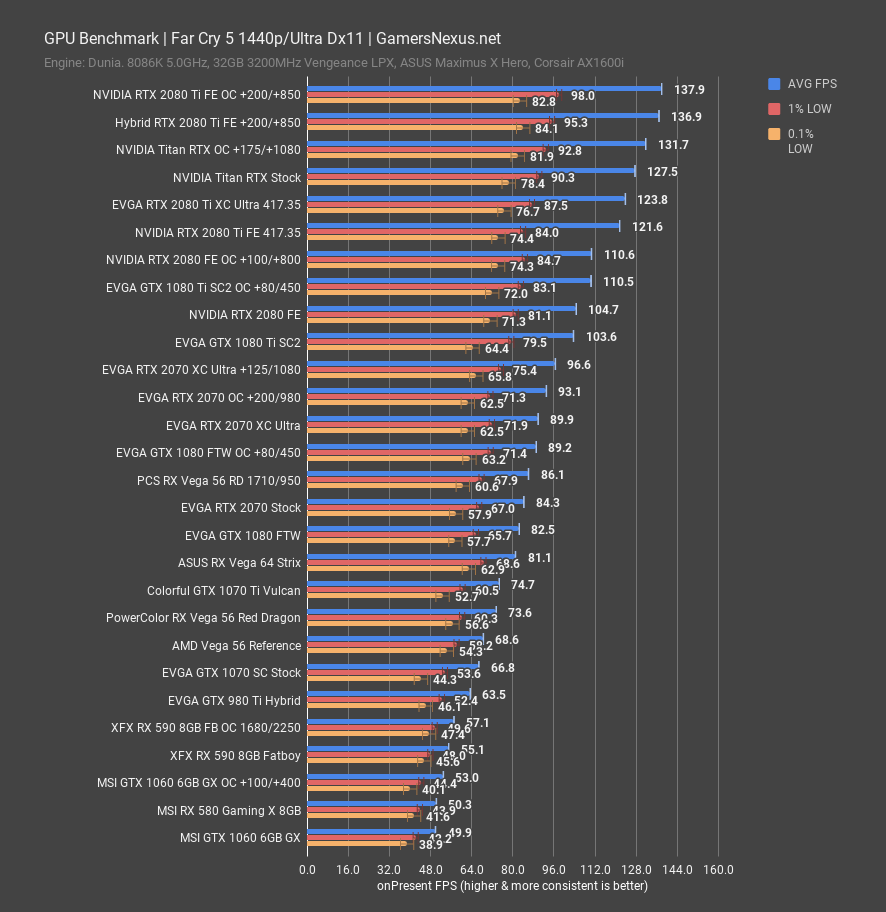
When both are stock, 1440p scaling places the Titan RTX as 4.9% ahead of the 2080 Ti FE. Scaling reduces as resolution reduces. Our original 2080 Ti result was around 126FPS AVG, though the new drivers, game update, and small Windows patch have impacted scoring.
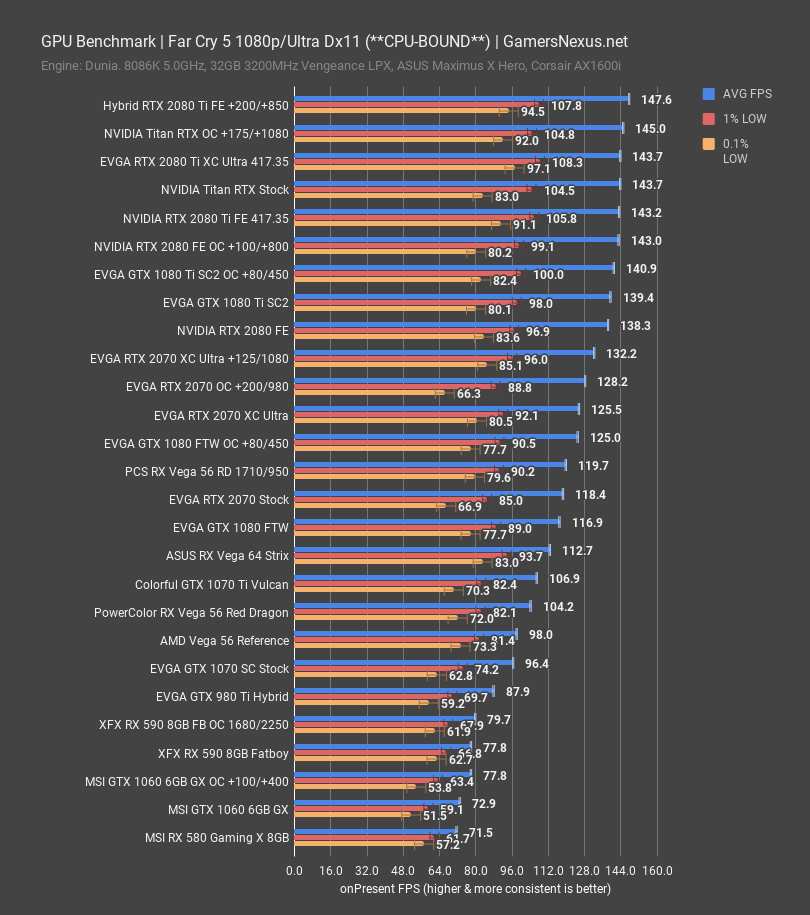
1080p equalizes the results. We are becoming CPU-bound, here, so all the top results are within reasonable margin of error and are capped by the CPU.
NVIDIA Titan RTX Power Consumption
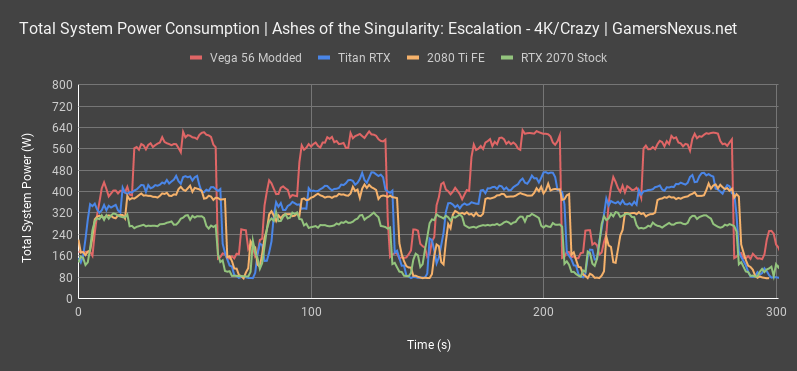
For power consumption testing, we’re measuring between the wall and the system for total system power consumption. The test platform is 100% controlled, including control over all minor rail voltages on the motherboard, the fan quantity, speed, and type, the keyboard and mouse, and every single other part in the system. Failure to control even some of the voltages in the motherboard would throw off these readings and leave them inaccurate. We’re also logging over time, so that you can see a proper look that includes peaks and lows, rather than an averaged sum of the test.
This chart is with Ashes of the Singularity: Escalation under a 4K/Crazy workload, pushing the GPU to its limits. Running the Titan RTX card, our total system power consumption peaks at 480W, outdrawing the 2080 Ti Founders Edition system by 24W. The only thing that outdrew the Titan RTX card was our heavily modded Vega 56 contraption, which used a 250% power target to blast power way past the stock allowance, putting that total system draw at around 640W peak. Vega 56 is typically closer to the 350W range for total system power draw.
NVIDIA Titan RTX Thermals
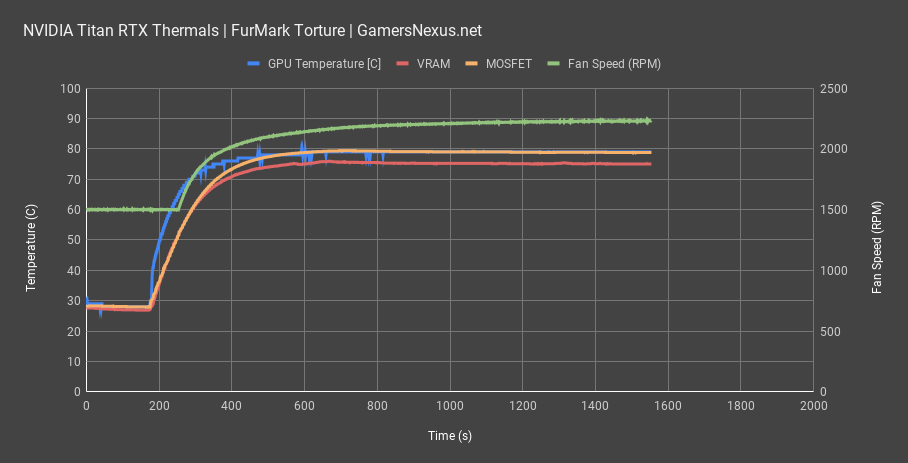
Thermal testing puts the Titan RTX under load with either FurMark or 3DMark, depending on the test. Thermocouples are attached to a hotspot GDDR6 module and hotspot MOSFET, with GPU-Z used for logging the rest of the performance counters. For our power virus workload, we monitored a maximum GPU temperature of about 80 degrees Celsius, with the hottest GDDR6 module at around 76 degrees. The MOSFET was running at around 80 degrees. The GPU temperature is warm, definitely, and will impact frequency. We already know that frequency steps incrementally every couple degrees, so to be in the 80s for the stock cooler is unimpressive. This becomes more of a problem for anyone stacking multiple of these cards in an array. As for the VRAM temperature, that’s completely fine. 90-95 degrees is the spec, and the MOSFET can take 125-150 degrees, so both are within operating spec.
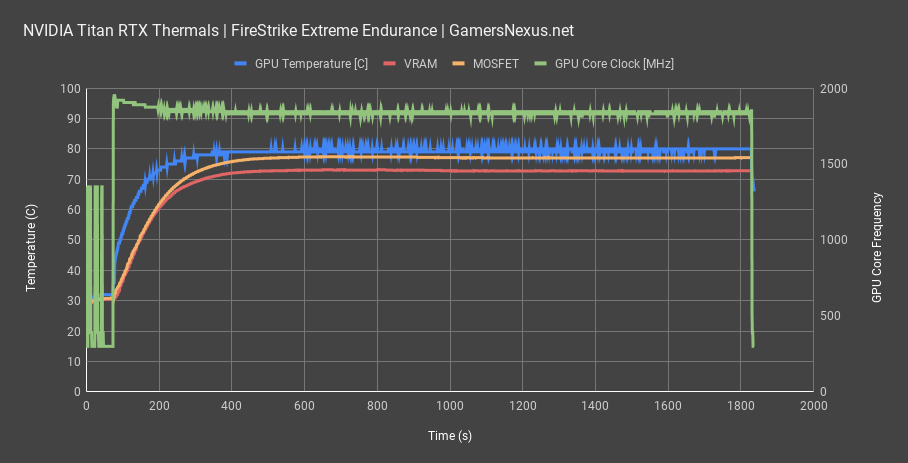
With Firestrike endurance testing, we saw frequency start at about 1935MHz when at 40 degrees, then drop to about 1830-1845MHz and fluctuate based upon core temperature. The temperature seems to hit about 84 degrees before it lightly throttles down the clock to hit 80 degrees.
Noise Levels for Titan RTX
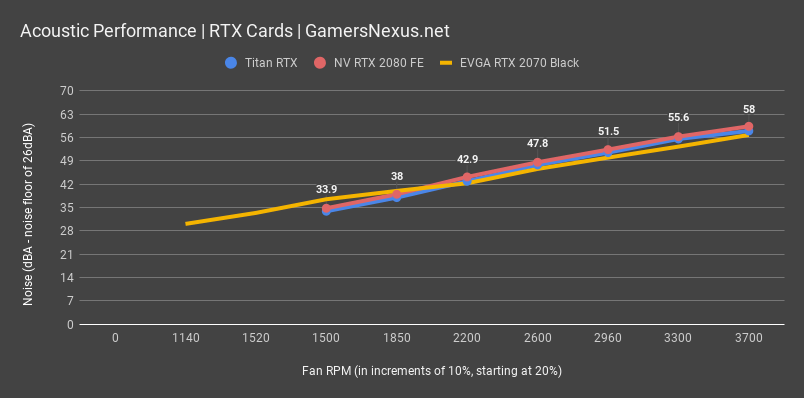
This is the final chart for the review. Noise for the Titan RTX runs a 33.9dBA level when set to 41% speed, which is the slowest possible. That’s much louder than most other partner models under idle conditions. At the average fan speed of 60%, we’re at 42.9dBA. Going to 100% pushes 58dBA. Expect to be at around 43dBA in most use cases. This card is acoustically outperformed by board partners, but no board partner Titan RTX cards will exist.
Conclusion
It really shouldn’t surprise anyone that this isn’t a worthwhile purchase for gaming or enthusiast users. We may test the Titan RTX in Blender or other applications later – primarily after those professional applications add the ability to leverage RT and Tensor Cores – but that’s off the radar for today. If you really must spend $2500 on a GPU, get two 2080 Tis instead, although we don’t necessarily recommend that, either.
Editorial, Testing: Steve Burke
Video: Andrew Coleman, Keegan Gallick