Intel’s new i7-9700K is available for about $400 to $430, which lands it between the 9900K – priced at around $550, on a good day – and the 8700K’s $370 price-point. We got ours for $400, looking to test the new 8C/8T CPU versus the not-that-old 8700K and the hyperthreaded 9900K of similar spec. Intel made a big move away from 4C/8T CPUs and the incumbent pricing structure, with the 9700K acting as the first K-SKU i7 to lack hyperthreading in some time.
The elimination of hyperthreading primarily calls into question whether hyperthreading is even “worth it” once running on an 8C, high-frequency CPU. The trouble is that this is no longer a linear move. In years past, a move from 4C/8T to 8C/8T would be easier to discuss, but Intel has moved from a 6C/12T 8700K part of a lower price – in the $350-$370 range, on average – to an 8C/8T 9700K at a higher price. Two more physical cores come at the cost of four additional threads, which can post benefit in some thread-bound workloads – we’ll look at those in this content.
Test Components
Tested CPUs primarily include the below list:
- Intel i9-9900K
- AMD R7 2700
- AMD R7 2700X
- Intel i7-8700K
- AMD R5 2600
- AMD R5 2600 OC (2600X stand-in)
- Intel i5-8600K
- Intel i9-7900X
- Intel i9-7960X
- AMD R7 1700
- Intel i7-4790K
Motherboards used for testing are as follows:
- ASUS Maximus XI Hero Z390
- Gigabyte Gaming 9 Z370
- Gigabyte Z97X Gaming G1 BK
- ASUS Crosshair VII Hero X470
- ASUS Crosshair VI Hero X370
- Gigabyte X299 Gaming 9
- MSI GD65 Z77 w/ HyperX Savage DDR3 32GB 2166MHz (max supported)
Constants used are as follows:
- All desktop platforms: 2x 8GB 3200MHz Corsair Vengeance LPX 16-18-18-36 DDR4
- (Exception: Z97X uses HyperX Savage 2133MHz DDR3)
- All quad-channel HEDT platforms: 4x 8GB 3200MHz Corsair Vengeance LPX 16-18-18-36 DDR4
- Corsair AX1600i PSU
- NZXT Kraken X62 at 100% speeds
Windows 10 version 1803 was used for all testing with Windows Update disabled. PresentMon is used for framerate data logging, with custom scripts for capturing data accurately.
Intel i7-9700K vs. 8700K - F1 2018 Benchmark
F1 2018 produces extremely high framerates, something not as commonly found in other titles. This game becomes CPU bound rapidly, as our RTX 2080 Ti allows all of these CPUs to fully stretch their legs, as illustrated by the 7980XE at 4.6GHz hitting 307FPS AVG. The point is that our point of bottlenecking is elevated enough to really look at performance differences.
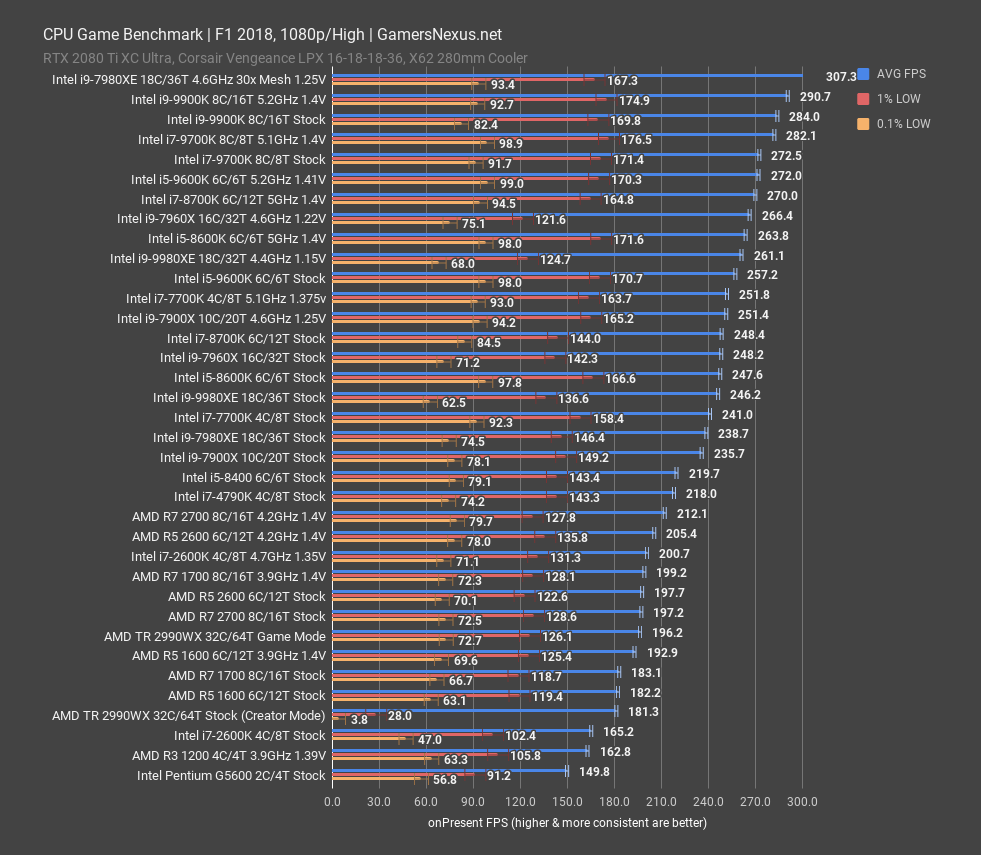
The i7-9700K stock CPU ends up at 273FPS AVG, putting it functionally tied with the 9600K at 5.2GHz, but ahead of the stock 9600K by about 6.2%. The stock 9900K operates less meaningfully ahead of the stock 9700K, with limited gains of about 3.3%. Overclocking the 9700K pushes it to roughly stock 9900K performance levels.
Compared to the 8700K, the stock i7-9700K ends up about 10% ahead in average framerate, although overclocking gets the 8700K to nearing equivalence when at 5.0GHz. For anyone moving off of something like the i7-2600K or 4790K – present in this cart – you’re looking at noteworthy performance improvements. Ryzen remains confined to the lower half of the charts as a result of the lower frequency, and this game does seem primarily bound by Amdahl’s Law.
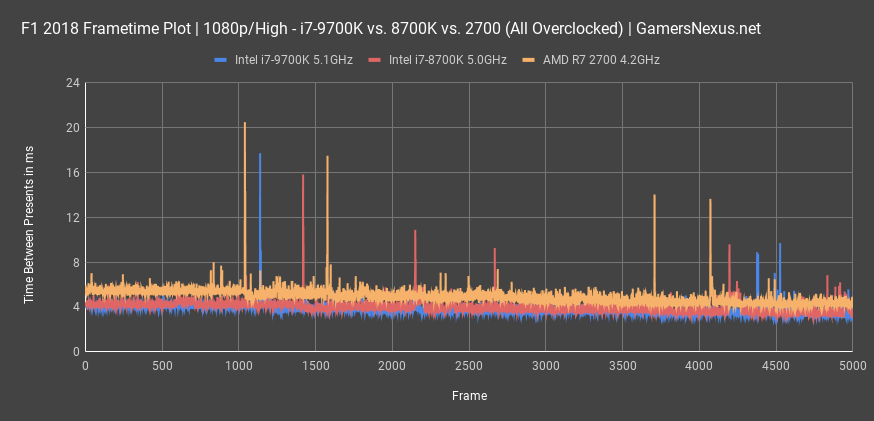
Here’s a frametime chart for F1 2018 at 1080p, showing the 9700K 5.1GHz CPU, 8700K 5.0GHz stock CPU, and R7 2700 at 4.2GHz – functionally a 2700X, or close enough to it. As a reminder, frametime plots show individual frames over time, providing the truest representation of how long it took to render each frame. We’re looking at frame-to-frame interval on the Y-axis, labeled in milliseconds time to render, with frame number on the X-axis. Lower is better, but more consistent is better than strictly lower. The 9700K manages to be both lowest and most consistent, making it the most fluid courier of frames in this test. Average frame-to-frame interval is about 4ms for the 9700K, with the 8700K at about 4.2ms. The 2700 at 4.2GHz competes reasonably and averages about 5.3-5.7ms frametimes. All three tests encounter spikes upwards of 16-20ms, but none that are jarring to a point of ruining the experience. They are noticeable, though, and most humans tend to notice about an 8-12ms delta frame-to-frame.
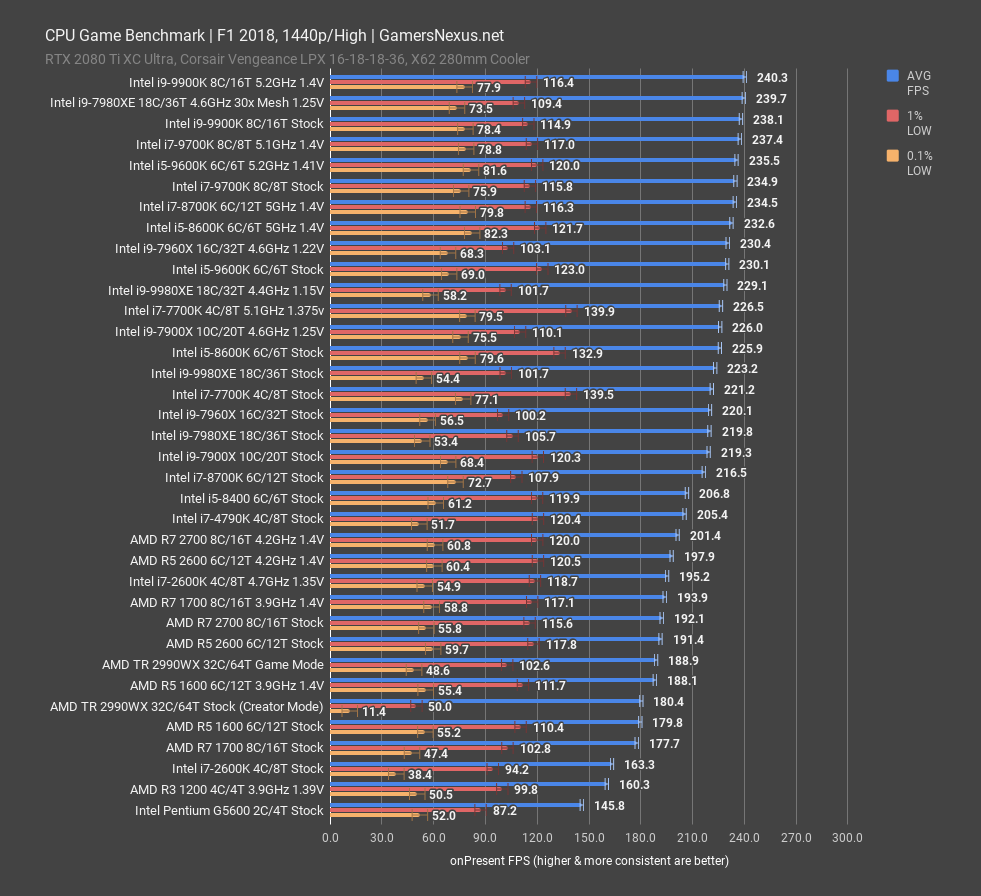
As for 1440p results, the top-end results are truncated by the GPU limitations imposed by a higher resolution, maxing-out the ceiling at 240FPS AVG. The 9700K ends up ranked alongside the 9900K and 7980XE. That’s because we’re now hitting a bottleneck with the RTX 2080 Ti, resultant of the resolution increase to 1440p. If you’re playing at high resolutions and commonly GPU-bound, this chart illustrates the performance fall-off from becoming limited by another component. Lower-end devices end up performing about the same, as they’re slower than the GPU and so not limited.
Intel i7-9700K vs. 9900K, 8700K, 2700 – Assassin’s Creed Benchmark
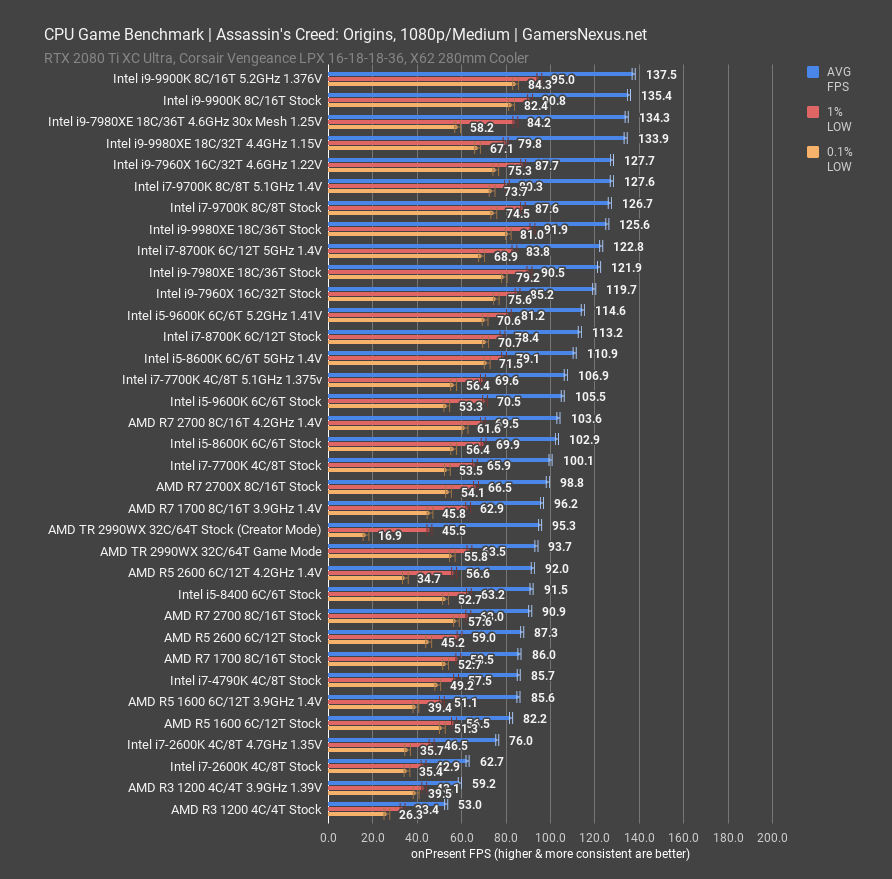
Assassin’s Creed: Origins at 1080p/Medium stands as our next benchmark. Assassin’s Creed uniquely makes use of both additional threads and additional frequency, whereas most games lean entirely on frequency. This is made obvious by our 7980XE at 4.6GHz outperforming CPUs like the 9700K at 5.1GHz.
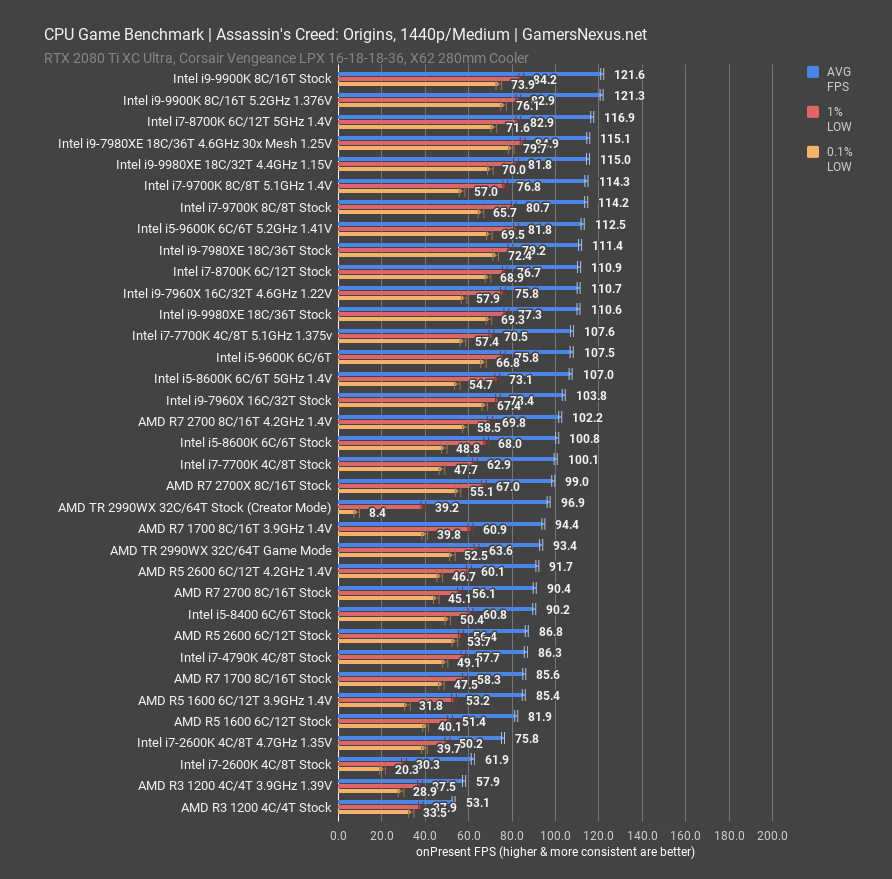
The 9700K stock CPU ends up at 127FPS AVG, marginally better than the 8700K at 5GHz. There is about a 12% uplift over the stock 8700K, a noteworthy gain, and this comes down to stock frequency increases in the 9700K. For reference, the Intel i7-2600K at 4.7GHz does about 76FPS AVG, and the AMD R7 2700 at 4.2GHz does about 104FPS AVG, right around where the 7700K is.
Intel i7-9700K vs. 8700K Hyperthreading – Far Cry 5
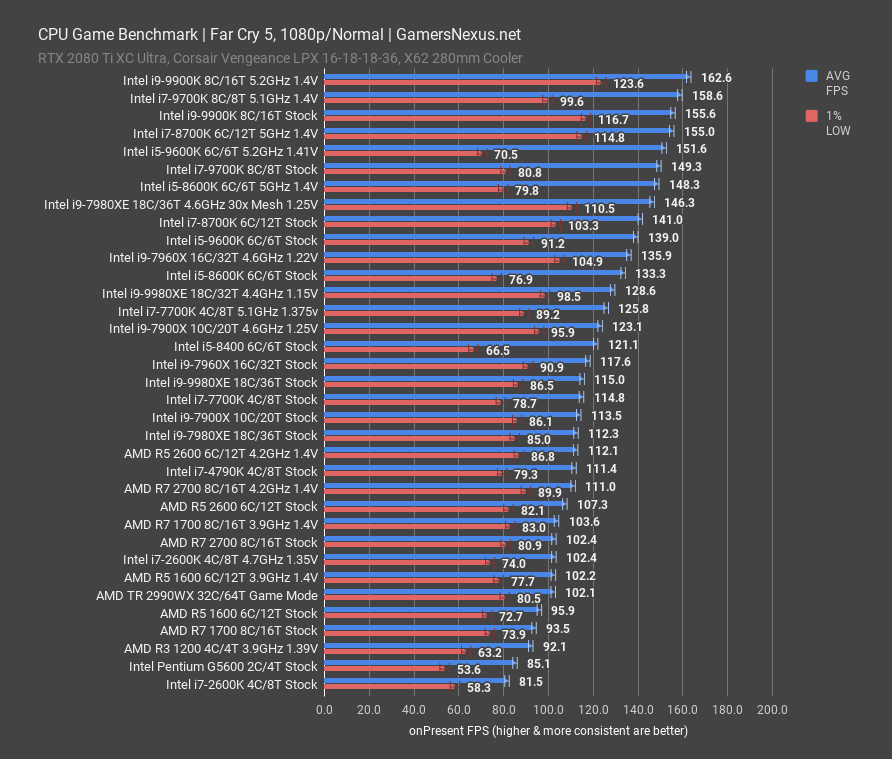
Far Cry 5 positions the i7-9700K at 149FPS AVG, right behind the 9600K at 5.2GHz. Note that Far Cry has also had routine issues with frametimes in i5 CPUs, something we are actively researching now that we have our 9700K in-hand. That said, what we can learn is that the game benefits from higher frequencies in a direct fashion, it’s just that it also benefits from having 8 threads. The 9700K ends up running at 159FPS AVG when clocked to 5.1GHz, putting it between the two 9900K SKUs on our chart. The 8700K stock CPU ends up at 141FPS AVG, which plants it below the 9700K, but not by a meaningful amount. No one can reasonably detect the average frametime difference of 0.4ms between these two and consistency is the same for each. The 2700 at 4.2GHz ends up at around 111FPS AVG, which is within error margins of the 2600 at the same frequency. These two AMD results illustrate a frequency and IPC limitation, not a thread limitation.
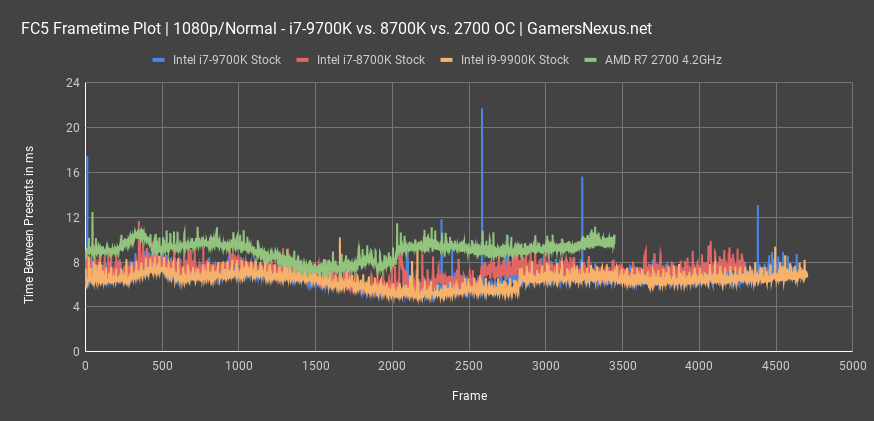
Plotted instead as frametimes, we can look at 9700K, 8700K, and 9900K stock performance. The 9700K ends up fairly consistent, with a few spikes to 20ms and 16ms throughout testing. It’s not bad overall, and we’d have to run a lot more passes to determine whether these are within error. The 8700K stock CPU ends up similar to the 9700K in average frametime, but ultimately falls behind in total frame throughput. The 8700K runs slower on average, if comparable, with the 9900K significantly more consistent, almost to a point of creating a heart rate plot.
We’ve also plotted the 2700 at 4.2GHz for reference, giving a test comparable to the 2700X. The 2700 at 4.2GHz falls behind in both frametime and total frame throughput. It’s still over 60FPS, which would be around the 16.667ms line on the Y-axis, and it is overall consistent in frame delivery, much like the 9900K and 8700K.
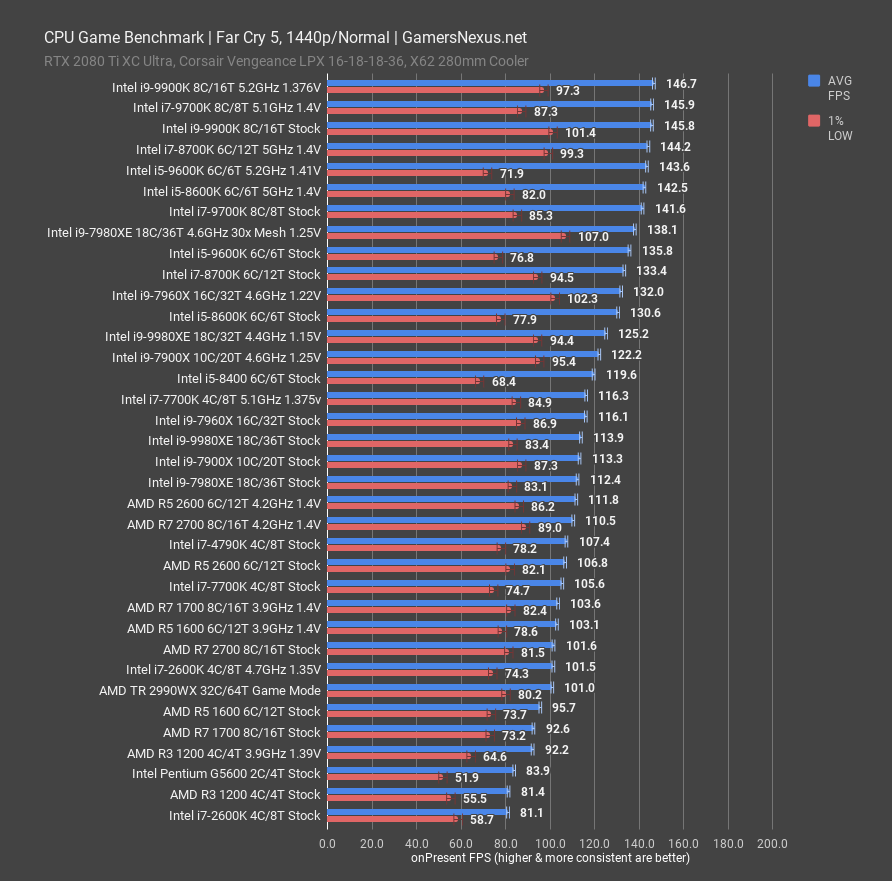
Unsurprisingly, we see mostly the same ranking order at 1440p. We’re truncated at the top-end by the GPU, which puts a cap on maximum performance. In this instance, the 8700K, 9700K, and 9900K are all rough equals. The 2700 still ends up at around 111FPS AVG when overclocked.
Intel i7-9700K Civilization VI Turn Time Benchmark
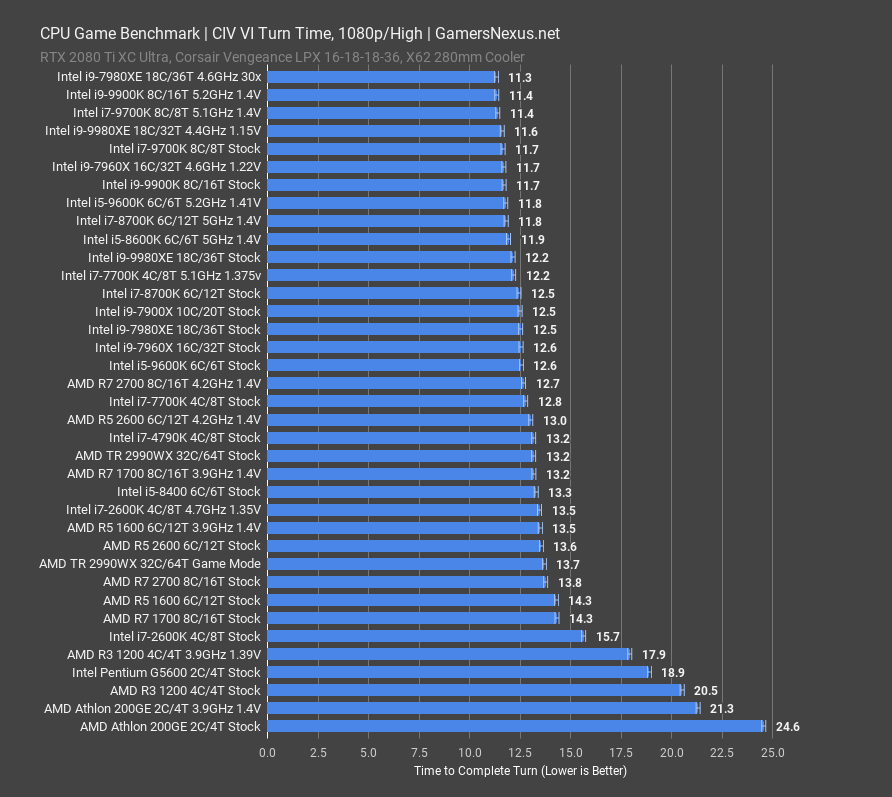
Civilization VI provides an important look at turn time performance rather than framerate performance, instead testing grand campaign AI turn completion times. As an example, with 5 AI players that each take 10 seconds to process a turn, you would be waiting 50 seconds before you are allowed to make your next play.
For our chart, the 9700K at 5.1GHz ends up within margin of error of the 9900K at 5.2GHz. We were unable to produce meaningfully different results between these two, and test variance puts them as functionally equivalent. That’s good for the 9700K, although Civilization VI has never been particularly thread-intensive. This is best illustrated by looking at the stock R5 2600 versus the stock R7 2700, where you see the 2600 outperforming the 2700 by a slim margin. That’s to do with higher stock frequencies, which Civilization VI values as more important than additional threads.
The stock 9700K ends up at 11.7 seconds per turn, with the stock 9900K again tied with the 9700K. The 8700K at 5GHz ends up at 11.8 seconds, also functionally the same, although the stock 8700K ends up outside of error at 12.5 seconds per turn.
Intel i7-9700K Blender Benchmarks vs. 8700K, 9900K
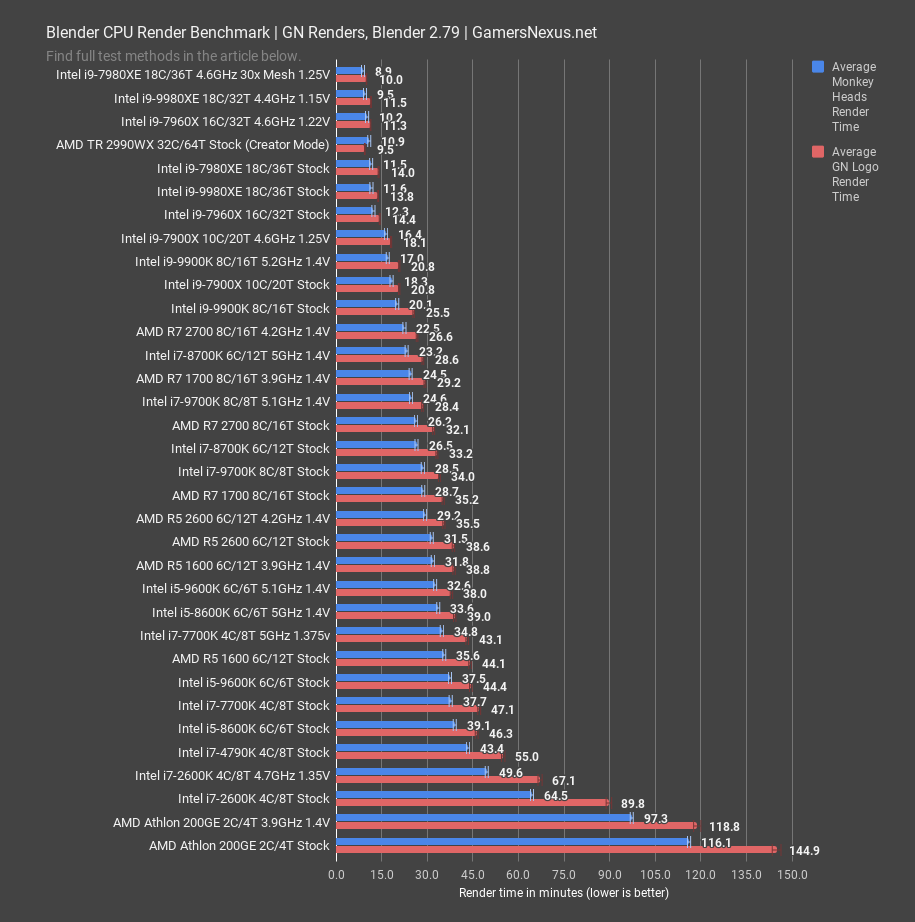
Blender gives us a look at rendering performance for a tile-based production 3D rendering workload. This is very different from how something like Premiere would handle encoding, so we’d advise not trying to extrapolate this performance to video applications.
For Blender, the 9700K at 5.1GHz ends up completing the GN Monkey Head render in 25 minutes, or the GN Logo render in 28 minutes. This places it around where the stock 2700 is, but with significantly higher power consumption at 16.5A, or about 198W. Overclocking the 2700 to 4.2GHz, similar to where a 2700X would land, puts it at 23 minutes for the Monkey Heads and 27 minutes for the logo. This is where Ryzen starts to pull ahead, and is also where the 9900K shows its performance advantage over the 9700K. The same is true for the 8700K, which leverages its extra threads on the 6C/12T approach to lead the 9700K in each test, stock and overclocked.
Intel i7-9700K Thermal Benchmarks
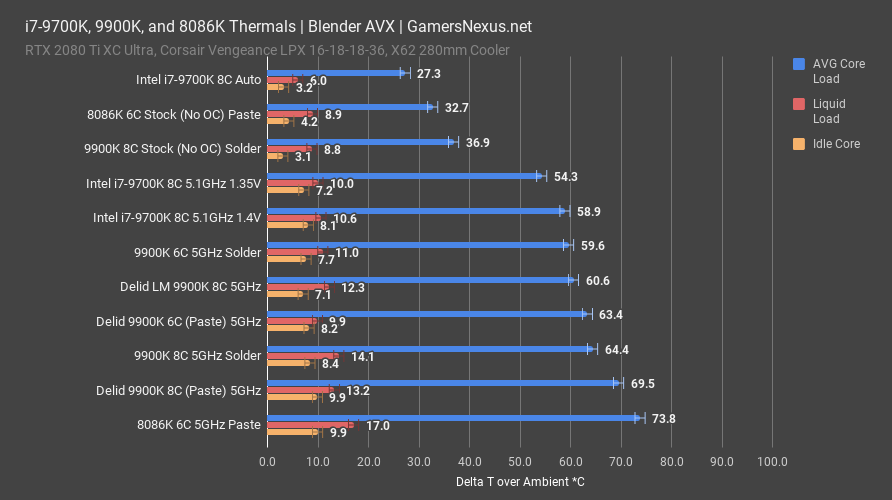
Thermals on the Intel i7-9700K are on the screen now. For auto settings, keep in mind that we heavily rely upon the motherboard used as the temperature is most directly impacted by auto voltages. For the ASUS Maximus XI, those auto settings put the 9700K at 27 degrees Celsius over ambient when loaded to 100% with a Blender workload. Keep in mind that this is with MCE disabled, so it’s following the boost duration specification and sticking to a power consumption of 90W. Liquid temperature is at around 6 degrees over ambient during this test pass.
Going to about 5GHz and 1.35V, the 9700K measures an average all-core load of 54 degrees over ambient, with power consumption at 188W and liquid thermals at about 10 degrees over ambient. This places the 9700K as noticeably cooler than our 9900K sample when soldered, which measured at 64 degrees over ambient. This thermal delta isn’t for any other reason than the 9900K drawing significantly more power in this test. The two results are not directly comparable, other than to say that the 9700K’s lack of hyperthreading does make it easier to keep cool under heavier overclocks by drawing less power. This isn’t a like-for-like comparison though, given that power draw is different for each test. The 8086K is also not directly comparable in that its die is a different size, and so its dissipative properties are different than the 9700K and 9900K. That said, it is still accurate just with regard to comparing how your temperatures might vary from product-to-product for purposes of cooler selection or upgrades.
Thermally, the 9700K isn’t that hard to cool under auto conditions, and can be kept reasonably cool with our X62 280mm cooler under overclocked conditions. It does become a challenge to overclock beyond 5.1GHz and 1.35V with this cooler, as we’re entering the 90s for some individual core temperatures. Those hottest cores will restrict the rest of the cores.
Conclusion
The Intel i7-9700K received ample criticism at unveil for being the first “gaming,” S-class i7 in recent history to drop hyperthreading. The move was accompanied by an increase in physical core count to 8C, but followed the previous move from 4C/8T to 6C/12T, and thus felt like an odd middle-step that had forgotten the lessons learned by the 8700K. The decision left enthusiasts feeling ripped-off; rather than a clear improvement in the product category, Intel had made a sort of lateral step.
Now that we’ve tested it, we can see that benchmarking positions the 9700K oft superior in gaming tasks, largely a result of frequency, to the preceding 8700K. This doesn’t remain true in every case, like in Blender workloads where the additional threads of the 8700K prove advantageous. The price increase of the 9700K over the 8700K also feels off-putting, and so the gains the 9700K makes in gaming are lost when considering the price increase. At the same price, it’d be more tenable, but an increase to $400 to $430 is unpalatable in the face of Intel’s similarly performing i7-8700K at cheaper prices.
The move did not feel productive for Intel. The 9700K is fine. It’s not a bad product, it does well in testing (overall), and it both wins and loses some tests, as any product would do. The oddity is just that it’s losing tests against its predecessor, even when those are simple tests of value, not necessarily performance. This was true for the likes of the RTX 2080 as well, for instance, where performance was fine, but value was a clear regression from the previous generation. We feel similarly about the 9700K. We need to see price come down to around where the 8700K is – around $350 – to really feel comfortable with the 9700K. Even then, it feels like an odd, lateral move from the 8700K before it.
Editorial, Test Lead: Steve Burke
Testing: Patrick Lathan
Video: Keegan Gallick, Andrew Coleman