The XFX RX 590 Fatboy is a card we tore-down a few months ago, whereupon we complained about its thermal solution and noted inefficiencies in the design. These proved deficient in today’s testing, as expected, but the silicon itself – AMD’s GPU – remained a bit of a variable for us. The RX 590 GPU, ignoring XFX and its component of the review (momentarily), is potentially a stronger argument between the GTX 1060 and GTX 1070. It’s a pre-pre-overclocked RX 480 – or a pre-overclocked RX 580 – and, to AMD’s credit, it has pushed this silicon about as far is it can go.
Today, we’re benchmarking the RX 590 (the “Fatboy” model, specifically) against the GTX 1060, RX 580 overclocked, GTX 1070, and more.
Test Methodology
Testing methodology has completely changed from our last GPU reviews, which were probably for the GTX 1070 Ti series cards. Most notably, we have overhauled the host test bench and had updated with new games. Our games selection is a careful one: Time is finite, and having analyzed our previous testing methodologies, we identified shortcomings where we were ultimately wasting time by testing too many games that didn’t provide meaningfully different data from our other tested titles. In order to better optimize our time available and test “smarter” (rather than “more,” which was one of our previous goals), we have selected games based upon the following criteria:
- Game Engine: Most games run on the same group of popular engines. By choosing one game from each major engine (e.g. Unreal Engine), we can ensure that we are representing a wide sweep of games that just use the built-in engine-level optimizations
- API: We have chosen a select group of DirectX 11 and DirectX 12 API integrations, as these are the most prevalent at this time. We will include more Vulkan API testing as more games ship with Vulkan
- Popularity: Is it something people actually play?
- Longevity: Regardless of popularity, how long can we reasonably expect that a game will go without updates? Updating games can hurt comparative data from past tests, which impacts our ability to cross-compare new data and old, as old data may no longer be comparable post-patch
Game graphics settings are defined in their respective charts.
We are also testing most games at all three popular resolutions – at least, we are for the high-end. This includes 4K, 1440p, and 1080p, which allows us to determine GPU scalability across multiple monitor types. More importantly, this allows us to start pinpointing the reason for performance uplift, rather than just saying there is performance uplift. If we know that performance boosts harder at 4K than 1080p, we might be able to call this indicative of a ROPs advantage, for instance. Understanding why performance behaves the way it does is critical for future expansion of our own knowledge, and thus prepares our content for smarter analysis in the future.
For the test bench proper, we are now using the following components:
GPU Test Bench (Sponsored by Corsair)
Component | Courtesy of | |
CPU | GamersNexus | |
GPU | This is what we’re testing! | Often the company that makes the card, but sometimes us (see article) |
Motherboard | ASUS | |
RAM | Corsair | |
PSU | Corsair | |
Cooler | NZXT | |
SSD | Plextor 256-M7VC | GamersNexus |
AMD RX 590 vs. GTX 1060, 1070 Benchmark
Sniper Elite 4 gives us a look at a well-implemented DirectX 12 title with close-to-hardware programming, including asynchronous compute support. We’ll start with our 4K results, as those are more complete and give a good picture of scalability versus other hardware. Remember, the idea is that we can see how the RX 590 compares relative to other devices, not necessarily to see absolute performance. We’ll look at other results with lower resolutions for that angle.

At 4K, using Sniper as a sort of synthetic test for low-level APIs, we see the XFX RX 590 Fatboy runs at 43FPS AVG when stock, or about 46FPS AVG when overclocked. Lows for both results are good, with 1% at 41FPS for the OC and 37FPS for the stock result. This is indicative of fluid frametimes, something we’ll look at in our frametime plot next. The framerate isn’t where we want it, but again, that’s all relative to graphics settings. What’s important is that frametime consistency is there. Absolute numbers will rise with lower settings momentarily. As for the RX 580 – the real one, the MSI RX 580 Gaming X, not the RX 580 2048 SKU that AMD created – we end up at 39FPS AVG for the 8GB Gaming X, which is the same as an overclocked RX 570, i.e. the DATALAND RX 580. Overclocking the RX 580 to 1455MHz gets it to 41FPS AVG, roughly tied with the stock RX 590. That’s because an RX 590 is an RX 580 but pre-overclocked, so this all makes sense.
Comparatively, the GTX 1070 SC ends up at 48FPS AVG, with the GTX 1060 6GB Gaming X at 37FPS AVG. Just to be clear, that’s the GTX 1060 6GB – not to be confused with the GTX 1060 3GB with one fewer SM, nor the GTX 1060 5GB, and most certainly not the GTX 1060 6GB with 9Gbps memory, and most definitely, absolutely not the GTX 1060 6GB GDDR5X card. Just the GTX 1060 6GB. NVIDIA has ensured that all future mentions of the GTX 1060 must be accompanied by this statement of clarification.
The point is, the GTX 1060 is beaten by the RX 590, which is functionally an overclocked RX 580, which was an overclocked RX 480. The 1060 with an OC ends up at 40FPS AVG, within striking range of the RX 590, but still outperformed by 7.8%. The GTX 1070 outperforms the stock RX 590 by about 12%, with the 1070 Ti at 57FPS AVG, or leading by 32% when comparing only stock-to-stock. The frametime delta is about 17.67ms versus 23ms on the RX 590, or 5.6ms.
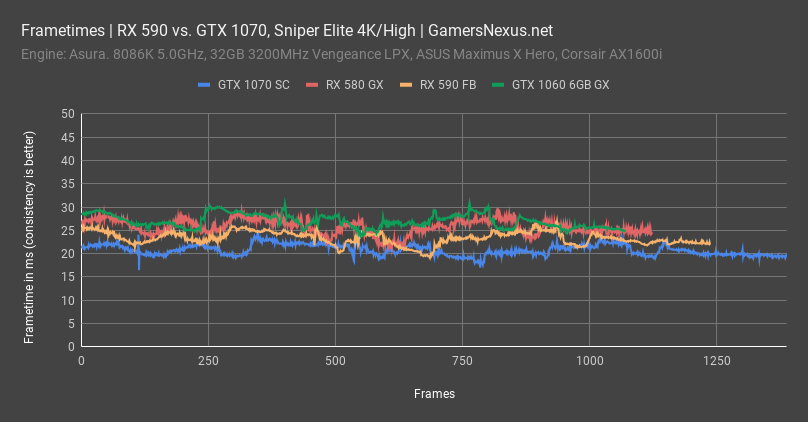
Frametimes from the previous chart look like this. The GTX 1070 drew the most frames, of course, and also managed to keep consistently tight frametimes with a frame-to-frame interval variance of +/- 1ms. This is incredibly good performance and is commendable of the card. Remember, frametimes are all about consistency of delivery. Being lower on the chart is better, but being consistent is best. The 1070 is both, but is also more expensive.
Drawing the RX 580 next, we see the frametime plot trends higher, closer to 25-30ms rather than the 18-24ms of the GTX 1070. Frame-to-frame consistency is still good, with frame-to-frame deviation of +/-2ms. This is good performance and completely reasonable. The RX 590 Fatboy is next, plotting with a line that is competitive to the GTX 1070 in frametime consistency. Its framerate is lower and the count of frames rendered is reduced, as we saw in the previous chart, but consistency is reliable. This is good, because framerate can be resolved with reduced graphics settings, but frametime consistency is difficult to fix. The 590 does well, as do the other cards.
Finally, plotting the GTX 1060 6GB for perspective, we see similarly commendable frametime consistency, but overall reduced framerate. The higher placement on the Y-axis means that the GTX 1060 runs slower in frame throughput than the other cards on this chart, despite competitive consistency of those fewer frames. The RX 590 ends up between the GTX 1060 6GB and GTX 1070 cards in both framerate and frametime performance.
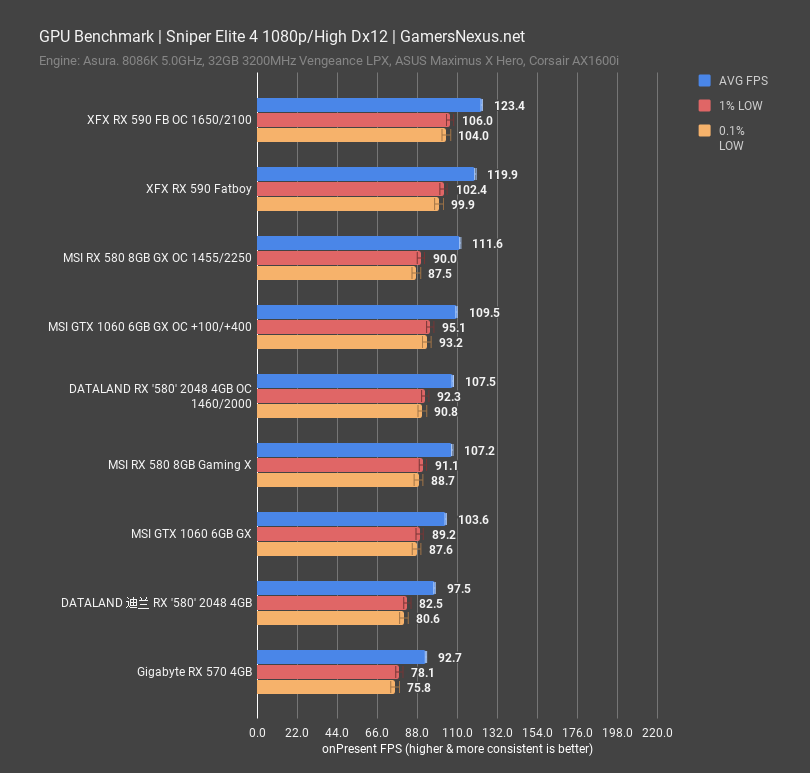
Enough 4K numbers, let’s look at a truncated chart with just 1080p. We haven’t done as many low-end card tests in Sniper, so this chart is more limited in quantity of cards. Of these cards, the RX 590 leads the GTX 1060 and somewhat meaningfully outperforms the RX 580. The RX 570 matches the RX 580 when overclocked, which is, as a reminder, what the DATALAND RX 580 represents. The scare quotes around “580” are because it’s a 570, a SKU AMD made recently. The distribution doesn’t have too much spread against these devices, but the RX 590 is in a better position than the other cards on the chart. As before, the 1070 would outperform the 590, but the 590 outperforms the 1060.
F1 2018 – RX 590 Benchmark vs. GTX 1070, 1060
For F1 2018, we look at the counterpart to Sniper Elite 4 by benchmarking with a prime example of a well-built DirectX 11 game. There are more API abstraction layers than with DirectX 12, but this particular game handles them well.
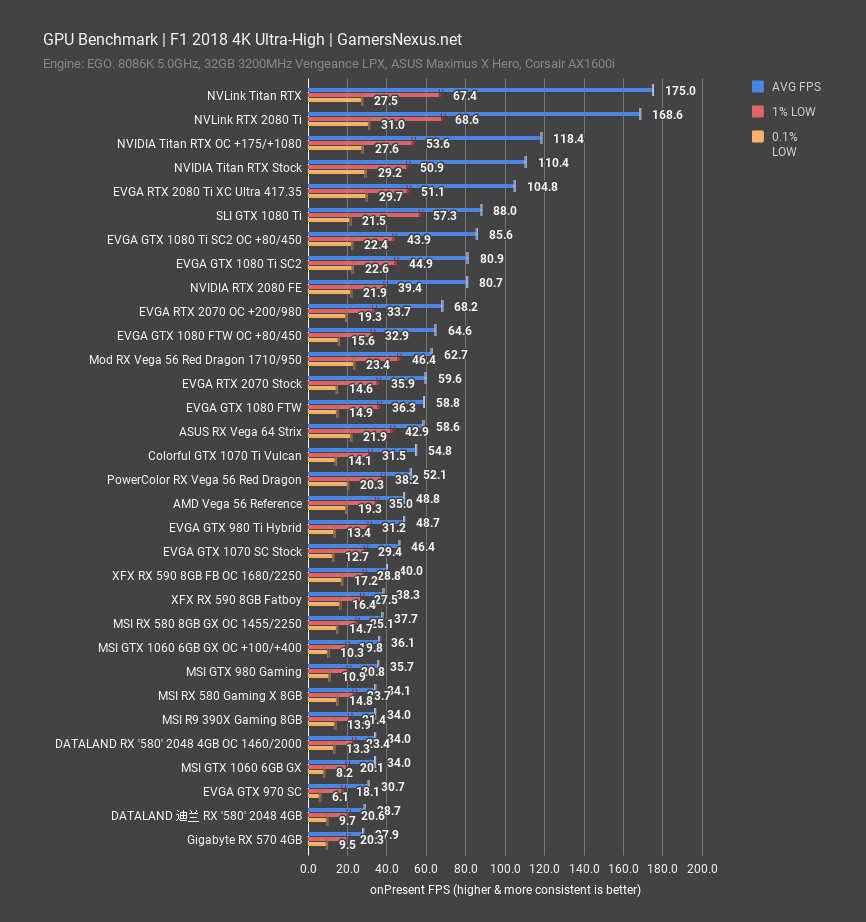
At 4K, the RX 590 ends up at 38FPS AVG stock, roughly tied with the overclocked variant’s 40FPS flat. The GTX 1070 ends up at 46FPS AVG, and the RX 580 8GB Gaming X runs 35.7FPS AVG when stock and 38FPS AVG when overclocked. The overclocked result puts it about on-par with the stock RX 590, although the overclocked 590 pulls marginally ahead once again.
1440p is a more reasonable resolution for the RX 590, so we’ll move to that chart now. 4K isn’t really the forte of the RX 590.
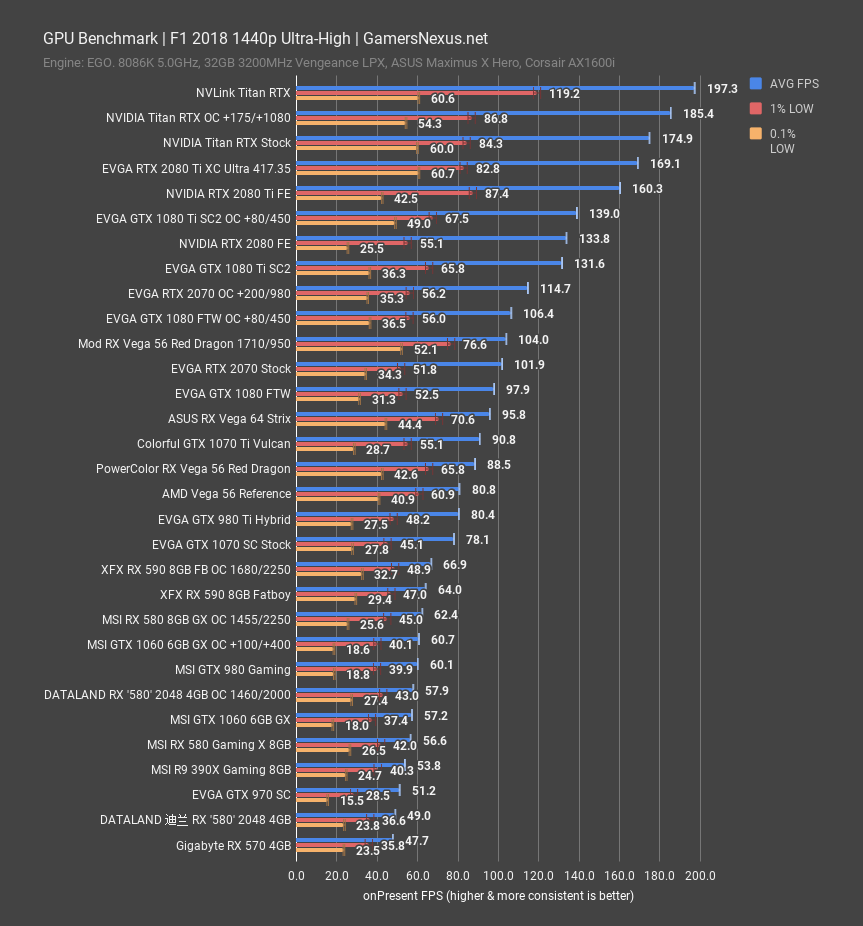
At 1440p in F1 2018, the RX 590 8GB card ends up at 64FPS, with 1% lows averaging to 47FPS. Overclocking didn’t do much for us, gaining an addition 3FPS AVG. The GTX 1070 is a distant next card, ranking at 78FPS AVG and with lows similarly paced as the RX 590. The RX 590 outperforms the GTX 1060 6GB card when stock, running 57FPS AVG, and overclocked, running 61FPS AVG with the +100 core offset. For reference, the 1060 6GB cards cost about $200 to $250, depending on model and current sales. The RX 590 runs about $260 to $280, depending on model. We’ll talk value more later. It’s fully capable of 1440p, though, and ranks between the 1070 and 1060 6GB.
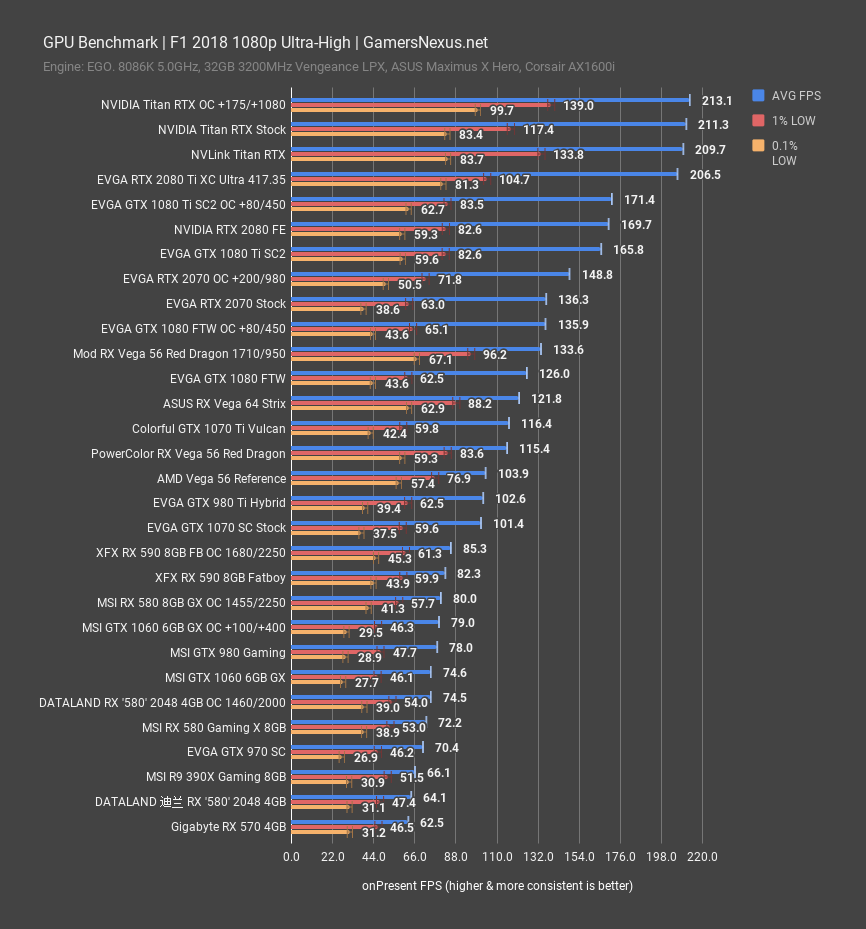
At 1080p, the RX 590 ends up pushing 82FPS AVG when stock, or 85FPS overclocked. Once again, overclocking is hardly useful for this GPU. The 590 performs the same as the RX 580 Gaming X when overclocked to 1455MHz, with both cards at 80FPS AVG. The 1060 overclocked is around the same performance, although gains against a baseline 1060 are noteworthy. The 1070 maintains a significant advantage over the RX 590 in these charts, plotting at 101FPS AVG for the stock version.
Far Cry 5 – RX 590 Benchmark vs. GTX 1070, GTX 1060, Vega 56
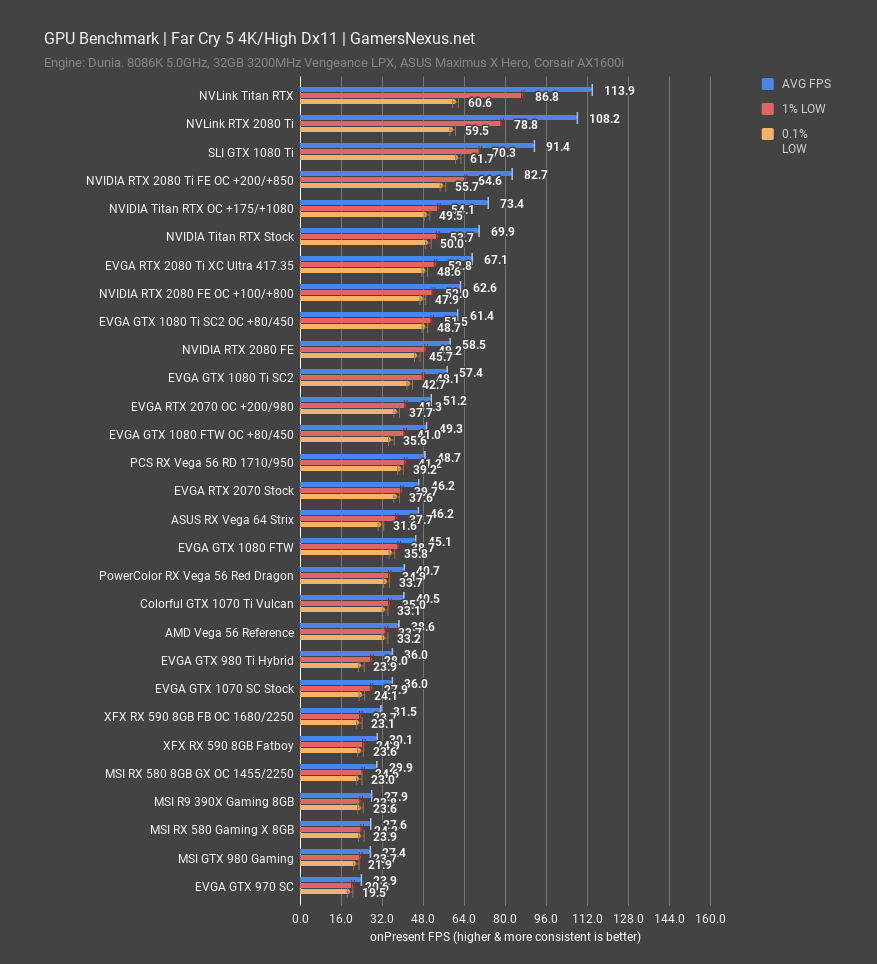
Far Cry 5 gives us a look at Ubisoft’s Dunia engine, pulling a title with more geometric complexity and screen-space reflections than some of the other testing we’ve gone through so far. For this one, the RX 590 Fatboy ends up at 30FPS AVG, with an overclock pitifully pushing it to 31.5FPS AVG, so no gain. The GTX 1070 runs at 36FPS AVG, while the overclocked MSI RX 580 Gaming X at 1455MHz runs the same framerate as the RX 590 since, you know, it’s an overclocked RX 580. None of these are particularly playable, so let’s move on to 1440p.
At 1440p, things become more reasonably playable. The RX 590 stock GPU operates an average framerate of 55FPS, which is ahead of an overclocked GTX 1060 6GB card by about 3.9%. We’re outside of standard deviation test-to-test, but not by much. This difference is imperceptible. For a fairer comparison of stock-to-stock, the GTX 1060 6GB without an OC ends up at 50FPS AVG, still within reasonable range of the RX 590. The 590 doesn’t hold as strong of an advantage here as it has in some other titles. The GTX 1070 SC’s average framerate of 67FPS posts a lead of 21% over the RX 590 stock GPU, with the RX 580 roughly tied with the GTX 1060. 1% and 0.1% lows are both well-timed across all of these configurations.
The most important thing to learn from our multi-resolution testing is whether performance scales linearly across all resolutions. If it doesn’t, that could be indicative of a pipeline limitation – ROPs, for example, or maybe video memory or texture units. At 1080p in Far Cry 5, the RX 590 maintains similar spacing against the GTX 1060 and the GTX 1060 overclocked card. It’s tied with the overclocked 1060 and leading the stock 1060 by 6.7%. Overclocking the RX 590 gets it to 80FPS AVG, but there’s just no more room left in this card to overclock any meaningful amount. We see gains from overclocking of just 2.4%. Finally, the 1070 maintains a significant lead, posting a 96FPS AVG over the RX 590’s 78FPS AVG. That’s also accompanied by a price increase, of course, and we’ll point-out that Vega 56 does pretty well in this title as well, posting 104FPS AVG with the PowerColor stock model. The Vega 56 cards average about $450 to $470, so buyers of the 590 are likely not willing to stretch this high in price.
Shadow of the Tomb Raider – RX 590 Review
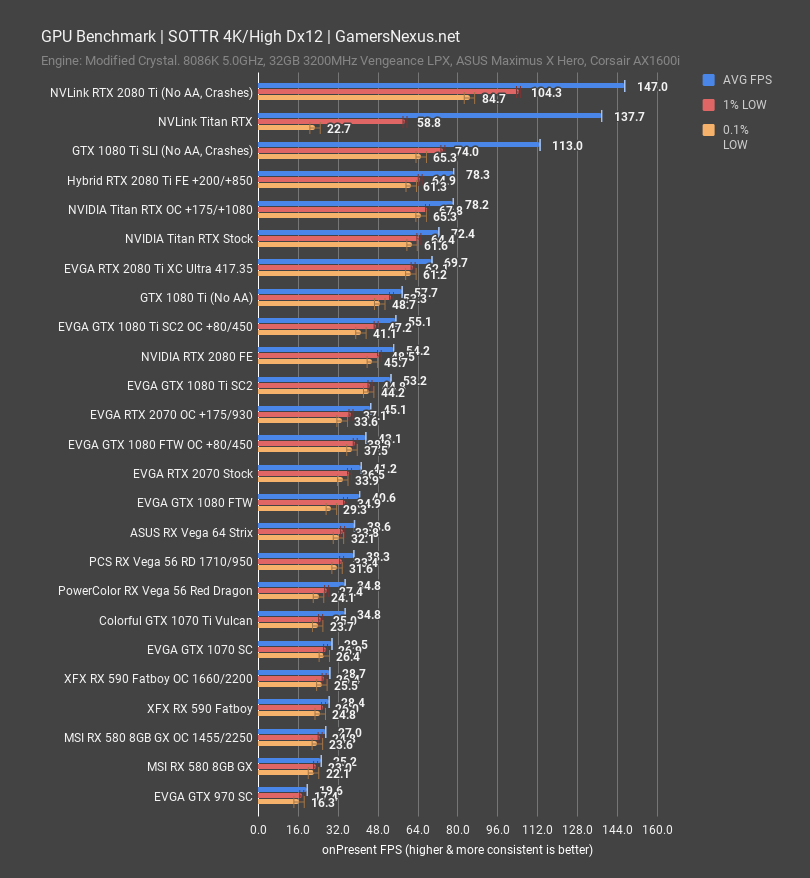
Shadow of the Tomb Raider is still relatively new and is meant to be one of the leading RTX titles, although our benchmarking is standardized without any RTX features. Shadow of the Tomb Raider is on a modified crystal engine and uses DirectX 12 for its API. One note for this one: We had trouble getting the overclock to stabilize in this game, but eventually got it running at 1650-1660MHz core. 1650 seemed a bit more stable, but produced the same FPS numbers.
4K isn’t very friendly to this class of device when using the settings we were, placing the RX 590 Fatboy at 28FPS AVG, with an overclock doing effectively nothing. The 1070 also struggles, down at 30FPS AVG, with the 1070 Ti at 35FPS. Let’s move on right away. We can’t learn much here.
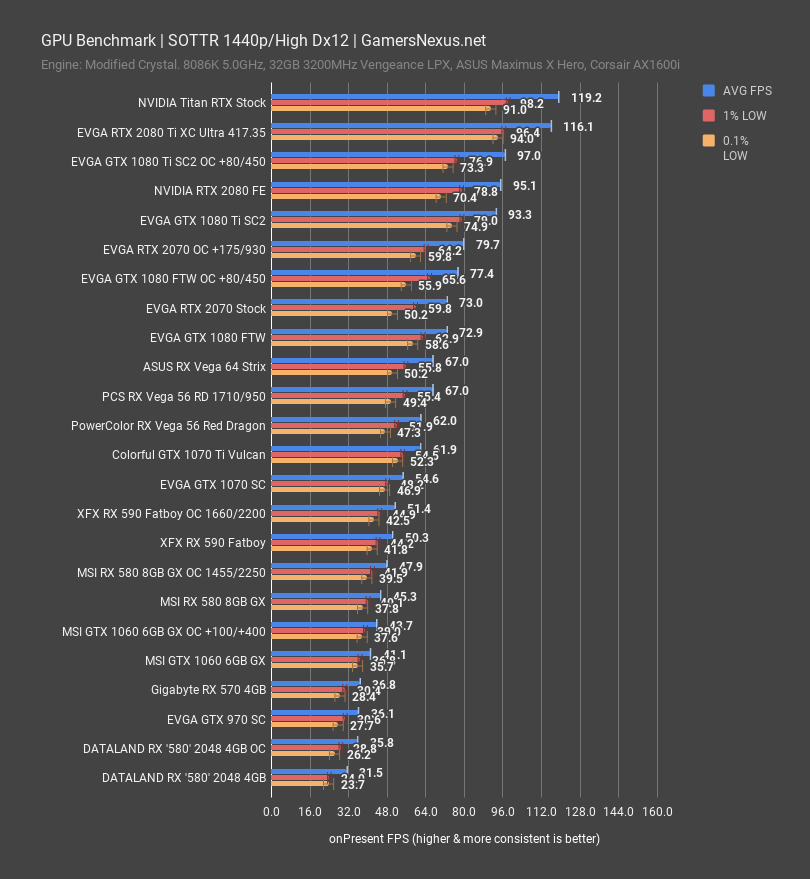
At 1440p, the RX 590 ends up at 50FPS AVG, with the overclock taking us only to 51.4FPS. Not exciting, sadly. The MSI RX 580 Gaming X at 1455MHz hits 48FPS AVG, positioning itself close enough to the 590 that differences are imperceptible. The GTX 1070 holds at 55FPS AVG, marking Shadow of the Tomb Raider as the title where the RX 590 strikes closest to the GTX 1070, to the point that the value for this game best favors the 590. In terms of percentages, the 1070 holds a lead of 8.5% over the 590, which holds a lead of roughly 11% over the stock 580 and overclocked 1060.
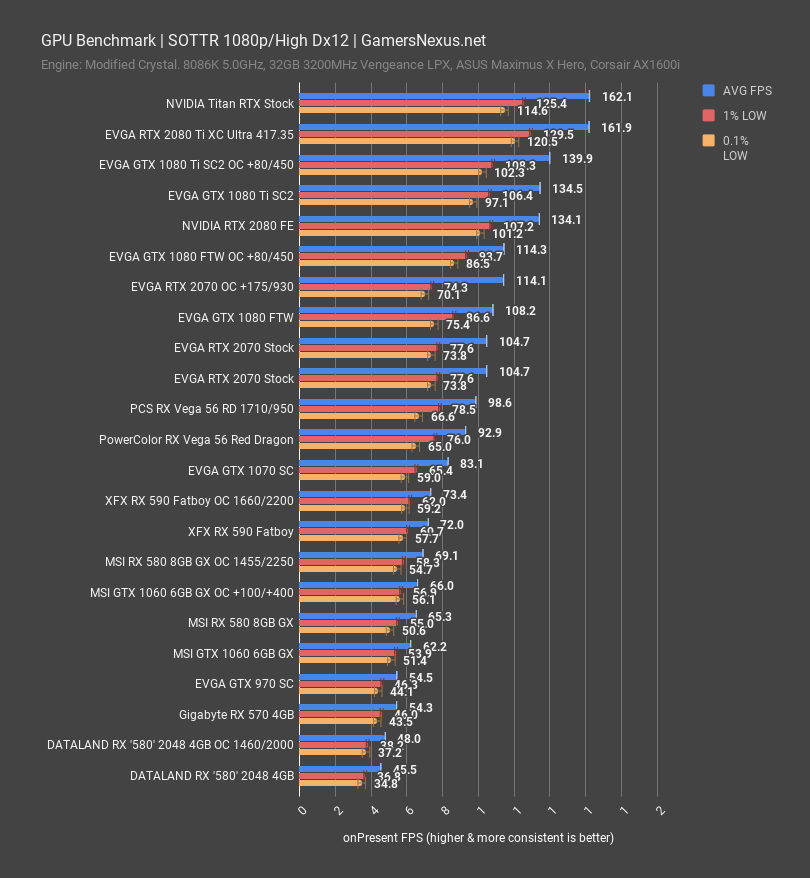
Running 1080p instead, the RX 590 ends up at 72FPS AVG, which is completely playable while using High graphics settings. The overclock is, once again, pitiful, boosting us only 1.9%. That’s disappointing. The RX 580 with an overclock is again close to the RX 590 stock GPU. Not that exciting overall, but still an improvement of sorts.
GTA V – RX 590 vs. GTX 1060, RX 580
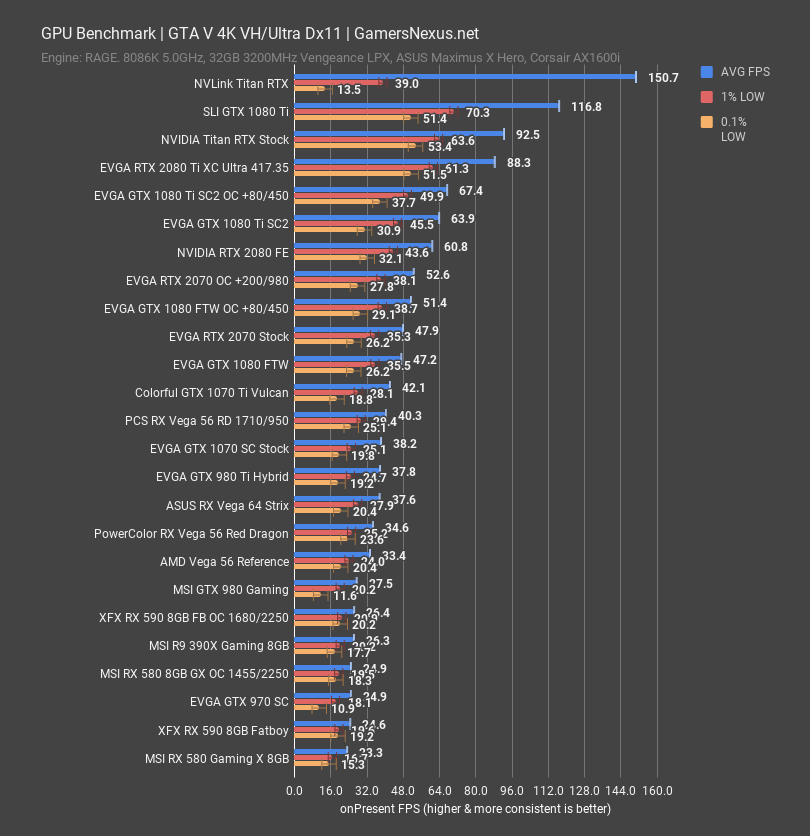
GTA V is last, using the RAGE engine, which is redundant, by Rockstar Games. This benchmark is intensive on draw distance, particularly for geometric detail and shadow detail at long range. 4K is almost entirely unplayable with our Very High and Ultra mix of settings on the RX 590, positioning the results at 25FPS AVG for the stock 590 Fatboy, or 23FPS for the 580 Gaming X stock. Let’s skip right over to 1440p.
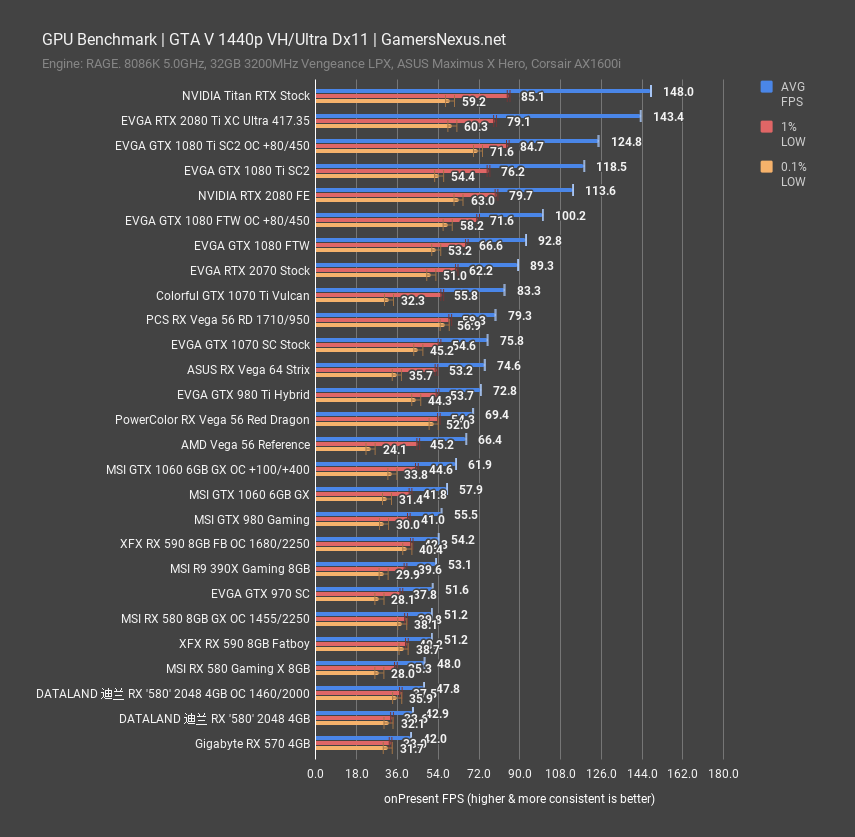
At 1440p, GTA positions the RX 590 Fatboy at 51FPS AVG, tied exactly with the overclocked RX 580 Gaming X and marginally ahead of the stock RX 580. Sort of boring, if we’re being honest, but that’s the nature of a refresh. If you knew where the RX 580 was when stock and overclocked, you could figure out where the RX 590 is. In this game, the GTX 1060 leads in performance over the RX 590. If GTA is the only thing you’re playing, and if you can find a GTX 1060 for about $200 to $220, it’d be a better buy. Branching-out to other games would change that prioritization, though. These results are consistent with other sites.

1080p for GTA V gives us our last game test. The RX 590 and GTX 1060 maintain the same spacing as before, with the GTX 1060 6GB card leading the RX 590 by large margins, marking 83FPS stock versus 76FPS AVG stock. The 1070 pulls even further ahead, landing at 106FPS AVG, and the overclocked MSI RX 580 is about the same as the 390X and RX 590 when the 580.
Power Consumption – RX 590
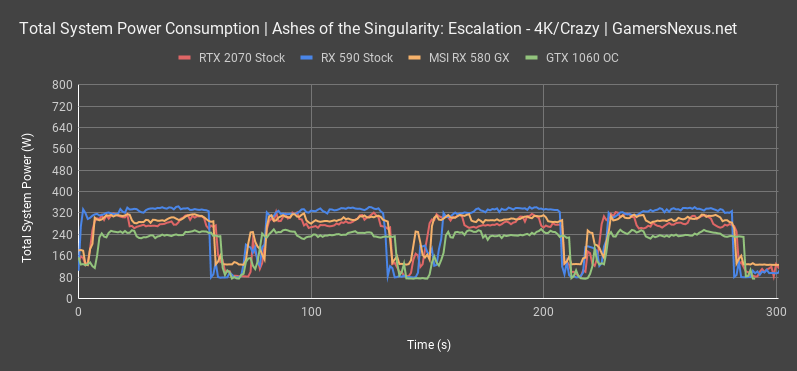
For this, we do logged total system power consumption, so this is not for the individual card, but for the entire system. All system components are heavily controlled, with voltages, even minor voltage rails, also all heavily controlled to ensure data accuracy. The RX 590 stock GPU total system power consumption averages about 320W, with the MSI RX 580 Gaming X system averaging 20-30W lower on average. The GTX 1060 6GB total system power averages 240W when the 1060 is overclocked to +100MHz core offset, as shown in previous charts. The 590 is still a heavy drinker of power, as the previous RX cards have been.
Thermals – XFX RX 590 Fatboy Review
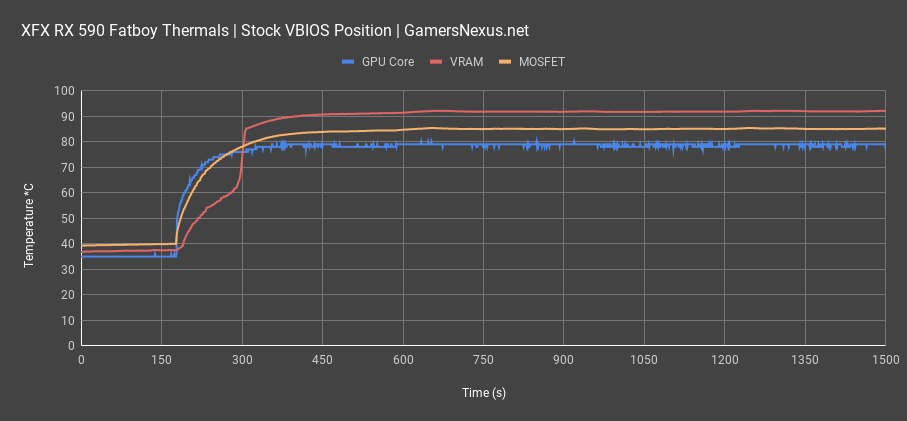
For thermals, we first tested the card with the stock VBIOS configuration, which is with the switch set toward the PCIe connectors. XFX says this is the faster fan speed VBIOS, but that was clearly inaccurate: The GPU core hits about 79-80 degrees Celsius at steady state, which is the temperature target for this VBIOS. This is the stock setting. Under these settings, the VRAM module we measured climbs to a high 91.8 degrees Celsius. This is nearing the specification limit of GDDR5 and, once accounting for measurement error and the fact that we’re looking at tCase and not tJunction, might even be at the spec limit. It’s close enough to be disquieting. The MOSFET we measured is at 85 degrees. This is hot and uncompetitive but is technically well within operating temperature specs for the MOSFETs. Most FETs can take 125 to 150 degrees, so we’re not in any danger, here, it’s just not competitive with other coolers and is indicative of inefficient design and use of an otherwise large cooler.
Fan speed for this VBIOS hits around 1500RPM to maintain 80 degrees on the GPU, but the trouble is that the neighboring components run hot.
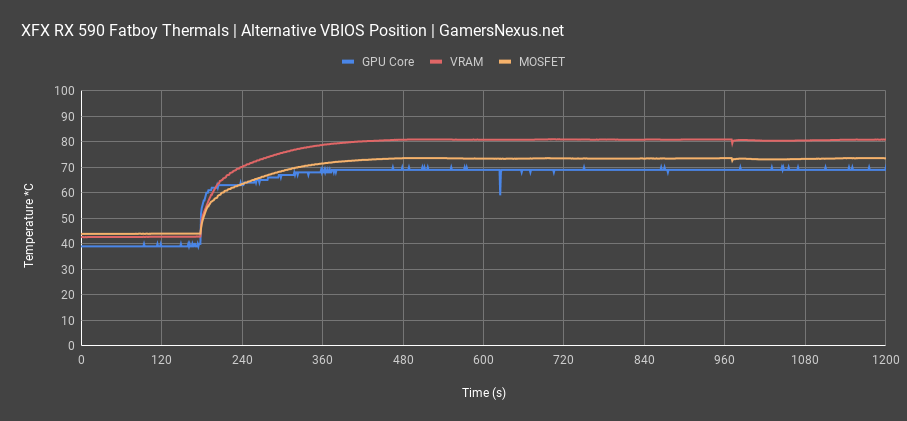
With the left VBIOS switch engaged, not the stock position, the GPU core runs 69-70 degrees Celsius, with the VRAM now at 81 degrees – definitely more acceptable – and the MOSFET at 74 degrees. Considering fan speed is now 2000RPM, this remains uncompetitive, but is more acceptable than the stock measurements. You’ll want to switch into this mode for normal use, especially if in a hotter case that might push ambient higher than the 22C +/-1 environment that we tested in.
Conclusion
There’s a lot of choice on the market for GPUs right now, so it’s not as simple as “buy X with $Y and buy Z with $A.” We’ll try our best.
Let’s start with XFX’s part in this review: The cooler isn’t good for its size or its price. XFX runs warm in the stock VBIOS and is overall uncompetitive in noise-to-thermals when considering other cards. VRAM is nearly out of spec with the default VBIOS, so we’d recommend manually setting a fan speed curve if this card must be used. Construction, as we showed in our tear-down of the card, is overall poor.
That was the easy part. AMD’s component, the actual GPU, is more difficult to weigh. We will say that it is unexciting – it’s a re-refresh. It’s a pre-overclocked RX 580, which is a pre-overclocked RX 480. Being unexciting does not make a card a bad buy, though, and the RX 590 makes a lot of sense at the $260 to $270 price-point. It’s out-classing the GTX 1060 6GB in many scenarios, although the GTX 1060 does take the lead in GTA V. Frametime performance is highly competitive on the RX 590, something AMD’s driver team has worked hard toward for a few years now. The frametime consistency is neck-and-neck with NVIDIA and, at a given framerate, the plots look the same. The GTX 1060 6GB has come down to $210 in a lot of cases, in which instance it’s a compelling buy, but it’s (1) not always that low and is often $240, and (2) a slightly different price/performance class.
We’d recommend the following: For a bigger budget, the GTX 1070 or 1070 Ti make sense, but a rumored RTX 2060 may be worth waiting to hear about. For a bigger budget and a personal interest in enthusiast overclocking – meaning you’re more buying the card to tinker than to just game – we’d still give our recommendation to Vega 56 as the most fun to overclock. The RX 590 does not even come close to competing in this category, as its headroom is functionally maxed. For just gaming out of box, it’s fine. It’s not exciting and overclocking an RX 580 equates an RX 590, so we’d probably recommend that route if it’s cheaper.
It’s tough to outright recommend the thing. The RX 590 is fine, it’s just not particularly interesting. We can recommend it with confidence at about $260 when strictly speaking of out-of-box gaming performance. We wouldn’t recommend the XFX Fatboy model, but there are other options.
Editorial, Testing: Steve Burke
Video: Josh Svoboda, Andrew Coleman